Life Cycle Assessment Analysis of Alfalfa and Corn for Biogas Production in a Farm Case Study
by
 ,
,
Fabiola Filippa
1,†, 
Francesco Panara
2,†,
Daniela Leonardi
1,
Livia Arcioni
1 and
Ornella Calderini
3,* 1
TREE SRL, 06129 Perugia, Italy
2
Trisaia Research Center, Italian National Agency for New Technologies Energy and Sustainable Economic Development, (ENEA), 75026 Rotondella, MT, Italy
3
Institute of Biosciences and Bioresources, Consiglio Nazionale delle Ricerche, 06128 Perugia, Italy
*
Author to whom correspondence should be addressed.
†
These authors contributed equally to this work.
Processes 2020, 8(10), 1285; https://doi.org/10.3390/pr8101285
Submission received: 6 August 2020
/
Revised: 24 September 2020
/
Accepted: 10 October 2020
/
Published: 14 October 2020
(This article belongs to the Special Issue Biomass to Renewable Energy Processes)
Abstract
:In the last years the greenhouse effect has been significantly intensified due to human activities, generating large additional amounts of Greenhouse gases (GHG). The fossil fuels are the main causes of that. Consequently, the attention on the composition of the national fuel mix has significantly grown, and the renewables are becoming a more significant component. In this context, biomass is one of the most important sources of renewable energy with a great potential for the production of energy. The study has evaluated, through an LCA (Life Cycle Assessment) study, the attitude of alfalfa (Medicago sativa) as “no food” biomass alternative to maize silage (corn), in the production of biogas from anaerobic digestion. Considering the same functional unit (1 m3 of biogas from anaerobic digestion) and the same time horizon, alfalfa environmental impact was found to be much comparable to that of corn because it has an impact of about 15% higher than corn considering the total score from different categories and an impact of 5% higher of corn considering only greenhouse gases. Therefore, the analysis shows a similar environmental load in the use of alfalfa biomass in energy production compared to maize. Corn in fact, despite a better yield per hectare and yield of biogas, requires a greater amount of energy inputs to produce 1m3 of biogas, while alfalfa, which requires less energy inputs in its life cycle, has a lower performance in terms of yield. The results show the possibility to alternate the two crops for energy production from an environmental perspective.
1. Introduction
The raising concern regarding climate change, pollution and depletion of fossil resources has led to a large interest in the use of renewable energy and consequently research related to biomass crops. The global carbon cycle is massively impacted by humans through the changes in land use and the combustion of fossil fuels. By 2050, increase of the human population to more than 9 billion people and sustained global economic growth will require 50% more fuel and CO2 emissions cuts of 80% to maintain political, social, fuel and climate security [1,2]. The United Nations Conference on Climate Change (Paris 2015) reached an international agreement to keep the rise in global average temperature well below 2 °C and to aim to limit the increase to 1.5 °C [3]. These reductions will have to be made in the face of rising global energy demand [4]. Energy based on renewable materials is considered a possible solution, with the 2020 European Union Climate & Energy Package directives [5] setting the target of achieving a 20% share of energy from renewable resources by 2020, including biogas produced by anaerobic digestion (AD) of agricultural feedstocks [6].
For this reason, the attention on renewables within the national fuel mix has significantly grown (in Italy, there was a steady decline of fossil component, from 93.8% in 1990 to 81.3% in 2013).
Energy from bio-renewables such as biomass crops has become an alternative to fossil fuels with claims of sustainability and capacity of C storage, however debate has arisen concerning issues such as:
- 1
- competition of land use between food and energy destination;
- 2
- sustainability of bioenergy production, in fact agriculture uses greenhouse gas (GHG) -emitting methods, machinery and fertilization etc. in cultivation, harvesting, storage and transport [7].
Agricultural practices are relevant to global GHG budget, as agroecosystems contribute to 14% of global anthropogenic GHG emissions [8], biomass production therefore does not come without a carbon footprint and only forest land accumulates more carbon than it emits. However, bioenergy produced in a proper manner can be used in a relevant quantity, but it has to be derived from feedstock obtained with much lower life-cycle greenhouse-gas emissions than traditional fossil fuels and with little or no competition with food production [9]. Bioenergy chains managed sustainably are suggested as strategies to mitigate GHG in general [10] and particularly in agriculture [11].
To avoid food competition several studies reach the conclusion to grow biomass crops on degraded lands abandoned from agricultural use [12,13,14,15], this will also reduce the long term carbon debt and biodiversity loss due to direct and indirect land clearing. Land that does not store large amount of carbon but still allows a decent yield of biomass is recommended for carbon gain in the bioenergy chain.
In addition, the choice of the plant species is very important. In fact, cropping systems vary according to the plant life cycle, yields, feedstock conversions efficiencies, nutrient demand, soil carbon inputs, nitrogen losses etc. all having influence on the management operations [16]. Non-food plants are obviously preferable, but also perennial plants or double crops (or mixed cropping system) are advisable to reduce clearing of land and carbon loss [12,17,18,19] increasing also biodiversity and several ecosystem services [20,21].
In general, a modern bio-based energy chain is expected to first, access sustainable feedstock, second, reduce the industrial carbon footprint, third, implement economically advantageous processing chains and fourth, start a bio-based innovation cycle [22]. Potentially this holds true for one of the main bioenergy chain: biogas production.
Biogas consists of methane (CH4) and carbon dioxide (CO2) with traces of other impurities, such as hydrogen sulfide (H2S), ammonia (NH3), and water vapor produced by anaerobic digestion which is a dual-purpose technology for treating complex biomass wastes that converts organic matter into biogas. Biogas has been used to produce electricity using combined heat and power (CHP) systems. Purified methane from biogas has also been upgraded to compressed ‘natural’ gas (Bio-CNG) or liquefied ‘natural’ gas (Bio-LNG) for transportation fuels [23,24]. Raw or purified biogas can also be upgraded into liquid fuels via biological or thermochemical conversion methods [23]. The digestate residue contains large amounts of nutrients (e.g., nitrogen and phosphate) and can be used as a fertilizer [25,26].
European production of biogas has expanded rapidly in the last years. More than 16,000 ktoe of oil equivalent were produced by biogas in the EU in 2016, which is approximately 8% of the total primary energy produced by renewable energies in the EU. The average growth rate was a relevant 17% per year in biogas capacity in the EU in the period 2005–2015 which is currently reduced to 1% [27]. Germany is the largest producer of biogas, not only in Europe but also at the global level. In 2016 Germany had 10,971 AD plants with a total installed electrical capacity of 5 GWel [28], which generated 33.7 TWh [29]. Italy holds the second place at 9.3 TWh of electricity produced by 1555 AD plants with a total installed capacity of 1171 MW [30]. The majority of the plants are fed with agriculture feedstock (e.g., dedicated maize) [30]. Financial incentives promoted the rapid expansion of biogas plant installations in Europe, being a feed-in-tariffs (FiT) scheme available in 29 countries [31]. In Italy electricity generators using biogas produced in AD plants smaller than 1 MW were initially paid 280 €/MWh generated, later incentives were reduced and payments for utilization of heat and other coproducts were introduced [30,32].
However biogas can still represent an interesting source of income for farmers and it is worth investigating the potentiality of bioenergy/biogas chains in regions where agricultural properties are fractionated and are mostly located in hilly areas of limited fertility such as in central/southern Italy where farmers are facing more stringent conditions to produce an income [19,33]. In such areas the presence of marginal land is more recurrent and this stimulates the adoption of low-input crops with scarce competition with food sector. Alfalfa is well adapted in central Italy and it requires very modest or limited amount of inputs in terms of fertilization, irrigation, pest control. Most of all due to its ability to fix nitrogen it is less dependent upon nitrogen fertilizer and therefore more economically sustainable and environmentally friendly. Indeed the N cycle has a significant impact on the energy balance and production of greenhouse gases. The fossil fuel energy required to produce N used in bioenergy production can account for a significant portion of the total system energy requirements. Thus, reducing the amount of nitrogen fertilizer can significantly increase the energy balance (net production) of the system. Perennial forage crops such as alfalfa can have lower requirements for N than an annual crop like corn, thereby reducing the fossil fuel energy requirement [34]. Lower N use also reduces the emission of N2O, a potent greenhouse gas [35,36].
Nowadays Life Cycle Assessment (LCA) is the methodology of common use to evaluate products, processes and services from an environmental perspective, the general guiding principles for this analysis can be found in ISO 14040 [37] and ISO 14044 [38]. LCA allows the evaluation of the environmental drawbacks associated with a product by identifying natural resources consumption and emissions to environmental compartments, providing opportunities to attain environmental improvements (analyses on LCA and agriculture can be found in [39] and more recently in [40]).
A number of publications is available concerning LCA studies of agricultural systems in general and also related to different energy crops and energy chains. Interestingly Fusi and colleagues, report a recent survey of 26 LCA studies found in literature (till March 2016) related to biogas with very different goals, life cycle impact assessment (LCIA) methodologies, feedstocks, and geographical regions covered [41].
In the present work we compare two main crops grown in central Italy in traditional agricultural systems, such as maize and alfalfa; maize being also evolved into a major energy crop and alfalfa still being traditionally used as forage. We aim to investigate the possibility to replace, in biogas production, the most common bioenergy crop, corn, with an alternative crop, alfalfa, which requires a lower energy input. Maize (Zea mays) is an annual herbaceous and it is one of the most important cereals worldwide, cultivated in tropical and temperate regions, in the latter case with a spring-summer cycle. In temperate regions maize silage was used as a forage with medium-term storage characteristics, however with the spread of biogas plants, e.g., in Europe, maize silage has also become a major source of energy biomass. The same has happened to maize grains that are currently used both as a feedstuff and as a raw material for bioethanol production (http://www.yara.co.uk/crop-nutrition/crops/maize/key-facts/maize-markets/).
On the contrary alfalfa, Medicago sativa, is still most commonly used as a forage crop, however it is becoming an increasingly studied crop for bioenergy production worldwide [42].
Due to its perennial growth habit it has a significant contribution in protecting water and soil resources, enhancing soil fertility, and sequestering soil carbon. Because of biological nitrogen fixation, alfalfa usually requires no nitrogen fertilizer, and can provide all of the nitrogen required for the following grain crop. The biomass yield is potentially high and the forage can be fractionated into protein-rich leaves and cellulose-rich stems to create two product chains. The stems can be used for production of energy by fermentation to ethanol or gasification to produce electricity [43].
In general, we are seeking to establish a model based on sustainable crops, with lower energy inputs, to create new sources of income supporting local livestock farming realities. The agricultural and livestock sector in Italy, in fact, is the one that collects the most potential for the production of methane. In particular, in the last years, the Italian biogas sector has had a significative exponential growth increasing from 50 plants before 2000 to and 3.3 MW installed to 1555 plants and 1171 MW installed more recently [30].
2. Materials and Methods
The energy performances of maize and alfalfa were compared in terms of biogas production. The impact associated with the use of each crop was evaluated with an LCA study. The study was carried out through the SimaPro (System for Integrated Environmental Assessment of Products) version 8 software (PRé Sustainability, Amersfoort, Netherlands).
2.1. Life Cycle Assessment Methodology
Life Cycle Assessment (LCA) analysis is a method which evaluates the interactions that a product or a service has with the environment, considering its entire life cycle. The guidelines used for the LCA analysis are the ISO 14000 series standards on the environmental management systems. In particular, the main references are the UNI EN ISO 14040:2006 Environmental management—life cycle assessment—principles and framework and the UNI EN ISO 14044:2006 Environmental management—life cycle assessment—requirements and guidelines.
The LCA covers the entire life cycle of the product, considering the extraction and acquisition of raw materials, the manufacturing and production of materials and energy, the end of life treatment and final disposal (http://lcarifiuti.net). The technique uses a relative approach, structured around a functional unit, which defines the object of the study. All data are then related to the functional unit, as well as, all inputs and outputs and, consequently, the environmental impact value [44].
In order to facilitate the identification of the input and output elements of a product system, it is divided into a series of unit processes, connected by flows of intermediate products and/or waste to be treated.
A LCA study is divided into the following main phases [45]:
- -
- Goal and scope definition: the scope, including the system boundaries and the LCA detail level, depends on the subject and the intended use of the study.
- -
- Life Cycle Inventory (LCI): in this phase all inputs and outputs related to the studied system are identified. The LCI is a fundamental step to achieve the study’s objectives.
- -
- Life Cycle Impact Assessment (LCIA): the purpose of LCIA is to provide additional information to facilitate the assessment of the LCI results, in order to reach a better understanding of their environmental significance.
- -
- Life Cycle Interpretation: the interpretation of the life cycle results is the final stage of the LCA process, in which the results of an LCI and/or an LCIA are summarized and discussed, according to the defined objective and the scope, as a basis for conclusions, recommendations and decisions.
2.2. Case Study and Selected Biomass Crops
The study examined the life cycle impact of one cubic meter of biogas from corn and alfalfa crops, following the UNI EN ISO 14040 and UNI EN ISO 14044, which regulate the LCA procedure.
The case study selected is a farm located in central Italy, which can be considered an interesting case to establish a biogas plant fed with locally produced biomasses and sewage.
The farm covers 1000 hectares occupied by woods, pastures and meadows and arable flat land in the Municipality of Città della Pieve. The climatic parameters (2007–2017) as recorded by a regional control unit near the farm are typical of hilly areas of the region (average annual precipitation: 813 mm; yearly average temperatures: minimum −8.5, maximum 37.5; monthly mean rainfall 68 mm). The arable land is cultivated according to traditional criteria of agricultural rotations with wheat, sunflower and different crops to provide all the forage for livestock: alfalfa, corn, sorghum and triticale silage. Because of the current water shortage due to persistent variability in climatic conditions, and because of the presence of livestock sewage and pastures, it is an interesting case to implement a biogas production based on low input crops. Our first approach is to evaluate the environmental impact of two crops with very different tillage/cropping requirements.
In the present LCA evaluation maize and alfalfa whole plant silage was considered as feedstock for biogas production.
2.3. System Boundaries
The system boundaries have been defined following a methodological approach that considers the history of the product from “birth” to the company gate, i.e., considering the raw materials extraction, the materials production and their use. The downstream processes were not considered.
Specifically, the study has considered the following unit processes:
- -
- Soil occupation,
- -
- Plowing,
- -
- Harrowing,
- -
- Sowing,
- -
- Fertilization,
- -
- Weeding,
- -
- Irrigation,
- -
- Forage harvest,
- -
- Nitrogen fixation.
The case studied farm is still performing traditional tillage operations with a first intense tillage (harrowing) followed by a secondary tillage operation (harrowing) to smooth the soil surface and establish a suitable seedbed.
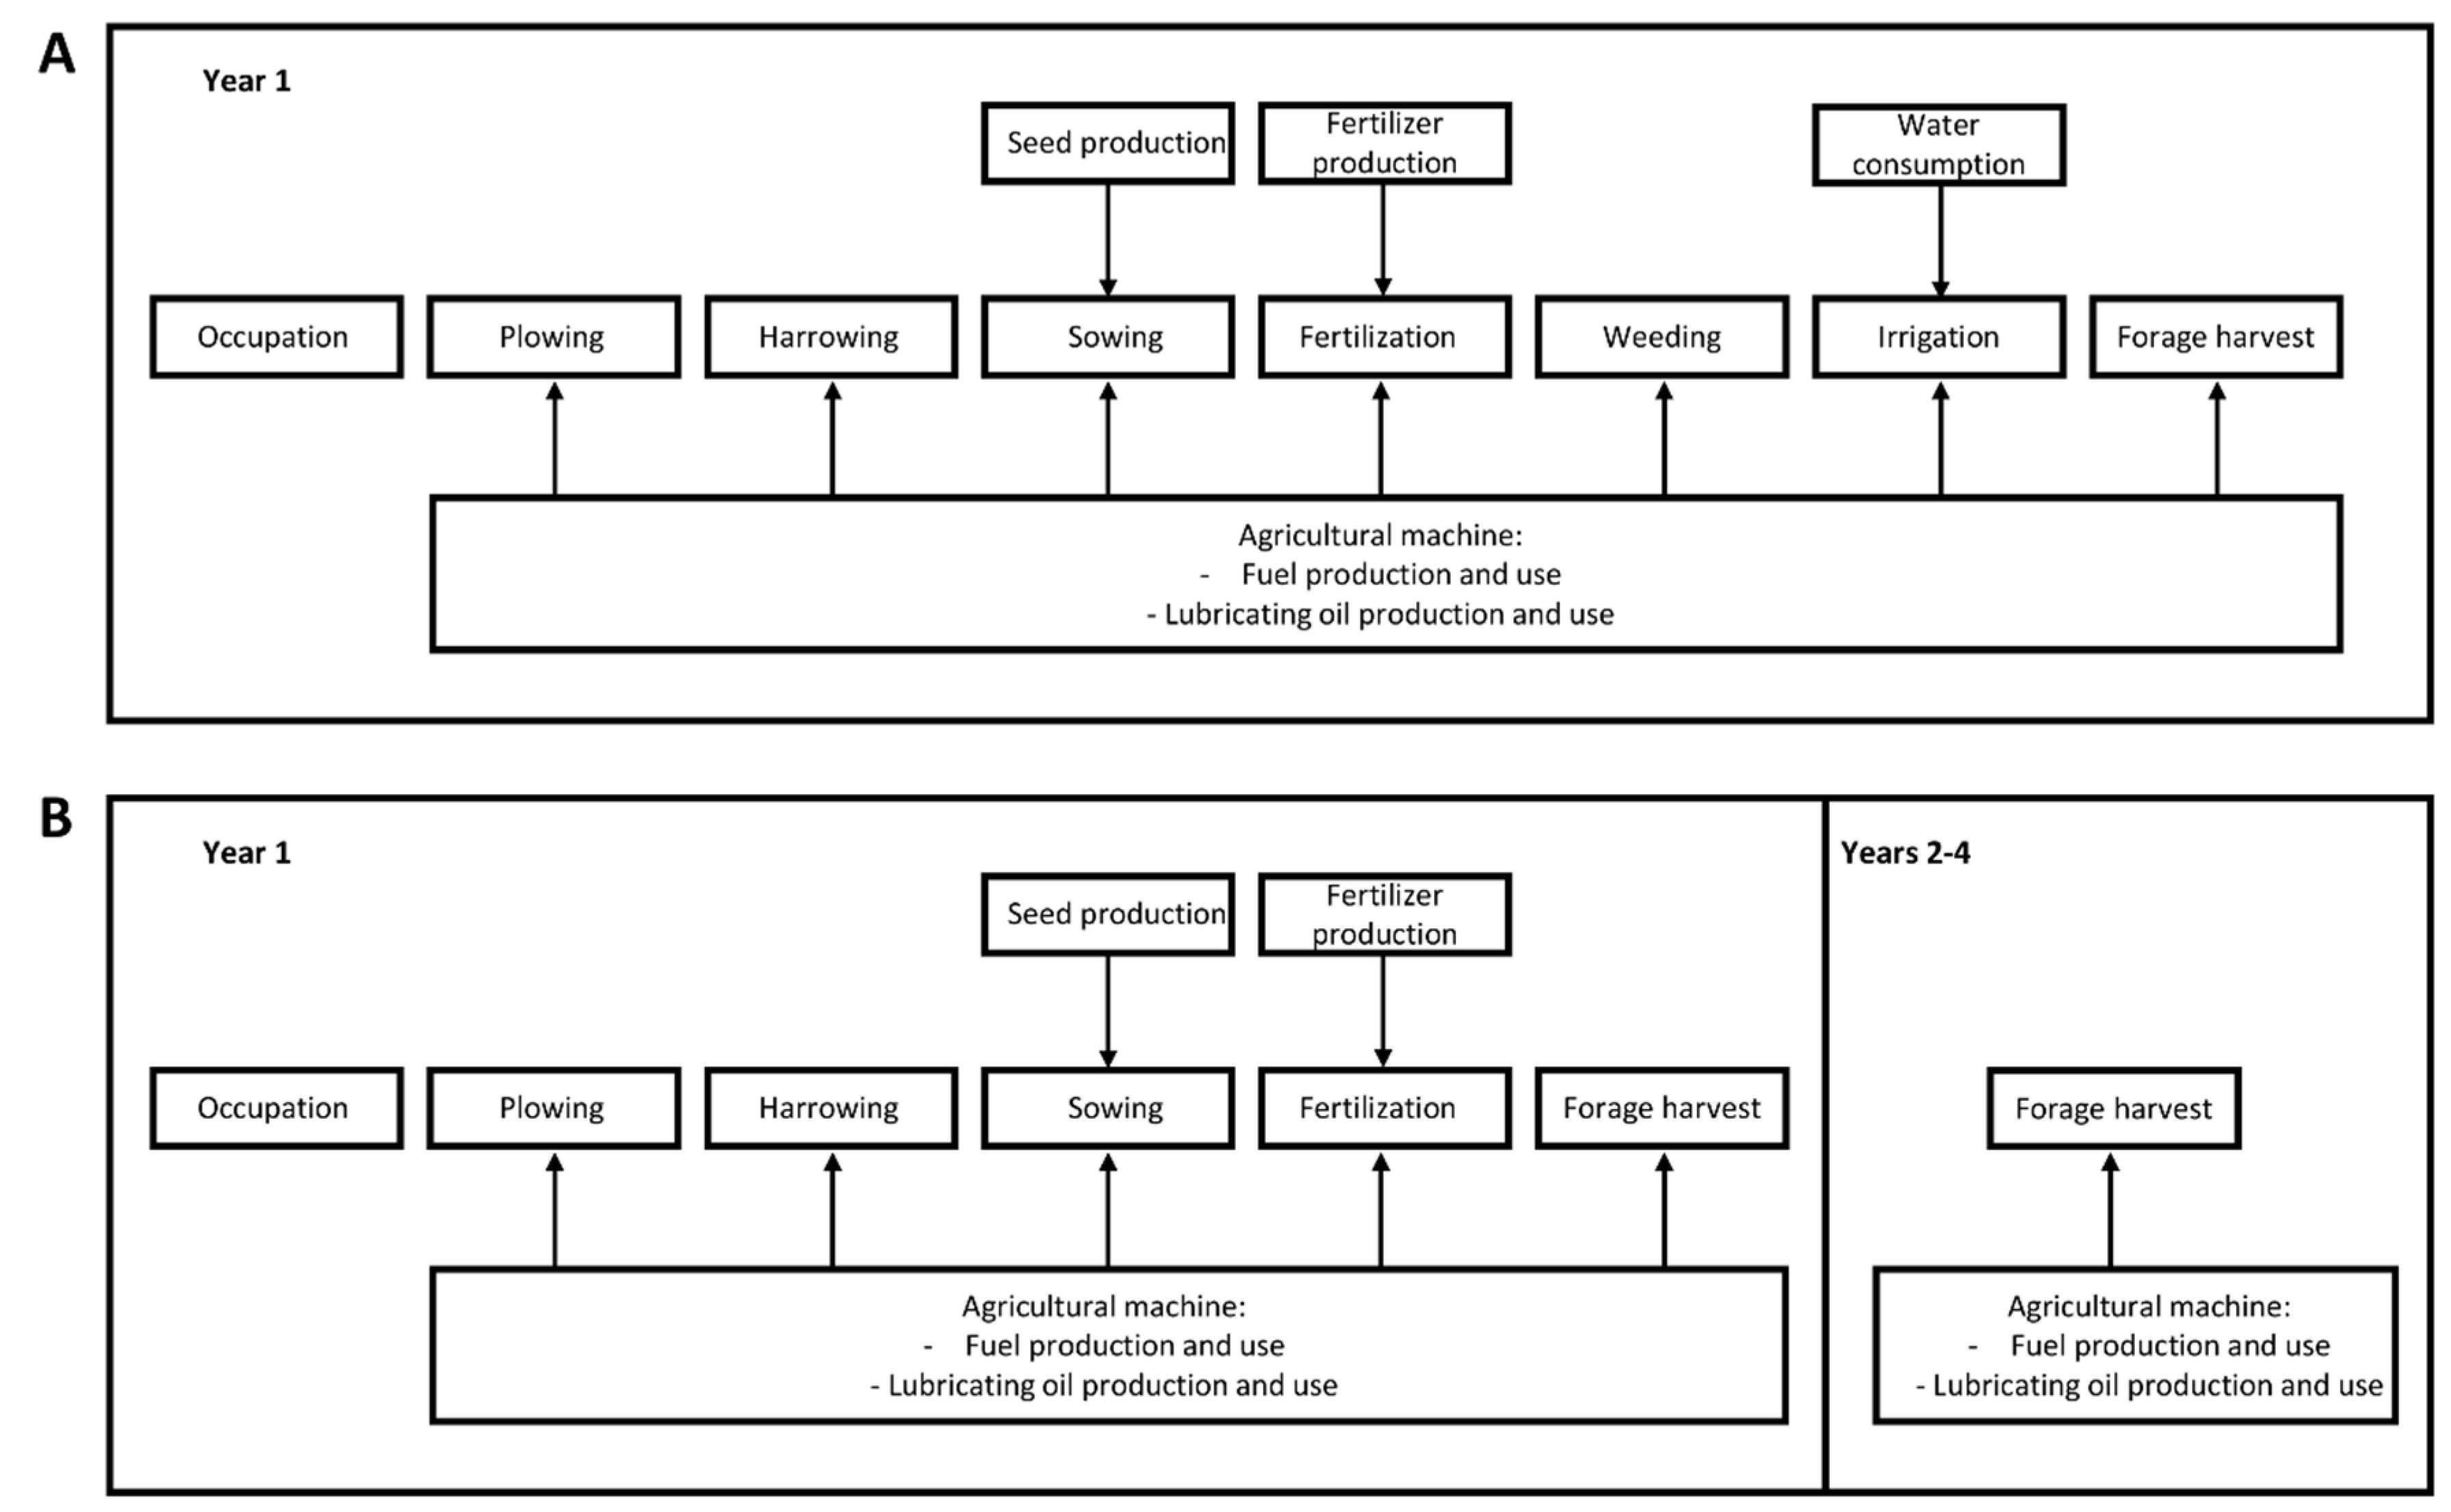
Not all these units belong to the life cycle of corn and alfalfa. In particular, nitrogen fertilization, weeding and irrigation are not necessary for alfalfa cropping in the case studied and in general in conditions typical of Central-Southern Italy. On the contrary, nitrogen fixation ability does not belong to the maize life cycle.
The use of a nitrogen-fixing species in cropping systems reduces the need for nitrogen fertilizers and improves the efficiency of nitrogen use, because the biologically fixed nitrogen is bound to the organic matter and for this reason is less susceptible to the chemical transformation and the physical factors that lead to its volatilization and dispersion.
It can be said that the alfalfa crop in rotation with other species, leads to a greater efficiency of nitrogen utilization than the monoculture of the same. Succeeding crops benefit from the nitrogen fixation advantages and, for this reason, they will not be considered within the alfalfa life cycle.
Supplemental Materials Table S1 shows the unit processes considered in the study for each crop.
In consideration of the difficulties of modeling perennial cropping systems and that they are normally treated as annuals (see [46] for a review), and because corn is an annual crop and alfalfa has an average lifespan of four years, in order to have comparable results, all the input data and processes have been introduced considering a useful life of four years. Specifically, for maize cultivation the operations introduced in the first year have been repeated also in the second, third and fourth year. For alfalfa only forage harvest and nitrogen fixation have been considered in the second, third and fourth year.
Figure 1 synthesizes both maize (A) and alfalfa (B) crop system boundaries.
2.4. Functional Unit
The analysis has been developed to evaluate the production of energy from vegetable crops through the use of anaerobic digestion (Anaerobic digestion is a biological process by which a complex organic substrate is transformed into biogas, consists mainly of methane (55–75%), carbon dioxide (30–45%) and in minor components, such as nitrogen, hydrogen, ammonia, hydrogen sulfide, and organic final stabilized products. Degradation occurs in one or more reaction spaces, called digesters, in the complete absence of oxygen and generally heated) (AD) process [47].
Even if the functional unit used in many LCA studies of energy crops is the area of the cultivated ground or the mass of biomass [48], this solution didn’t seem the most appropriate for our study because the chosen biomasses have very different yields per hectare and biogas yields.
For this reason, the functional unit selected is one cubic meter of biogas (1 m3N). All the collected data were then normalized on the basis of this unit.
2.5. Data Collection
The data were collected through the use of a template given directly to the farm management, all the information about the energy and material flows relate to 2015.
The farmer has described the different materials and the quantities used during the process, as well as, the energy consumptions and production during the year. Specifically, he provided the following data: types of agricultural machinery employed and relative powers, fertilizers used, water consumption, energy and lubricating oil machinery requirements, seeds used.
The following unit measures were taken into account: liters for the fuel consumption; kilograms for the use of fertilizers, seeds, lubricating oil and fixed nitrogen; cubic meters for the water consumption; horsepower for the equipments. For the quantity of nitrogen fixed from the soil, the value has been defined according to [49], assuming an average value because nitrogen fixation is different according to the type of soil. Starting from the collected data, it was possible to build the inventory and, subsequently, the different unit processes which compose the system.
For the impact assessment, the yields per hectare of the two investigated crops have been taken into consideration and obtained directly from the farmer, while the biogas potentials were derived from average ratios of experimental tests made by an Italian company, Agroinnovazione Srl, specialized in the servicing of biogas plants. As reported in Table 1 the production of one hectare of cultivated maize was about 20 tons of dry matter and for one hectare of alfalfa it was 3.4 tons in the first year. Alfalfa yield increases in subsequent years, assuming a value of 8 tons/ha in the second and third year, up to 4.5 tons/ha in the fourth year. Furthermore, one ton of organic dry substance of maize is able to generate 650 m3 of biogas.
Alfalfa, instead, has a lower yield equal to 530 m3 of biogas for one ton of organic dry substance.
The input provided by the investigated farm are shown in Table 2 and have been referred to one hectare of crop.
From the above values and the different yields in term of biogas production, it was possible to perform the analysis of environmental impacts associated to the production of 1 m3 of biogas from the crops analyzed. Ecoinvent database was used for the data definition into the Simapro software [50].
2.6. Theory/Calculation
The Method
In the present study the impact was assessed through the following two methods as in other agricultural LCA analysis [51,52]:
Eco-Indicator 99 Method
The Eco-indicator 99 method has been developed by the Dutch PRé (Product Ecology Consultants) on behalf of the Dutch Ministry of Environment; it allows to aggregate the results of an LCA into easily understandable and usable quantities or parameters, called Eco-indicators (Eco-indicator 99 2000). To allow a more multifaceted representation of the results, it has been thought in three distinct versions, each of which represents a certain type of people.
The distinctive features of the three archetypes considered in the model are described below:
- -
- Individualist (I): is a person free from any bond; in his view, everything is provisional and subject to negotiation.
- -
- Egalitarian (E): has a strong attachment to the group, but not to his charges; not recognizing differences of role, it makes ambiguous relationships within the group often sparking conflict.
- -
- Hierarchist (H): it is a person who has strong ties both with the group and with its rules; creates a strong stability, favoring the control actions on themselves and on others.
The method of the designers recommends the use of the hierarchical version as the default for the evaluation within the calculation codes. This perspective is the one which is a major chord with all other models. The term “environment” is identified with three types of damage:
- 1
- Human Health: under this category we include the number and duration of diseases, and life years lost due to premature death from environmental causes. The effects included are: climate change, ozone layer depletion, carcinogenic effects, respiratory effects and ionising (nuclear) radiation.
- 2
- Ecosystem Quality: under this category the method includes the effect on species diversity, especially for vascular plants and lower organisms. The effects are: ecotoxicity, acidification, eutrophication and land-use.
- 3
- Resources: under this category it includes the surplus energy needed in future to extract lower quality mineral and fossil resources. The depletion of agricultural and bulk resources as sand and gravel is considered under land use.
Each category of damage is in turn divided into impact categories, as shown in Table 3.
Each category of damage has its own unit of measurement:
- -
- DALY: This indicator expresses the number of Disability-Adjusted Life Years (DALYs), or the weight of an infirmity due to a disability or premature death attributable to each disease. To quantify the damage done to human health we must consider a scale that is able to measure the health of the population
- -
- PDF·m2·yr/PAF·m2·yr (PDF: Potentially Disappeared Fraction, PAF: Potentially Affected Fraction): the authors of the method chose to consider the change in the number of plant species present in a territory such as biological indicator of health of the ecosystem and, therefore, the associated measurement unit representing the decrease (Disappeared) or damage (affected) of the number of species (expressed in the form of fraction) for the area and for the time.
- -
- MJ Surplus: it is defined as the difference between the energy currently required for the extraction of a resource and that one indispensable in a future moment. The surplus is estimated as that will be needed to extract 1 kg of material in the moment in which the consumption of that material will be five times that extracted before 1990. The choice of the factor N = 5 is totally arbitrary.
After the characterization, the method calculates the damage assessment, and then damages due to the impact categories are multiplied for the factor 1, to be included in their respective categories of damage, except that due to Ecotoxicity that is multiplied for the factor 0.1.
The normalization makes the damages found in the phase of characterization homogeneous, with the goal of making the three impact categories comparable for the evaluation of the damage. Normalized damages are “weighted” and summed to obtain a single indicator of damage. In practice, the values of the normalized effects are multiplied by the weight of evaluation factors, related to the various categories of damage, and added together to obtain a single value, the “Eco-indicator” (in points or milli-points, mPt), which expresses the impact associated through a final environmental index. In brief Eco-indicator 99 is an endpoint method, where eleven impact categories are grouped into three damage categories, weighted and then aggregated into a single index, which represents the overall environmental load. A thousand points (kPt) represent the environmental impact of an average European inhabitant [52].
IPCC 2013 GWP 100y method
The “2013 IPCC GWP 100y” impact assessment method allows to extrapolate immediately the impact associated with the category of interest.
The IPCC (Intergovernmental Panel on Climate Change) has compiled a list of values of the GWP for different exposure times (20, 100 and 500 years), based on the experiences of scientists around the world. GWP factors related to short period (e.g., 20 years) provide an indication of short-term effects of greenhouse gases on the climate, while GWP relative to longer periods (100 to 500 years) are used to assess the cumulative effects of these gases on the long-term global climate.
For the objectives of a study on the life cycle, it seems preferable to consider the broader possible exposure, but since the increase of the integration time, the uncertainty on the estimated values, are universally used the potential of integrated 100 years (GWP100a).
GHG emissions are measured in mass and converted to equivalent CO2 emissions using global warming potentials (Global Warming Potential) to 100 years (GWP100) (IPCC, 2014). The GWP is calculated by adding the emissions of GHG, multiplied by the appropriate factors GWP100 [55].
IPCC GWP 100y calculates the greenhouse effect damage. The only considered impact category is then the Global Warming 100a expressed through kg of equivalent CO2.
In brief the IPCC 2013 GWP 100y is a midpoint method and expresses environmental impacts in terms of the emission of GHG, with the resulting environmental impact represented in kg CO2-eq. This method comprehends the anthropic contribution plus the natural variability of the climatic system [52].
3. Results
Impact Assessment
The phase of LCIA (Life cycle impact assessment) converts the data previously processed in the LCI phase (materials and their related processes) in potential environmental damage. Specifically, the harmful effects on health and environment produced by the analyzed crops in their life cycle, have been evaluated and quantified. The level of detail, the most significant impact categories to be investigated and the methodologies used are dictated by the objective and the scope of the study.
The following are the results of the current LCA study through the Eco-Indicator 99 (H) method using SimaPro software.
In order to reproduce the different operations that take place in the field for maize and alfalfa crops, different sub-assemblies were defined [50]. All input flows were introduced as normalized on the functional unit (1 m3 of biogas). Then, the sub-assemblies were connected to rebuild the entire life cycle. The sequence was repeated for both crops.
Because of the different lifespan of maize and alfalfa, as already mentioned, all the input data and processes have been introduced considering a useful life of four years.
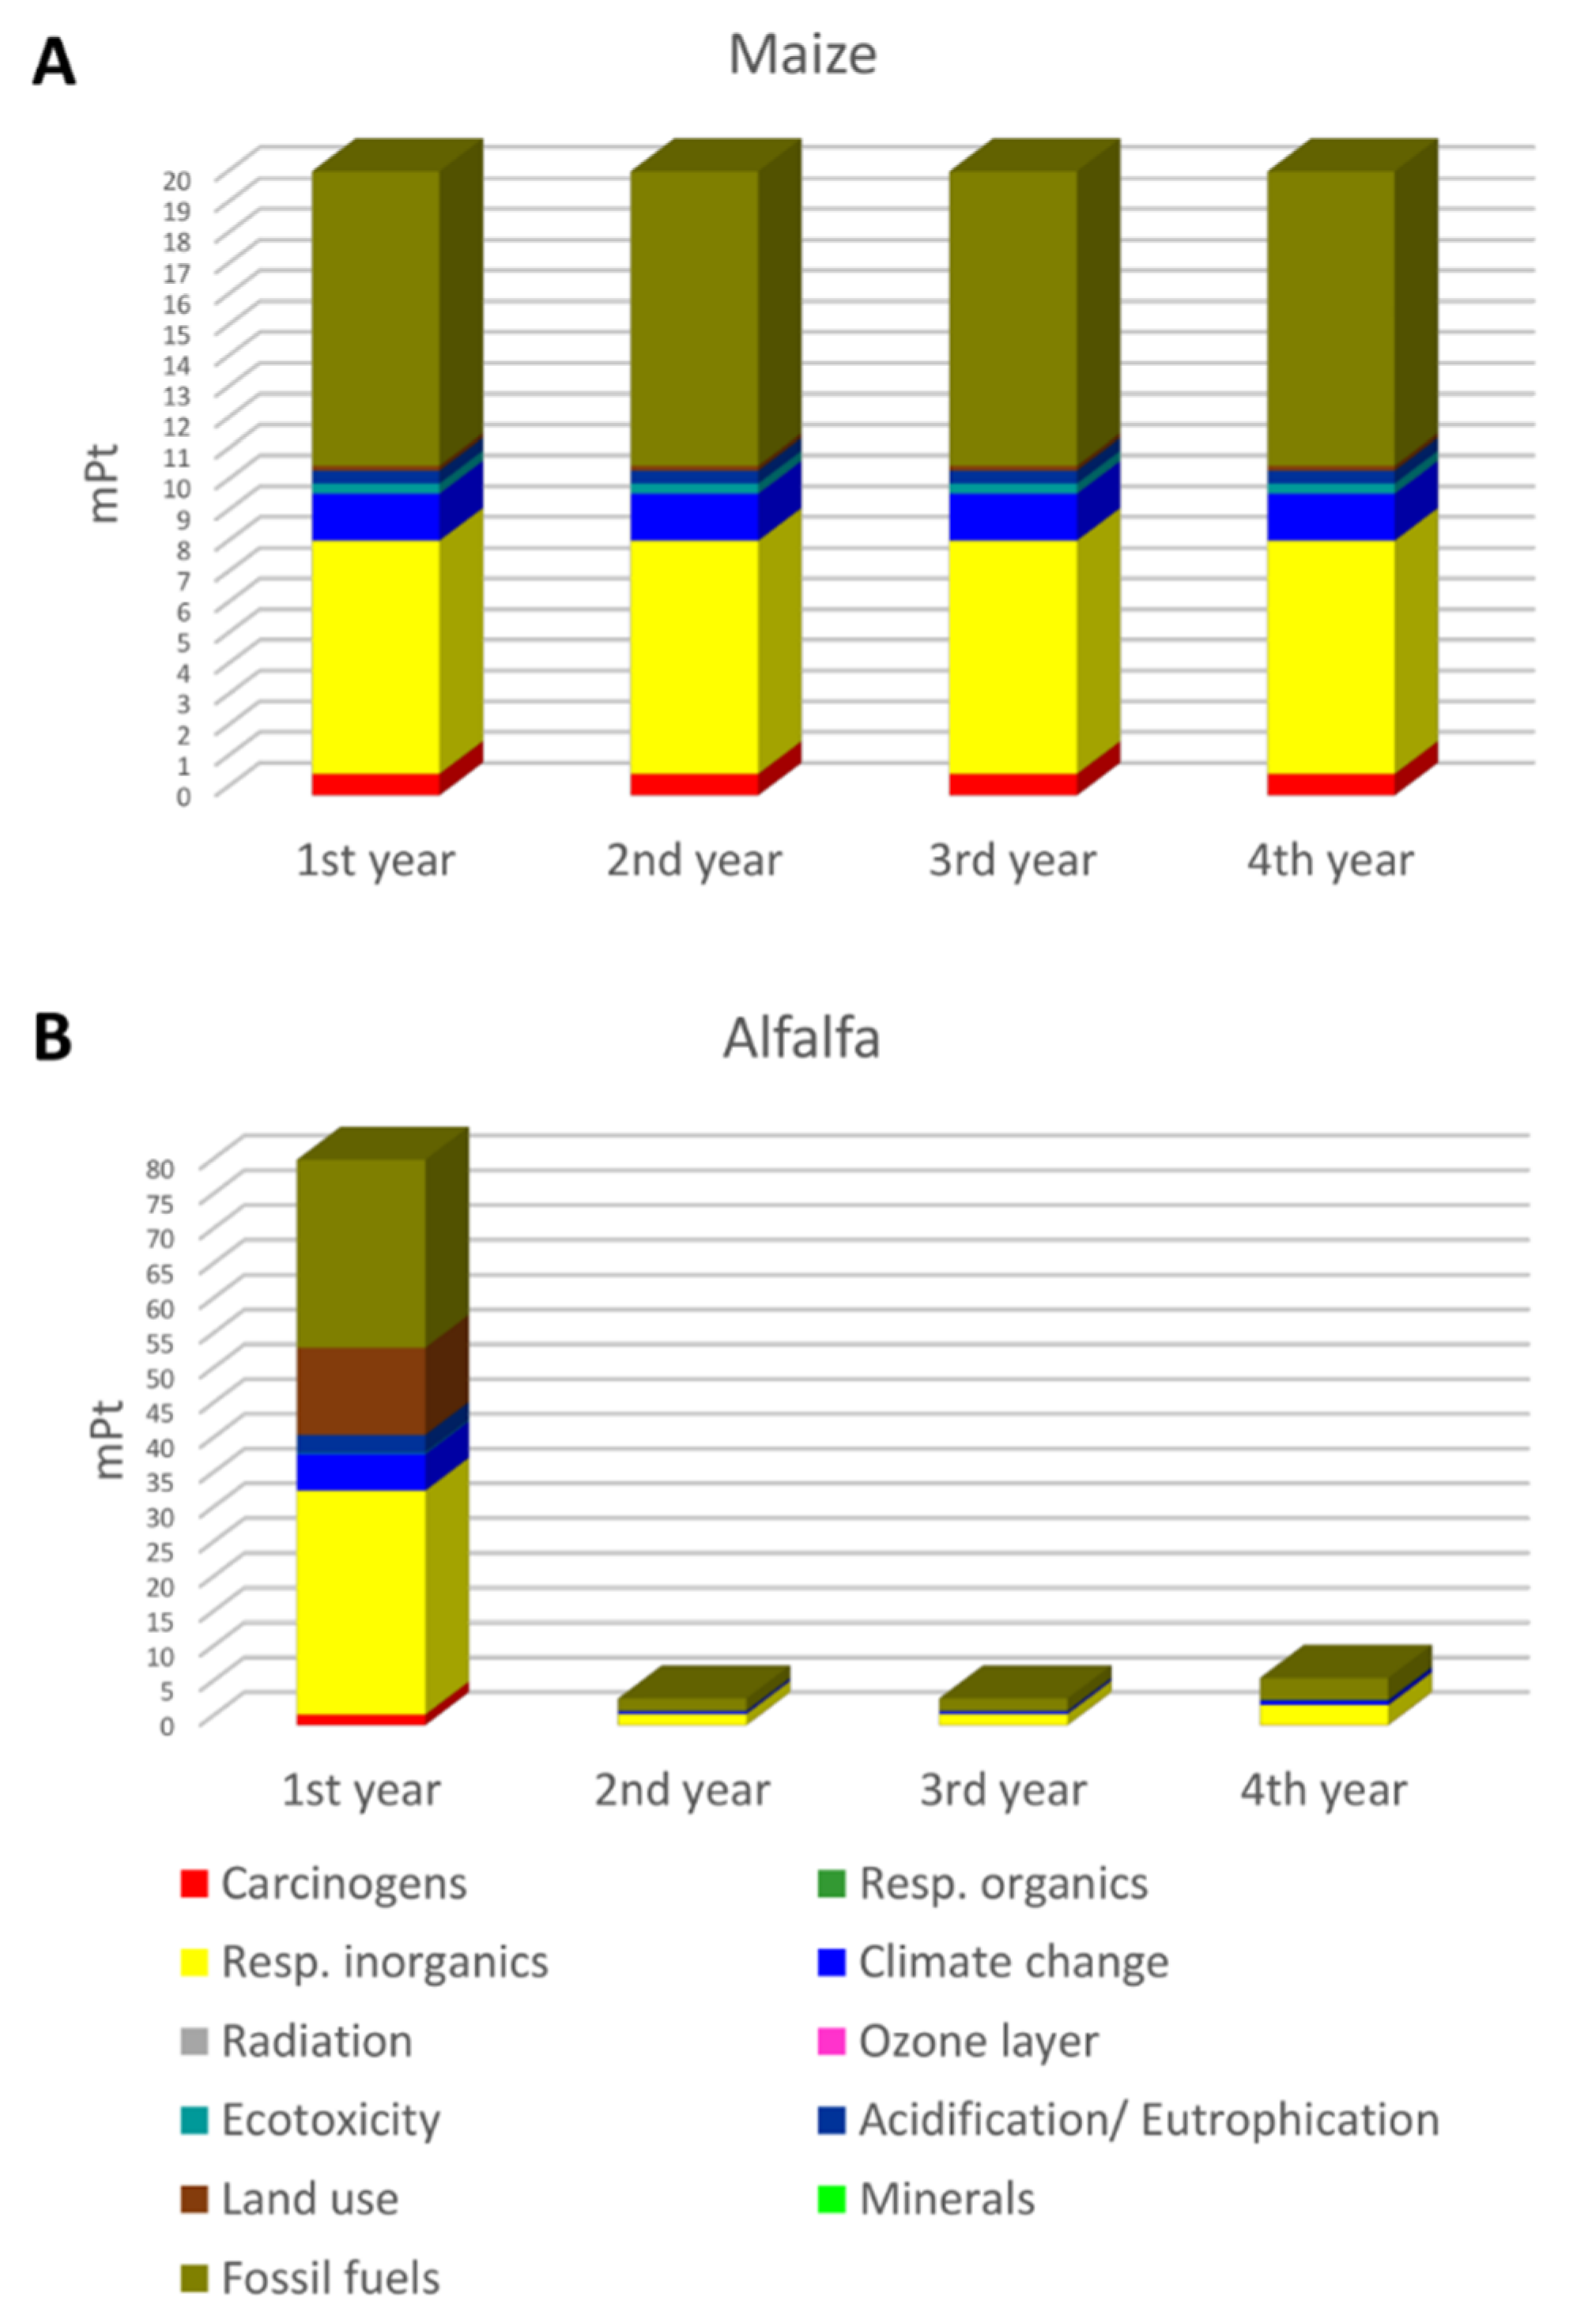
Regarding maize, Figure 2A shows the different contributes to the total impact for each year according to the Eco-indicator method [53]. Relevant categories are fossil fuels and respiratory inorganics, as reported in other scenarios and calculation methods.
For example, the importance of diesel fuel requirement for the production of their functional unit (one ton of biomass of different maize cultivars) for energy purpose is highlighted by González-García and colleagues [56].
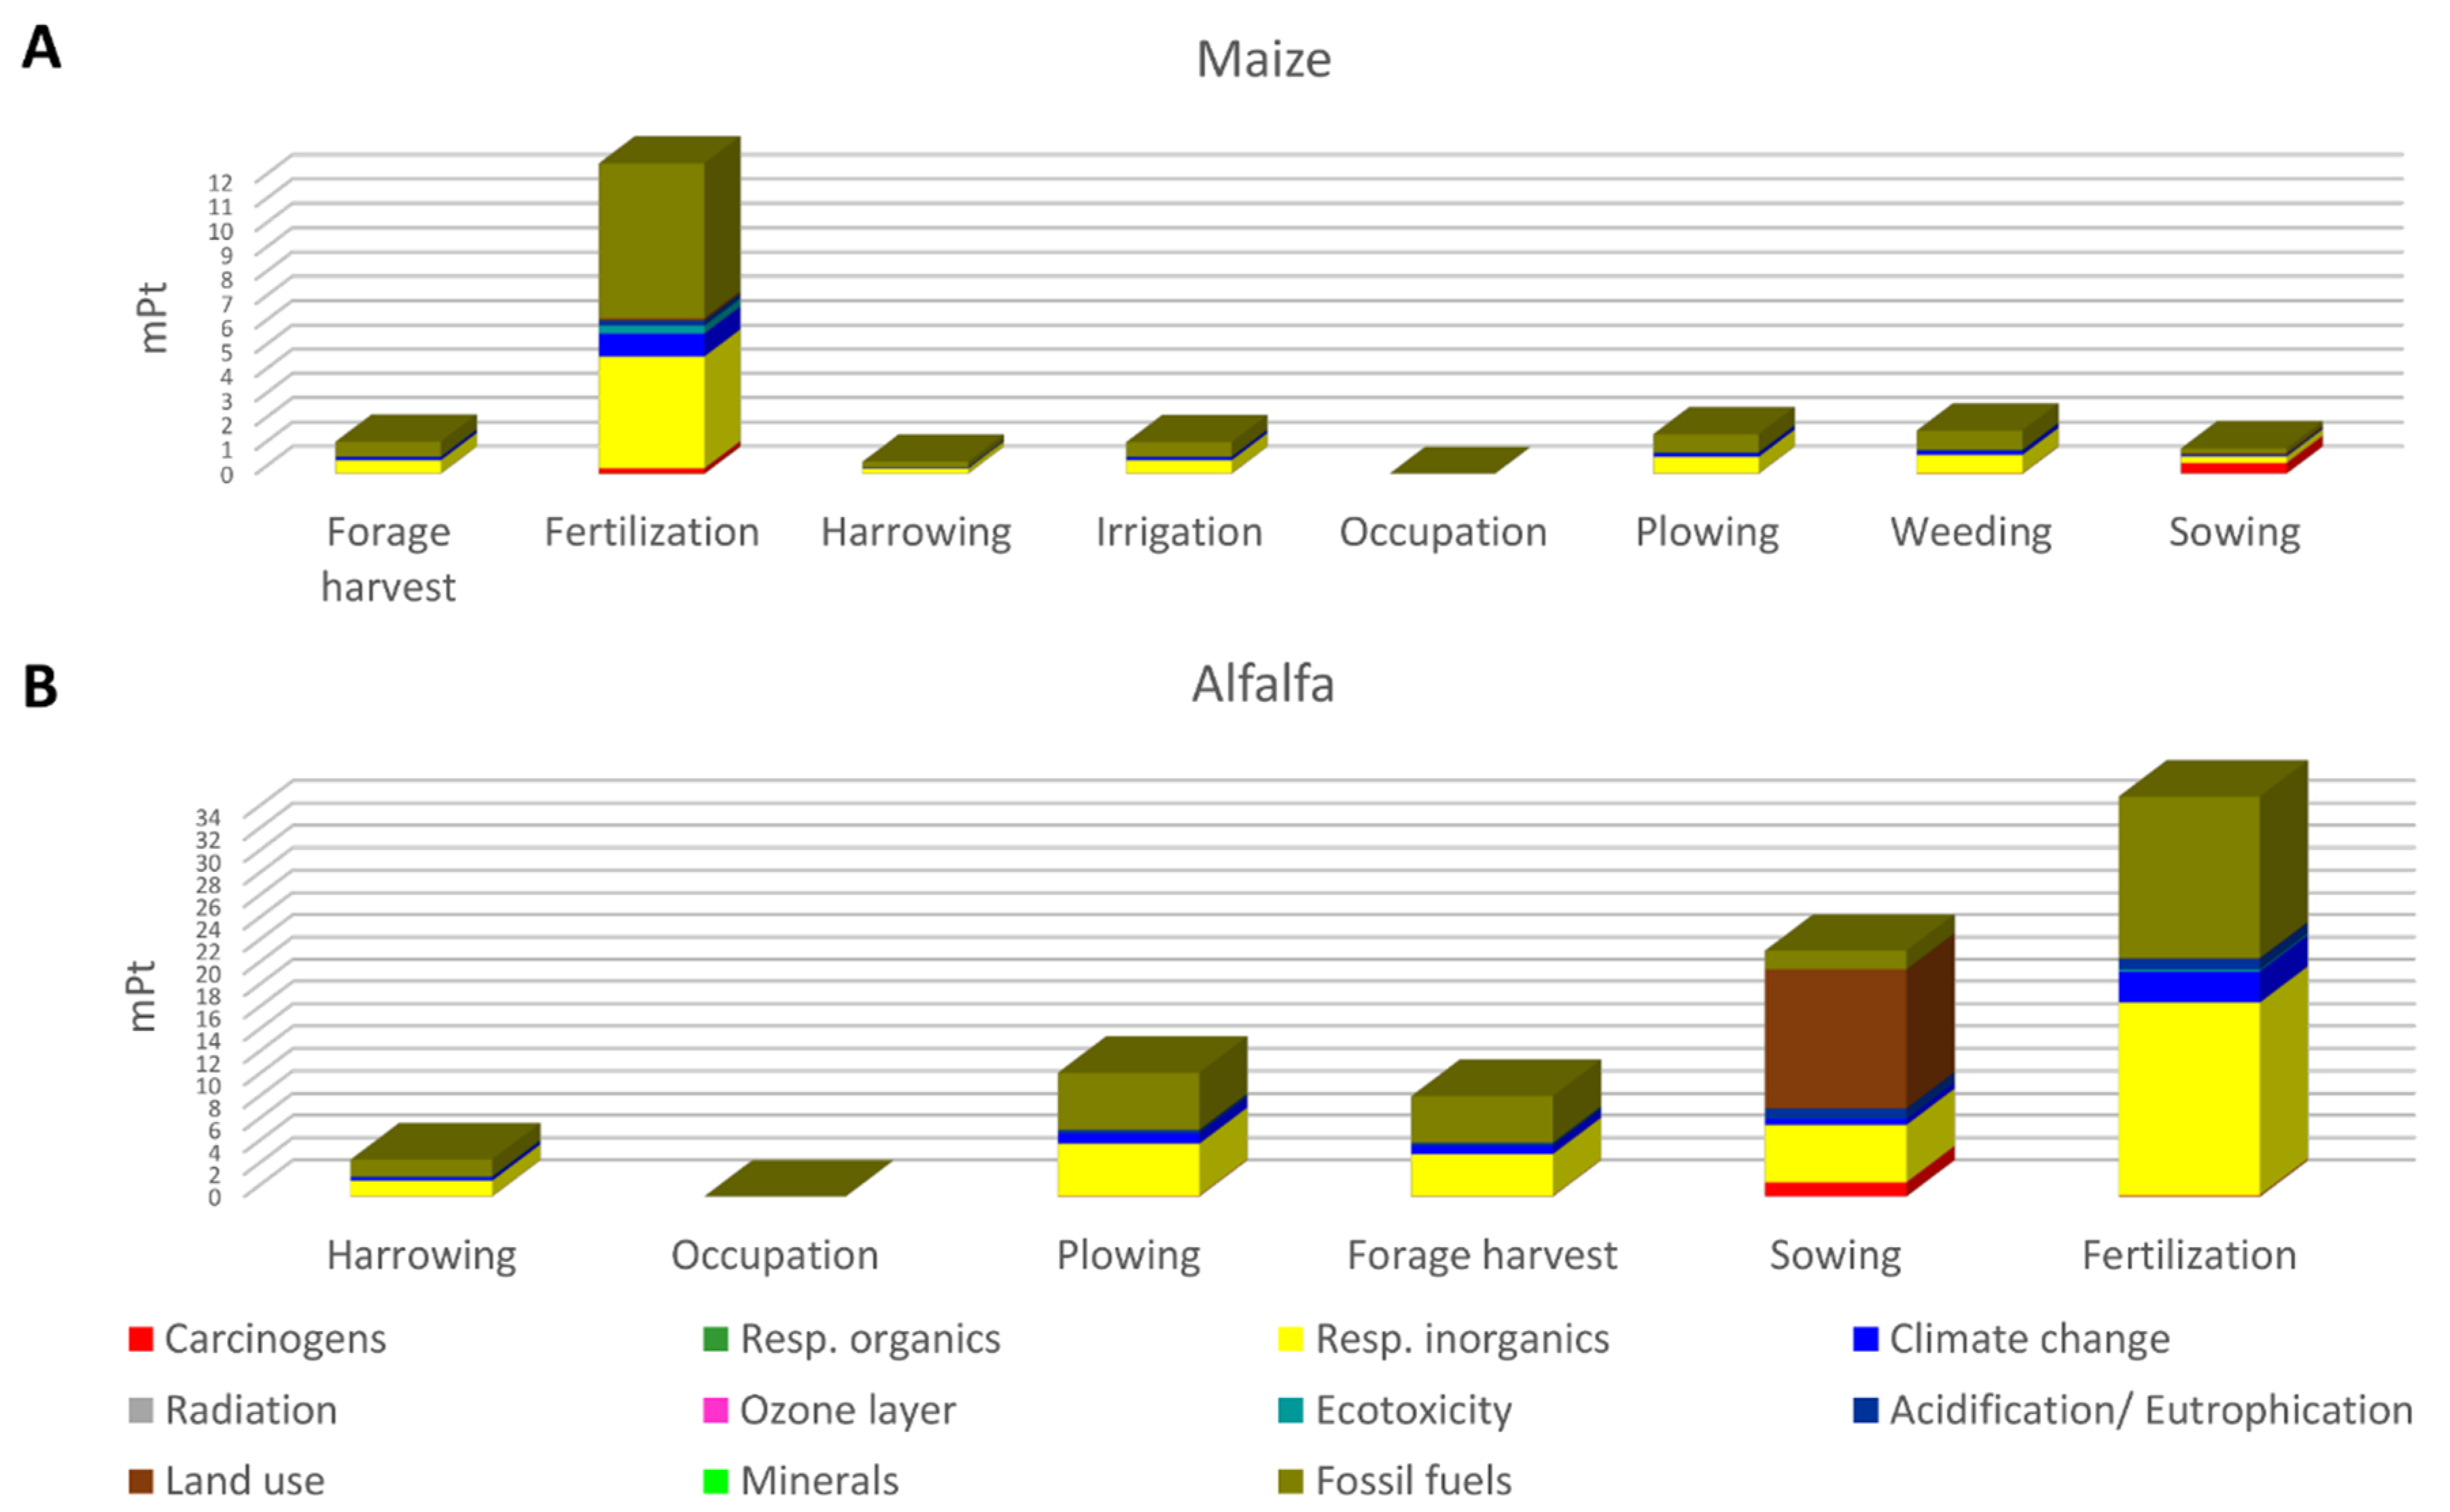
Considering the single year (the total impact can be obtained multiplying the impact by 4), Figure 3A and Supplemental Materials Table S2 show the impact for each unit process that can be considered for maize cultivation.
The results for each impact category are expressed in milli-point (mPt, i.e., 1000 mPt = 1 Pt) in accordance with the Eco-Indicator method (the higher the impact the higher the score).
The impact is almost entirely due to the fertilization phase (12.76 mPt, 63%). In particular, for fertilization, the highest score is recorded in the Fossil Fuels category (6.37 mPt). It is also important to consider the contribution of the fertilization process to the Respiratory Inorganics category (4.6 mPt). Respiratory effects result from emissions of inorganic substances to air. Weeding represents the second relevant contribution to the total impact (9%). The score, in this case, derives from the production process and the use of glyphosate. Chemical weeding results among the relevant factors that contribute to several impacts also in [57].
For alfalfa crop, because there are very few inputs after the year of establishment, the impact in the 2nd–3rd–4th years is significantly lower than in the first year. The distribution of the impact in four years is shown in Figure 2B.
The breakdown of the total impact between the single impact categories for the time period considered is reported in Supplemental Materials Table S3.
To evaluate the contributions of the various process inputs to the total score, the following data were extrapolated: the score for each impact category and process in the first year (planting year); the score for each impact category and process in the second year (equal to the third year in terms of operations) and those in the fourth year. Results of the first year are reported in Figure 3B and Supplemental Materials Table S4.
Supplemental Materials Table S4 shows the results expressed in milli-Point for the different impact categories referred to the first year. Because the majority of the cultural practices occur in the first year, the total impact is 81.26 mPt, higher than the annual amount of maize. The greatest contribution is associated with the fertilization phase. Following, sowing produce a lower environmental load (27%). The fertilization constitutes the 44% of the total impact (35.83 mPt), contributing primarily to the Respiratory Inorganics category. The greater contribution to the total impact of sowing phase is due to the Land Use category with crop seeds production process. The same process (seeds production) constitutes the greatest contribution also in the other impact categories for the sowing phase, especially Respiratory Inorganics and Fossil Fuels. For plowing and forage harvest (13.6% and 11% of the total), the use of agricultural machineries, and consequently of diesel for specific operations, cause a major impact on Respiratory Inorganics and Fossil Fuels categories.
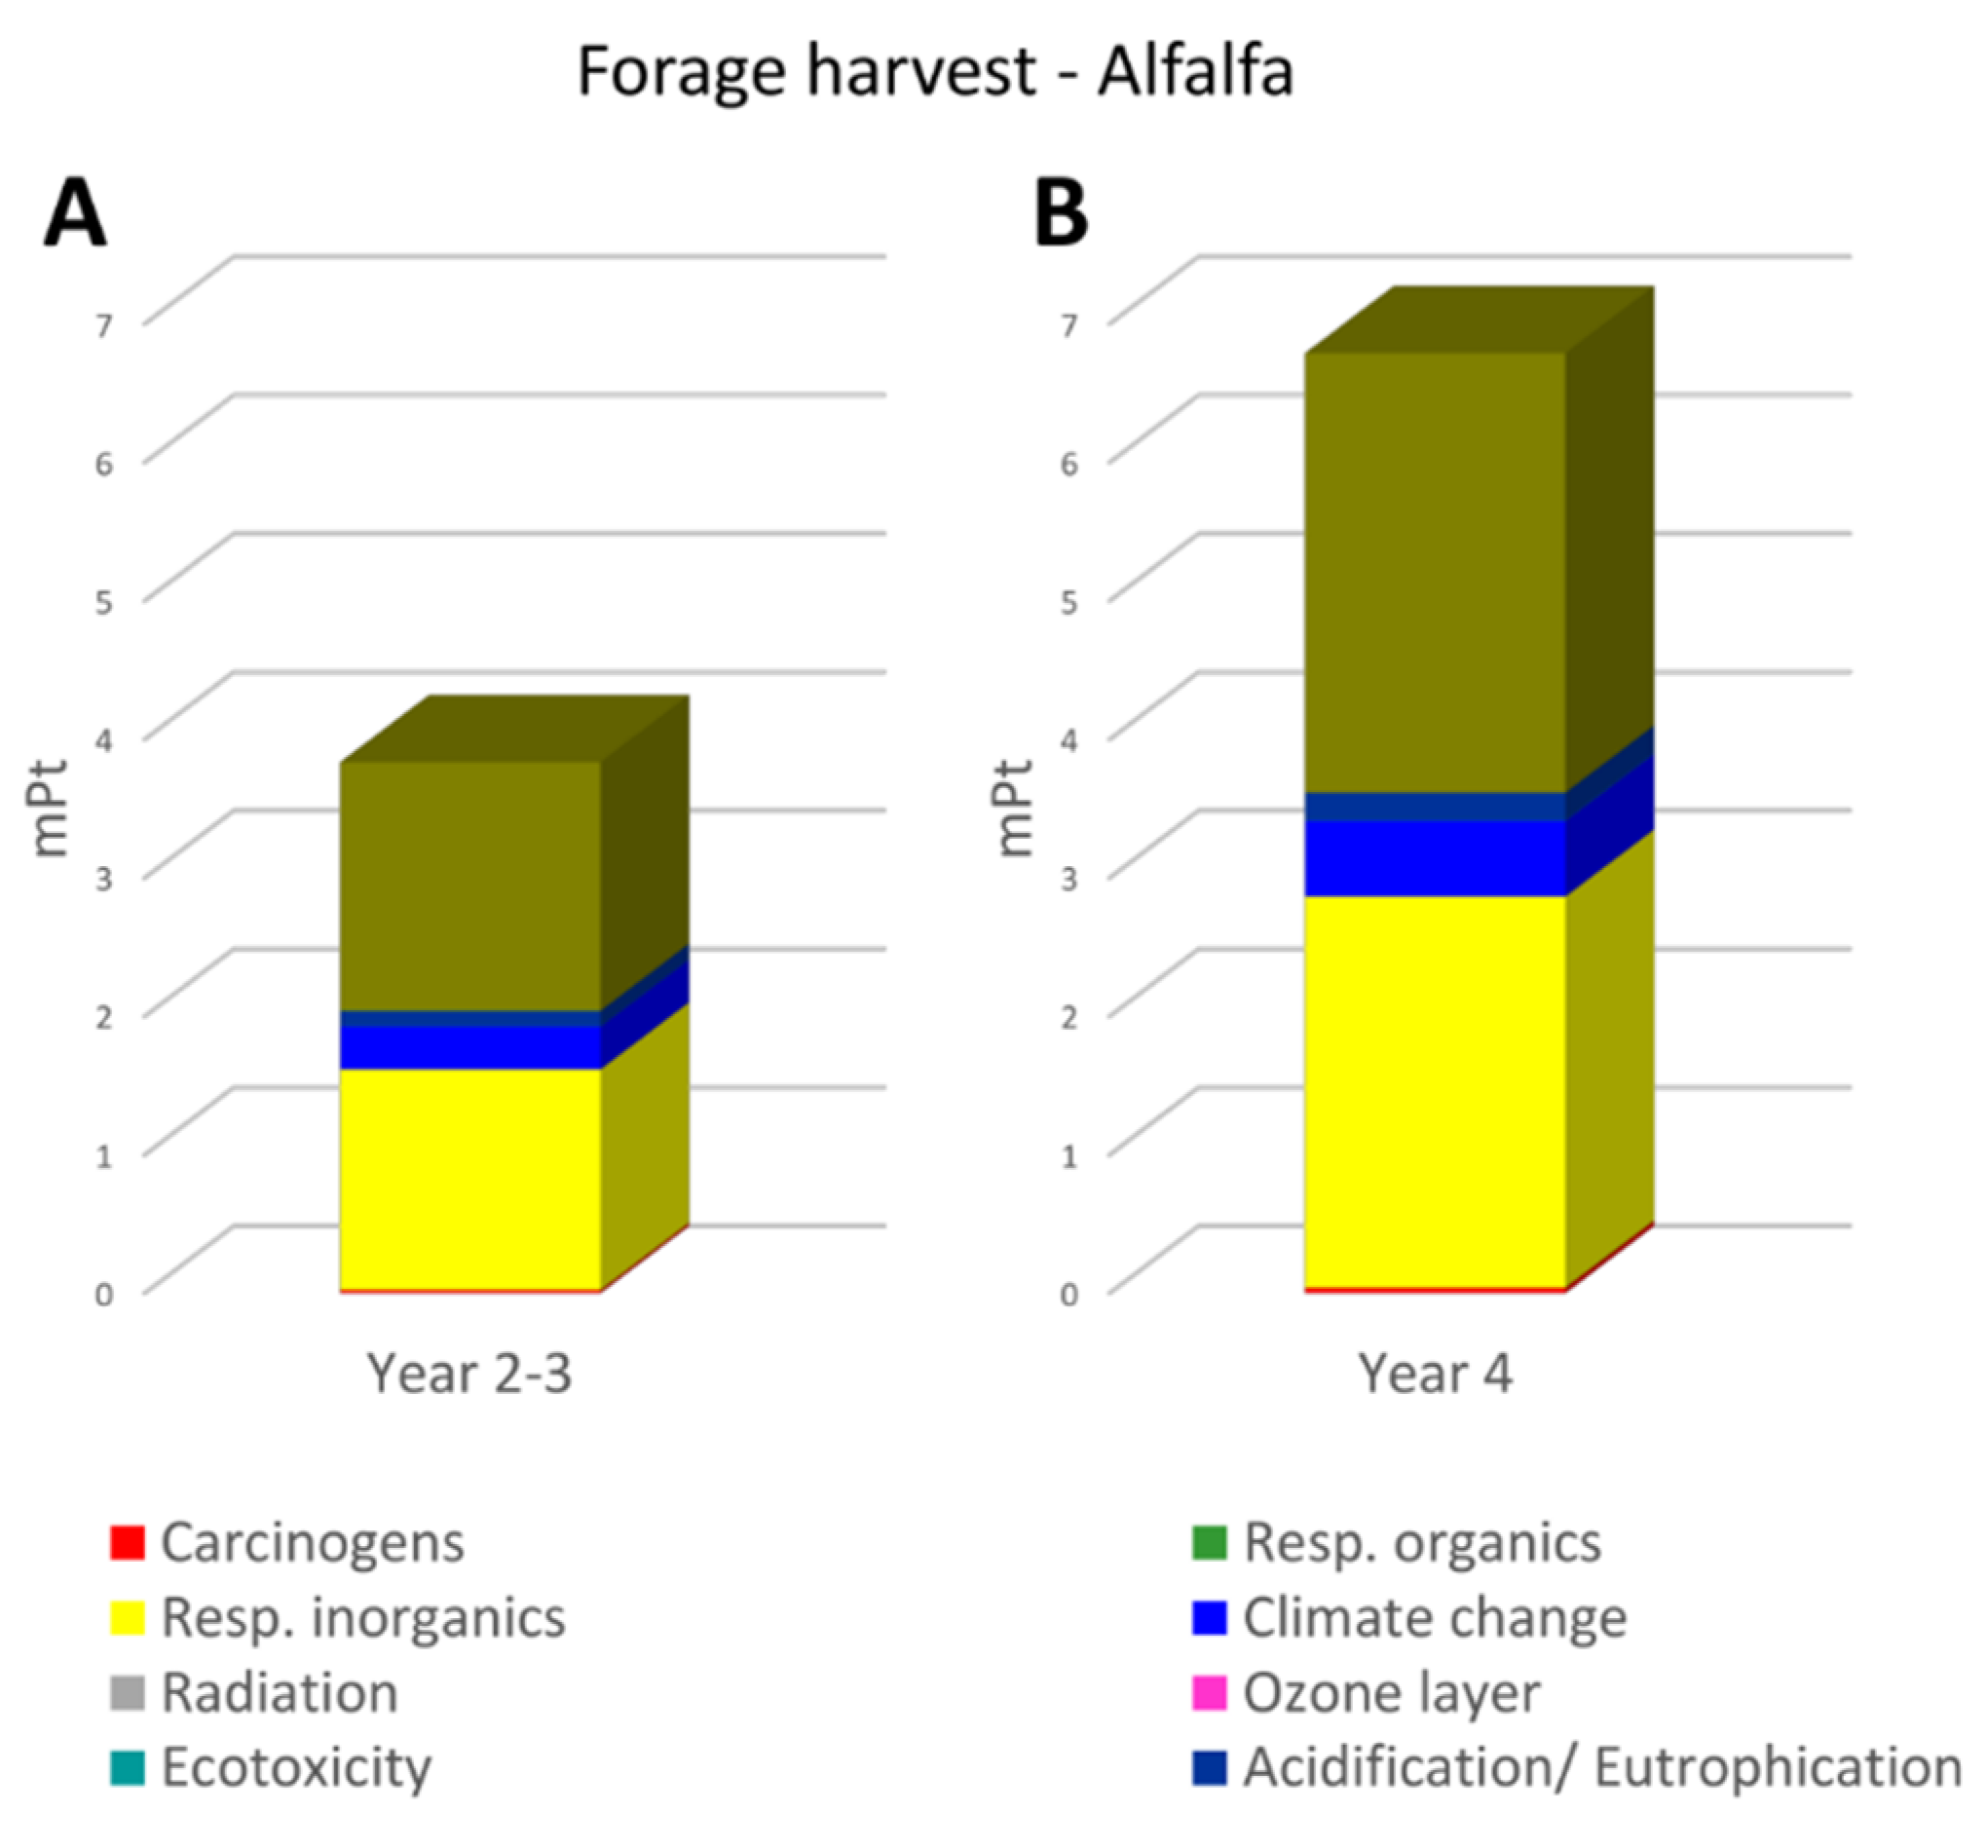
For the second year, as well as the third year, the results are shown in Figure 4A and Supplemental Materials Table S5.
There are no particular operations with the exception of forage harvest that determines a score of 3.84 mPt. In this case, the entire contribution is due to the prodution and use of fossil fuel and lubricating oil for the machinery employed. For this reason, the main impact categories involved are Fossil Fuels category (46.6% of the total score) and Resp. inorganics category (41.4% of the total).
Impacts associated with the last year of alfalfa life, when it has again a decline in production, are shown in Figure 4B and Supplemental Materials Table S6.
In this case, the impacts are comparable to those of the second and third year, with the difference that in the last year of life cycle, the alfalfa has a decline in terms of yield and consequently a low increase of the total environmental load.
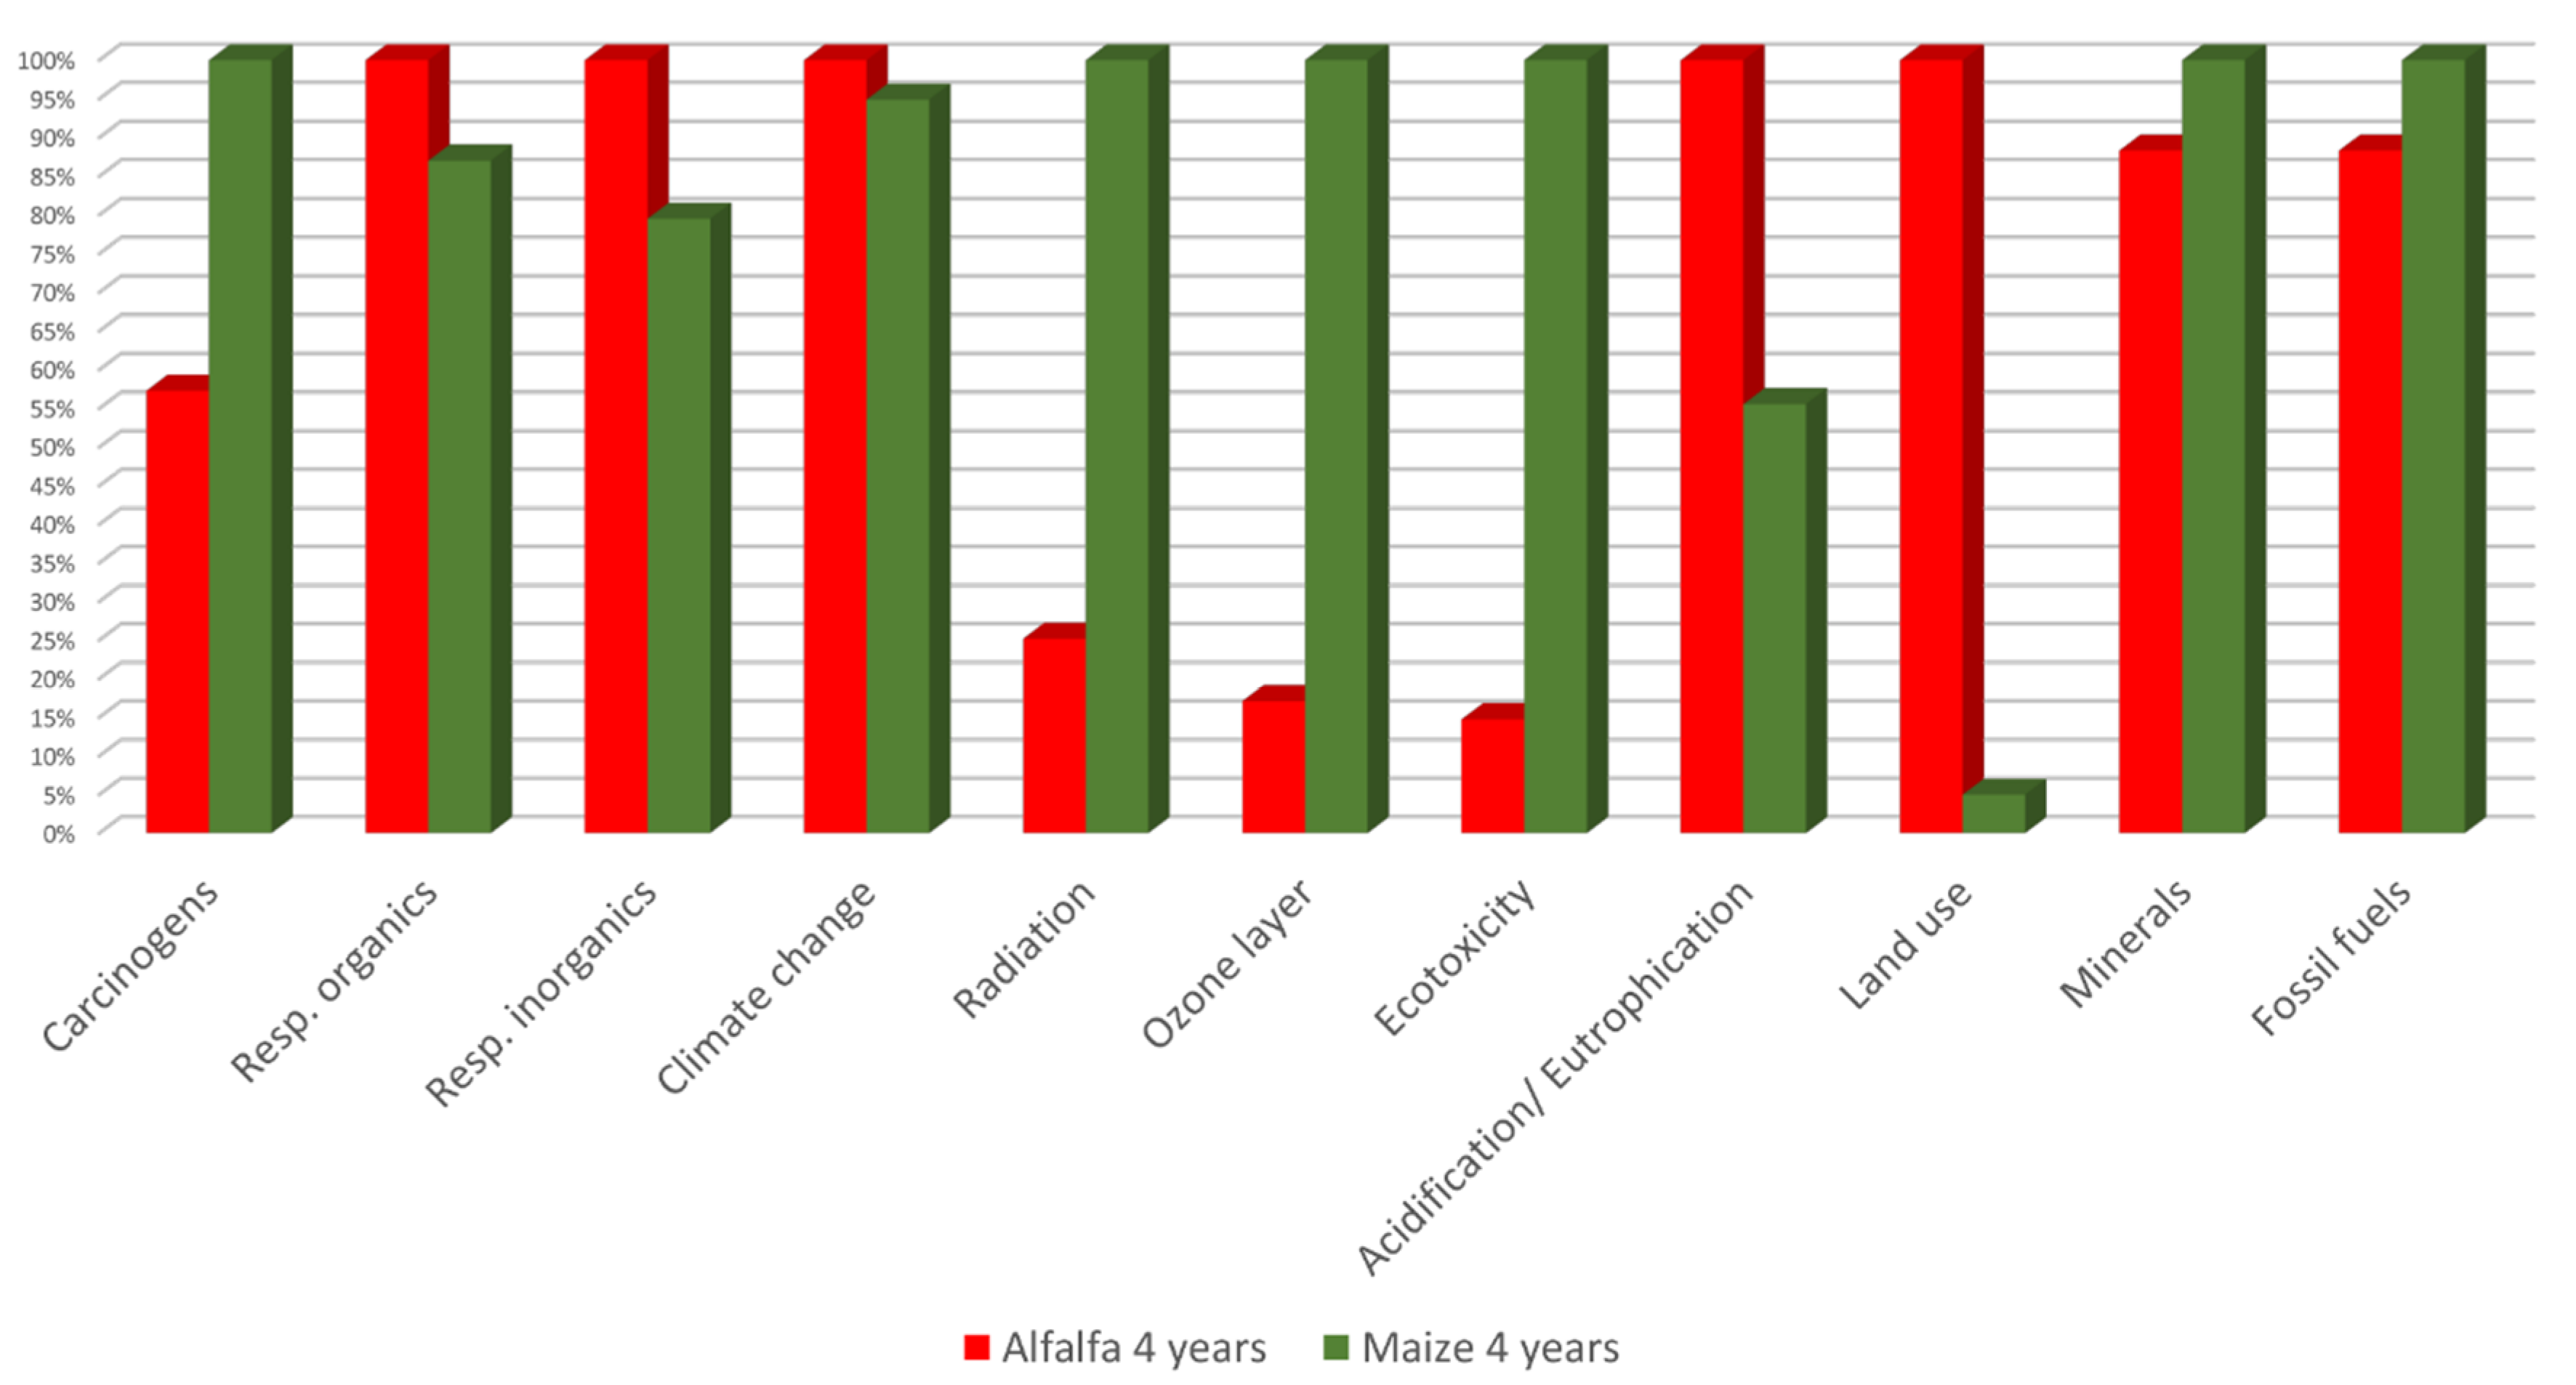
The comparison between the two crops is reported in Figure 5 and Supplemental Materials Table S7, during the mentioned time frame (4 years). The characterization phase, compares the impacts (expressed in relative percentage) of one cubic meter of biogas from maize and alfalfa for each impact category.
The contribution to the environment is different for alfalfa and maize depending on the different impact categories. In particular, alfalfa has a better performance in Carcinogens, Radiation, Ozone Layer, Ecotoxicity, Minerals and Fossil Fuels.
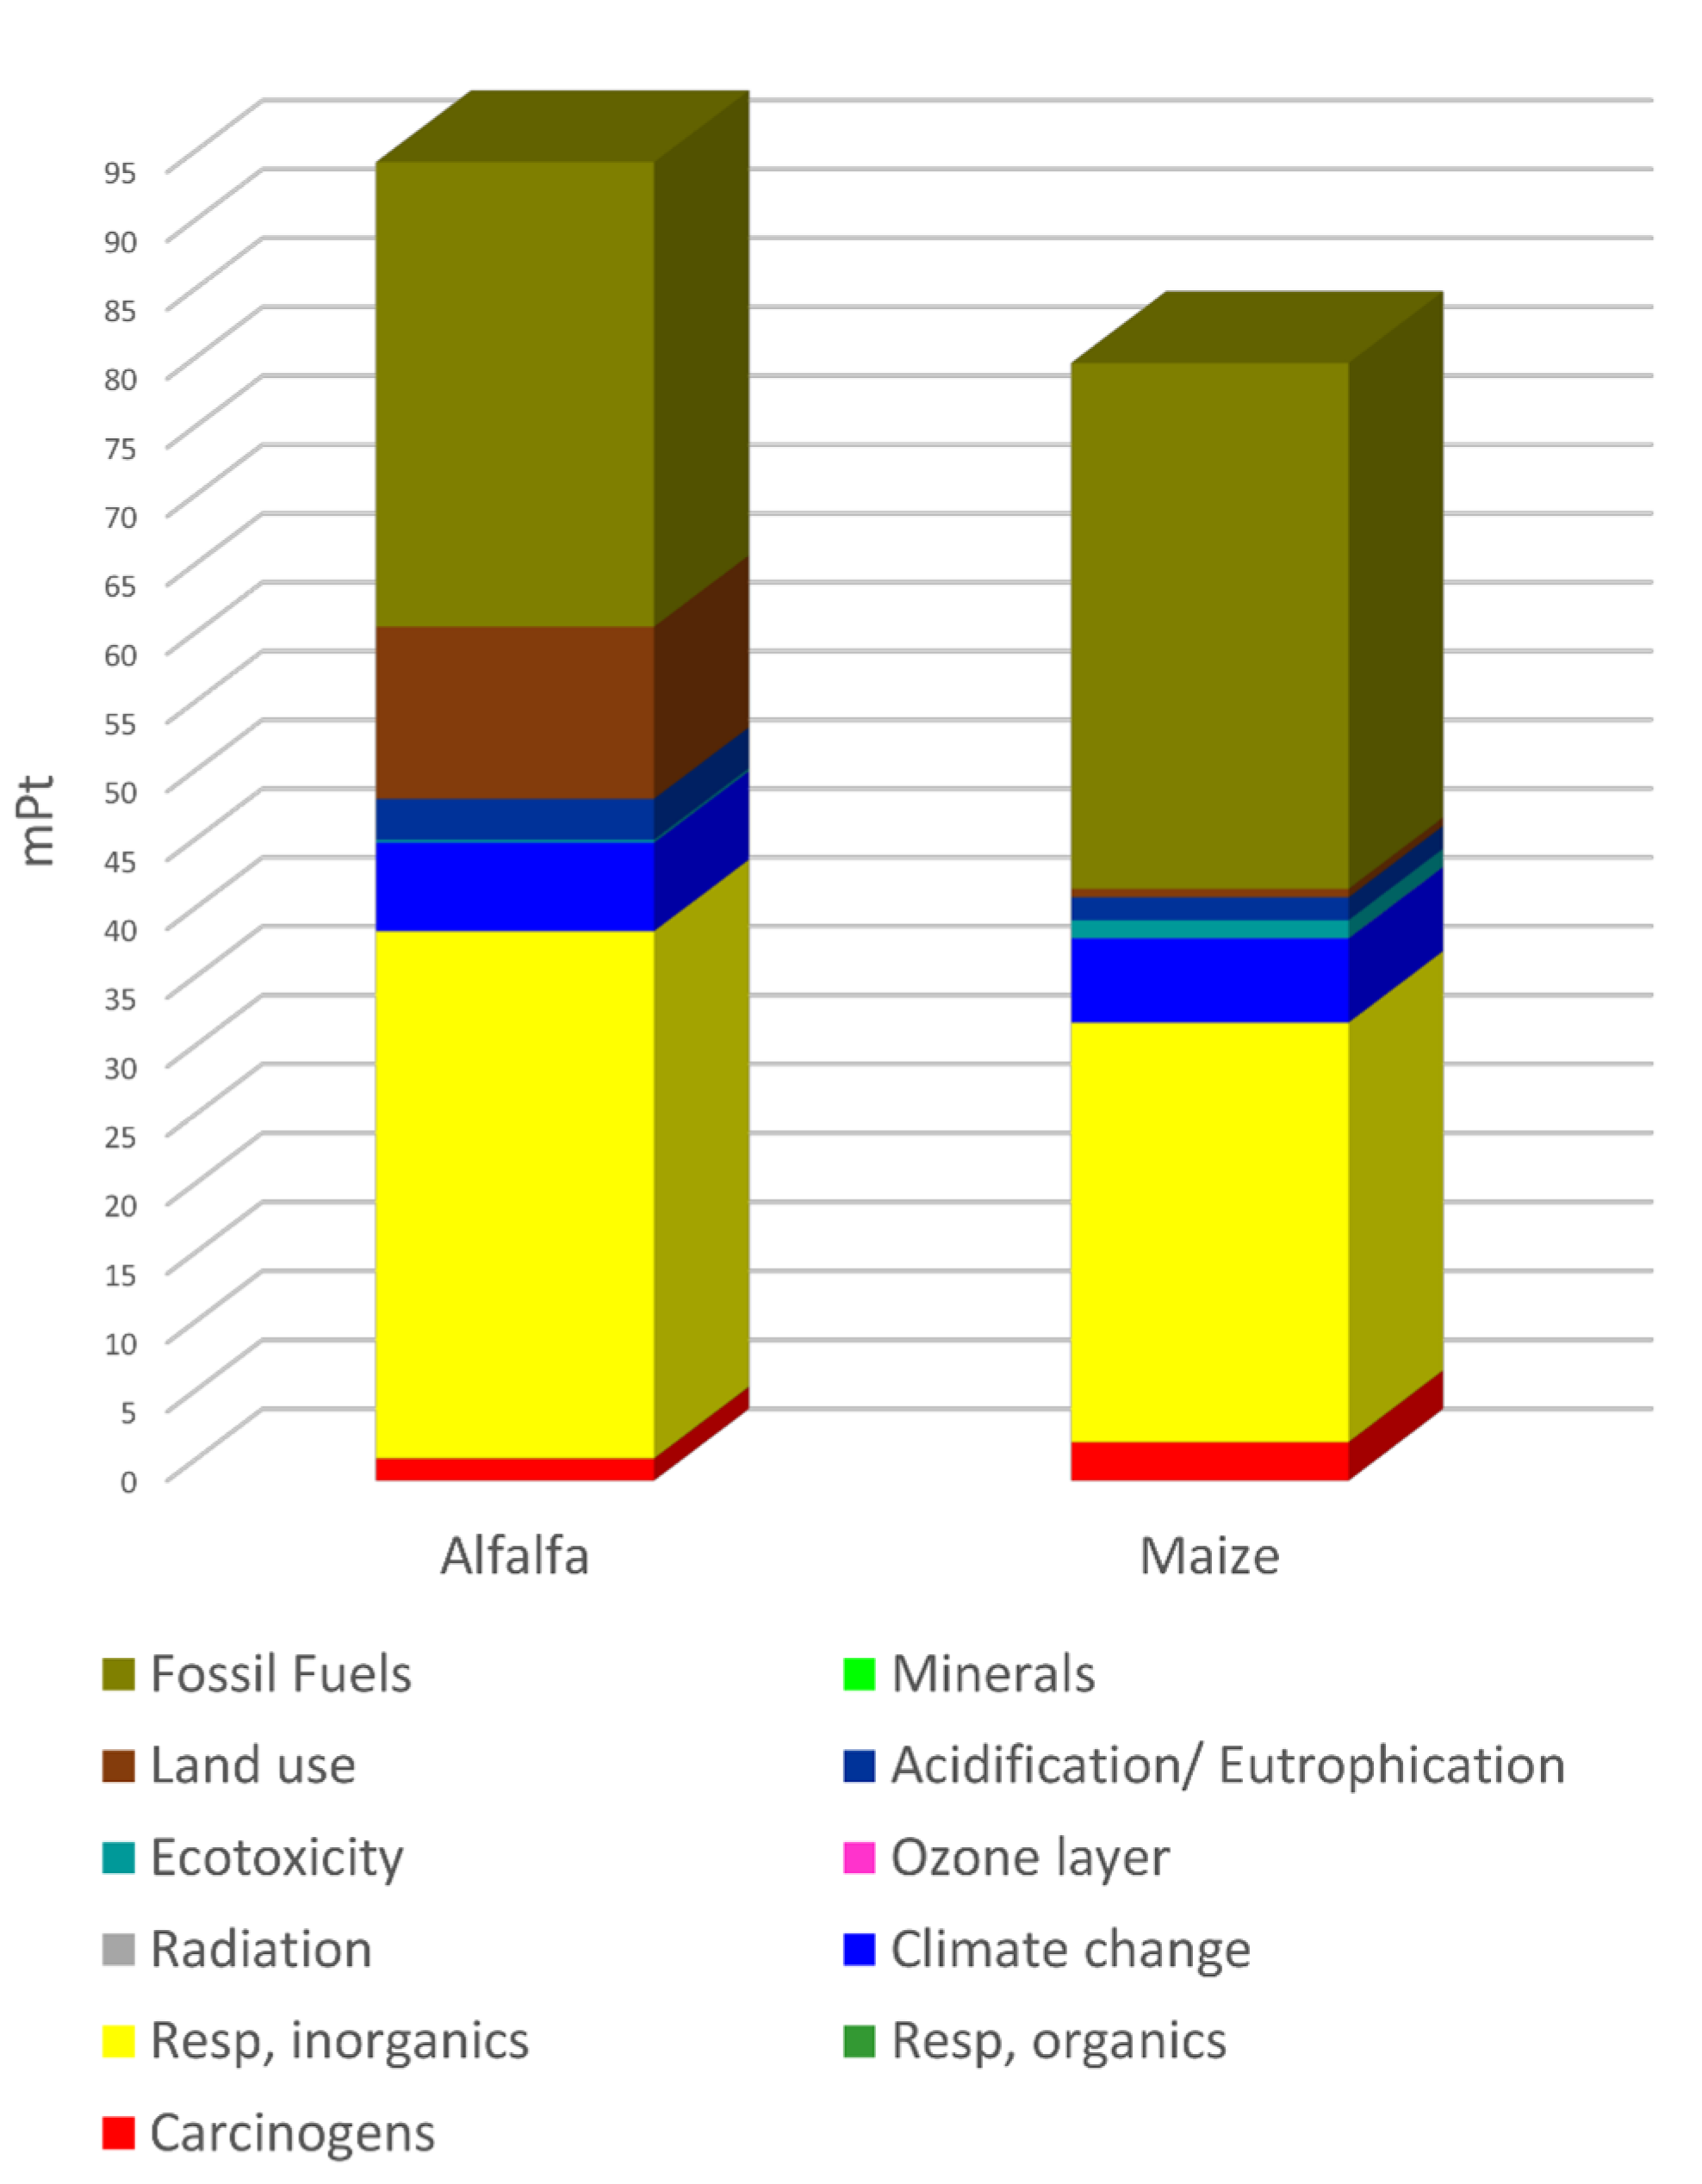
Considering the single point phase (Figure 6, Supplemental Materials Table S8), it is possibile to estimate the total score, i.e., the environmental impact, for the evaluated crops.
Considering the whole life cycle of alfalfa, one cubic meter of biogas from maize crop produces a total environmental impact approximately equal to 85% of one cubic meter of biogas produced by alfalfa.
In general the two crops produce not too different impacts according to the input flows that are considered. In fact, maize has a total impact of 81.14 Pt while alfalfa of 95.72 Pt.
At the same time the distribution of the impact considering each category is also very similar. In particular, the Carcinogens category is responsible for about 3% of the total load for maize; for alfalfa, the same category has an impact on the total score which is slightly lower, 1.7%. Respiratory inorganics category shows, the same situation: for alfalfa the contribution to the total amount is about 39.9%; for corn it is 37.44%. Fossil Fuels category also contributes in a considerable way for both crops. In this case, as for the Resp. inorganics category, the contribution on the total amount is 35.21% for the alfalfa and 47% for corn. The biggest difference is due to the Land use category: the contribution of this category to the total is much higher for alfalfa than maize.
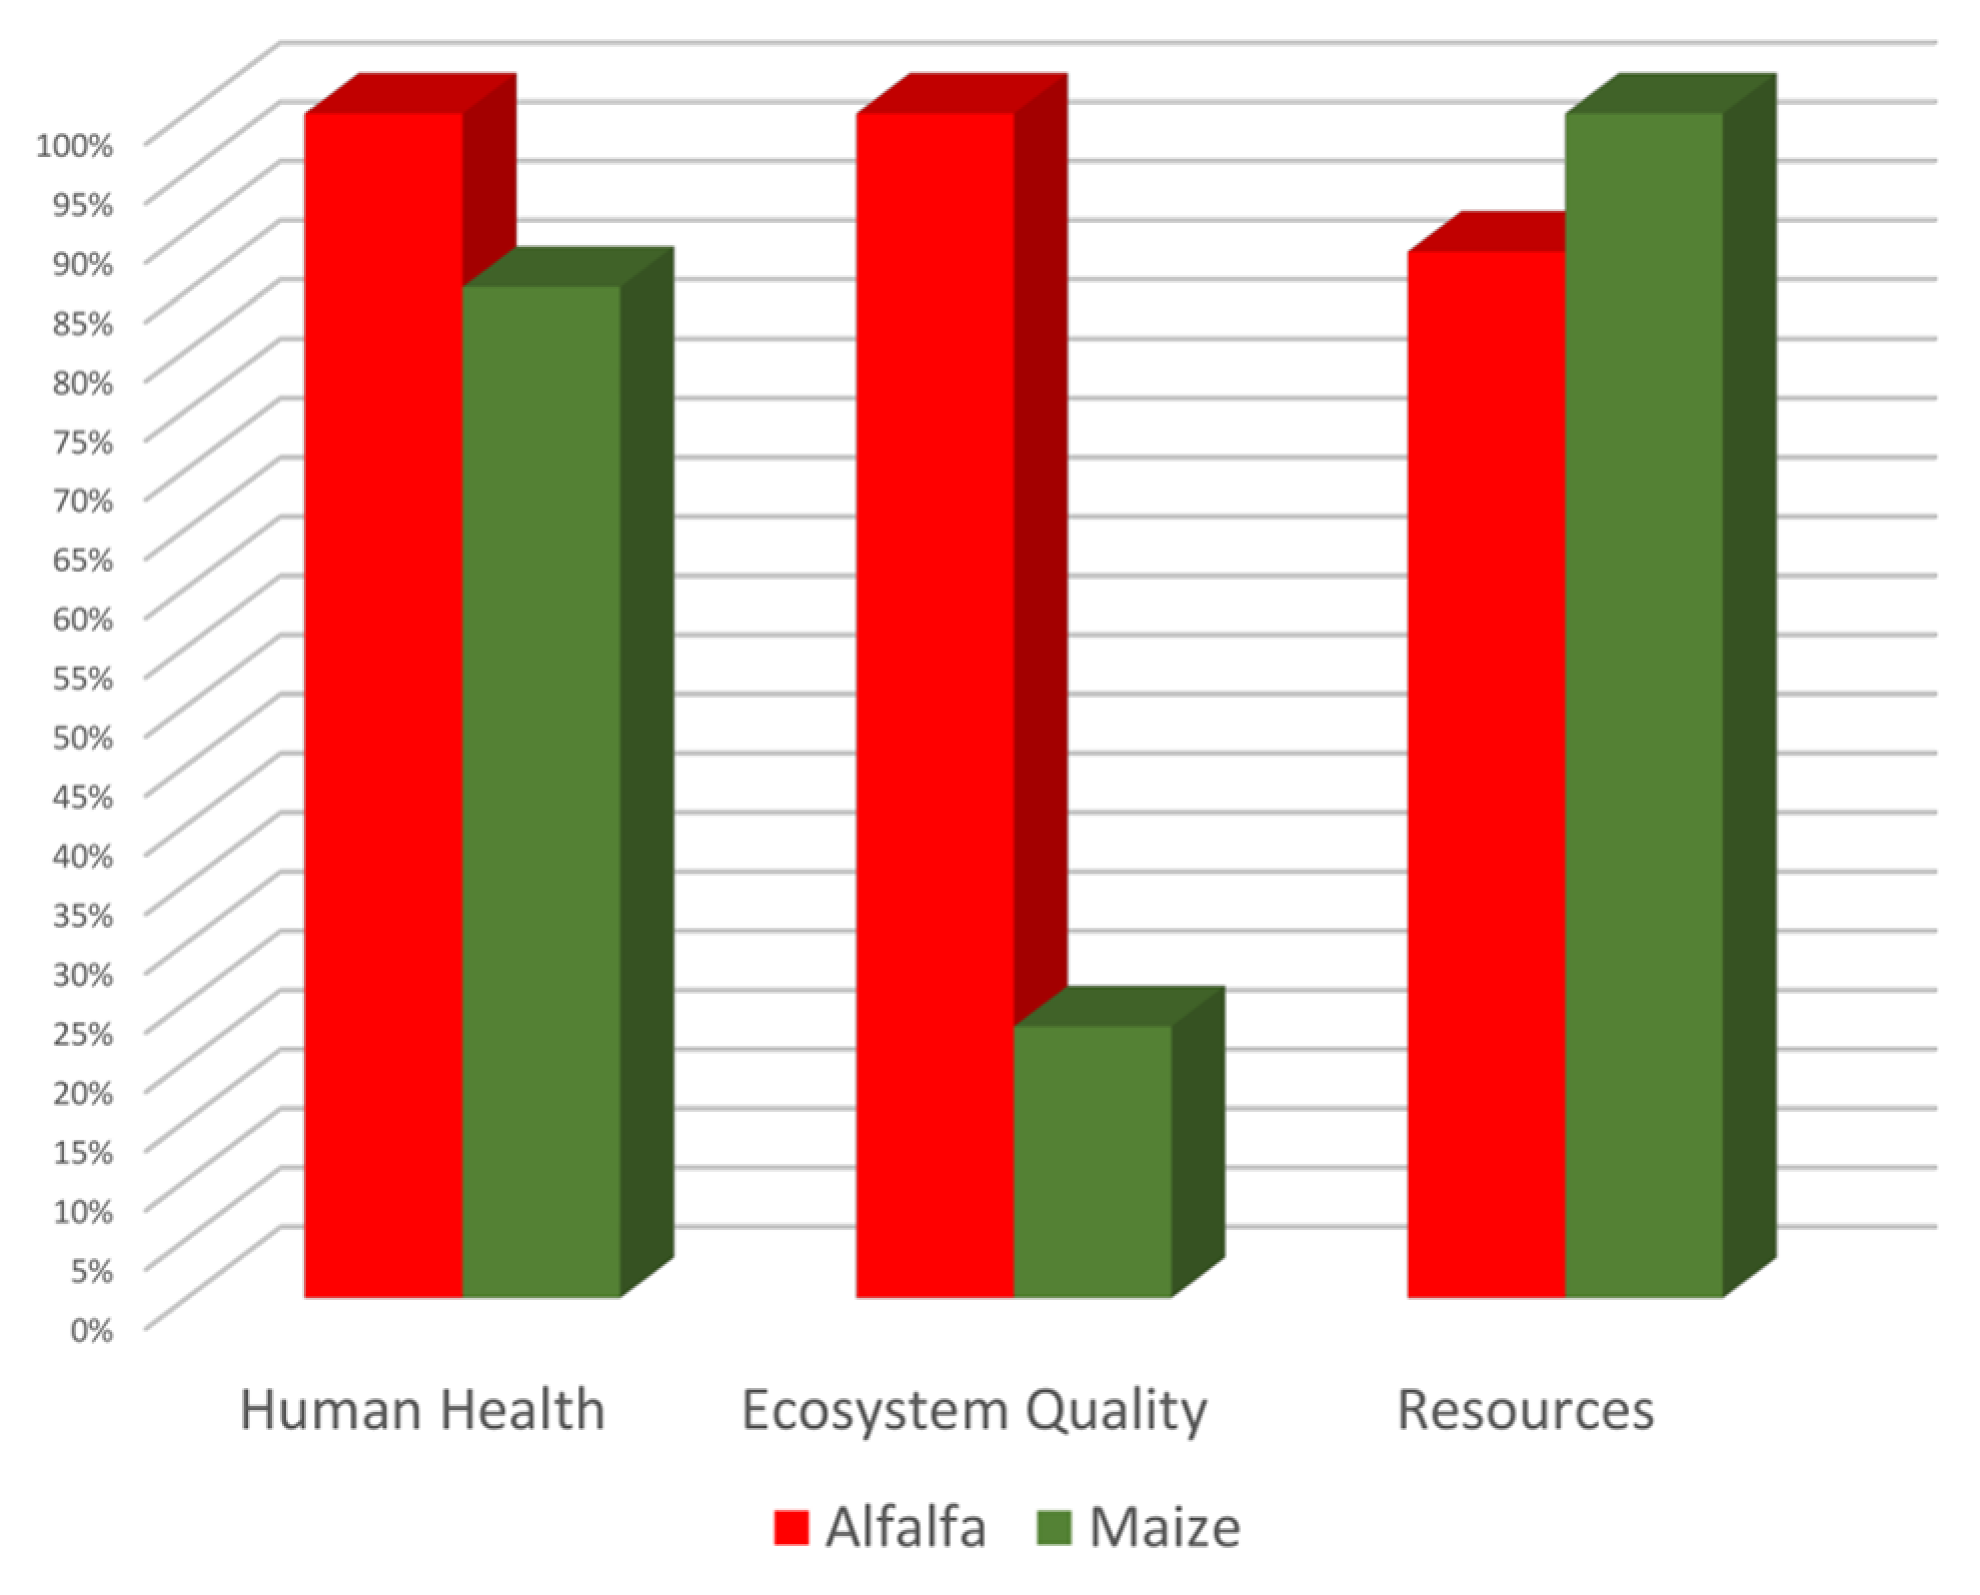
In Figure 7 and Supplemental Materials Table S9, the comparison between the 2 crops, in terms of damage categories, is shown.
Only for Resources category alfalfa has an impact of 88% compared to that of corn, for the other categories the impact is higher.
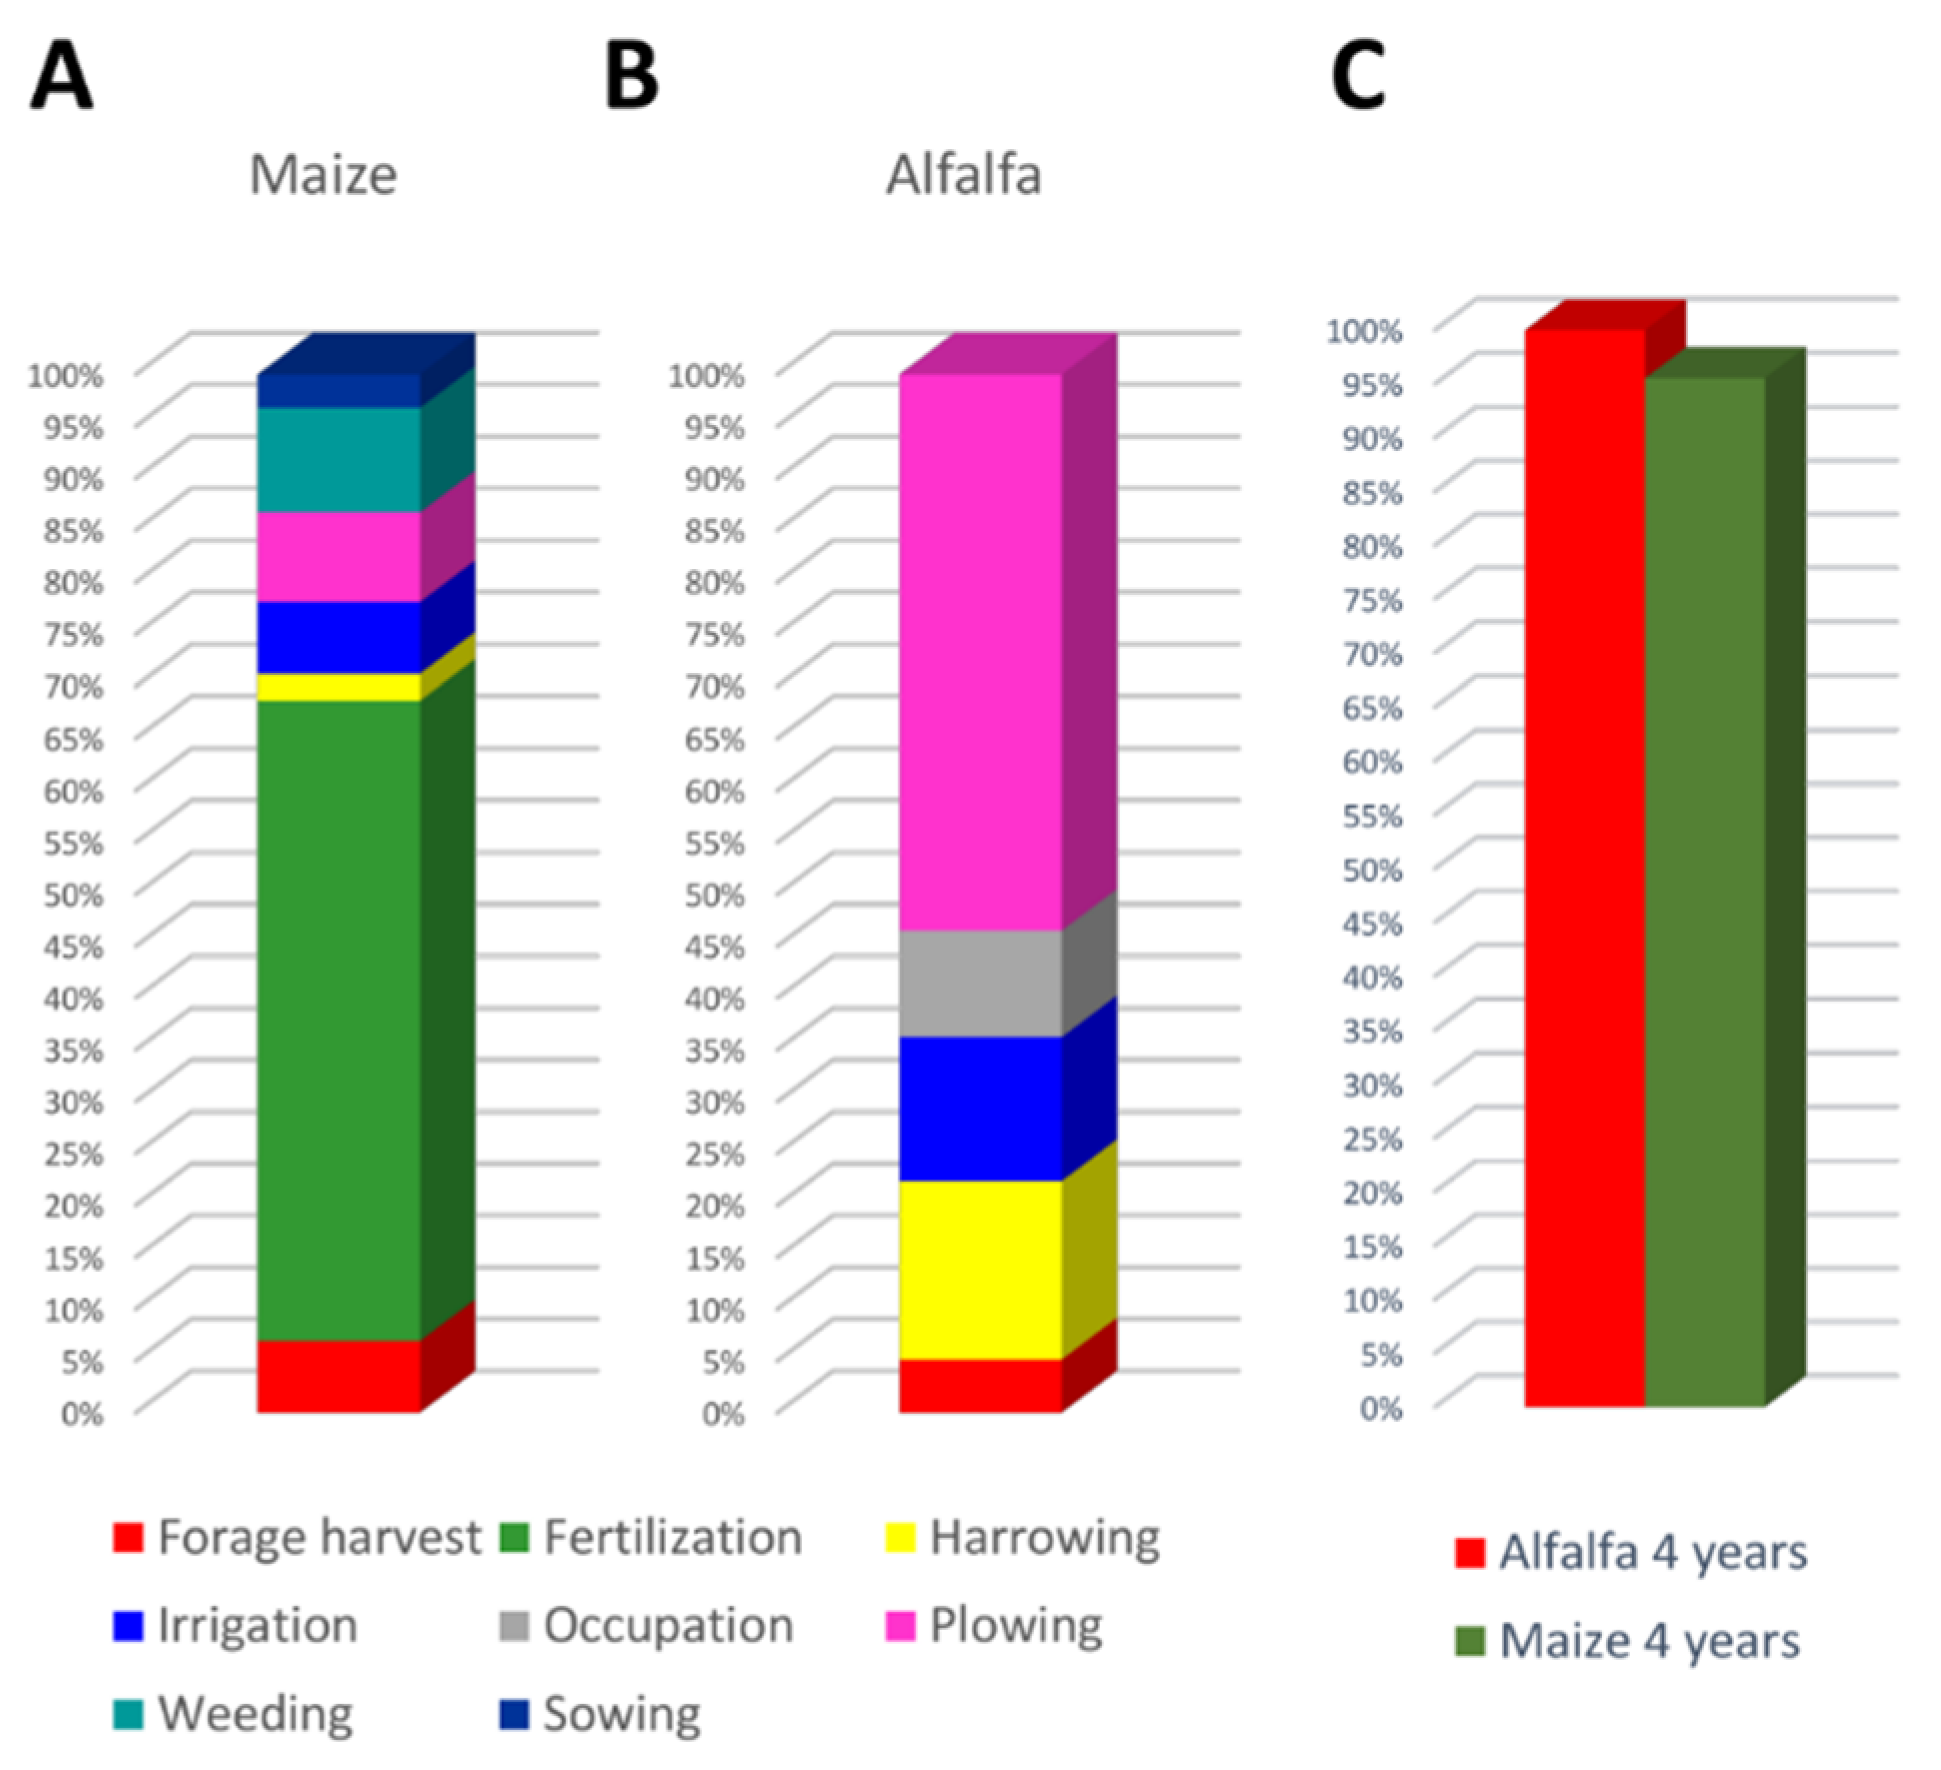
The following tables and images (Figure 8A,B and Supplemental Materials Tables S10 and S11) show the analysis results, expressed in kg CO2 eq per functional unit, according to the IPCC 2013 GWP 100y method.
In the characterization phase, the substances that affect a particular category of environmental impact, are multiplied by a factor which expresses its contribution. The outcome of the process is then shown in a scale from 0 to 100%. To evaluate the contributions of the various process inputs to the total score, the following data were extrapolated: the impacts associated to the first year (planting year) for maize and those of the first, second year (equal to the third year in terms of operations) and fourth year for alfalfa.
These results show the contribution of the total impact values for each agricultural phase. In particular, fertilization phase is responsible for 56% of total CO2 emitted into the environment. In this phase, the largest contribution to GHG emissions comes from the production and use of fertilizers, which alone emits about 0.095 kg of CO2 eq in the atmosphere.
A similar result was obtained through the Eco-indicator method for the Climate Change category with a score of 0.94 for the fertilization (61%) out of a total of 1.53 mPt.
To identify the cause of the total load, it is necessary to determine the most relevant unit processes that impact into the environment.
In the first year of alfalfa, fertilization is the responsible for most of the emissions of GHGs, as shown in Figure 8B and Supplemental Materials Table S11. This is largely due to the P-fertilizer production (0.25 Kg of CO2 eq) and N-fertilizer (0.04 Kg of CO2 eq) and to a lesser extent from the use of the agricultural machine intended for the purpose.
Forage harvest being the only operation in the years after the first, has a total impact of 0.0324 kg CO2 eq in the second and third year, and 0.0574 kg CO2 eq in the last year of alfalfa’s life cycle.
The equivalent CO2 is a unit of measurement that allows to weigh different GHG emissions with different climate-changing effects.
Corn impacts approximately only 5% less than alfalfa in terms of greenhouse gases (Figure 8C and Supplemental Materials Table S12).
The amount of emitted CO2 is a single indicator and, although it proves useful to indicate an important climate impact, it does not represent alone the overall environmental impact of a product.
4. Discussion
The comparative analysis of the environmental impact of corn and alfalfa was performed considering 1 m3 of biogas by LCA methodology. LCA analysis is subjected to uncertainty and variability, however it is currently the most accurate, comprehensive and rapid tool to assess the environmental impacts within a biological system [58]. LCA was used in the current study to compare the impact assessment for biogas production from two different crops: the most widely used maize crop and alfalfa. The results show a comparable total impact using alfalfa in comparison with maize. By considering the same functional unit (1 m3 of biogas from anaerobic digestion) and the same time horizon, 4 years, the results show that corn has an environmental impact which is around 85% the alfalfa impact using Eco-indicator method. The impact rises to 95% that of alfalfa if the IPCC method is considered.
In the case of Eco-indicator method, corn and alfalfa result to have differences in the score of environmental indicators. Major maize’s impacts can be explained with a greater energy demand for maize cultivation opposed to alfalfa which requires lower energy inputs. However, alfalfa presents a lower yield per hectare and a lower production of biogas referred to the unit of dry matter than maize.
Considering the first year of maize crop, the greatest contributions to the environmental impacts are due to the fertilization (63%) and the weeding processes. In particular, for the fertilization, the negative contribution derives from the production and use of fossil fuels and nitrogen and phosphorus fertilizers.
For the alfalfa crop, in the same year, the contribution to the total score is composed in a different way: the fertilization contributes about 44% of the environmental load; sowing and plowing contribute to 27 and 13.6% respectively.
The sowing phase, both for maize and alfalfa, has the major impacts in the following impact categories:
- -
- Carcinogens;
- -
- Resp. inorganics;
- -
- Acidification/Eutrophication;
- -
- Land use;
- -
- Fossil fuels.
In the second, third and fourth years, the impact for the maize crop is the same as in the first year, while, for alfalfa crop only the forage harvest phase is repeated, therefore, as shown in Figure 2, it is responsible for all the impact.
In general the most significant impacts category for both crops are represented by respiratory inorganics i.e., respiratory health risks resulting from winter smog caused by emissions of dust, sulphur, and nitrogen oxides to air. The second most relevant impact category is fossil fuel, that can be related to the amounts of fossil fuels used in the agrochemicals production and in crop related operations involving machinery. The mentioned main categories are most relevant in other similar studies on LCA for plant crops [51].
According to our results, it can be concluded that alfalfa succeeds in reducing some impacts thanks to the lower energy consumption (for example in water used for irrigation) and its capacity, as a multiannual crop, to survive for several years (there are no particular operations to be conducted in the years after the first one). Perennial forages are indeed currently proposed as second generation biofuels [35]. In contrast, its lower agricultural yield, contributes in a negative way for some indicators. As shown in Figure 7, the two categories Human health and Resources highlight opposite impact conditions that balance each other passing from the characterization phase to the normalization phase. Thus, the main difference between the two crops is given by the Ecosystem quality category which includes the Land Use category characterized by a greater impact for alfalfa. However, in the present case, the impact on Land Use was assessed as less significant as the calculation developed with SimaPro does not take in to account the fact that alfalfa is used in marginal areas, therefore not suitable for other types of crops without changing the intended use of the land that remains agricultural, which could generate problems for the farmer due to run-off effects, the presence of harmful animals as well as lack of income. Moreover, it is to be considered that alfalfa is a nitrogen fixing plant, which directly provides to the soil some of the components that are needed for its growth and maintenance. The most relevant aspect of alfalfa nitrogen fixation is that the symbiotically fixed nitrogen can be provided to a crop intercropped or in succession. Unfortunately, there are no current protocols in LCA analysis to take into account the contribution of alfalfa nitrogen fixation to the reduction of fertilization needs for following crops and also the amendment ability of alfalfa for soil quality. However, due to fixation, alfalfa requires a lower quantity of nitrogen during the fertilization phase. The reduced amount of nitrogen -based fertilizer in input can be considered as an indirect index of the nitrogen fixing ability. The contribution of fertilization in eutrophication/acidification (Figure 2) is present only in the first year unlike what happens for corn. The contribution is also due to phosphorous-based fertilizers which in some way hide the nitrogen-fixing properties of alfalfa.
The worst alfalfa behavior occurs during the first year when the yield is the lowest in its life; the scenario is improving in the following years, when alfalfa yield increases and the only operation that is performed is forage harvest.
The most recent worries about global warming have stimulated the application and the improvement of anaerobic digestion process for the production of biogas, which is a renewable and versatile energy source. It can be used for the production of heat and electricity, and fuel for transportation.
Therefore, those crops that have a strong power for energy purposes are of particular interest.
At the same time, we cannot underestimate the impacts associated with the great energy consumption required to cropping systems.
5. Conclusions
We conducted a preliminary environmental analysis of the cultivation of two plant species (alfalfa and maize) with the aim to find an energy crop with lower impacts than the more widely cultivated species such as maize itself.
Based on our results of LCA analysis, the environmental impacts of alfalfa are shown as very reasonable therefore alfalfa can be considered as a sustainable crop in agricultural scenarios where maize cultivation is not an option (ex. lack of irrigation possibility). Medicago sativa is a low energy-input crop which can grow in poorer environments compared to maize. Moreover, since it is a nitrogen-fixing plant, it is able, to reduce nitrate leaching and runoff, improve soil organic matter, and lower the need for fertilizer N on succeeding crops. Alfalfa may also be used to reduce excess N that is cycling on farms thus helping remediation of contaminated soil and water [49]. For this reason, alfalfa could be suggested as a biomass crop with a decent environmental impact in marginal lands able to support small farms and sustain local income and reducing also the competition of biomass crops for fertile soil more amenable to food crops cultivation [59]. Interestingly alfalfa has been recently evaluated with an LCA analysis as a bioethanol producing crop [60]. Economic convenience related to each bioenergy value chain (e.g., biogas) needs to be assessed according to relevant parameters (e.g., feed-in-tariffs). However, they should be sided by considerations related to environmental advantages of using low-impact crops that are not captured in market prices. Economic performance is considered as a major driver for the low adoption of legume crops by farmers, however a recent analysis show that forage legumes (including alfalfa) considered in rotations, achieve both economic and environmental benefits in the two considered regions because of relatively high yield, similar prices and better residual effects on subsequent crops [61].
Subsidies for otherwise economically uncompetitive biofuels are justified if their life-cycle environmental impacts are sufficiently less than for alternatives sector. Therefore decision-makers involved in the bioenergy sector should consider low-impact biomass in setting subsidies policies for energy production [62]. In fact, ecosystem services such as reduced nitrous oxide emission, nitrate leaching and increased biodiversity are not considered in farmers economic calculations and could justify policy support [63].
Supplementary Materials
The following are available online at https://www.mdpi.com/2227-9717/8/10/1285/s1. Table S1—Unit processes considered; Table S2—Maize’s impacts in a single year; Table S3—Comparison of alfalfa’s impacts in a useful life of 4 years; Table S4—Alfalfa’s impacts in the first year; Table S5—Alfalfa’s impacts in the second and third year; Table S6—Alfalfa’s impacts in the fourth year; Table S7—Comparison between the two crops in the characterization phases; Table S8—Comparison between the two crops in the single point phases; Table S9—Damage category values for the damage assessment phase; Table S10—Maize’s impacts in a single year (IPCC 2013); Table S11—Alfalfa’s impacts in the first year (IPCC 2013); Table S12—Impact values for the characterization phase (IPCC 2013)
Author Contributions
F.F.: LCA analysis, manuscript writing, work supervision; F.P.: data analysis and manuscript revision; D.L.: LCA analysis, work supervision; L.A.: LCA analysis, work supervision; O.C.: data collection, manuscript writing, work supervision. All authors have read and agreed to the published version of the manuscript.
Funding
This research was funded by Regione Umbria, Italy, project “Agroenergy” PSR 2007/2013–1.2.4; the APC was funded by vouchers from FP and OC and by ENEA Trisaia Research Center, Italy.
Acknowledgments
We thank Carlo Fuccello, Farm Estate Poggiovalle, Città della Pieve, Italy, for support in data collection. We are thankful to Maria Andreoli, Department of Agriculture, Food and Environment, University of Pisa, Italy, and Maria Teresa Petrone, ENEA, Italy, for helpful suggestions.
Conflicts of Interest
The authors declare no conflict of interests.
References
- Caputo, A. Rapporti ISPRA 220/2015 Emissioni Nazionali di Gas Serra Fattori Determinanti e Confronto con i Paesi Europei; ISPRA: Rome, Italy, 2015. [Google Scholar]
- Gielen, D.; Boshell, F.; Saygin, D.; Bazilian, M.D.; Wagner, N.; Gorini, R. The role of renewable energy in the global energy transformation. Energy Strateg. Rev. 2019, 24, 38–50. [Google Scholar] [CrossRef]
- IPCC. Global Warming of 1.5°C. An IPCC Special Report on the Impacts of Global Warming of 1.5°C above Pre-Industrial Levels and Related Global Greenhouse Gas Emission Pathways, in the Context of Strengthening the Global Response to the Threat of Climate Change, Sustainable Development, and Efforts to Eradicate Poverty; Masson-Delmotte, V., Zhai, P., Pörtner, H.-O., Roberts, D., Skea, J., Shukla, P.R., Pirani, A., Moufouma-Okia, W., Péan, C., Pidcock, R., et al., Eds.; In press.
- Wagner, G.; Kåberger, T.; Olai, S.; Oppenheimer, M.; Rittenhouse, K.; Sterner, T. Energy policy: Push renewables to spur carbon pricing. Nature 2015, 525, 27–29. [Google Scholar] [CrossRef] [PubMed]
- 2020 Climate & Energy Package|Climate Action. Available online: https://ec.europa.eu/clima/policies/strategies/2020_en (accessed on 7 July 2020).
- Martínez-Gutiérrez, E. Biogas production from different lignocellulosic biomass sources: Advances and perspectives. 3 Biotech 2018, 8, 1–18. [Google Scholar] [CrossRef] [PubMed]
- Reid, W.V.; Ali, M.K.; Field, C.B. The Future of Bioenergy; Stanford University: Stanford, CA, USA, 2020. [Google Scholar] [CrossRef]
- Tubiello, F.N.; Salvatore, M.; Rossi, S.; Ferrara, A.; Fitton, N.; Smith, P. The FAOSTAT database of greenhouse gas emissions from agriculture. Environ. Res. Lett. 2013, 8. [Google Scholar] [CrossRef]
- Thornley, P.; Gilbert, P.; Shackley, S.; Hammond, J. ScienceDirect Maximizing the greenhouse gas reductions from biomass: The role of life cycle assessment. Biomass Bioenergy 2015, 81, 35–43. [Google Scholar] [CrossRef]
- Pacala, S.; Socolow, R. Stabilization wedges: Solving the climate problem for the next 50 years with current technologies. Science 2004, 305, 968–972. [Google Scholar] [CrossRef] [PubMed]
- Smith, P.; Martino, D.; Cai, Z.; Gwary, D.; Janzen, H.; Kumar, P.; McCarl, B.; Ogle, S.; O’Mara, F.; Rice, C.; et al. Greenhouse gas mitigation in agriculture. Philos. Trans. R. Soc. B Biol. Sci. 2008, 363, 789–813. [Google Scholar] [CrossRef]
- Tilman, D.; Reich, P.B.; Knops, J.M.H. Biodiversity and ecosystem stability in a decade-long grassland experiment. Nature 2006, 441, 629–632. [Google Scholar] [CrossRef] [PubMed]
- Gelfand, I.; Sahajpal, R.; Zhang, X.; Izaurralde, R.C.; Gross, K.L.; Robertson, G.P. Sustainable bioenergy production from marginal lands in the US Midwest. Nature 2013, 493, 514–517. [Google Scholar] [CrossRef]
- Carlsson, G.; Mårtensson, L.M.; Prade, T.; Svensson, S.E.; Jensen, E.S. Perennial species mixtures for multifunctional production of biomass on marginal land. GCB Bioenergy 2017, 9, 191–201. [Google Scholar] [CrossRef]
- Mehmood, M.A.; Ibrahim, M.; Rashid, U.; Nawaz, M.; Ali, S.; Hussain, A.; Gull, M. Biomass production for bioenergy using marginal lands. Sustain. Prod. Consum. 2017, 9, 3–21. [Google Scholar] [CrossRef]
- Adler, P.R.; Del Grosso, S.J.; Parton, W.J. Life-cycle assessment of net greenhouse-gas flux for bioenergy cropping systems. Ecol. Appl. 2007, 17, 675–691. [Google Scholar] [CrossRef] [PubMed]
- Tilman, D.; Socolow, R.; Foley, J.A.; Hill, J.; Larson, E.; Lynd, L.; Pacala, S.; Reilly, J.; Searchinger, T.; Somerville, C.; et al. Beneficial biofuels—The food, energy, and environment trilemma. Science 2009, 325, 270–271. [Google Scholar] [CrossRef] [PubMed]
- Hill, J.; Nelson, E.; Tilman, D.; Polasky, S.; Tiffany, D. Environmental, economic, and energetic costs and benefits of biodiesel and ethanol biofuels. Proc. Natl. Acad. Sci. USA 2006, 103, 11206–11210. [Google Scholar] [CrossRef]
- Pulighe, G.; Bonati, G.; Colangeli, M.; Michela, M.; Traverso, L.; Lupia, F.; Khawaja, C.; Janssen, R.; Fava, F. Ongoing and emerging issues for sustainable bioenergy production on marginal lands in the Mediterranean regions. Renew. Sustain. Energy Rev. 2019, 103, 58–70. [Google Scholar] [CrossRef]
- Werling, B.P.; Dickson, T.L.; Isaacs, R.; Gaines, H.; Gratton, C.; Gross, K.L.; Liere, H.; Malmstrom, C.M.; Meehan, T.D.; Ruan, L.; et al. Perennial grasslands enhance biodiversity and multiple ecosystem services in bioenergy landscapes. Proc. Natl. Acad. Sci. USA 2014, 111, 1652–1657. [Google Scholar] [CrossRef]
- Scordia, D.; Cosentino, S.L. Perennial energy grasses: Resilient crops in a changing european agriculture. Agriculture 2019, 9, 169. [Google Scholar] [CrossRef]
- Kircher, M. Sustainability of biofuels and renewable chemicals production from biomass. Curr. Opin. Chem. Biol. 2015, 29, 26–31. [Google Scholar] [CrossRef]
- Yang, L.; Ge, X.; Wan, C.; Yu, F.; Li, Y. Progress and perspectives in converting biogas to transportation fuels. Renew. Sustain. Energy Rev. 2014, 40, 1133–1152. [Google Scholar] [CrossRef]
- Pääkkönen, A.; Aro, K.; Aalto, P.; Konttinen, J.; Kojo, M. The Potential of Biomethane in Replacing Fossil Fuels in Heavy Transport—A Case Study on Finland. Sustainability 2019, 11, 4570. [Google Scholar] [CrossRef]
- Nkoa, R. Agricultural benefits and environmental risks of soil fertilization with anaerobic digestates: A review. Agron. Sustain. Dev. 2014, 34, 473–492. [Google Scholar] [CrossRef]
- Baştabak, B.; Koçar, G. A review of the biogas digestate in agricultural framework. J. Mater. Cycles Waste Manag. 2020, 22, 1318–1327. [Google Scholar] [CrossRef]
- Bahrs, E.; Angenendt, E. Status quo and perspectives of biogas production for energy and material utilization. Gcb Bioenergy 2019, 11, 9–20. [Google Scholar] [CrossRef]
- Daniel-gromke, J.; Rensberg, N.; Denysenko, V.; Stinner, W. Current Developments in Production and Utilization of Biogas and Biomethane in Germany. Chem. Ing. Tech. 2018, 90, 17–35. [Google Scholar] [CrossRef]
- EurObserv’ER, Biogas Barometer, Study carried out in the frame of EurObserv’ER project funded by the European Union under contract no. ENER/C2/2016-487/SI2.742173. 2017. Available online: https://www.eurobserv-er.org/pdf/2016/EurObservER-Annual-Overview-2016-EN.pdf (accessed on 6 August 2020).
- Benato, A.; Macor, A. Italian biogas plants: Trend, subsidies, cost, biogas composition and engine emissions. Energies 2019, 12, 979. [Google Scholar] [CrossRef]
- Whiting, A.; Azapagic, A. Life cycle environmental impacts of generating electricity and heat from biogas produced by anaerobic digestion. Energy 2014, 70, 181–193. [Google Scholar] [CrossRef]
- Decreto Ministeriale 6 Luglio 2012 ed Allegati—Incentivi per Energia da Fonti Rinnovabili Elettriche Non Fotovoltaiche. Available online: https://www.mise.gov.it/index.php/it/normativa/decreti-ministeriali/2023799-decreto-ministeriale-6-luglio-2012-ed-allegati-incentivi-per-energia-da-fonti-rinnovabili-elettriche-non-fotovoltaiche (accessed on 15 July 2020).
- Annuario Dell’agricoltura Italiana—Annuario Dell’agricoltura Italiana—Politiche e Bioeconomia—CREA. Available online: https://www.crea.gov.it/web/politiche-e-bioeconomia/-/annuario-dell-agricoltura-italiana (accessed on 15 July 2020).
- Lind, S.E.; Shurpali, N.J.; Peltola, O.; Mammarella, I.; Hyvönen, N.; Maljanen, M.; Räty, M.; Virkajärvi, P.; Martikainen, P.J. Carbon dioxide exchange of a perennial bioenergy crop cultivation on a mineral soil. Biogeosciences 2016, 13, 1255–1268. [Google Scholar] [CrossRef]
- Sanderson, M.; Adler, P. Perennial Forages as Second Generation Bioenergy Crops. Int. J. Mol. Sci. 2008, 9, 768–788. [Google Scholar] [CrossRef]
- Schmeer, M.; Loges, R.; Dittert, K.; Senbayram, M.; Horn, R. Soil & Tillage Research Legume-based forage production systems reduce nitrous oxide emissions. Soil Tillage Res. 2014, 143, 17–25. [Google Scholar] [CrossRef]
- ISO—ISO 14040:2006—Environmental Management—Life Cycle Assessment—Principles and Framework. Available online: https://www.iso.org/standard/37456.html (accessed on 16 July 2020).
- ISO—ISO 14044:2006—Environmental Management—Life Cycle Assessment—Requirements and Guidelines. Available online: https://www.iso.org/standard/38498.html (accessed on 16 July 2020).
- Proietti, P.; Sdringola, P.; Brunori, A.; Ilarioni, L.; Nasini, L.; Regni, L.; Pelleri, F.; Desideri, U.; Proietti, S. Assessment of carbon balance in intensive and extensive tree cultivation systems for oak, olive, poplar and walnut plantation. J. Clean. Prod. 2016, 112, 2613–2624. [Google Scholar] [CrossRef]
- Weidema, B. Assessing the Environmental Impact of Agriculture; Burleigh Dodds Science Publishing: Cambridge, UK, 2019; ISBN 9781786762283. [Google Scholar]
- Fusi, A.; Bacenetti, J.; Fiala, M.; Azapagic, A. Life Cycle Environmental Impacts of Electricity from Biogas Produced by Anaerobic Digestion. Front. Bioeng. Biotechnol. 2016, 4, 26. [Google Scholar] [CrossRef] [PubMed]
- Samac, D.A.; Jung, H.-J.G.; Lamb, J.F.S. Development of Alfalfa (Medicago sativa L.) as a Feedstock for Production of Ethanol and Other Bioproducts. Chem. Ind. N. Y. Marcel Dekker 2006, 112, 79. [Google Scholar]
- Samac, D.A.; Bucciarelli, B.; Miller, S.S.; Yang, S.S.; O’Rourke, J.A.; Shin, S.; Vance, C.P. Transgene silencing of sucrose synthase in alfalfa (medicago sativa L.) stem vascular tissue suggests a role for invertase in cell wall cellulose synthesis. BMC Plant Biol. 2015, 15. [Google Scholar] [CrossRef] [PubMed]
- Desideri, U.; Arcioni, L.; Leonardi, D.; Cesaretti, L.; Perugini, P.; Agabitini, E.; Evangelisti, N. Design of a multipurpose “zero energy consumption” building according to european directive 2010/31/EU: Architectural and technical plants solutions. Energy 2013, 58, 157–167. [Google Scholar] [CrossRef]
- Desideri, U.; Proietti, S.; Zepparelli, F.; Sdringola, P.; Bini, S. Life Cycle Assessment of a ground-mounted 1778 kW p photovoltaic plant and comparison with traditional energy production systems. Appl. Energy 2012, 97, 930–943. [Google Scholar] [CrossRef]
- Bessou, C.; Basset-Mens, C.; Tran, T.; Benoist, A.; Bessou, C.; Basset-Mens, C.; Tran, T.; Benoist, A. LCA applied to perennial cropping systems: A review focused on the farm stage LCA applied to perennial cropping systems: A review focused on the farm stage LCA Applied to Perennial Cropping Systems: A Review Focused on the Farm Stage. Int. J. Life Cycle Assess. 2013. [Google Scholar] [CrossRef]
- Meegoda, J.N.; Li, B.; Patel, K.; Wang, L.B. A review of the processes, parameters, and optimization of anaerobic digestion. Int. J. Environ. Res. Public Health 2018, 15, 2224. [Google Scholar] [CrossRef]
- Bacenetti, J.; Fusi, A.; Negri, M.; Guidetti, R.; Fiala, M. Environmental assessment of two different crop systems in terms of biomethane potential production. Sci. Total 2013. [Google Scholar] [CrossRef]
- Russelle, M. The Environmental Impacts of N2 Fixation by Alfalfa. In Proceedings of the 2004 National Alfalfa Symposium and 34th California Alfalfa Symposium, San Diego, CA, USA, 13–15 December 2004; pp. 57–62. [Google Scholar]
- VV. AA. SimaPro Database Manual Methods Library; PRé: Amersfoort, The Netherlands, 2020. [Google Scholar]
- Fernández-Coppel, I.A.; Barbosa-Evaristo, A.; Corrêa-Guimarães, A.; Martín-Gil, J.; Navas-Gracia, L.M.; Martín-Ramos, P. Life cycle analysis of macauba palm cultivation: A promising crop for biofuel production. Ind. Crops Prod. 2018, 125, 556–566. [Google Scholar] [CrossRef]
- Klebson de Medeiros Silva, W.; Neves, T.I.; de Souza Silva, C.; Carvalho, M.; Abrahão, R. Sustainable enhancement of sugarcane fertilization for energy purposes in hot climates. Renew. Energy 2020, 159, 547–552. [Google Scholar] [CrossRef]
- Netherlands Ministry of Housing, Spatial Planning and the Environment. Ministry of Housing, Spatial Planning and the Environment Communications Directorate Eco-Indicator 99 Manual for Designers A Damage Oriented Method for Life Cycle Impact Assessment; Netherlands Ministry of Housing, Spatial Planning and the Environment: The Hague, The Netherlands, 2000. [Google Scholar]
- Stocker, T.F.; Qin, D.; Plattner, G.K.; Tignor, M.M.B.; Allen, S.K.; Boschung, J.; Nauels, A.; Xia, Y.; Bex, V.; Midgley, P.M. Climate Change 2013—The Physical Science Basis; Intergovernmental Panel on Climate Change, Ed.; Cambridge University Press: Cambridge, UK, 2014; Volume 9781107057999, ISBN 9781107415324. [Google Scholar]
- ISO—ISO/TS 14067:2013—Greenhouse Gases—Carbon Footprint of Products—Requirements and Guidelines for Quantification and Communication. Available online: https://www.iso.org/standard/59521.html (accessed on 15 July 2020).
- González-García, S.; Bacenetti, J.; Negri, M.; Fiala, M.; Arroja, L. Comparative environmental performance of three different annual energy crops for biogas production in Northern Italy. J. Clean. Prod. 2013, 43, 71–83. [Google Scholar] [CrossRef]
- Bacenetti, J.; Fusi, A.; Guidetti, R.; Fiala, M. Life Cycle Assessment of maize cultivation for biogas production. J. Agric. Eng. 2013, 44. [Google Scholar] [CrossRef]
- Fazio, S.; Monti, A. Life cycle assessment of different bioenergy production systems including perennial and annual crops. Biomass Bioenergy 2011, 35, 4868–4878. [Google Scholar] [CrossRef]
- Karwacka, M.; Ciurzyńska, A.; Lenart, A.; Janowicz, M. Sustainable Development in the Agri-Food Sector in Terms of the Carbon Footprint: A Review. Sustainability 2020, 12, 6463. [Google Scholar] [CrossRef]
- González-García, S.; Moreira, M.T.; Feijoo, G. Environmental performance of lignocellulosic bioethanol production from Alfalfa stems. Biofuels Bioprod. Biorefining 2010, 4, 118–131. [Google Scholar] [CrossRef]
- Reckling, M.; Bergkvist, G.; Watson, C.A.; Stoddard, F.L.; Zander, P.M.; Walker, R.L.; Pristeri, A.; Toncea, I.; Bachinger, J. Trade-Offs between Economic and Environmental Impacts of Introducing Legumes into Cropping Systems. Front. Plant Sci. 2016, 7, 669. [Google Scholar] [CrossRef]
- Hill, J.; Polasky, S.; Nelson, E.; Tilman, D.; Huo, H.; Ludwig, L.; Neumann, J.; Zheng, H.; Bonta, D. Climate change and health costs of air emissions from biofuels and gasoline. Proc. Natl. Acad. Sci. USA 2009, 106, 2077–2082. [Google Scholar] [CrossRef]
- Zander, P.; Amjath-Babu, T.S.; Preissel, S.; Reckling, M.; Bues, A.; Schläfke, N.; Kuhlman, T.; Bachinger, J.; Uthes, S.; Stoddard, F.; et al. Grain legume decline and potential recovery in European agriculture: A review. Agron. Sustain. Dev. 2016, 36, 26. [Google Scholar] [CrossRef]
Publisher’s Note: MDPI stays neutral with regard to jurisdictional claims in published maps and institutional affiliations. |
Figure 1.
System boundaries of (A) maize (annual crop) and (B) alfalfa (poliannual crop).

Figure 2.
Comparison of maize’s (A) and alfalfa (B) impacts in milli-Points (mPt) in a useful life of 4 years.
Figure 2.
Comparison of maize’s (A) and alfalfa (B) impacts in milli-Points (mPt) in a useful life of 4 years.

Figure 3.
Maize’s impacts in milli-Points (mPt) in a single year (A); alfalfa’s impacts in milli-Points (mPt) in the first year (B).
Figure 3.
Maize’s impacts in milli-Points (mPt) in a single year (A); alfalfa’s impacts in milli-Points (mPt) in the first year (B).

Figure 4.
Alfalfa’s impacts in the second-third year (A) and in the fourth year (B) in milli-Points (mPt).
Figure 4.
Alfalfa’s impacts in the second-third year (A) and in the fourth year (B) in milli-Points (mPt).

Figure 5.
Comparison between the two crops in the characterization phases.

Figure 6.
Comparison between the combined impacts in milli-Points (mPt) two crops in the single point phases.
Figure 6.
Comparison between the combined impacts in milli-Points (mPt) two crops in the single point phases.

Figure 7.
Comparison between the two crops damage assessment phase.

Figure 8.
Maize’s combined impacts in milli-Points (mPt) in a single year (A); alfalfa’s combined impacts in milli-Points (mPt) in the first year (B) (IPCC 2013 GWP 100y). (C) Comparison between the two crops characterization phase (IPCC 2013 GWP 100y).
Figure 8.
Maize’s combined impacts in milli-Points (mPt) in a single year (A); alfalfa’s combined impacts in milli-Points (mPt) in the first year (B) (IPCC 2013 GWP 100y). (C) Comparison between the two crops characterization phase (IPCC 2013 GWP 100y).


Table 1.
Yields of maize and alfalfa.
| Maize | Alfalfa | |||
|---|---|---|---|---|
| 1st Year | 2nd–3rd Years | 4th Year | ||
| ton DS/ha | 20 | 3.4 | 8 | 4.5 |
| % of OS | 95% | 90% | 90% | 90% |
| m3 of biogas for ton ODS | 650 | 530 | 530 | 530 |
Table 2.
Input material flows.
| Maize | Alfalfa | Power Tractor | Machine | |
|---|---|---|---|---|
| Occupation | 1 ha | 1 ha | ||
| Plowing | 220 Hp | Quadrivomere plow | ||
| Fuel | 50 L | 50 L | ||
| Lubricating oil | 0.5 Kg | 0.5 Kg | ||
| Harrowing | 110 Hp | Rotating arrow | ||
| Fuel | 15 L | 15 L | ||
| Lubricating oil | 0.2 Kg | 0.2 Kg | ||
| Sowing | 85 Hp | Seeder | ||
| Fuel | 10 L | 10 L | ||
| Lubricating oil | 0.2 Kg | 0.2 Kg | ||
| Seed | 20 Kg | 50 Kg | ||
| Fertilization | 80 Hp | Fertilizer spreader | ||
| Fuel | 15 L | 5 L | ||
| Lubricating oil | 0.1 Kg | 0.1 Kg | ||
| N fertlizer | 220 Kg | 15 Kg | ||
| P fertilizer | 80 Kg | 150 Kg | ||
| Weeding | 170 Hp | Sprayer | ||
| Fuel | 45 L | |||
| Lubricating oil | 0.1 Kg | - | ||
| Glyphosate | 4 L | |||
| Irrigation | 400 Hp | Irrigator | ||
| Fuel | 40 L | |||
| Lubricating oil | 0.3 Kg | - | ||
| Water | 400 m3 | |||
| Forage harvest | 400 Hp | Specific machine for the type of crop | ||
| Fuel | 40 L | 40 L | ||
| Lubricating oil | 1 Kg | 1 Kg |
Table 3.
Impact and damage categories for Eco-Indicator method.
| Carcinogens substances (DALY) | Human Health (DALY) |
| Respiratory effect (organic) (DALY) | |
| Respiratory effect (inorganic) (DALY) | |
| Climate change (DALY) | |
| Ionising radiation (DALY) | |
| Ozone layer depletion (DALY) | |
| Ecotoxicity (PAF·m2·yr) | Ecosystem Quality (PAF/PDF) |
| Acidification/Eutrophication (PDF·m2·yr) | |
| Land use (PDF·m2·yr) | |
| Minerals (MJ Surplus) | Resources (MJ Surplus) |
| Fossil fuels (MJ Surplus) |
© 2020 by the authors. Licensee MDPI, Basel, Switzerland. This article is an open access article distributed under the terms and conditions of the Creative Commons Attribution (CC BY) license (http://creativecommons.org/licenses/by/4.0/).
Share and Cite
MDPI and ACS Style
Filippa, F.; Panara, F.; Leonardi, D.; Arcioni, L.; Calderini, O. Life Cycle Assessment Analysis of Alfalfa and Corn for Biogas Production in a Farm Case Study. Processes 2020, 8, 1285. https://doi.org/10.3390/pr8101285
AMA Style
Filippa F, Panara F, Leonardi D, Arcioni L, Calderini O. Life Cycle Assessment Analysis of Alfalfa and Corn for Biogas Production in a Farm Case Study. Processes. 2020; 8(10):1285. https://doi.org/10.3390/pr8101285
Chicago/Turabian StyleFilippa, Fabiola, Francesco Panara, Daniela Leonardi, Livia Arcioni, and Ornella Calderini. 2020. "Life Cycle Assessment Analysis of Alfalfa and Corn for Biogas Production in a Farm Case Study" Processes 8, no. 10: 1285. https://doi.org/10.3390/pr8101285
Note that from the first issue of 2016, this journal uses article numbers instead of page numbers. See further details here.