Role of the Mitochondrial Pyruvate Carrier in the Occurrence of Metabolic Inflexibility in Drosophila melanogaster Exposed to Dietary Sucrose

 ,
,
Abstract
:
1. Introduction
2. Results
2.1. MPC1 Gene Expression
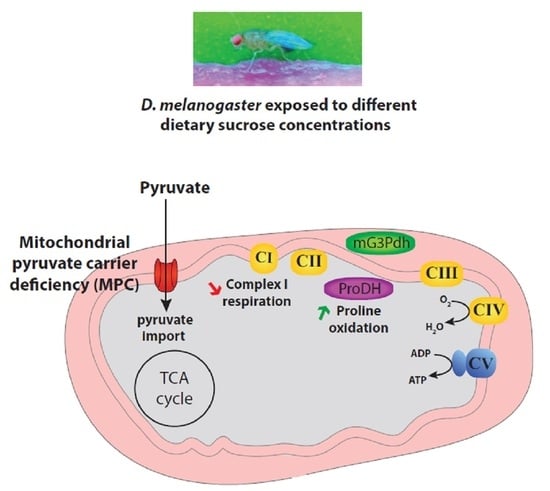
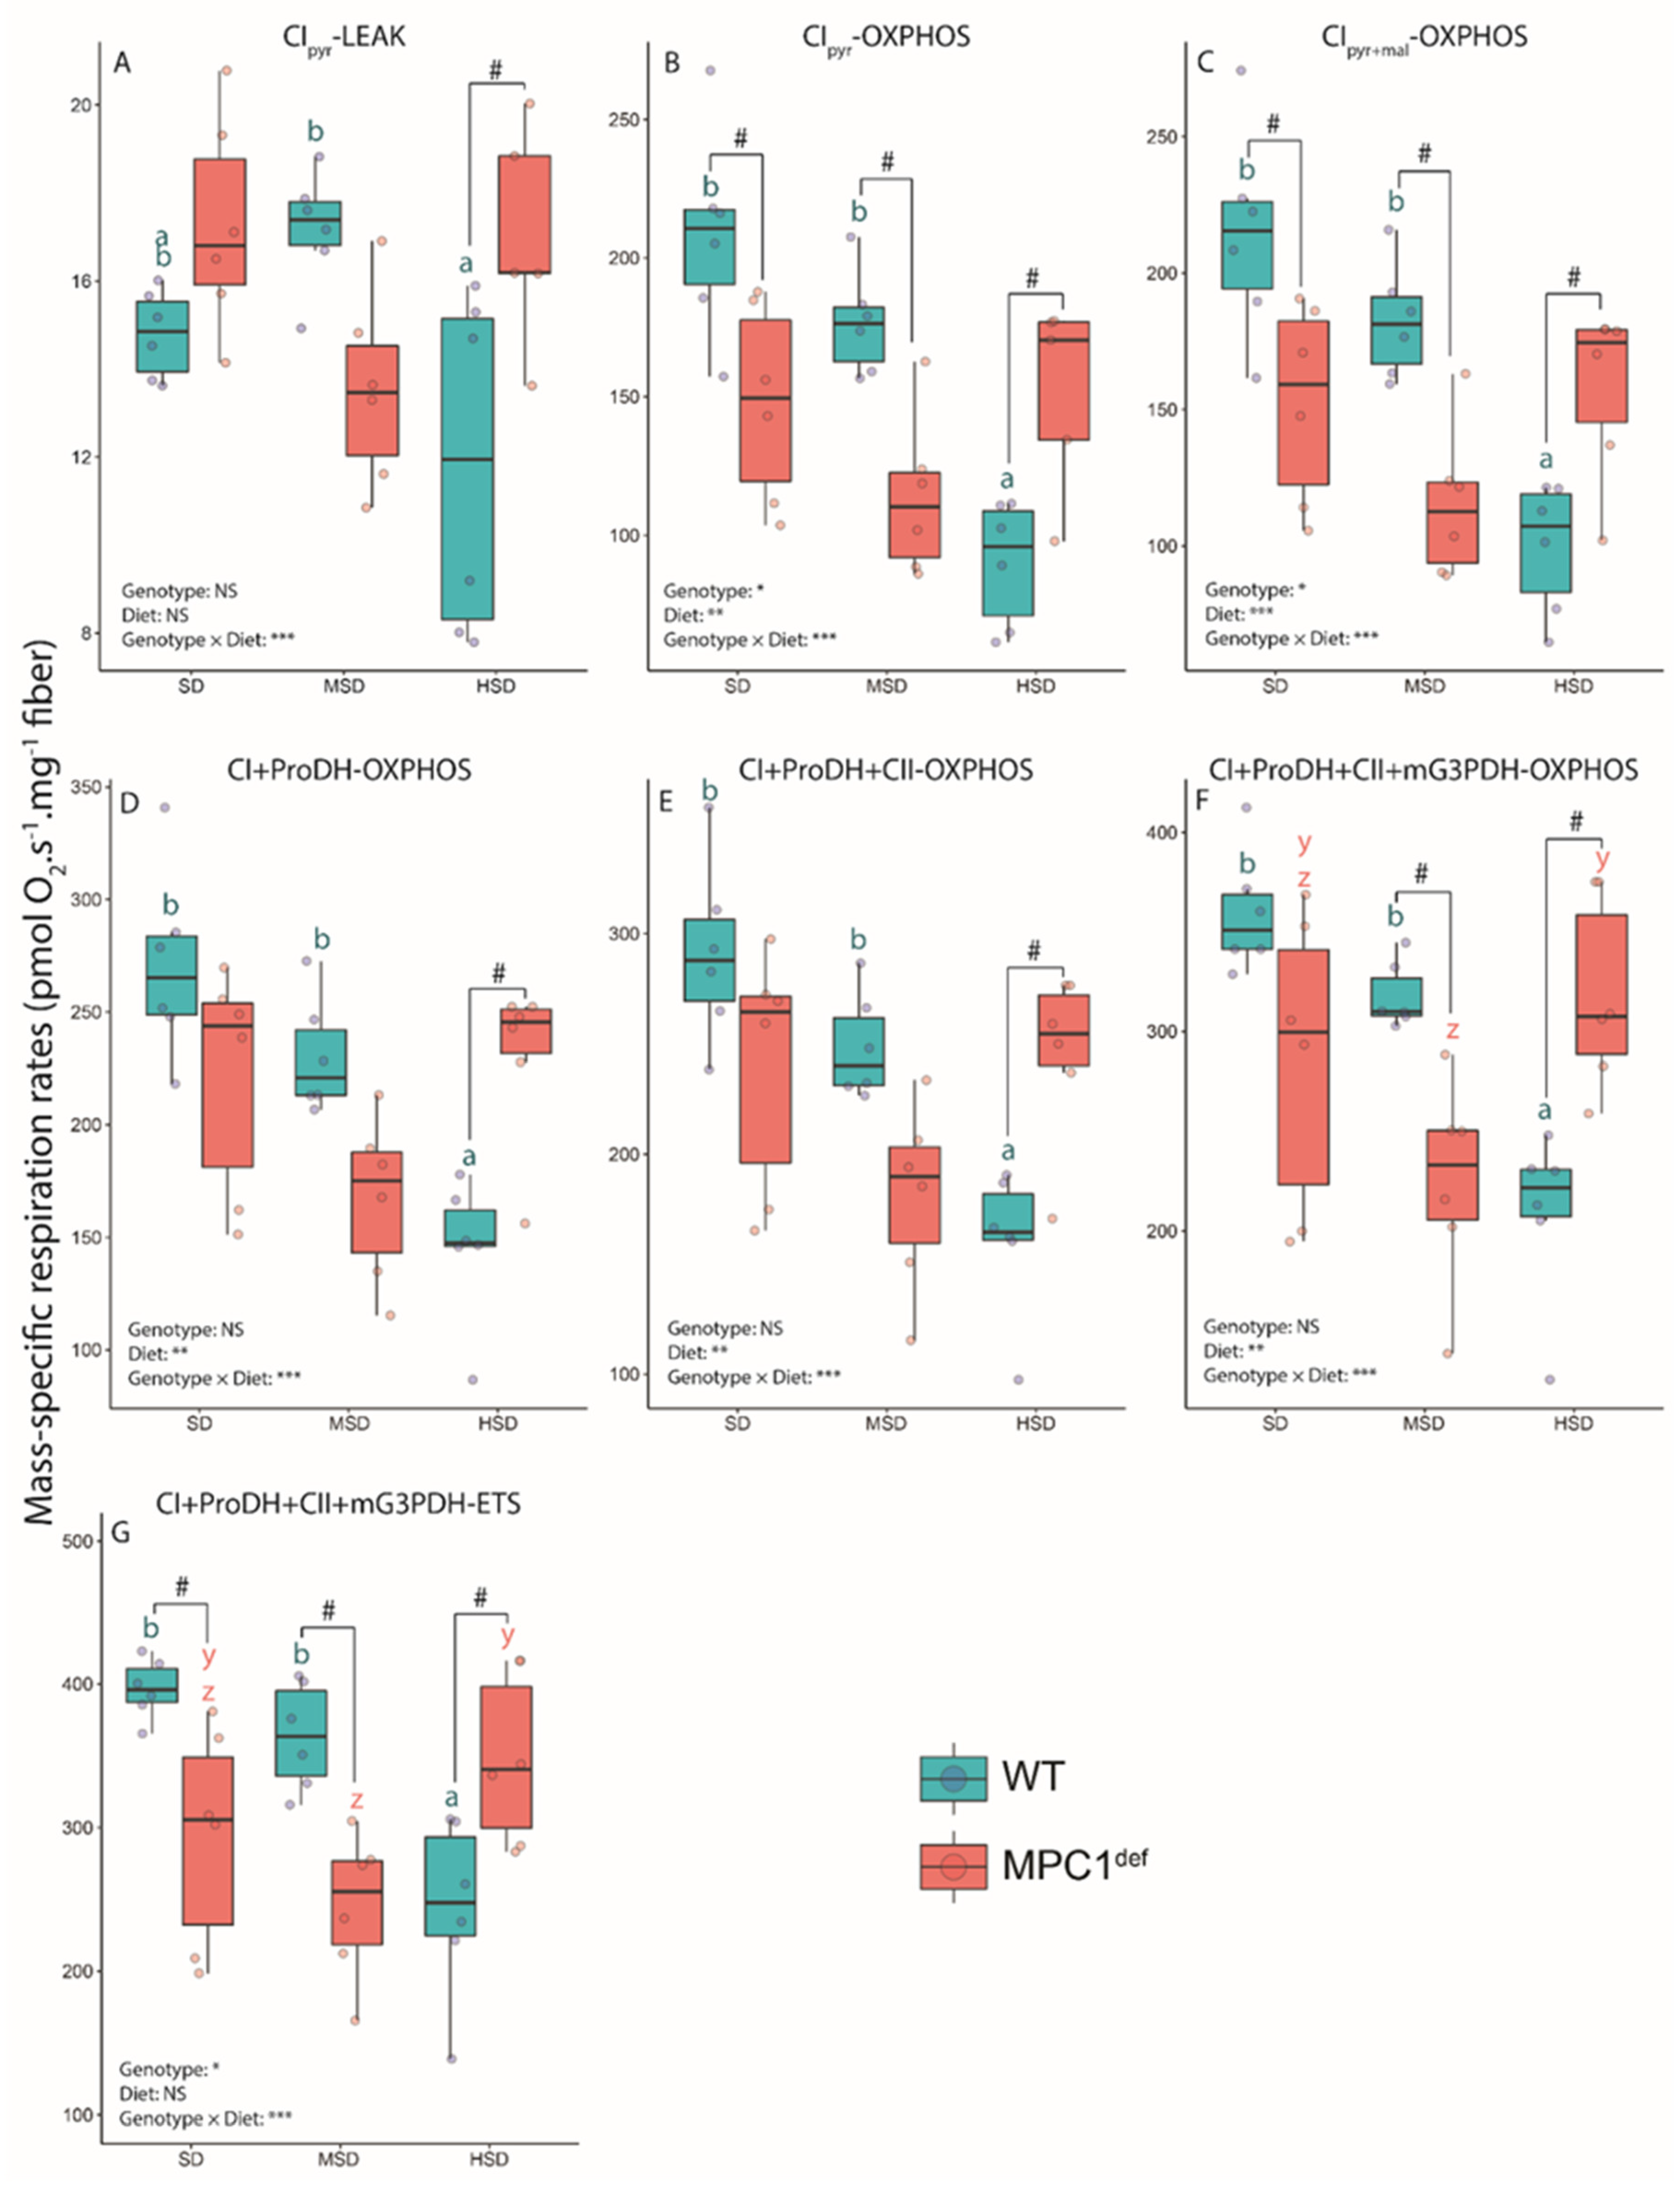
2.2. Mitochondrial Respiration
2.2.1. Mitochondrial Respiration Rates
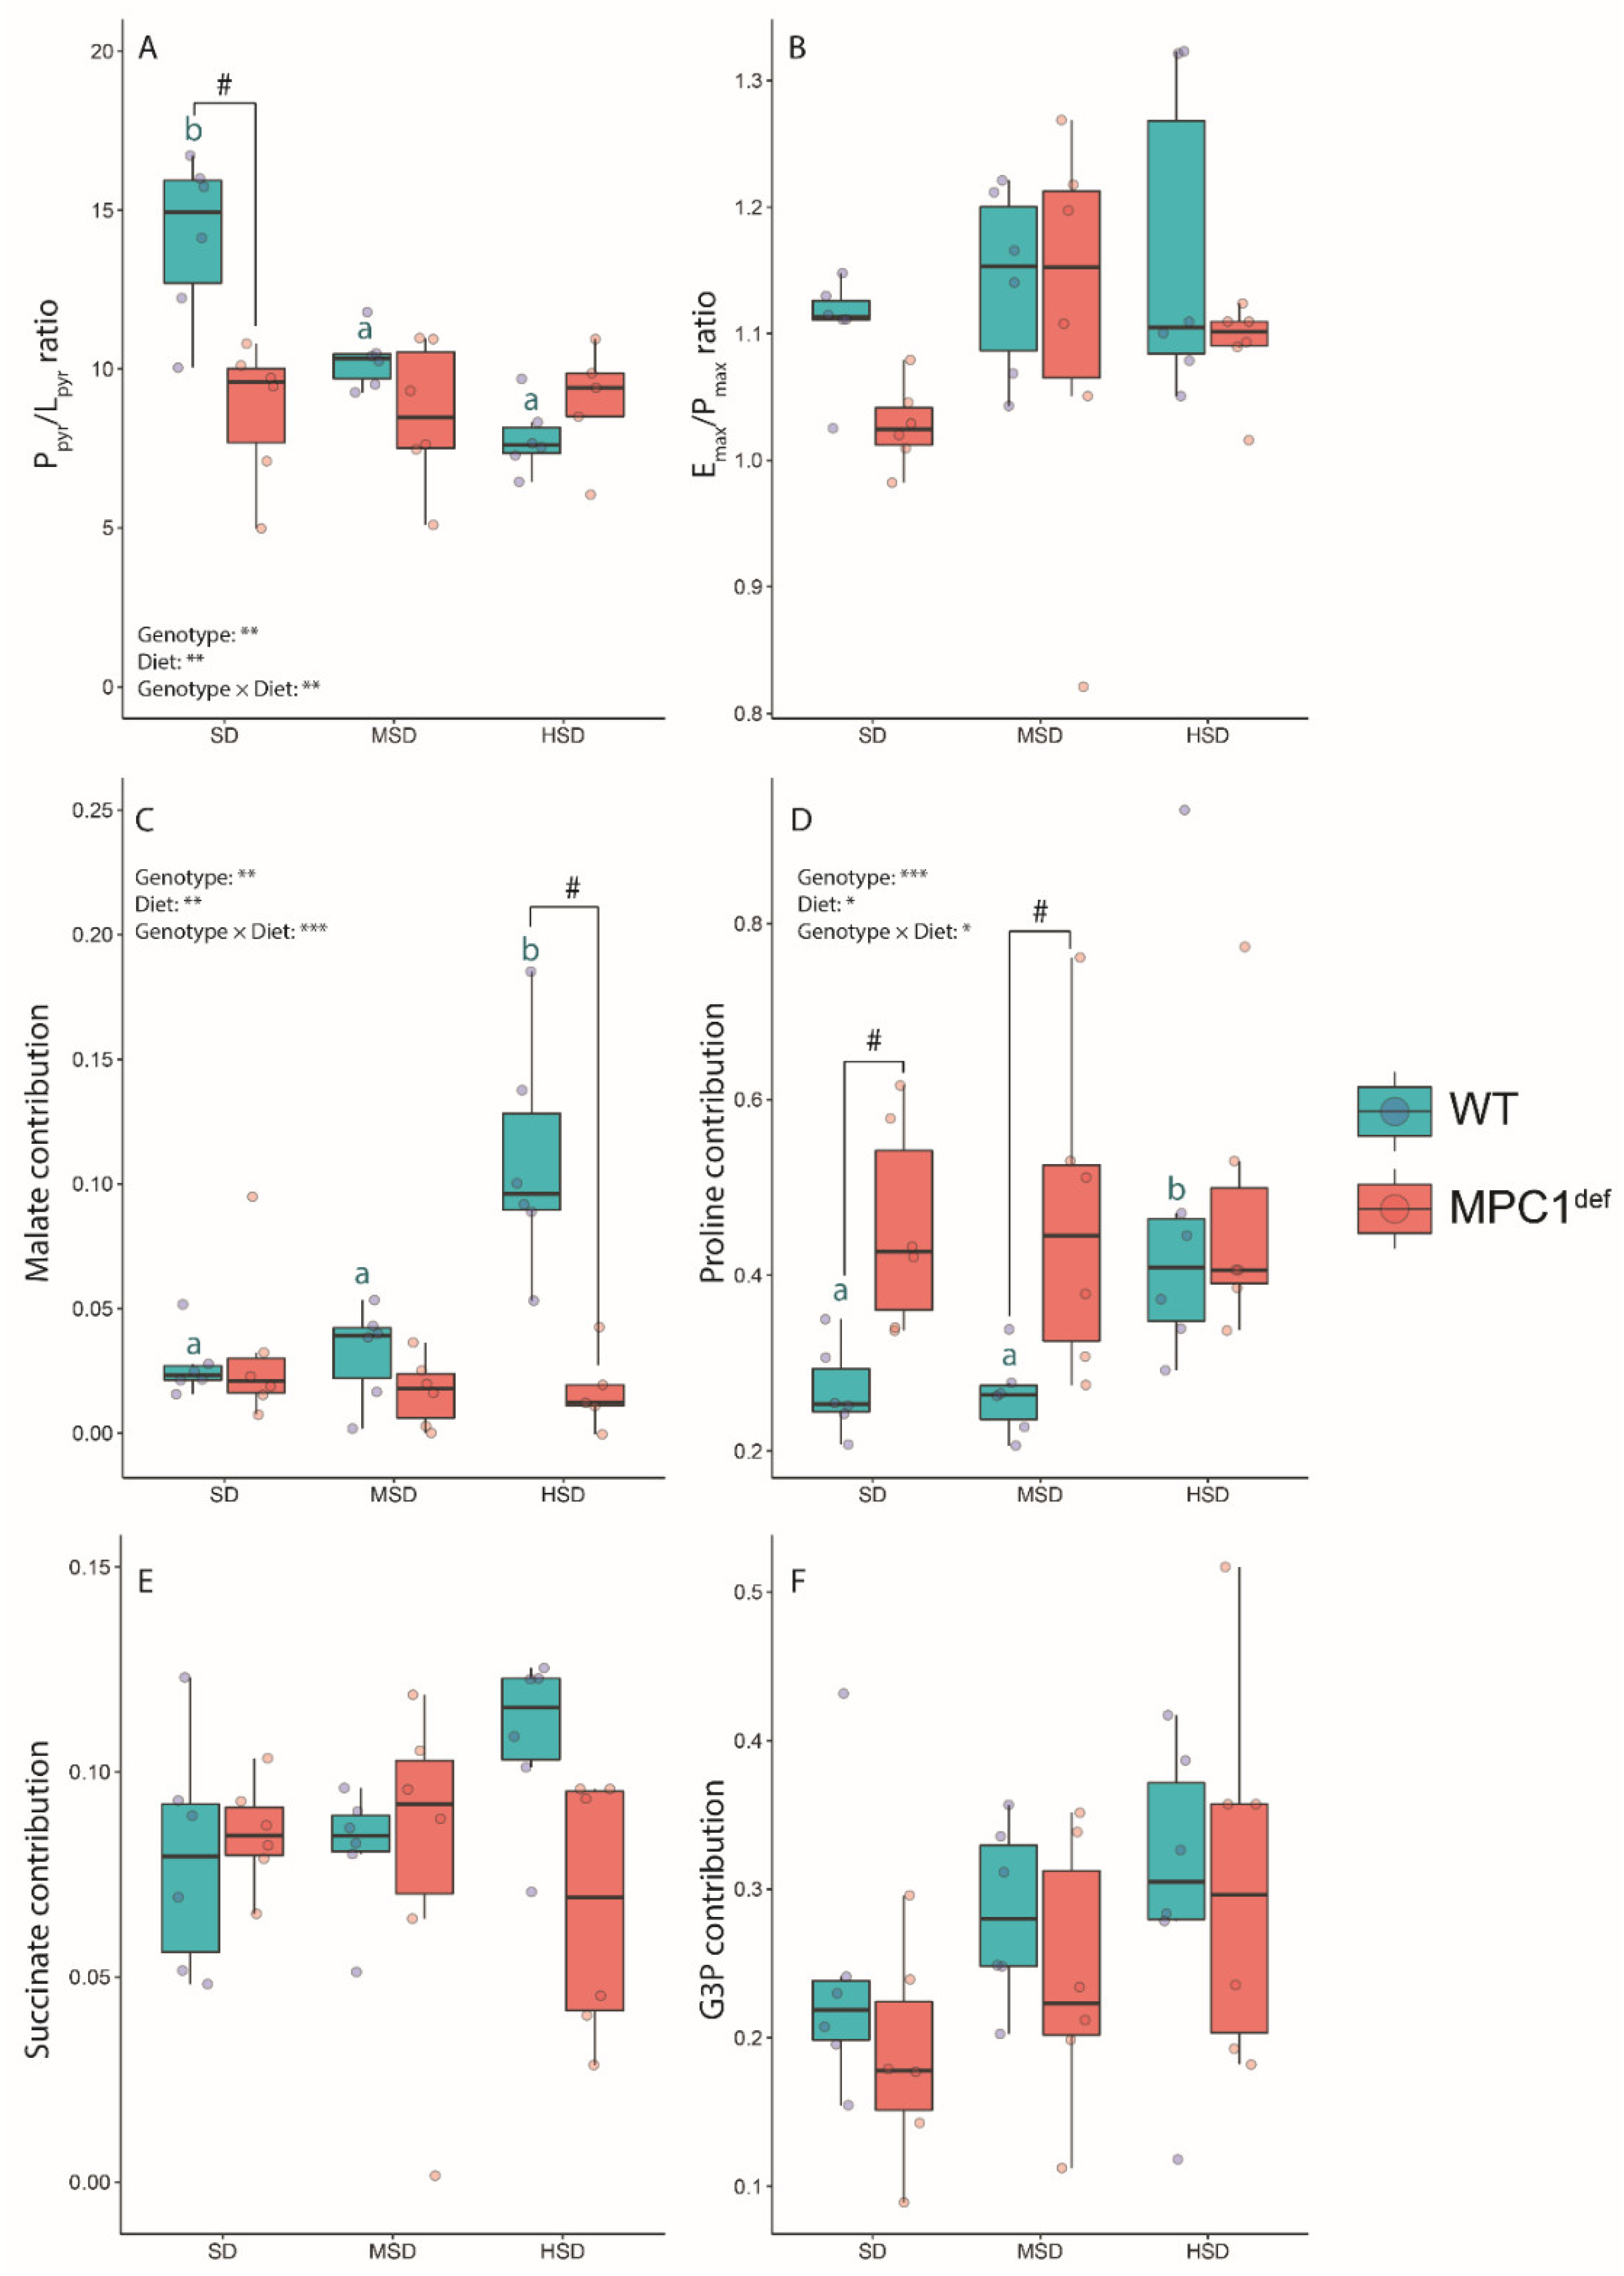
2.2.2. Mitochondrial Ratios
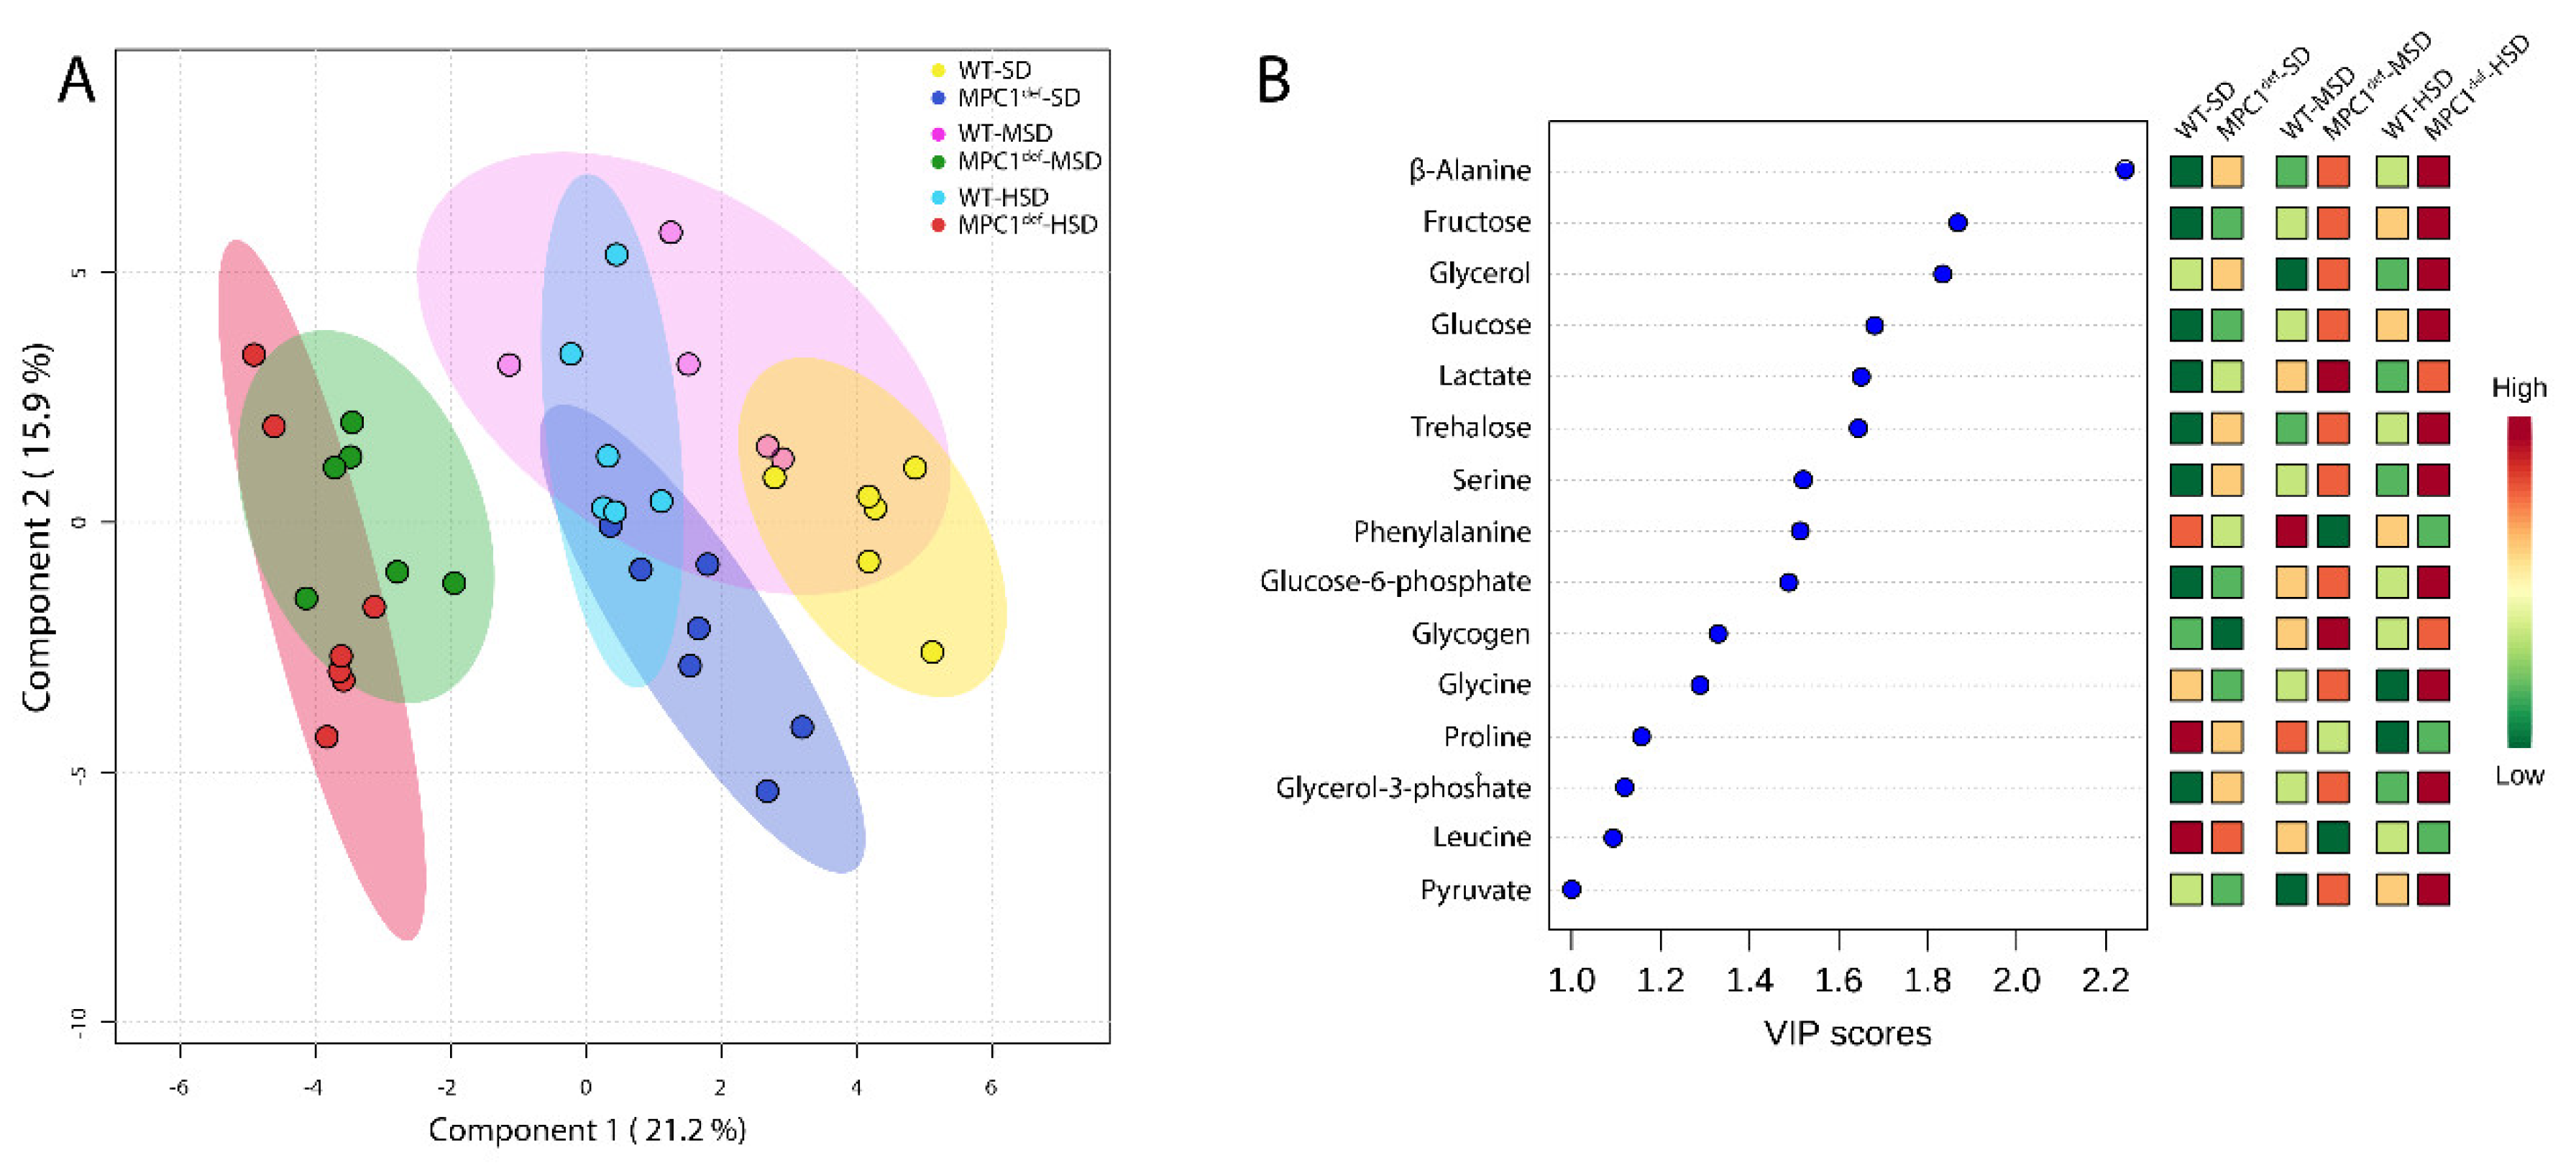
2.3. Metabolite Analysis
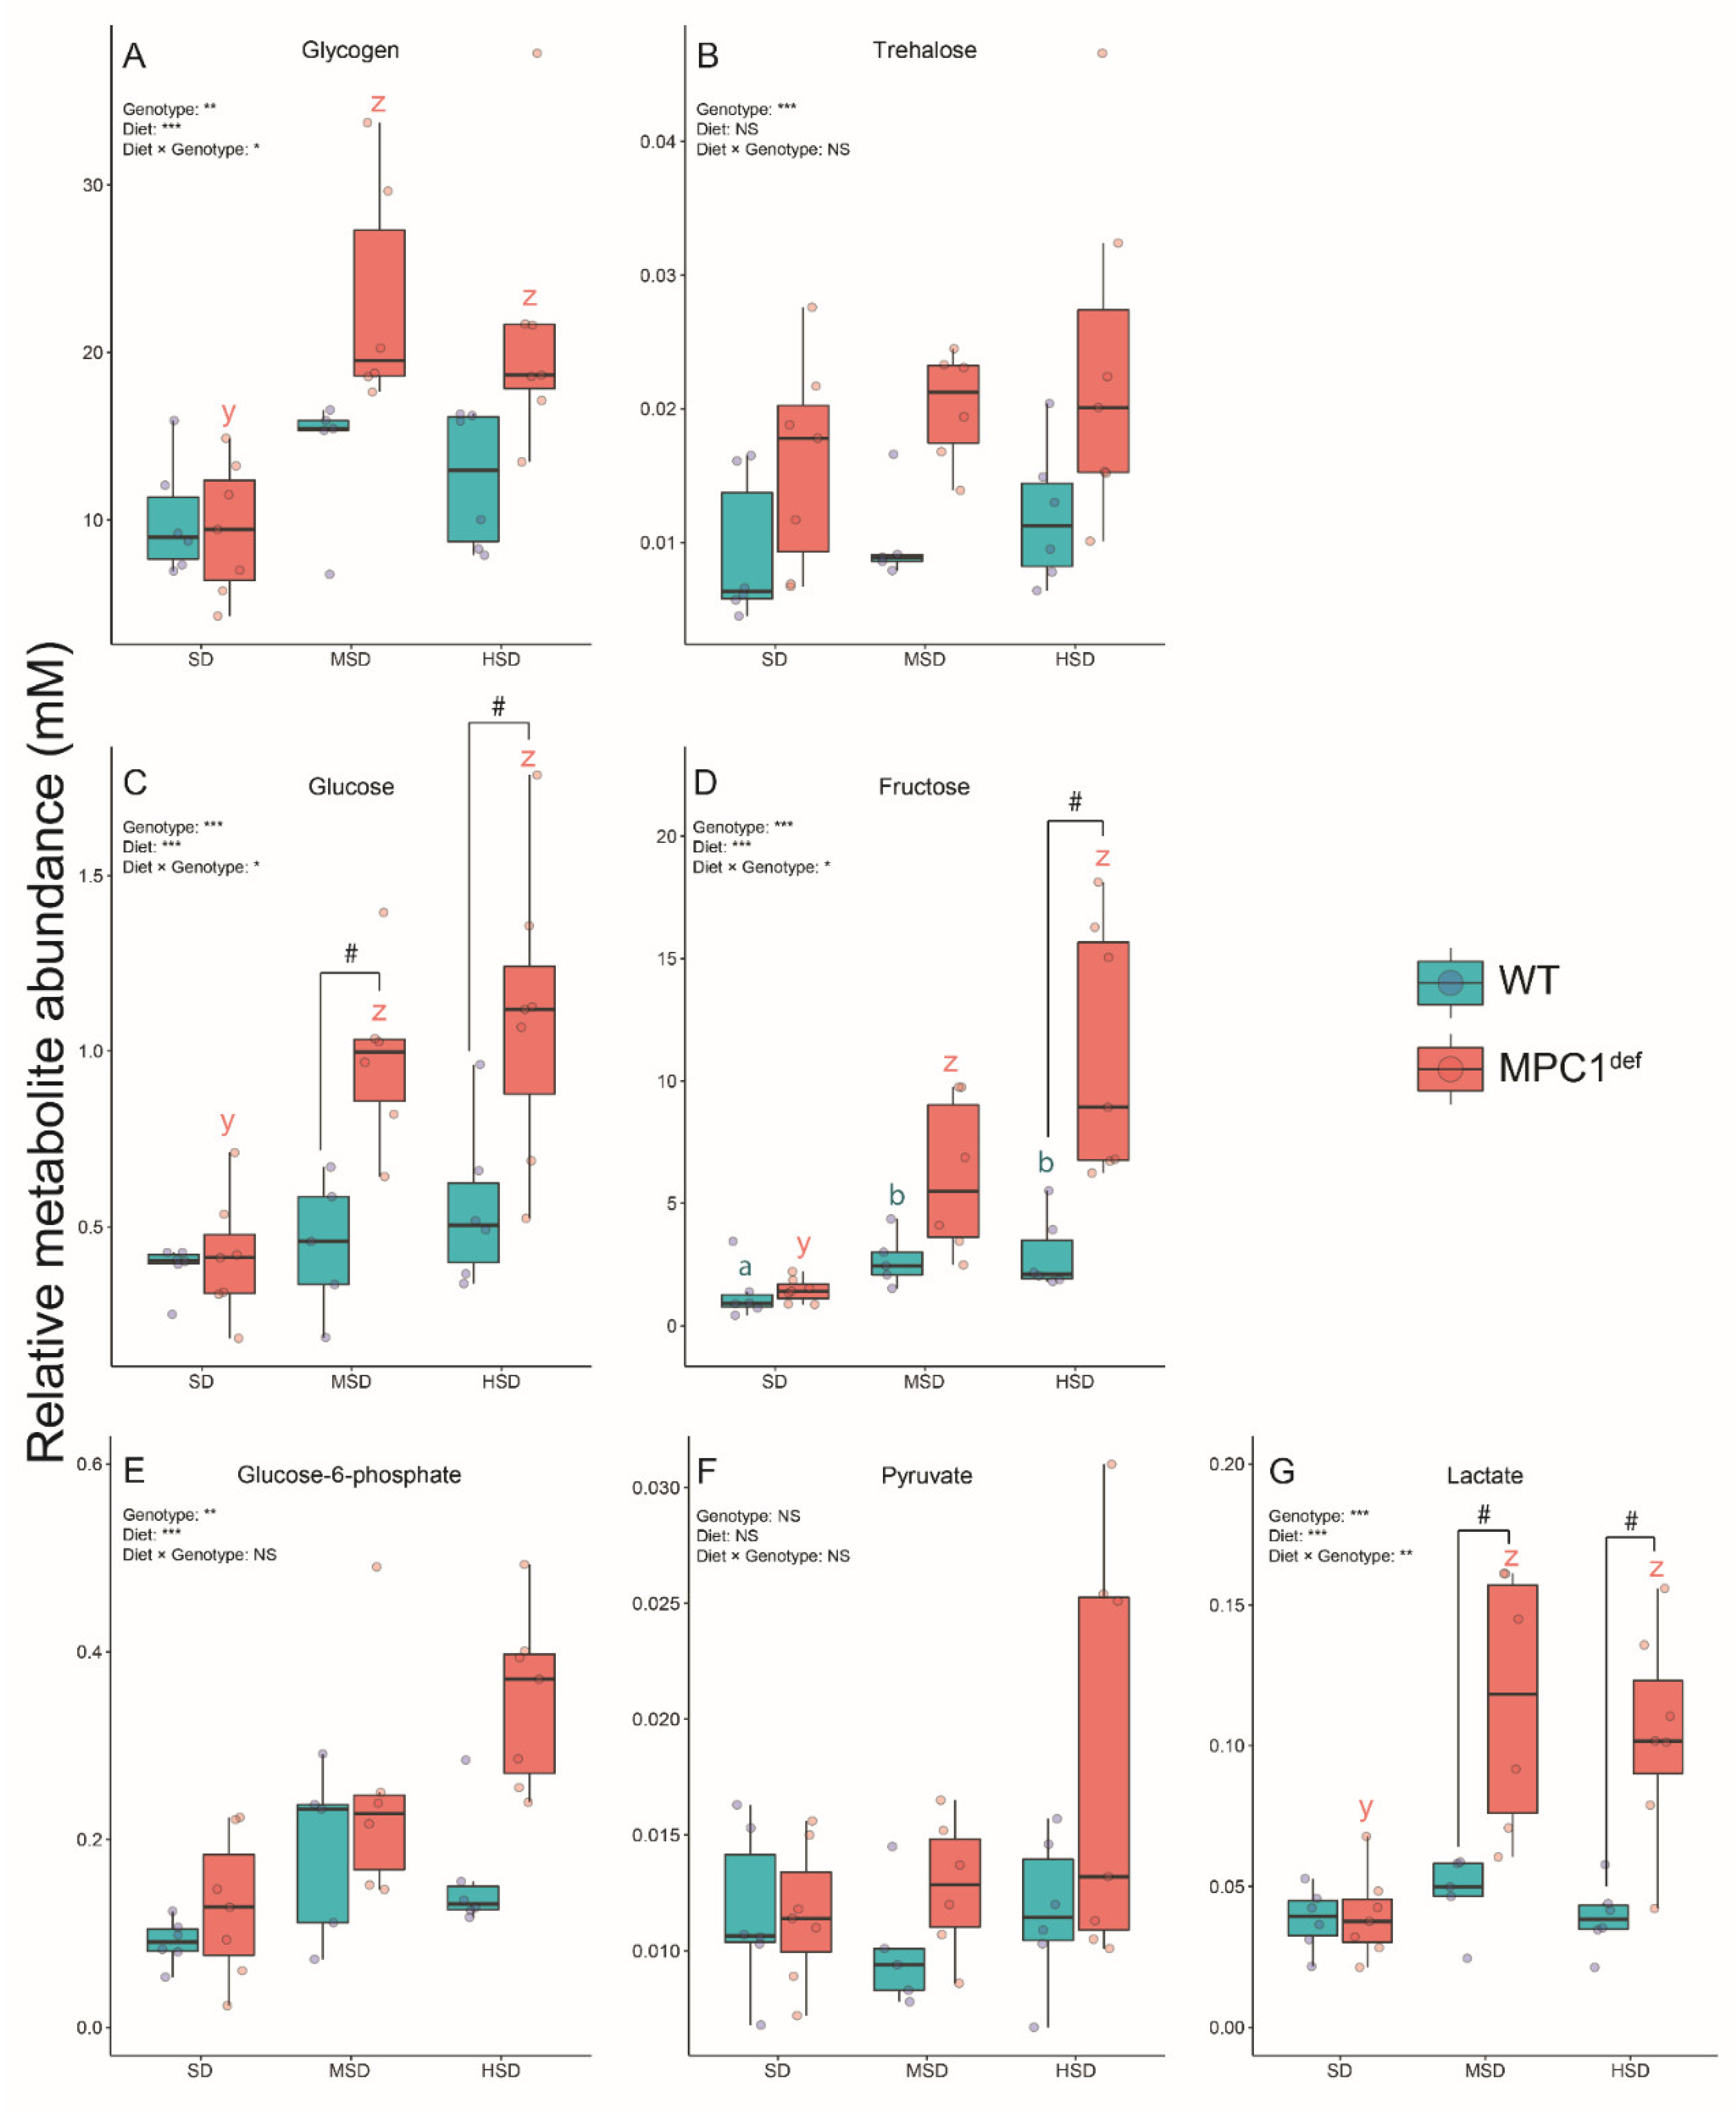
2.3.1. Sugars and Glycolysis Intermediates
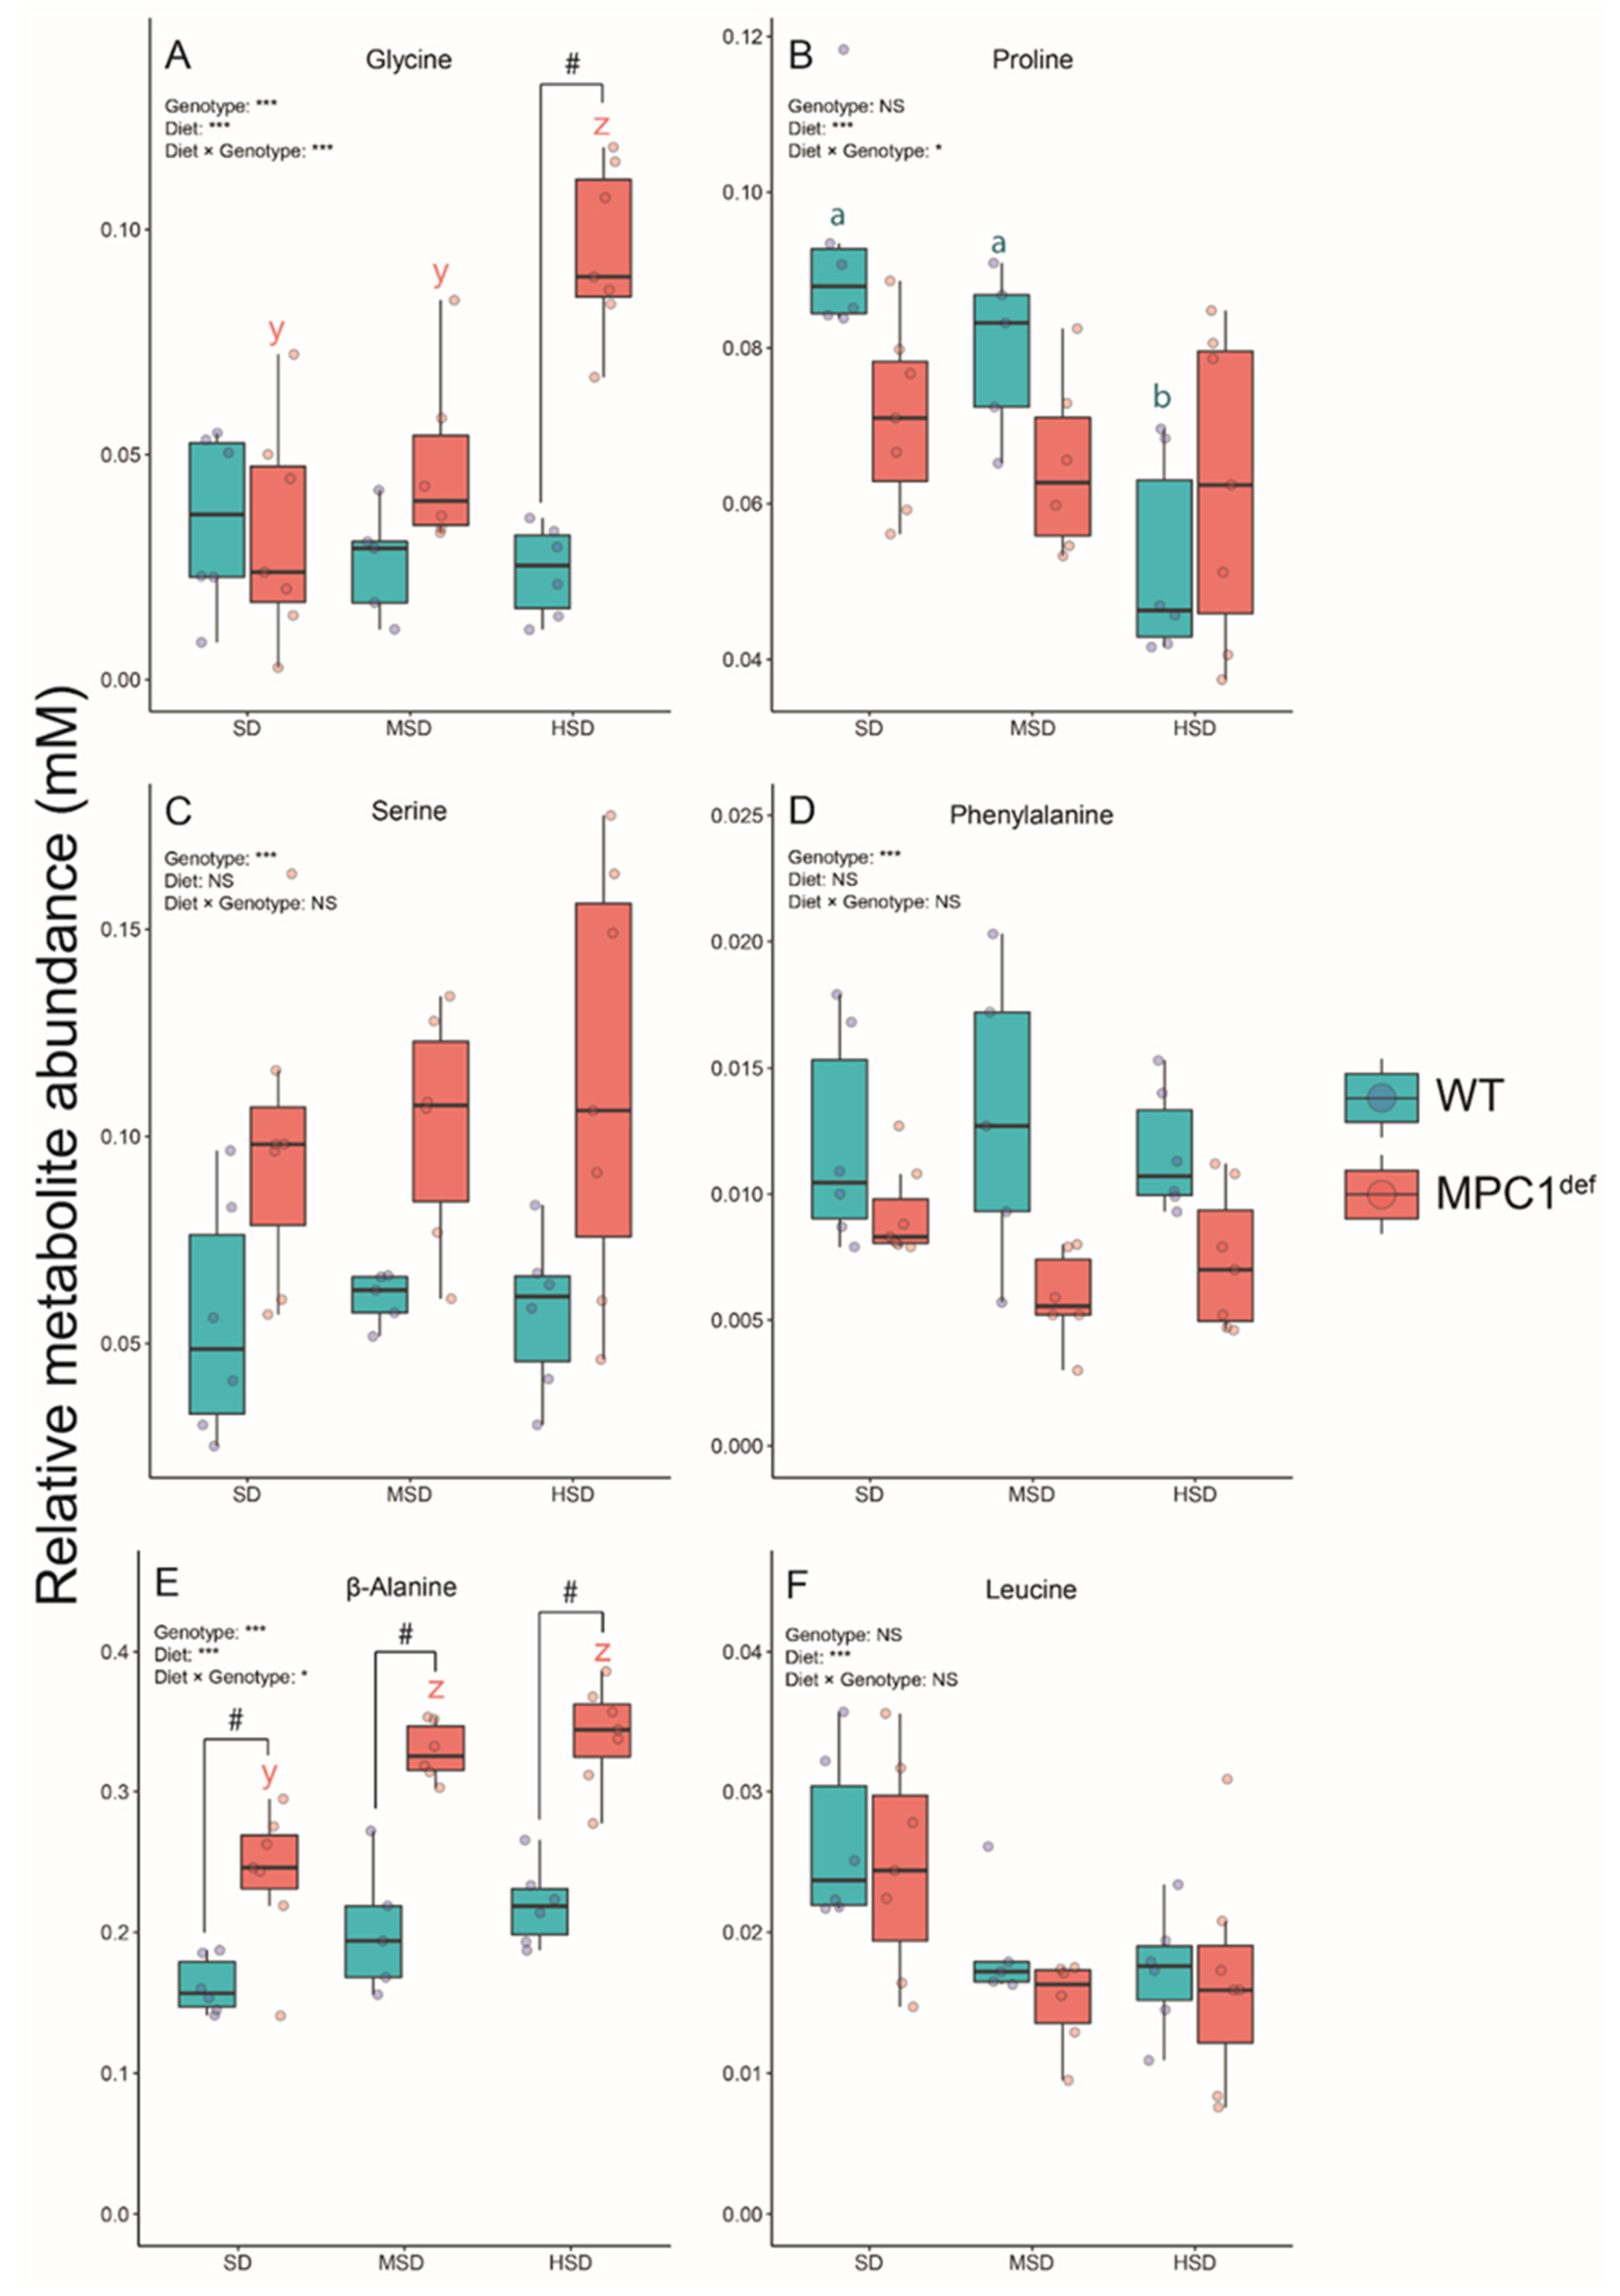
2.3.2. Amino Acids
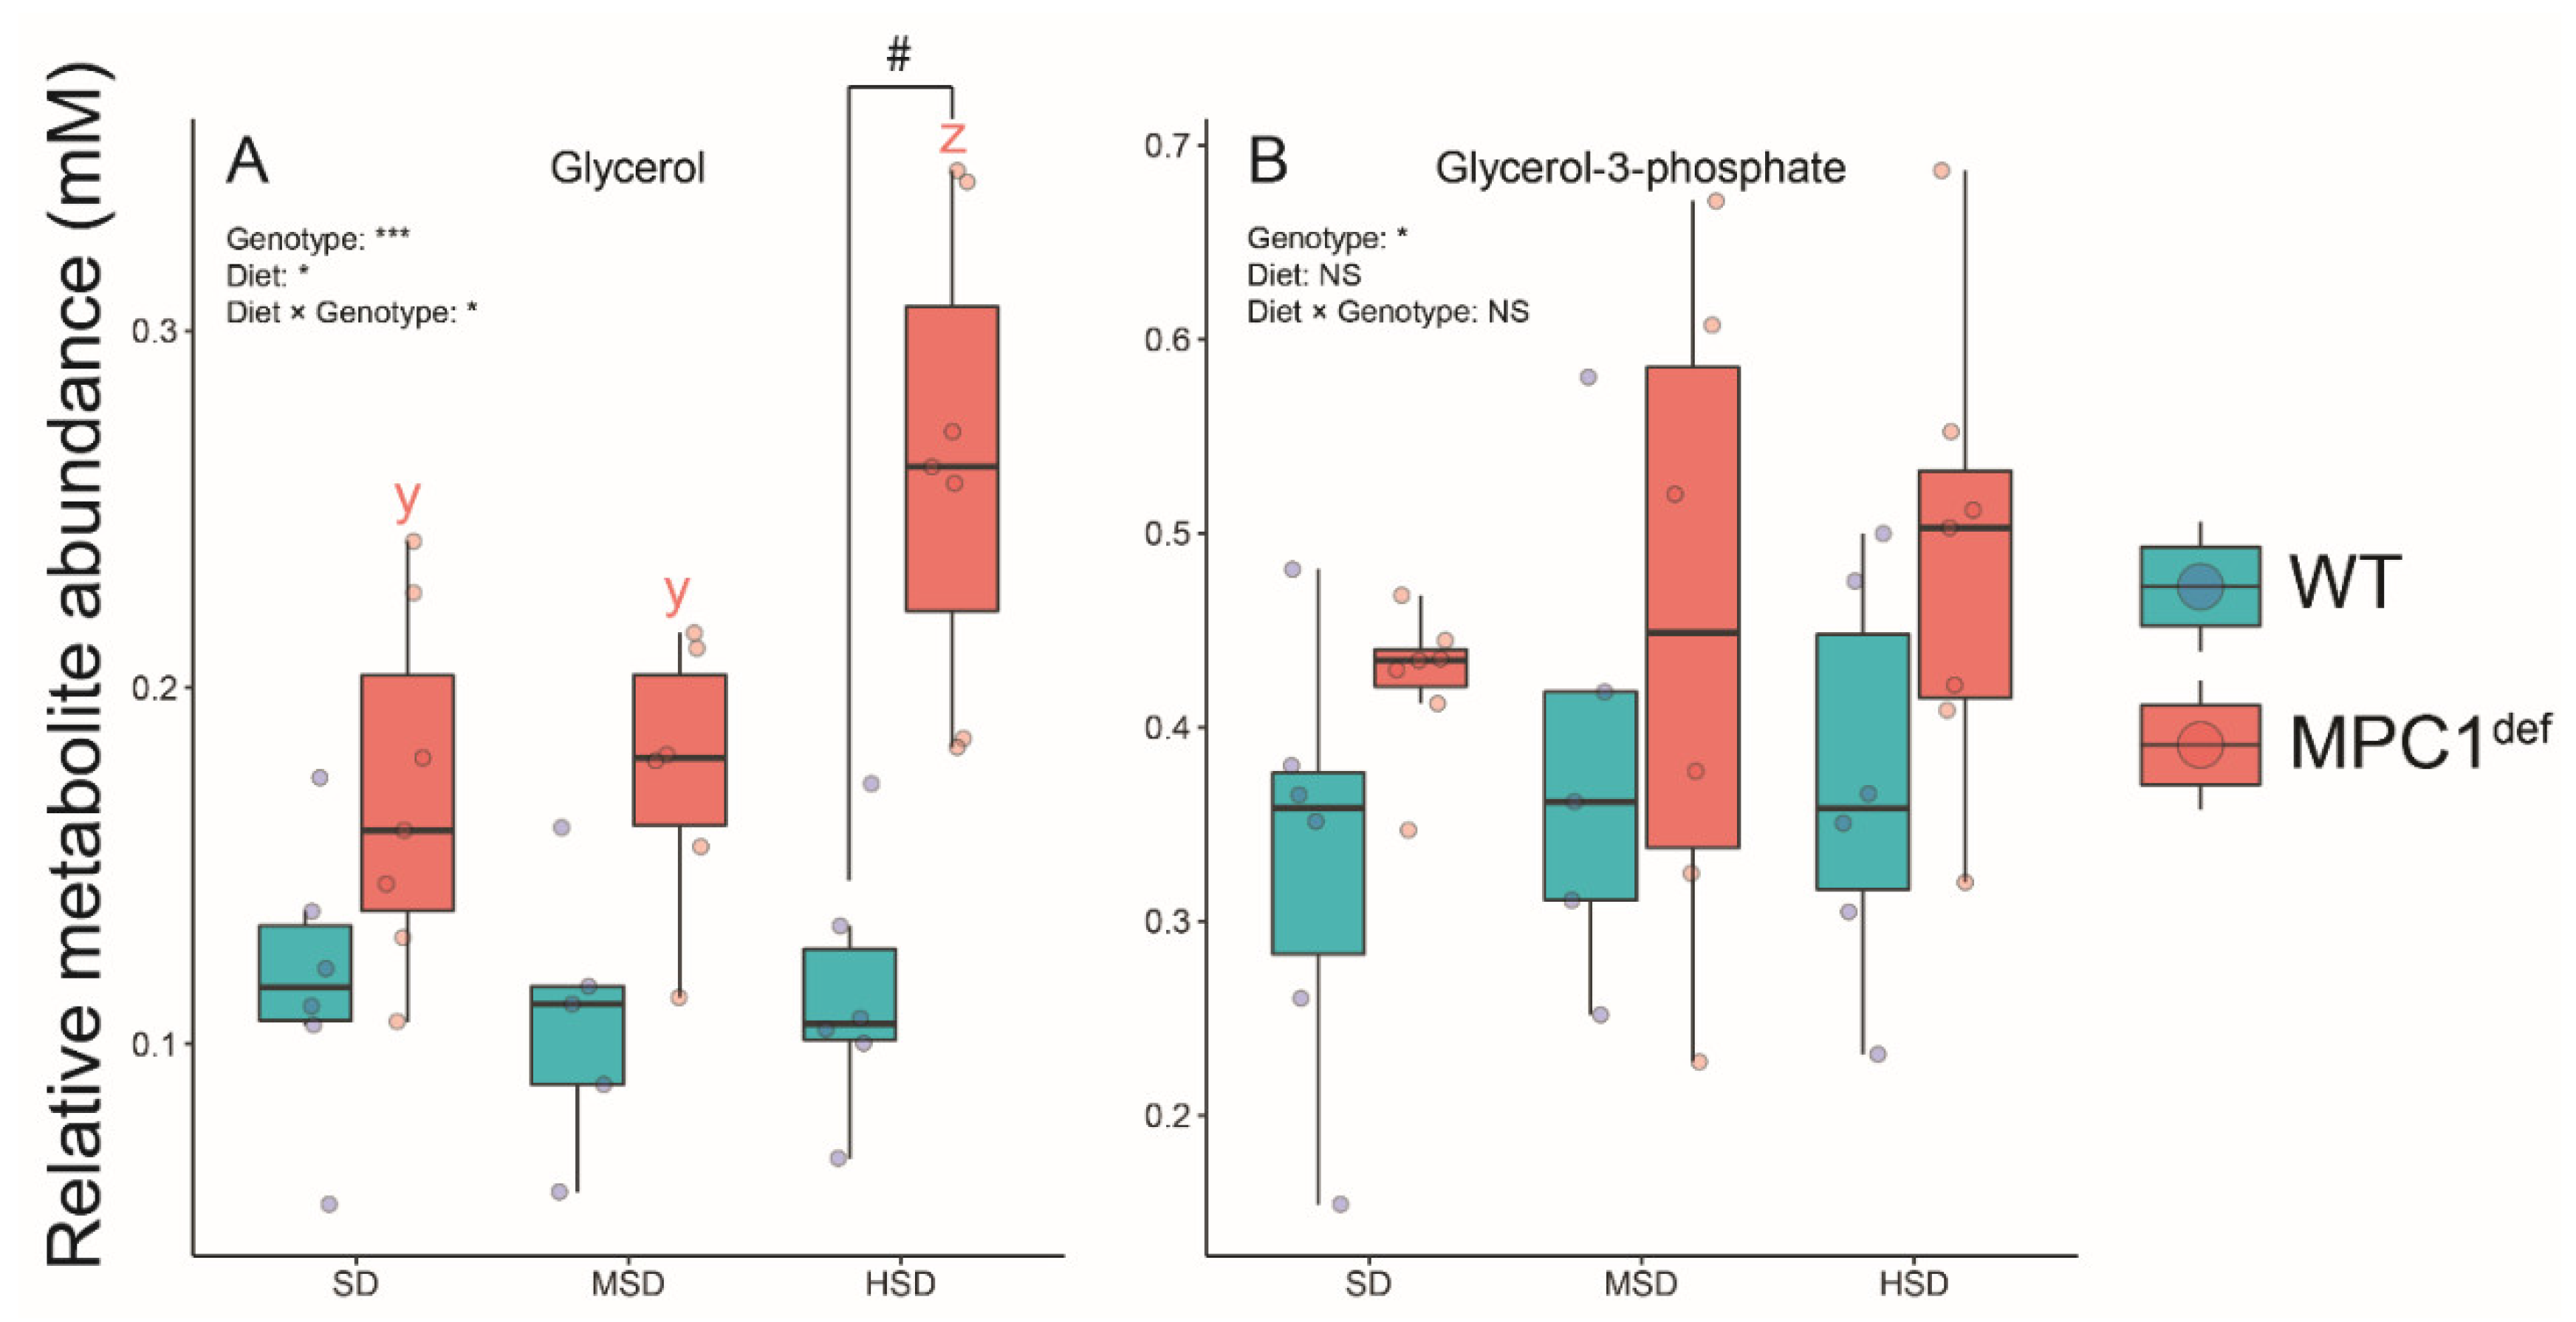
2.3.3. Polyols
3. Discussion
4. Materials and Methods
4.1. Drosophila Maintenance and Experimental Design
4.2. MPC1 Gene Expression
4.3. Mitochondrial Respiration
4.4. Metabolite Extraction and Analysis
4.5. Statistical Analysis
Supplementary Materials
Author Contributions
Funding
Acknowledgments
Conflicts of Interest
References
- Randle, P.J. Regulatory interactions between lipids and carbohydrates: The glucose fatty acid cycle after 35 years. Diabetes Metab. Rev. 1998, 14, 263–283. [Google Scholar] [CrossRef]
- Muoio, D.M. Metabolic inflexibility: When mitochondrial indecision leads to metabolic gridlock. Cell 2014, 159, 1253–1262. [Google Scholar] [CrossRef] [PubMed] [Green Version]
- Efeyan, A.; Comb, W.C.; Sabatini, D.M. Nutrient-sensing mechanisms and pathways. Nature 2015, 517, 302–310. [Google Scholar] [CrossRef] [PubMed] [Green Version]
- Sergi, D.; Naumovski, N.; Heilbronn, L.K.; Abeywardena, M.; O’Callaghan, N.; Lionetti, L.; Luscombe-Marsh, N. Mitochondrial (dys)function and insulin resistance: From pathophysiological molecular mechanisms to the impact of diet. Front. Physiol. 2019, 10, 532. [Google Scholar] [CrossRef] [PubMed]
- Le Couteur, D.G.; Solon-Biet, S.; Cogger, V.C.; Mitchell, S.J.; Senior, A.; De Cabo, R.; Raubenheimer, D.; Simpson, S.J. The impact of low-protein high-carbohydrate diets on aging and lifespan. Cell. Mol. Life Sci. 2016, 73, 1237–1252. [Google Scholar] [CrossRef] [PubMed]
- Shadel, G.S.; Horvath, T.L. Mitochondrial ROS Signaling in Organismal Homeostasis. Cell 2015, 163, 560–569. [Google Scholar] [CrossRef] [PubMed] [Green Version]
- Jørgensen, W.; Rud, K.A.; Mortensen, O.H.; Frandsen, L.; Grunnet, N.; Quistorff, B. Your mitochondria are what you eat: A high-fat or a high-sucrose diet eliminates metabolic flexibility in isolated mitochondria from rat skeletal muscle. Physiol. Rep. 2017, 5, e13207. [Google Scholar] [CrossRef]
- McDonald, A.E.; Pichaud, N.; Darveau, C.-A. “Alternative” fuels contributing to mitochondrial electron transport: Importance of non-classical pathways in the diversity of animal metabolism. Comp. Biochem. Physiol. Part B Biochem. Mol. Biol. 2018, 224, 185–194. [Google Scholar] [CrossRef]
- Servet, C.; Ghelis, T.; Richard, L.; Zilberstein, A.; Savoure, A. Proline dehydrogenase: A key enzyme in controlling cellular homeostasis. Front. Biosci. 2012, 17, 607–620. [Google Scholar] [CrossRef] [Green Version]
- Mráček, T.; Drahota, Z.; Houštěk, J. The function and the role of the mitochondrial glycerol-3-phosphate dehydrogenase in mammalian tissues. Biochim. Biophys. Acta Bioenerg. 2013, 1827, 401–410. [Google Scholar] [CrossRef] [Green Version]
- Li, L.O.; Grevengoed, T.J.; Paul, D.S.; Ilkayeva, O.; Koves, T.R.; Pascual, F.; Newgard, C.B.; Muoio, D.M.; Coleman, R.A. Compartmentalized Acyl-CoA metabolism in skeletal muscle regulates systemic glucose homeostasis. Diabetes 2015, 64, 23–35. [Google Scholar] [CrossRef] [PubMed] [Green Version]
- Muoio, D.M.; Neufer, P.D. Lipid-induced mitochondrial stress and insulin action in muscle. Cell Metab. 2012, 15, 595–605. [Google Scholar] [CrossRef] [PubMed] [Green Version]
- Koves, T.R.; Ussher, J.R.; Noland, R.C.; Slentz, D.; Mosedale, M.; Ilkayeva, O.; Bain, J.; Stevens, R.; Dyck, J.R.B.; Newgard, C.B.; et al. Mitochondrial Overload and Incomplete Fatty Acid Oxidation Contribute to Skeletal Muscle Insulin Resistance. Cell Metab. 2008, 7, 45–56. [Google Scholar] [CrossRef] [Green Version]
- Park, S.; Jeon, J.H.; Min, B.K.; Ha, C.M.; Thoudam, T.; Park, B.Y.; Lee, I.K. Role of the pyruvate dehydrogenase complex in metabolic remodeling: Differential pyruvate dehydrogenase complex functions in metabolism. Diabetes Metab. J. 2018, 42, 270–281. [Google Scholar] [CrossRef] [PubMed]
- McCommis, K.S.; Chen, Z.; Fu, X.; McDonald, W.G.; Colca, J.R.; Kletzien, R.F.; Burgess, S.C.; Finck, B.N. Loss of mitochondrial pyruvate carrier 2 in the liver leads to defects in gluconeogenesis and compensation via pyruvate-alanine cycling. Cell Metab. 2015, 22, 682–694. [Google Scholar] [CrossRef] [PubMed] [Green Version]
- McCommis, K.S.; Hodges, W.T.; Bricker, D.K.; Wisidagama, D.R.; Compan, V.; Remedi, M.S.; Thummel, C.S.; Finck, B.N. An ancestral role for the mitochondrial pyruvate carrier in glucose-stimulated insulin secretion. Mol. Metab. 2016, 5, 602–614. [Google Scholar] [CrossRef] [PubMed]
- Bender, T.; Martinou, J.C. The mitochondrial pyruvate carrier in health and disease: To carry or not to carry? Biochim. Biophys. Acta Mol. Cell Res. 2016, 1863, 2436–2442. [Google Scholar] [CrossRef] [PubMed]
- Bricker, D.K.; Taylor, E.B.; Schell, J.C.; Orsak, T.; Boutron, A.; Chen, Y.-C.; Cox, J.E.; Cardon, C.M.; Van Vranken, J.G.; Dephoure, N.; et al. A mitochondrial pyruvate carrier required for pyruvate uptake in yeast, Drosophila, and humans. Science 2012, 337, 96–100. [Google Scholar] [CrossRef] [PubMed] [Green Version]
- Colca, J.R.; McDonald, W.G.; McCommis, K.S.; Finck, B.N. Treating fatty liver disease by modulating mitochondrial pyruvate metabolism. Hepatol. Commun. 2017, 1, 193–197. [Google Scholar] [CrossRef] [PubMed] [Green Version]
- McCommis, K.S.; Hodges, W.T.; Brunt, E.M.; Nalbantoglu, I.; McDonald, W.G.; Holley, C.; Fujiwara, H.; Schaffer, J.E.; Colca, J.R.; Finck, B.N. Targeting the mitochondrial pyruvate carrier attenuates fibrosis in a mouse model of nonalcoholic steatohepatitis. Hepatology 2017, 65, 1543–1556. [Google Scholar] [CrossRef] [Green Version]
- Gray, L.R.; Sultana, M.R.; Rauckhorst, A.J.; Oonthonpan, L.; Tompkins, S.C.; Sharma, A.; Fu, X.; Miao, R.; Pewa, A.D.; Brown, K.S.; et al. Hepatic mitochondrial pyruvate carrier 1 is required for efficient regulation of gluconeogenesis and whole-body glucose homeostasis. Cell Metab. 2015, 22, 669–681. [Google Scholar] [CrossRef] [PubMed] [Green Version]
- Simard, C.; Lebel, A.; Allain, E.P.; Touaibia, M.; Hebert-Chatelain, E.; Pichaud, N. Metabolic Characterization and Consequences of Mitochondrial Pyruvate Carrier Deficiency in Drosophila melanogaster. Metabolites 2020, 10, 363. [Google Scholar] [CrossRef] [PubMed]
- Bier, E.; Vaessin, H.; Shepherd, S.; Lee, K.; McCall, K.; Barbel, S.; Ackerman, L.; Carretto, R.; Uemura, T.; Grell, E. Searching for pattern and mutation in the Drosophila genome with a P-lacZ vector. Genes Dev. 1989, 3, 1273–1287. [Google Scholar] [CrossRef] [PubMed] [Green Version]
- Bellen, H.J.; Levis, R.W.; He, Y.; Carlson, J.W.; Evans-Holm, M.; Bae, E.; Kim, J.; Metaxakis, A.; Savakis, C.; Schulze, K.L.; et al. The Drosophila gene disruption project: Progress using transposons with distinctive site specificities. Genetics 2011, 188, 731–743. [Google Scholar] [CrossRef] [Green Version]
- Thibault, S.T.; Singer, M.A.; Miyazaki, W.Y.; Milash, B.; Dompe, N.A.; Singh, C.M.; Buchholz, R.; Demsky, M.; Fawcett, R.; Francis-Lang, H.L.; et al. A complementary transposon tool kit for Drosophila melanogaster using P and piggyBac. Nat. Genet. 2004, 36, 283–287. [Google Scholar] [CrossRef]
- Simard, C.J.; Pelletier, G.; Boudreau, L.H.; Hebert-Chatelain, E.; Pichaud, N. Measurement of Mitochondrial Oxygen Consumption in Permeabilized Fibers of Drosophila Using Minimal Amounts of Tissue. J. Vis. Exp. 2018, e57376. [Google Scholar] [CrossRef]
- Chong, J.; Wishart, D.S.; Xia, J. Using MetaboAnalyst 4.0 for Comprehensive and Integrative Metabolomics Data Analysis. Curr. Protoc. Bioinform. 2019, 68, e86. [Google Scholar] [CrossRef]
- Vacanti, N.M.; Divakaruni, A.S.; Green, C.R.; Parker, S.J.; Henry, R.R.; Ciaraldi, T.P.; Murphy, A.N.; Metallo, C.M. Regulation of substrate utilization by the mitochondrial pyruvate carrier. Mol. Cell 2014, 56, 425–435. [Google Scholar] [CrossRef] [Green Version]
- McCommis, K.S.; Finck, B.N. Mitochondrial pyruvate transport: A historical perspective and future research directions. Biochem. J. 2015, 466, 443–454. [Google Scholar] [CrossRef] [Green Version]
- Pesta, D.; Gnaiger, E. High-resolution respirometry: OXPHOS protocols for human cells and permeabilized fibers from small biopsies of human muscle. Methods Mol. Biol. 2012, 810, 25–58. [Google Scholar] [CrossRef]
- Gnaiger, E. Capacity of oxidative phosphorylation in human skeletal muscle. Int. J. Biochem. Cell Biol. 2009, 41, 1837–1845. [Google Scholar] [CrossRef] [PubMed]
- Na, J.; Musselman, L.P.; Pendse, J.; Baranski, T.J.; Bodmer, R.; Ocorr, K.; Cagan, R. A Drosophila Model of High Sugar Diet-Induced Cardiomyopathy. PLoS Genet. 2013, 9, e1003175. [Google Scholar] [CrossRef] [PubMed] [Green Version]
- Musselman, L.P.; Fink, J.L.; Baranski, T.J. Similar effects of high-fructose and high-glucose feeding in a Drosophila model of obesity and diabetes. PLoS ONE 2019, 14, e0217096. [Google Scholar] [CrossRef] [PubMed]
- Musselman, L.P.; Fink, J.L.; Narzinski, K.; Ramachandran, P.V.; Hathiramani, S.S.; Cagan, R.L.; Baranski, T.J. A high-sugar diet produces obesity and insulin resistance in wild-type Drosophila. DMM Dis. Model. Mech. 2011, 4, 842–849. [Google Scholar] [CrossRef] [Green Version]
- Rovenko, B.M.; Kubrak, O.I.; Gospodaryov, D.V.; Perkhulyn, N.V.; Yurkevych, I.S.; Sanz, A.; Lushchak, O.V.; Lushchak, V.I. High sucrose consumption promotes obesity whereas its low consumption induces oxidative stress in Drosophila melanogaster. J. Insect Physiol. 2015, 79, 42–54. [Google Scholar] [CrossRef]
- Rovenko, B.M.; Kubrak, O.I.; Gospodaryov, D.V.; Yurkevych, I.S.; Sanz, A.; Lushchak, O.V.; Lushchak, V.I. Restriction of glucose and fructose causes mild oxidative stress independently of mitochondrial activity and reactive oxygen species in drosophila melanogaster. Comp. Biochem. Physiol. Part A Mol. Integr. Physiol. 2015, 187, 27–39. [Google Scholar] [CrossRef]
- Lemieux, H.; Blier, P.U.; Gnaiger, E. Remodeling pathway control of mitochondrial respiratory capacity by temperature in mouse heart: Electron flow through the Q-junction in permeabilized fibers. Sci. Rep. 2017, 7, 2840. [Google Scholar] [CrossRef] [Green Version]
- Vigueira, P.A.; McCommis, K.S.; Schweitzer, G.G.; Remedi, M.S.; Chambers, K.T.; Fu, X.; McDonald, W.G.; Cole, S.L.; Colca, J.R.; Kletzien, R.F.; et al. Mitochondrial Pyruvate Carrier 2 Hypomorphism in Mice Leads to Defects in Glucose-Stimulated Insulin Secretion. Cell Rep. 2014, 7, 2042–2053. [Google Scholar] [CrossRef] [Green Version]
- Schell, J.C.; Olson, K.A.; Jiang, L.; Hawkins, A.J.; VanVranken, J.G.; Xie, J.; Egnatchik, R.A.; Earl, E.G.; DeBerardinis, R.J.; Rutter, J. A role for the mitochondrial pyruvate carrier as a repressor of the warburg effect and colon cancer cell growth. Mol. Cell 2014, 56, 400–413. [Google Scholar] [CrossRef] [Green Version]
- Adeva-Andany, M.M.; López-Maside, L.; Donapetry-García, C.; Fernández-Fernández, C.; Sixto-Leal, C. Enzymes involved in branched-chain amino acid metabolism in humans. Amino Acids 2017, 49, 1005–1028. [Google Scholar] [CrossRef]
- Teulier, L.; Weber, J.-M.; Crevier, J.; Darveau, C.-A. Proline as a fuel for insect flight: Enhancing carbohydrate oxidation in hymenopterans. Proc. R. Soc. B Biol. Sci. 2016, 283, 20160333. [Google Scholar] [CrossRef] [PubMed] [Green Version]
- Soares, J.B.R.C.; Gaviraghi, A.; Oliveira, M.F.; Veuthey, J.; Zamboni, N.; Westermann, B. Mitochondrial Physiology in the Major Arbovirus Vector Aedes aegypti: Substrate Preferences and Sexual Differences Define Respiratory Capacity and Superoxide Production. PLoS ONE 2015, 10, e0120600. [Google Scholar] [CrossRef] [PubMed] [Green Version]
- Pichaud, N.; Ballard, J.W.O.; Tanguay, R.M.; Blier, P.U. Thermal sensitivity of mitochondrial functions in permeabilized muscle fibers from two populations of Drosophila simulans with divergent mitotypes. Am. J. Physiol. Regul. Integr. Comp. Physiol. 2011, 301, R48–R59. [Google Scholar] [CrossRef] [PubMed] [Green Version]
- Jacobs, M.E. Influence of β-alanine on ultrastructure, tanning, and melanization of Drosophila melanogaster cuticles. Biochem. Genet. 1980, 18, 65–76. [Google Scholar] [CrossRef]
- Borycz, J.; Borycz, J.A.; Edwards, T.N.; Boulianne, G.L.; Meinertzhagen, I.A. The metabolism of histamine in the Drosophila optic lobe involves an ommatidial pathway: β-alanine recycles through the retina. J. Exp. Biol. 2012, 215, 1399–1411. [Google Scholar] [CrossRef] [Green Version]
- Jacobs, M.E. Influence of β-alanine on mating and territorialism in Drosophila melanogaster. Behav. Genet. 1978, 8, 487–502. [Google Scholar] [CrossRef]
- Edwards, A.C.; Rollmann, S.M.; Morgan, T.J.; Mackay, T.F.C. Quantitative Genomics of Aggressive Behavior in Drosophila melanogaster. PLoS Genet. 2006, 2, e154. [Google Scholar] [CrossRef] [Green Version]
- Andrea, B.; Britta, W.; Björn, B. Drosophila as a new model organism for the neurobiology of aggression? J. Exp. Biol. 2002, 205, 1233–1240. [Google Scholar]
- Jacobs, M.E. Effect of beta-alanine on glucose and fructose catabolism in Drosophila melanogaster with notes on beta-aminoisobutyric and gamma-aminobutyric acids. J. Insect Physiol. 1968, 14, 1259–1264. [Google Scholar] [CrossRef]
- Kühnlein, R.P. Lipid droplet-based storage fat metabolism in Drosophila. J. Lipid Res. 2012, 53, 1430–1436. [Google Scholar] [CrossRef] [Green Version]
- Colinet, H.; Larvor, V.; Bical, R.; Renault, D. Dietary sugars affect cold tolerance of Drosophila melanogaster. Metabolomics 2013, 9, 608–622. [Google Scholar] [CrossRef]
- Arrese, E.L.; Soulages, J.L. Insect Fat Body: Energy, Metabolism, and Regulation. Annu. Rev. Entomol. 2010, 55, 207–225. [Google Scholar] [CrossRef] [PubMed] [Green Version]
- Aguila, J.R.; Suszko, J.; Gibbs, A.G.; Hoshizaki, D.K. The role of larval fat cells in adult Drosophila melanogaster. J. Exp. Biol. 2007, 210, 956–963. [Google Scholar] [CrossRef] [PubMed] [Green Version]
- Cormier, R.P.J.; Champigny, C.M.; Simard, C.J.; St-Coeur, P.D.; Pichaud, N. Dynamic mitochondrial responses to a high-fat diet in Drosophila melanogaster. Sci. Rep. 2019, 9. [Google Scholar] [CrossRef] [Green Version]
- Letellier, T.; Malgat, M.; Coquet, M.; Moretto, B.; Parrot-Roulaud, F.; Mazat, J.-P. Mitochondrial Myopathy Studies on Permeabilized Muscle Fibers1. Pediatr. Res. 1992, 32, 17–22. [Google Scholar] [CrossRef] [Green Version]
- Veksler, V.I.; Kuznetsov, A.V.; Sharov, V.G.; Kapelko, V.I.; Saks, V.A. Mitochondrial respiratory parameters in cardiac tissue: A novel method of assessment by using saponin-skinned fibers. BBA Bioenerg. 1987, 892, 191–196. [Google Scholar] [CrossRef]
- Kuznetsov, A.V.; Veksler, V.; Gellerich, F.N.; Saks, V.; Margreiter, R.; Kunz, W.S. Analysis of mitochondrial function in situ in permeabilized muscle fibers, tissues and cells. Nat. Protoc. 2008, 3, 965–976. [Google Scholar] [CrossRef]
- Iftikar, F.I.; MacDonald, J.R.; Baker, D.W.; Renshaw, G.M.C.; Hickey, A.J.R. Could thermal sensitivity of mitochondria determine species distribution in a changing climate? J. Exp. Biol. 2014, 217, 2348–2357. [Google Scholar] [CrossRef] [Green Version]
- Wishart, D.S.; Feunang, Y.D.; Marcu, A.; Guo, A.C.; Liang, K.; Vázquez-Fresno, R.; Sajed, T.; Johnson, D.; Li, C.; Karu, N.; et al. HMDB 4.0: The human metabolome database for 2018. Nucleic Acids Res. 2018, 46, D608–D617. [Google Scholar] [CrossRef]
Publisher’s Note: MDPI stays neutral with regard to jurisdictional claims in published maps and institutional affiliations. |


| Group Used for Normalization | SD | MSD | HSD | |||
|---|---|---|---|---|---|---|
| WT | MPC1def | WT | MPC1def | WT | MPC1def | |
| WT flies exposed to the SD | 1.00 ± 0.04 | 0.62 ± 0.03 | 0.79 ± 0.03 | 0.52 ± 0.01 | 0.70 ± 0.03 | 0.50 ± 0.01 |
| WT flies exposed to each diet | 1.00 ± 0.04 | 0.62 ± 0.03 | 1.00 ± 0.01 | 0.65 ± 0.01 | 1.00 ± 0.01 | 0.78 ± 0.01 |
| Metabolites | Relative Abundance (mM) | ||||||
|---|---|---|---|---|---|---|---|
| Standard Diet (SD) | Medium Sucrose Diet (MSD) | High Sucrose Diet (HSD) | VIP Score Component 1 | ||||
| WT | MPC1def | WT | MPC1def | WT | MPC1def | ||
| β-Alanine | 0.162 ± 0.008 | 0.240 ± 0.019 | 0.202 ± 0.021 | 0.329 ± 0.008 | 0.219 ± 0.012 | 0.340 ± 0.014 | 2.257 |
| 3-Hydroxybutyrate | 0.228 ± 0.017 | 0.249 ± 0.045 | 0.183 ± 0.021 | 0.166 ± 0.026 | 0.177 ± 0.024 | 0.196 ± 0.027 | 0.450 |
| 3-Phosphoglycerate | 0.969 ± 0.124 | 1.060 ± 0.176 | 1.008 ± 0.143 | 0.773 ± 0.087 | 1.097 ± 0.097 | 1.250 ± 0.249 | 0.051 |
| Acetate | 0.079 ± 0.013 | 0.064 ± 0.012 | 0.080 ± 0.011 | 0.094 ± 0.024 | 0.058 ± 0.006 | 0.052 ± 0.013 | 0.694 |
| Acetoacetate | 0.028 ± 0.003 | 0.022 ± 0.003 | 0.019 ± 0.002 | 0.015 ± 0.002 | 0.014 ± 0.003 | 0.024 ± 0.007 | 0.479 |
| Alanine | 0.182 ± 0.025 | 0.196 ± 0.016 | 0.193 ± 0.021 | 0.230 ± 0.019 | 0.170 ± 0.008 | 0.204 ± 0.015 | 0.794 |
| Argininosuccinate | 0.309 ± 0.077 | 0.275 ± 0.063 | 0.193 ± 0.048 | 0.361 ± 0.042 | 0.161 ± 0.029 | 0.193 ± 0.036 | 0.090 |
| Asparagine | 0.046 ± 0.005 | 0.053 ± 0.009 | 0.029 ± 0.005 | 0.033 ± 0.006 | 0.029 ± 0.004 | 0.039 ± 0.005 | 0.009 |
| Carnitine | 0.028 ± 0.003 | 0.018 ± 0.002 | 0.023 ± 0.003 | 0.018 ± 0.002 | 0.0200 ± 0.003 | 0.023 ± 0.004 | 0.629 |
| Citrate | 0.016 ± 0.002 | 0.017 ± 0.002 | 0.006 ± 0.002 | 0.007 ± 0.001 | 0.007 ± 0.002 | 0.008 ± 0.001 | 0.330 |
| Citrulline | 0.062 ± 0.005 | 0.090 ± 0.012 | 0.051 ± 0.007 | 0.072 ± 0.010 | 0.060 ± 0.008 | 0.063 ± 0.009 | 0.410 |
| Aspartate | 0.030 ± 0.004 | 0.027 ± 0.006 | 0.011 ± 0.002 | 0.010 ± 0.001 | 0.017 ± 0.002 | 0.016 ± 0.002 | 0.683 |
| Fructose | 1.316 ± 0.448 | 1.459 ± 0.185 | 2.697 ± 0.484 | 6.073 ± 1.303 | 2.900 ± 0.614 | 11.159 ± 1.938 | 1.879 |
| Glutamine | 0.542 ± 0.070 | 0.652 ± 0.079 | 0.413 ± 0.064 | 0.492 ± 0.051 | 0.560 ± 0.075 | 0.696 ± 0.094 | 0.664 |
| Fructose 6-phosphate | 0.103 ± 0.021 | 0.123 ± 0.023 | 0.117 ± 0.012 | 0.104 ± 0.025 | 0.116 ± 0.023 | 0.099 ± 0.033 | 0.311 |
| Fumarate | 0.005 ± 0.002 | 0.005 ± 0.001 | 0.006 ± 0.002 | 0.004 ± 0.001 | 0.004 ± 0.001 | 0.005 ± 0.001 | 0.199 |
| Glucosamine 6-phosphate | 0.054 ± 0.012 | 0.056 ± 0.009 | 0.112 ± 0.036 | 0.042 ± 0.003 | 0.085 ± 0.030 | 0.052 ± 0.022 | 0.854 |
| Glucose | 0.384 ± 0.027 | 0.411 ± 0.065 | 0.446 ± 0.087 | 0.981 ± 0.103 | 0.555 ± 0.094 | 1.096 ± 0.158 | 1.691 |
| Glucose-6-phosphate | 0.091 ± 0.010 | 0.128 ± 0.029 | 0.189 ± 0.041 | 0.249 ± 0.051 | 0.157 ± 0.026 | 0.349 ± 0.035 | 1.497 |
| Glutamate | 0.151 ± 0.013 | 0.131 ± 0.015 | 0.125 ± 0.014 | 0.085 ± 0.009 | 0.119 ± 0.018 | 0.122 ± 0.016 | 0.833 |
| Glycerol | 0.117 ± 0.016 | 0.170 ± 0.019 | 0.107 ± 0.017 | 0.176 ± 0.015 | 0.114 ± 0.014 | 0.264 ± 0.025 | 1.845 |
| Glycerol 3-phosphate | 0.332 ± 0.046 | 0.425 ± 0.014 | 0.384 ± 0.056 | 0.455 ± 0.070 | 0.371 ± 0.042 | 0.486 ± 0.045 | 1.126 |
| Glycine | 0.035 ± 0.008 | 0.033 ± 0.009 | 0.026 ± 0.005 | 0.048 ± 0.008 | 0.024 ± 0.004 | 0.095 ± 0.007 | 1.296 |
| Glycogen | 10.040 ± 1.393 | 9.447 ± 1.498 | 14.016 ± 1.825 | 23.099 ± 2.785 | 12.449 ± 1.687 | 21.292 ± 2.958 | 1.337 |
| Isocitrate | 0.045 ± 0.006 | 0.055 ± 0.008 | 0.028 ± 0.003 | 0.039 ± 0.004 | 0.035 ± 0.007 | 0.037 ± 0.005 | 0.061 |
| Isoleucine | 0.013 ± 0.002 | 0.015 ± 0.001 | 0.009 ± 0.001 | 0.010 ± 0.002 | 0.009 ± 0.001 | 0.008 ± 0.002 | 0.615 |
| Lactate | 0.038 ± 0.005 | 0.040 ± 0.006 | 0.048 ± 0.006 | 0.115 ± 0.019 | 0.039 ± 0.005 | 0.104 ± 0.014 | 1.661 |
| Arginine | 0.034 ± 0.004 | 0.035 ± 0.005 | 0.027 ± 0.006 | 0.027 ± 0.002 | 0.024 ± 0.005 | 0.021 ± 0.006 | 0.636 |
| Cysteine | 0.105 ± 0.027 | 0.085 ± 0.017 | 0.075 ± 0.024 | 0.063 ± 0.008 | 0.055 ± 0.009 | 0.098 ± 0.030 | 0.032 |
| Leucine | 0.026 ± 0.002 | 0.025 ± 0.003 | 0.019 ± 0.002 | 0.015 ± 0.001 | 0.017 ± 0.002 | 0.017 ± 0.003 | 1.010 |
| Proline | 0.093 ± 0.005 | 0.071 ± 0.004 | 0.080 ± 0.005 | 0.065 ± 0.005 | 0.052 ± 0.005 | 0.062 ± 0.007 | 1.1642 |
| Lysine | 0.076 ± 0.010 | 0.054 ± 0.007 | 0.025 ± 0.005 | 0.026 ± 0.002 | 0.020 ± 0.004 | 0.027 ± 0.005 | 0.815 |
| Malate | 0.097 ± 0.010 | 0.114 ± 0.014 | 0.019 ± 0.005 | 0.038 ± 0.009 | 0.052 ± 0.007 | 0.049 ± 0.010 | 0.309 |
| Ornithine | 0.041 ± 0.003 | 0.029 ± 0.004 | 0.025 ± 0.003 | 0.023 ± 0.002 | 0.017 ± 0.002 | 0.024 ± 0.002 | 0.888 |
| Oxaloacetate | 0.929 ± 0.140 | 1.079 ± 0.181 | 1.524 ± 0.233 | 1.531 ± 0.136 | 1.797 ± 0.049 | 1.793 ± 0.179 | 0.986 |
| Phenylalanine | 0.012 ± 0.002 | 0.009 ± 0.001 | 0.013 ± 0.003 | 0.006 ± 0.001 | 0.012 ± 0.001 | 0.007 ± 0.001 | 1.523 |
| Phosphoenolpyruvate | 0.055 ± 0.008 | 0.040 ± 0.007 | 0.039 ± 0.006 | 0.037 ± 0.002 | 0.041 ± 0.010 | 0.040 ± 0.007 | 0.534 |
| Pyruvate | 0.012 ± 0.001 | 0.012 ± 0.001 | 0.010 ± 0.001 | 0.013 ± 0.001 | 0.012 ± 0.001 | 0.018 ± 0.003 | 1.006 |
| Serine | 0.055 ± 0.012 | 0.099 ± 0.014 | 0.061 ± 0.003 | 0.102 ± 0.012 | 0.057 ± 0.008 | 0.113 ± 0.019 | 1.530 |
| Succinate | 0.091 ± 0.006 | 0.082 ± 0.011 | 0.085 ± 0.006 | 0.085 ± 0.006 | 0.053 ± 0.002 | 0.070 ± 0.003 | 0.428 |
| Sucrose | 0.015 ± 0.003 | 0.024 ± 0.003 | 0.028 ± 0.003 | 0.030 ± 0.004 | 0.024 ± 0.004 | 0.030 ± 0.006 | 0.965 |
| Taurine | 0.229 ± 0.020 | 0.245 ± 0.031 | 0.223 ± 0.027 | 0.268 ± 0.026 | 0.221 ± 0.020 | 0.279 ± 0.037 | 0.645 |
| Threonine | 0.086 ± 0.020 | 0.093 ± 0.012 | 0.054 ± 0.008 | 0.038 ± 0.003 | 0.050 ± 0.006 | 0.047 ± 0.008 | 0.793 |
| Trehalose | 0.009 ± 0.002 | 0.016 ± 0.003 | 0.010 ± 0.002 | 0.020 ± 0.002 | 0.012 ± 0.002 | 0.023 ± 0.005 | 1.654 |
| Tyrosine | 0.011 ± 0.001 | 0.015 ± 0.002 | 0.011 ± 0.001 | 0.008 ± 0.001 | 0.009 ± 0.001 | 0.008 ± 0.001 | 0.745 |
| UDP-glucose | 0.024 ± 0.005 | 0.025 ± 0.004 | 0.025 ± 0.006 | 0.016 ± 0.002 | 0.021 ± 0.003 | 0.023 ± 0.004 | 0.335 |
| Valine | 0.011 ± 0.002 | 0.010 ± 0.002 | 0.006 ± 0.001 | 0.008 ± 0.001 | 0.007 ± 0.001 | 0.007 ± 0.001 | 0.544 |
© 2020 by the authors. Licensee MDPI, Basel, Switzerland. This article is an open access article distributed under the terms and conditions of the Creative Commons Attribution (CC BY) license (http://creativecommons.org/licenses/by/4.0/).
Share and Cite
Simard, C.J.; Touaibia, M.; Allain, E.P.; Hebert-Chatelain, E.; Pichaud, N. Role of the Mitochondrial Pyruvate Carrier in the Occurrence of Metabolic Inflexibility in Drosophila melanogaster Exposed to Dietary Sucrose. Metabolites 2020, 10, 411. https://doi.org/10.3390/metabo10100411
Simard CJ, Touaibia M, Allain EP, Hebert-Chatelain E, Pichaud N. Role of the Mitochondrial Pyruvate Carrier in the Occurrence of Metabolic Inflexibility in Drosophila melanogaster Exposed to Dietary Sucrose. Metabolites. 2020; 10(10):411. https://doi.org/10.3390/metabo10100411
Chicago/Turabian StyleSimard, Chloé J., Mohamed Touaibia, Eric Pierre Allain, Etienne Hebert-Chatelain, and Nicolas Pichaud. 2020. "Role of the Mitochondrial Pyruvate Carrier in the Occurrence of Metabolic Inflexibility in Drosophila melanogaster Exposed to Dietary Sucrose" Metabolites 10, no. 10: 411. https://doi.org/10.3390/metabo10100411