Blockchain in Intelligent Transportation Systems

1
Faculty of Automatic Control and Computers, University Politehnica of Bucharest, 060042 Bucharest, Romania
2
Department of Mathematical Methods and Models, University Politehnica of Bucharest, 060042 Bucharest, Romania
*
Author to whom correspondence should be addressed.
Electronics 2020, 9(10), 1682; https://doi.org/10.3390/electronics9101682
Submission received: 1 September 2020
/
Revised: 30 September 2020
/
Accepted: 5 October 2020
/
Published: 14 October 2020
(This article belongs to the Section Networks)
Abstract
:Blockchain is an emerging technology that has shaken the financial sector, and which is already perceived as having an impact. A blockchain is a network of many interconnected nodes, both trustworthy and malicious, which can reach a consensus and generate valid data. The resulting information is packed into a block and permanently saved on the network in a tamper-proof way. In this paper, we propose an adaptation of blockchain for securely storing data in a vehicular-based network. Our approach can work for storing data such as traffic events and user reputation. The proposed solution has two interconnected components: the Intelligent Transportation System (ITS) blockchain and the reputation system. The paper presents synthetic tests which validate the use cases of the solution: users reporting speeds and alerts behind which we see a fair reputation system penalising the (wrong/false) users.
1. Introduction
1.1. Context
The world is in a state of constant digitalization of all industries—from entertainment to education, from finance to agriculture, and one of the faster-changing ones in the past ten years has been the automotive sector. It should also be noted that cars have become a culture this past century, one that has spread over the entire globe. It has shaped both the way people live, by influencing how cities are designed [1] and interconnected, and the economy, by creating new jobs [2] and enabling other industries to flourish.
One of the main directions that drive automotive innovation is safety. Car manufacturers strive to offer their clients safer and safer rides, and technological advancements enable to provide new levels of protection with every car generation. Government-backed organizations, such as European New Car Assessment Programme (EuroNCAP), oversee how these new systems act in real-world scenarios and assess how effective they are and how well they protect both drivers and pedestrians.
Most of the tests done by these car safety regulation organizations are either for the structural integrity of the car or for the reactive systems which intervene once the driver makes a mistake or when there is an imminent danger. Over time, these safety nets have proven to be indispensable. Still, a proactive way of tackling possible problems can complement the reactive safety features and offer a new level of trust in the car.
As previously stated, the automotive industry has had a significant impact on modern cities. But there is a new shift now to transition into a more connected state where everything is optimized; an idea called smart cities. Such a municipality uses secure, interconnected data sources like homes, crosswalks, street furniture, traffic lights, air quality sensors to create an ecosystem that can react and inform others of relevant changes. By tracking the traffic in a city, users can receive information that they would not have access to otherwise, information that could then be used either by drivers, to make better decisions when driving, or by the transportation system to streamline traffic.
Intelligent Transportation Systems (ITS) are extensions of the current rudimentary implementations that have not seen any significant change since their invention. Most of them are rigid and programmed to act a certain way, but ITS aims to tackle that problem and offer travelers shorter transition times, better fuel economy, and more safety. Such a system relies on consistent, trustworthy user data, and this raises the problem of privacy, transparency, and fair use. Europe’s General Data Protection Regulation imposes that the generated data cannot reveal someone’s identity to other untrusted entities. Also, existing applications such as Google Traffic or Waze are often used, but for users worried about their personal data, these systems are something of a black box. These requirements, along with the fact that past data should also be available without anyone having the ability to tamper it, point towards a possible solution—blockchain. Blockchain is a decentralized peer-to-peer technology where network participants can verify other users’ interactions with the network using specialized consensus protocols. While it is still a new technology, different research [3] and even final products [4] have proven its disruptive potential [5].
1.2. Problem
A possible proactive safety system could offer data regarding average speeds on a specific portion of the road, whether there is a traffic jam, and alerts for potential dangers that users might face, such as potholes, roadkills, storms or dangerous bends. The data comes from other users who announce the system or guarantee the information provided by other users.
The implementation should also be able to offer reliable data without being influenced too much by malicious intent. This can be achieved through:
- A hybrid blockchain—this type of blockchain can be accessed by anyone, just like a public blockchain such as Bitcoin. The main difference is that the consensus algorithm is run by pre-assigned nodes which are trusted, thus also acting as a private blockchain. All other nodes are deemed not trustworthy, and their data is judged based on previous interactions with the system
- A reputation system—within the concept, each user has a certain reputation depending on his history, more precisely depending on the data provided to the system or how he guaranteed information from another user. Therefore, with the help of the reputation system, we can realize the veracity of the information.
Our assumption is that all cars use and receive the same data, and that the mobile app on board is secured against malicious tempering. The users could also offer their data to create a dataset that resembles the real world as closely as possible.
1.3. Objectives
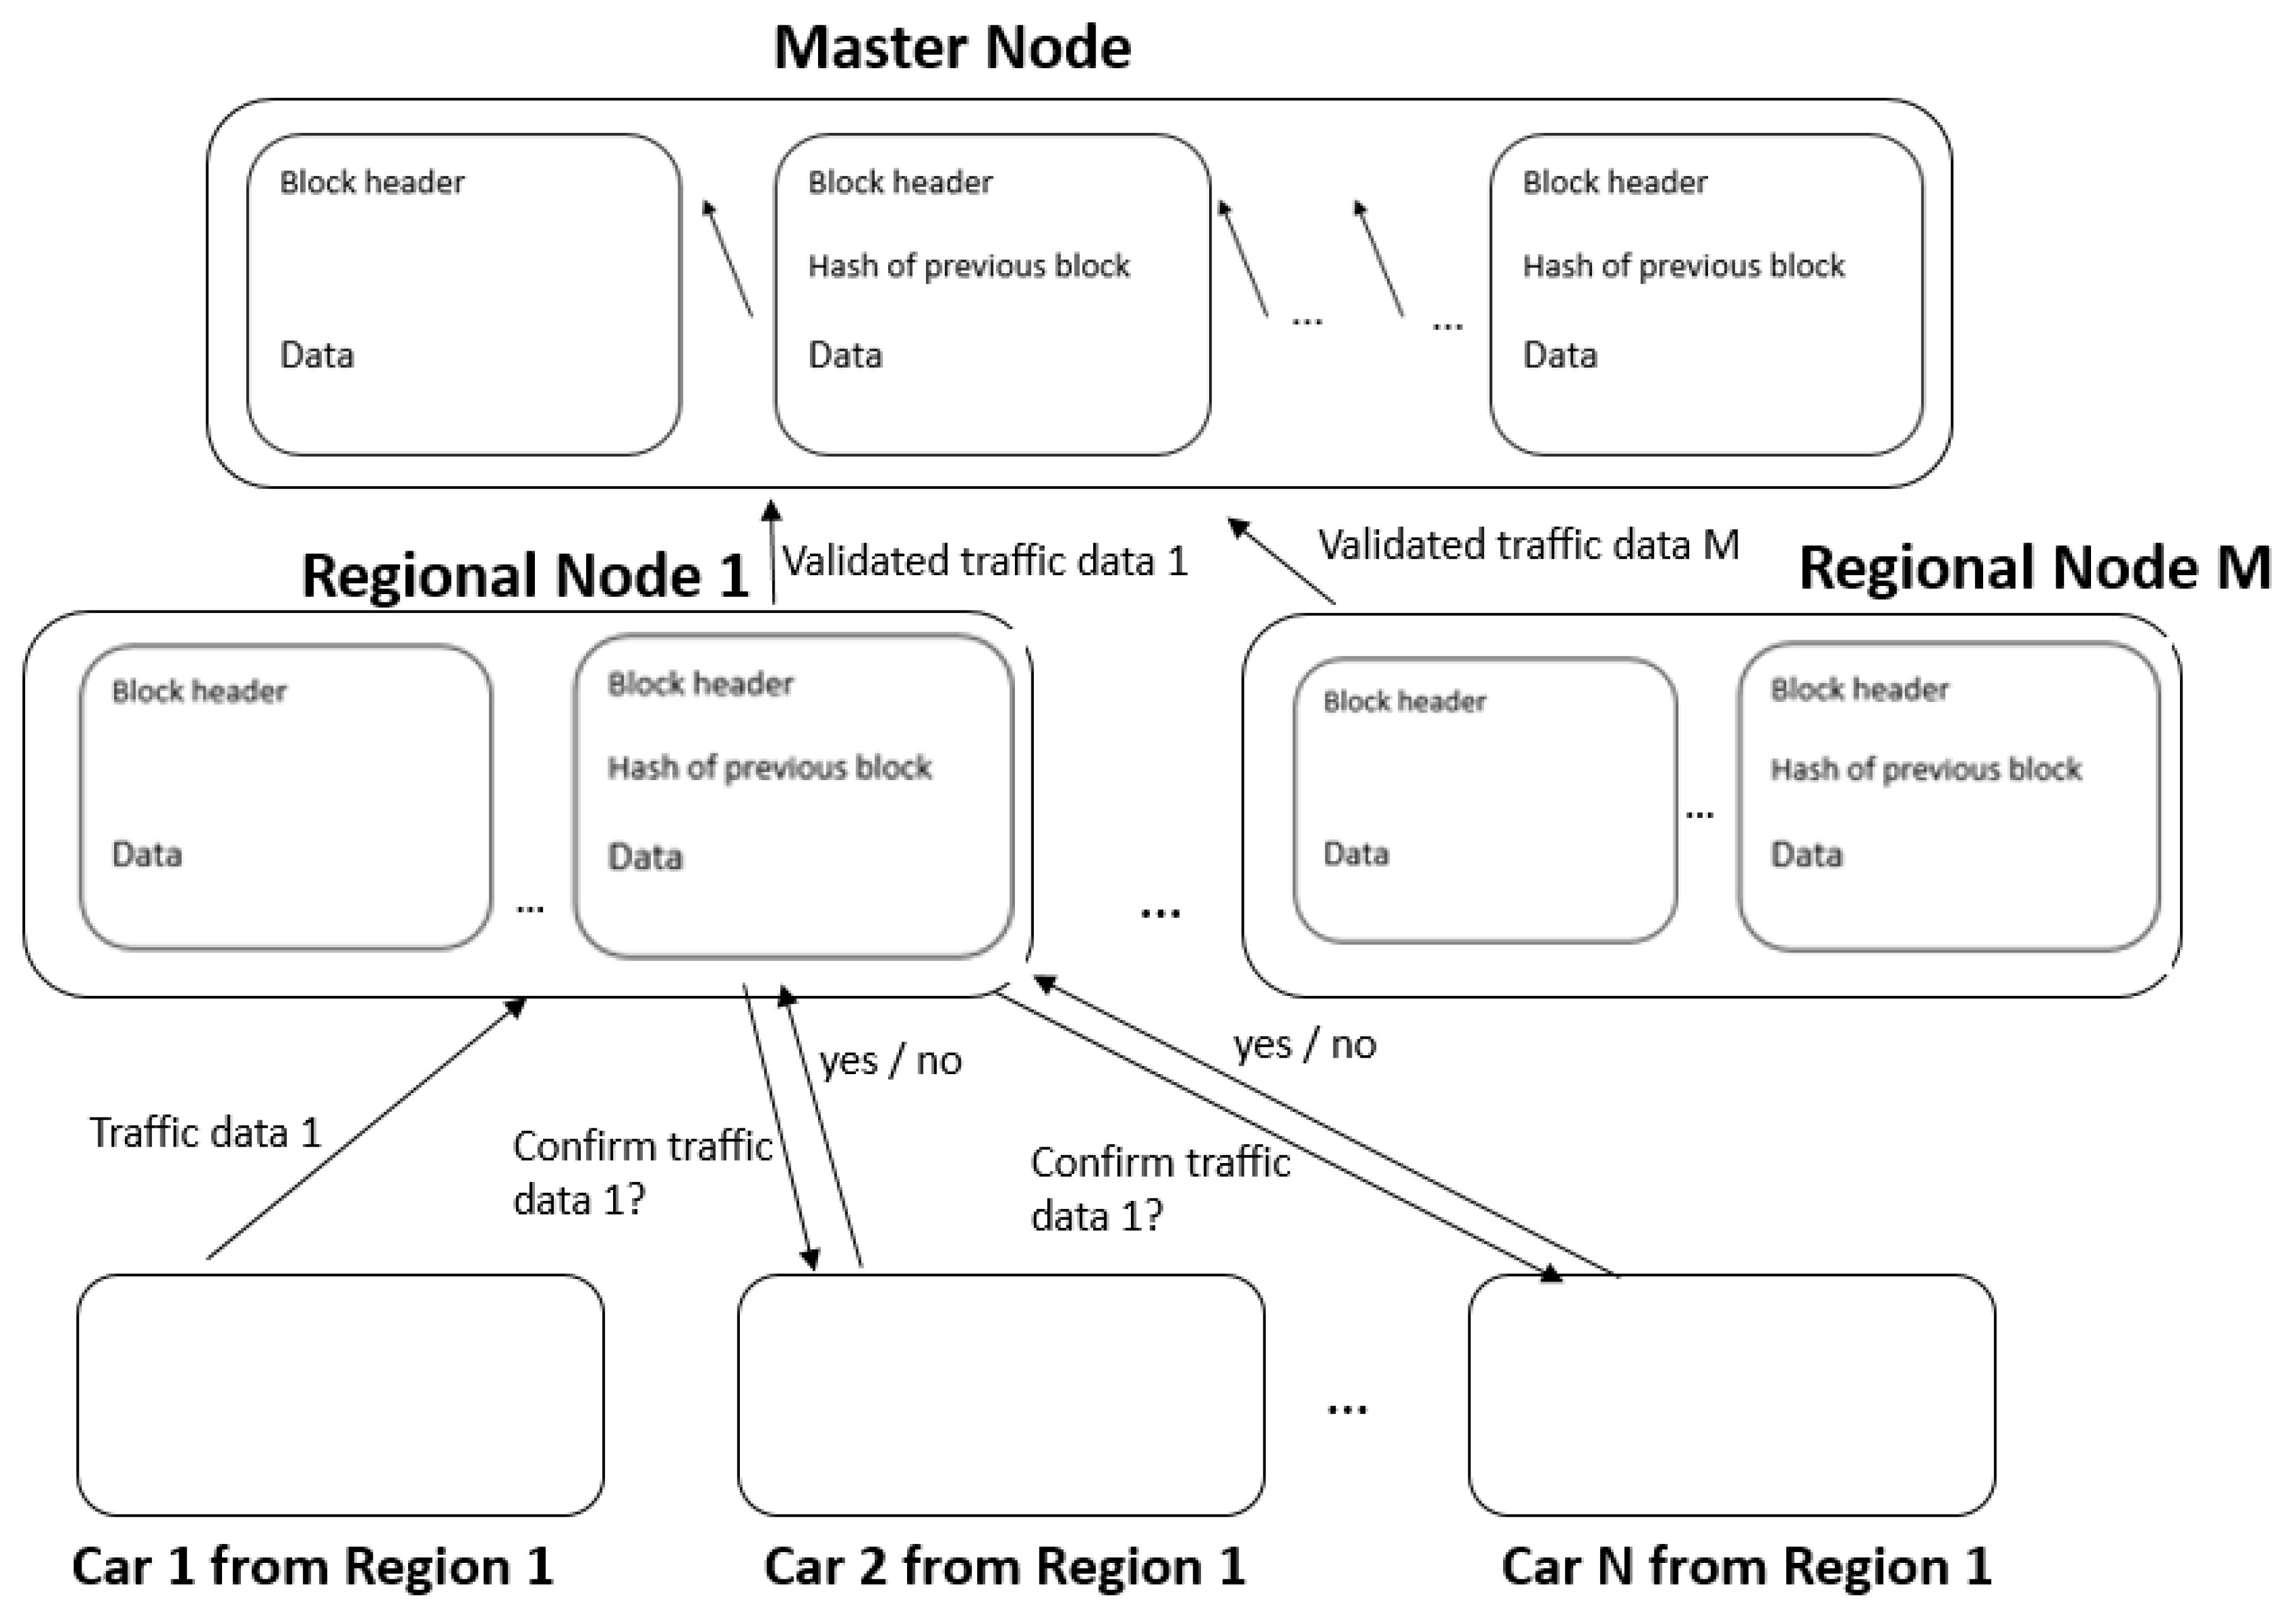
We present a proof-of-concept implementation of a hybrid blockchain that is applied in the Intelligent Transportation System capable of providing real traffic data to users. It collects user data, which is subject to a consensus algorithm that will generate reliable data that both drivers and Intelligent Transportation Systems can use to create a safer, more streamlined and healthier environment. To save only reliable data, we use a user reputation system which is applied both within the consensus algorithm and after it, in order to update the reputation of the participants. As shown in Figure 1, the consensus is applied regionally, and validated data will be permanently saved in regional blockchains and in a centrally stored blockchain.
2. Related Work
2.1. Blockchain in ITS
The blockchain technology has been in the spotlight for some time due to the popularity of cryptocurrencies such as Bitcoin and Ethereum. Nowadays, blockchain has been widely adopted in domains such as the Internet of Things [6], smart cities [7] and Intelligent Transportation Systems.
In Reference [8], the authors propose an ITS-oriented blockchain system, focusing on the main advantages such a model brings—security, trust and decentralization. The design is based on a seven-layer conceptual model for blockchain, standardizing in this way the typical architecture and major components of blockchain systems.
In Reference [9], the authors analyse the use of blockchain in various domains, and for ITS they emphasise the role in securing the data. References [10,11,12] models are similar to the one we propose in this paper: a blockchain-based approach whose aim is to be centred around data availability. The third paper presents a very detailed and up to date implementation that uses already popular blockchain products such as the IOTA Tangle, InterPlanetary File System (IPFS), and the Ethereum Virtual Machine to execute smart contracts.
2.2. Reputation Systems
The other main component our solution is the reputation system that aims to create a fair medium where honest users can have a more significant say in the result when compared to others that tend to report incorrect data.
In Reference [13], the authors propose a reputation system for sending and receiving files where the final reputation is not stored on the blockchain. If a user wants to know the reputation of another node, they need to compute it by themselves. The system works by creating a positive transaction if the user has successfully received the requested file signed with the private key of the sender. If these conditions are not met, a negative transaction is created. Then the transaction is verified with both parties by requesting a signed proof that contains the file hash and a nonce sent by the miner doing the verification. In order to prevent a user from creating multiple accounts, the authors suggested linking each user to something personal, such as an IP address.
The authors of Reference [14] propose a reputation management system for vehicular ad hoc networks (VANETs) whose aim is to detect dishonest users and their data and offer incentives based on how reliable the provided data is. These incentives influence a user’s reputation, which in turn decides how accurate his data can be.
In Reference [15], the authors describe a system that integrates other actors than drivers. These new entities have the responsibility of checking the traffic data reported by drivers and computing their new reputation after parsing the reports. In this solution, vehicles can communicate with one another and check someone’s reputation when need be.
The authors of Reference [16] propose an elegant solution that aims to solve three of the main problems such a system should: guaranteed confidentiality, usage of the reputation metric in traffic event validation, and the ease of implementation in a real-life scenario. The protection of a user’s data, one of the most talked-about topics in the world right now, is done through a series of security policies published on the blockchain through which a user can decide what data he wants to share with the system. The user’s device does this through a specialized module, which guarantees compliance with every policy. Anyone can also verify this because of the open-source nature of the implementation. The other two tackled problems are inherently part of the solution through the way it has been built and structured.
Comparing with other proposals, we find that all reviewed literature have shortcomings when it comes to offering a heterogeneous system that combines a reputation system and a blockchain ITS system. Reference [13] presented a promising candidate but lacked a reputation system, and the number of already established components can induce an unaccounted-for overhead. Thus, it can only represent a reference from a theoretical point of view.
When it comes to reputation systems, specialty literature offers a lot more options. Despite all this, most of them had particular use cases, none of which aligned with the purpose of this paper. Reference [16] introduced a solution that best fits this paper’s use-case and offers valuable insight into how such a system should work. This makes it a suitable reference model for the solution’s implementation. Unlike the previously mentioned solution, our system design has better performance in terms of data processing level, while having a much lower failure rate.
During our research, we noticed that combining concepts such as reputation, blockchain, and intelligent transportation systems are at the beginning of the road. A software system applied in an intelligent transportation system that is based on blockchain and that uses reputation must ensure requirements such as confidentiality of personal data, providing reliable data to customers, ease of implementation in a real-life scenario, and performance. The articles presented in related work have certain deficiencies, not ensuring at least one of the previously mentioned requirements. Starting from one of the works of two authors of this paper (Reference [16] ), we achieve optimization of the system performance, providing better response times for flows such as consensus algorithms, network loading, and others. In order to consolidate the previously mentioned statements, we have developed a simulator that implements all entities and all communication flows.
3. Proposed Solution
The proposed solution consists in creating a distributed database that contains information regarding traffic events, a database useful for car navigation algorithms. These data are provided from the field by the users of the proposed solution and validated by other users from the same geographical area through a regional node. To ensure that validated information is reliable, we also use a reputation system, which also saves data in the blockchain. Once a road event is validated, the reputation of all participants is updated according to the input, and all this information is permanently saved in a blockchain stored on a central node.
3.1. System Design
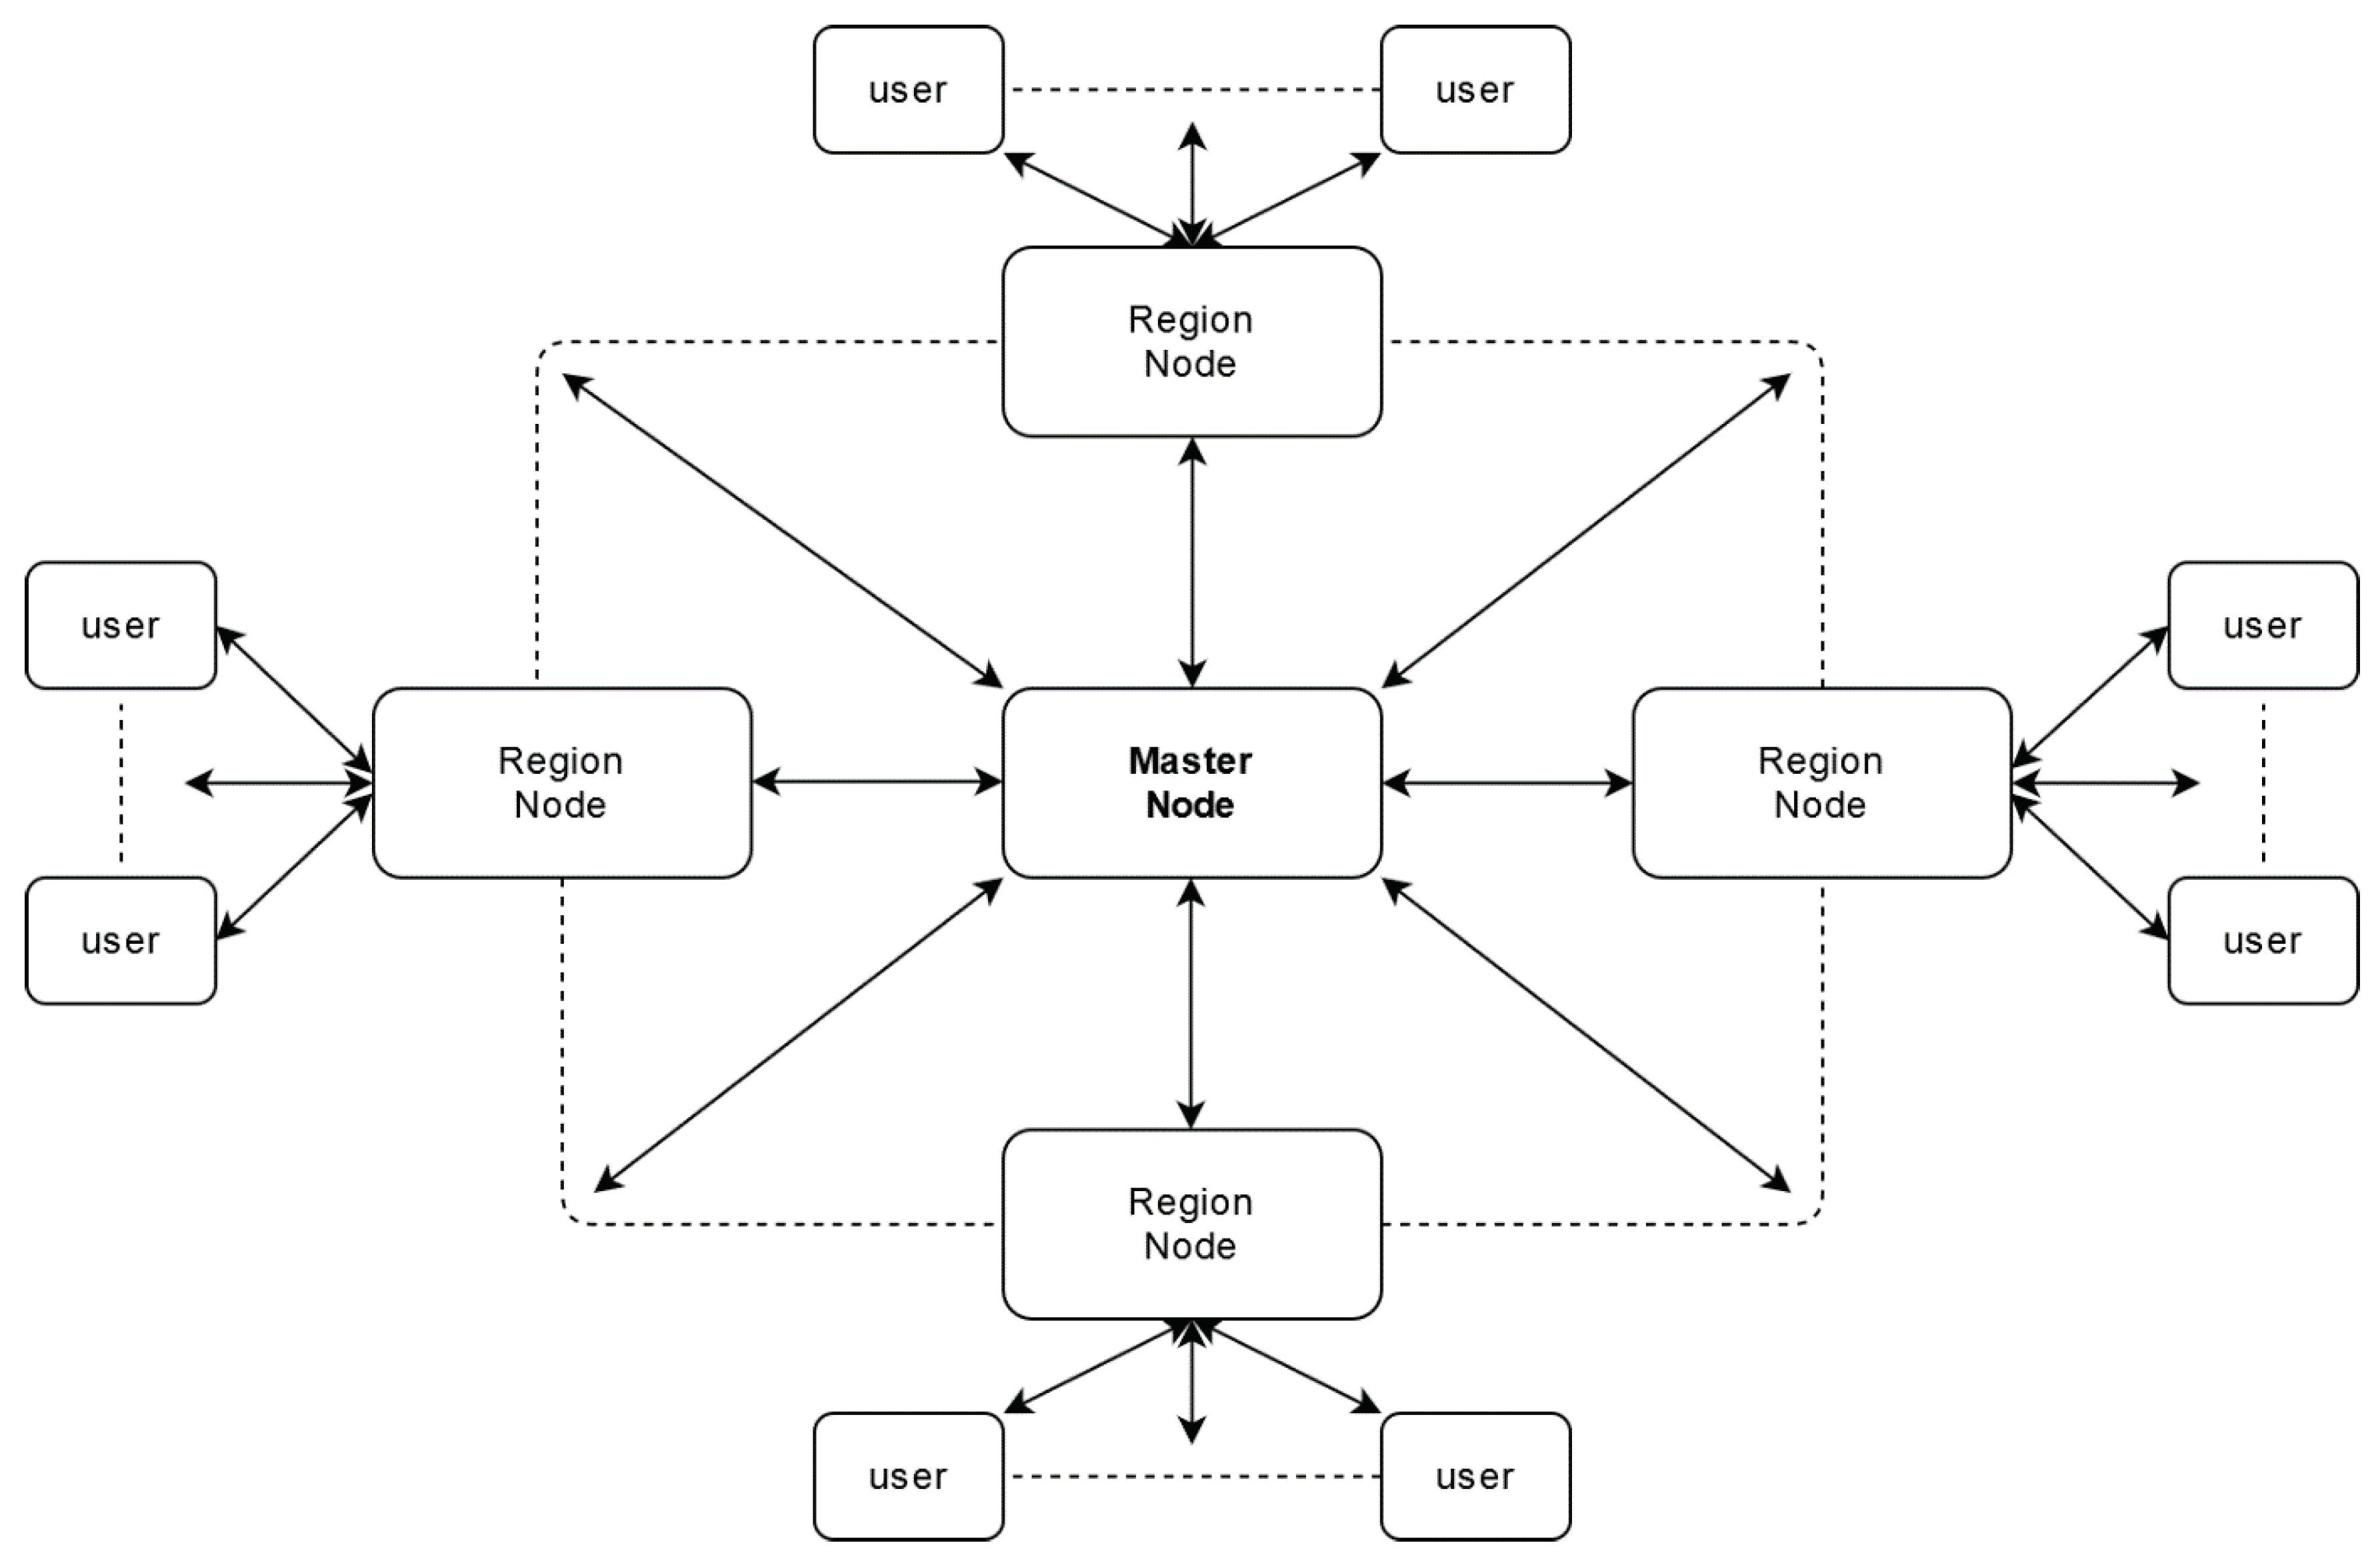
In a standard blockchain implementation, all nodes are expected to be the same and communicate between themselves freely. The proposed solution brings some restrictions to this design due to the nature of the blockchain and introduces three specialized nodes, each with its specific function. Figure 2 depicts the placement of these three actors in the system and how they communicate with one another.
3.1.1. User Nodes
This is an insecure type of node that can be considered malicious. Hence the data reported by this node is parsed through the perspective of its reputation. The handling of user-data ensures that no one can access a user’s sensitive information and that other external actors cannot trace a user’s behaviour. This type of node communicates exclusively with the region node assigned to the location he currently is in and will switch to another region node if he has left the influence area of the first one. The system automatically assigns users to a region node based on their GPS location.
A car becomes a node within the application once the driver installs the client application on his device. Please note that although our proposed solution might seem technologically ahead of current capabilities, here by device we mean either the personal smartphone of the driver (current technologies easily incorporate many cores and can run advanced computations) or the on-board car computer.
3.1.2. Region Nodes
This is a secure node that gathers data from all users located in the region that is under its jurisdiction. Said data is passed through a consensus algorithm that creates new reliable traffic and reputation data. These new values are saved on the region blockchain and sent to the master node. Region nodes are processing units that belong to the system and have the role of relieving master node of additional processing, such as running consensus algorithms from many locations. The number of regional nodes is established according to the number of user nodes, not having a direct impact on the security level. Thus, in regions with a large number of users, a greater number of regional nodes is recommended, to avoid overloading it with processes and congesting the network.
Note—Every region node has a well-defined area of action such that no two nodes of this type overlap. This ensures the correct parsing of all data, resulting in a trustworthy data source.
3.1.3. Master Node
This is also a secure node. It gathers data from all region nodes without checking it because those nodes are trusted. The data from all region nodes are packed into a new block, which is added to the master blockchain. This chain is useful for car navigation algorithms that support users to traverse routes consisting of two or more regions.
3.2. Solution Logic
This section provides insight into how the system works, what constraints and dependencies are part of the system and why this is a viable solution for the problem the paper aims to solve.
The main objective of the paper is to establish the level of trust of the information generated by users within the field. This level is established within the consensus mechanism that takes place in a region and in which only users from this geographical area participate.
Also called user nodes, they transmit to the corresponding region node data such as speed and location, but also other alert information, such as ice on the road, traffic accident, flood, and so forth. The system calculates the average speed taking into account the reputation of the users and considering the lane and the direction of travel. Alerts are subject to a consensus mechanism in which the region node redirects data to other user nodes within the same geographic area. The user nodes respond to the region node with a message yes or no. The region node collects all data and, depending on the reputation of each user, establishes the level of trust in the information. If this level exceeds a certain threshold, the information is considered reliable, the reputation of the users who guaranteed the information is increased, and the reputation of the users who invalidated it is lowered.
Our proposal implies that the region node listens to traffic information for a certain period and, once this time threshold is met, the validated data will be permanently saved in the regional blockchain and also sent to the master node. The region nodes can be created at any time, the only constraint being that the supervised area does not overlap with that of any other region node.
Together with the region nodes, the master node represents the two trusted entities of the system. The master node is the central entity that manages all subordinate region nodes, authenticating their identity through a PKI system. Master also has the role of storing and maintaining the central blockchain that contains only validated traffic data, coming from the region nodes. This chain serves as a source of information for a routing algorithm that directs customers through multiple regions.
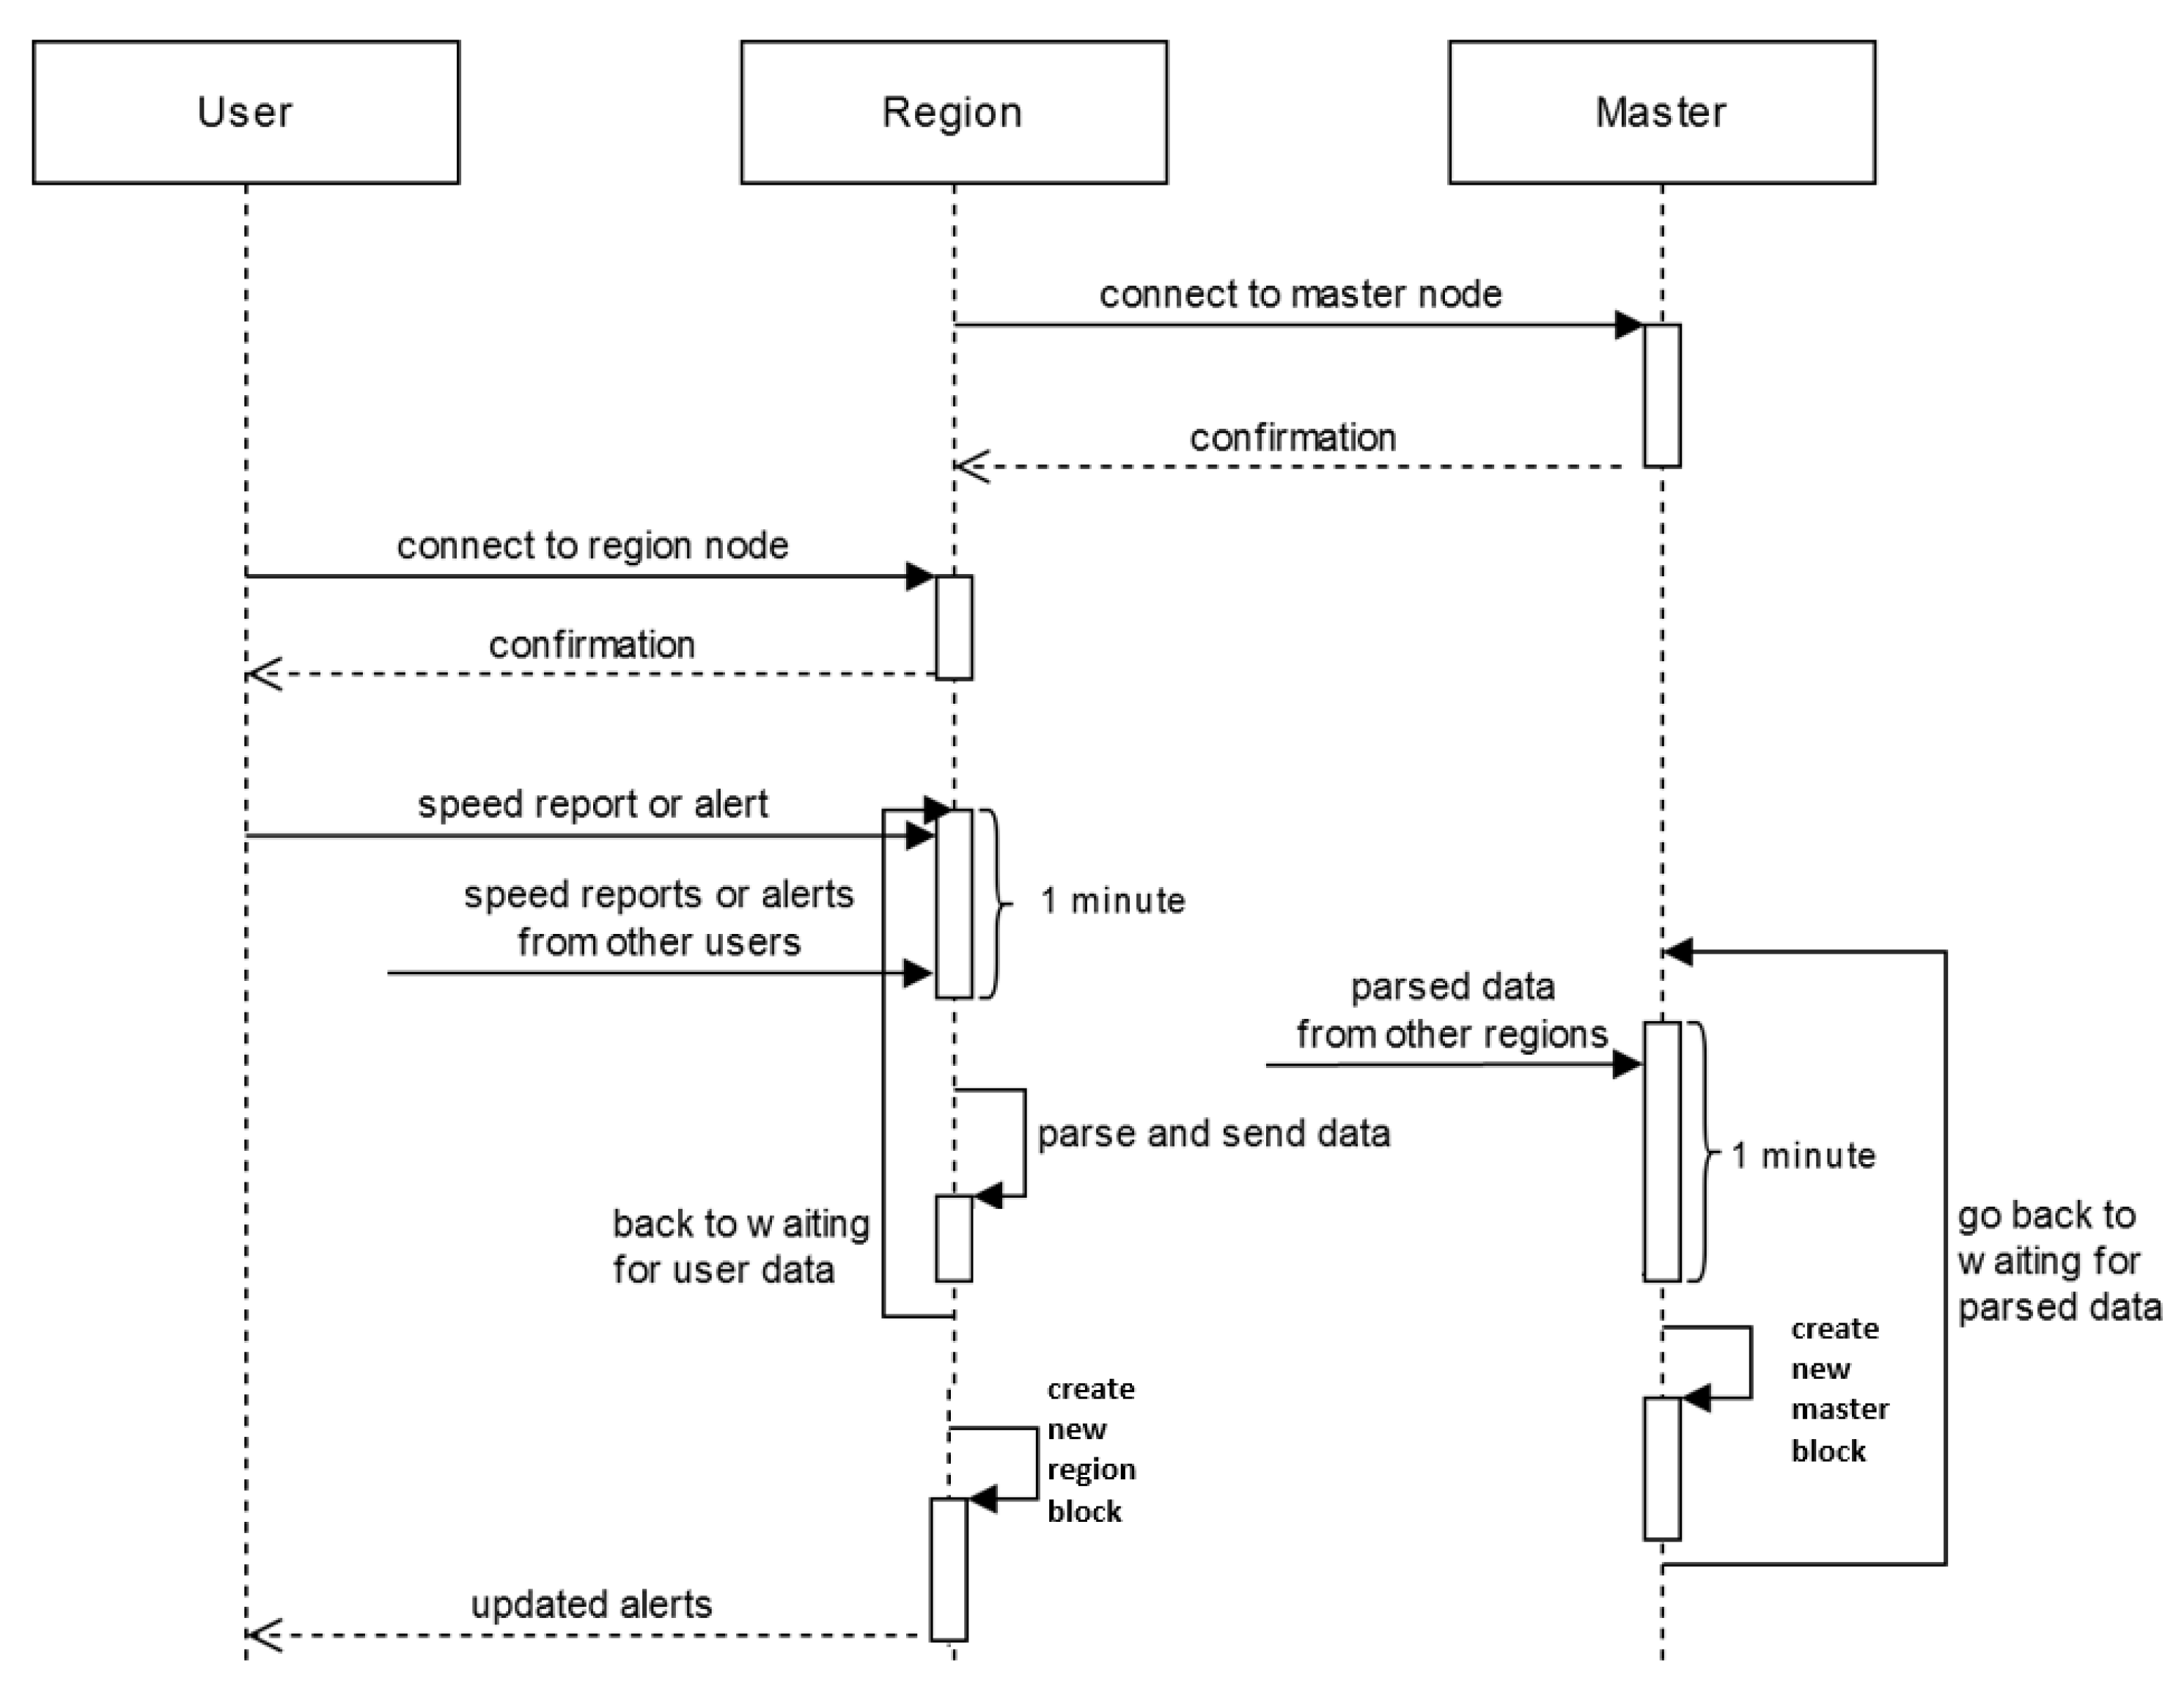
Figure 3 highlights the way these nodes communicate, what data is passed between them, and the main actions they have to perform.
4. Implementation Details
4.1. Computing Directions of Travel
Every time a user sends its location and speed, the region node computes the bearing (or direction) based on the previous report. If there is no prior location sent by the user, which happens if a user has just connected to the region node, the speed report is ignored.
A bearing is the clockwise angle, measured in degrees, between the straight line from a user’s location to the north pole and the direction said user is facing. These bearings are used to compute road direction in a certain spot through a clustering process that outputs the general directions that cars in that location are going. Instead of using a general-purpose clustering algorithm, such as k-means, the solution uses a more direct approach that is faster and more efficient.
The clustering process uses data about the maximum difference in direction angle between cars moving in the same direction. Said data is dependent on the speed of the vehicle, the distance it moved horizontally, such as when changing lanes, and the time between sending two speed reports.
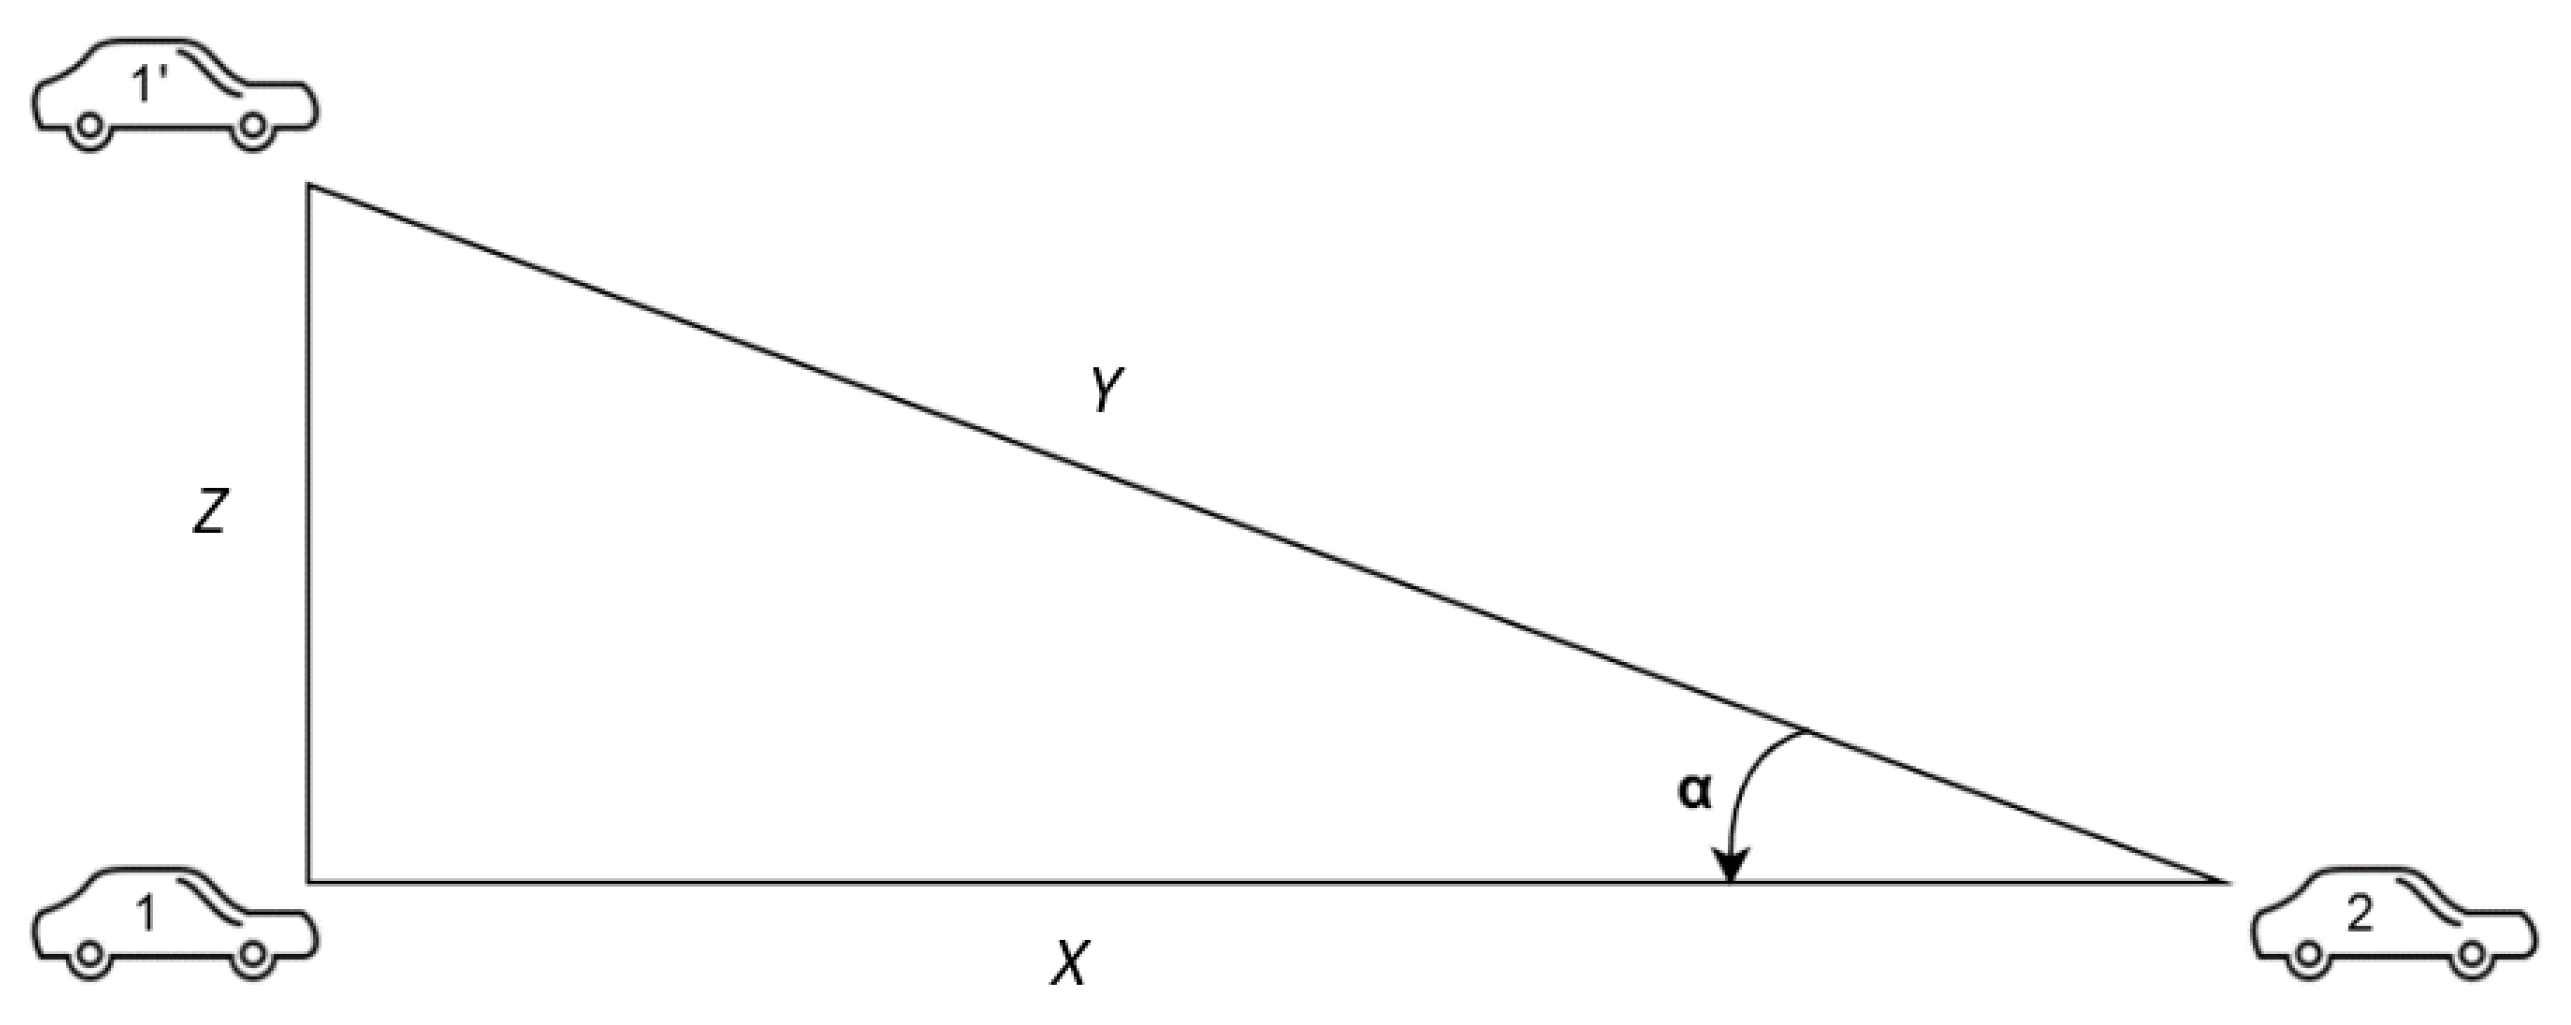
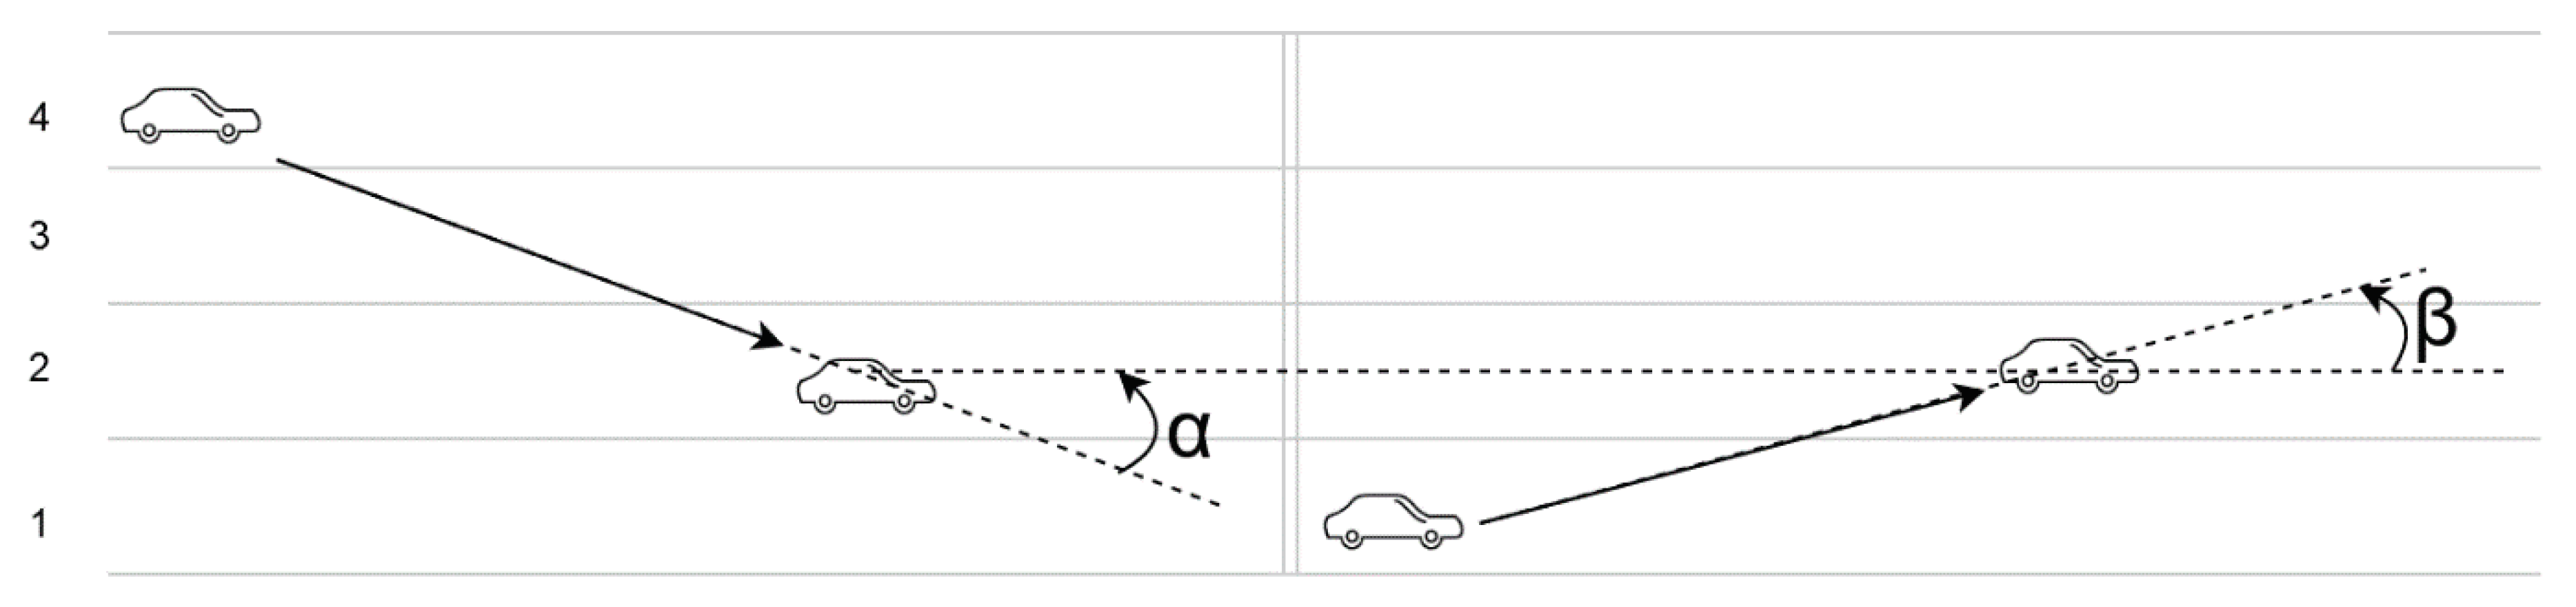
Figure 4 depicts two cars going on the same road, one of them going straight from point 1 to point 2, the other one changing lanes from point 1’ to point 2. There are four variables at play here:
- X—the distance the first car covers
- Y—the distance the second car covers
- Z—the distance the second car moved horizontally
- —the angle between the direction of the two cars
Based on this example, the angle can be computed as:
The distances the two cars move (X and Y) relies on the velocity of the vehicle and the time between the speed reports. An ideal scenario is considered, where a speed report is sent when starting to change lanes and the other one when the driver has merged onto the desired lane. The relation between them is directly proportional, which means that worst-case scenarios emerge when these values are low.
Z depends on how many lanes the second driver changes and how wide a lane is. According to data from both Europe and the United States, the average width is 3.5 m, which means that Z will be considered as a multiple of this value.
Table 1 shows the angle between the directions of two cars going the same way (one changing lanes and the other going straight) by variating the three values it depends on:
- speed∈ {20 km/h, 50 km/h}
- time between speed reports ∈ {5 s, 10 s, 15 s}
- number of lanes changed ∈ {1, 2, 3} → Z ∈ {3.5 m, 7 m, 10 m}
This data highlights that a worst-case scenario, where a car is going 20 km/h, changes three lanes in 5 s, would have a final angle of 20.7 when compared to a vehicle going straight on the final lane. If the road consists of curves, the angle of the curve is added to the angle.
Most roads in the world do not have more than four lanes, highways being the only cases in which there might be more. But these are high-speed roads where a car cannot change between the first and the last lane at a speed of 20 km/h. This means that a multi-lane change incurs a higher velocity than 50 km/h, which results is a smaller angle due to the travelled distance (Y), as shown in Table 1.
Figure 5 exemplifies another scenario in which a car changes two lanes and the other one just a lane, ultimately reaching the same one. Based on the data in Table 1, could be as big as 14.1, while could be equal to 7.2, which points towards a total direction difference of 21.3.
Based on the presented data and considering an extra precaution in case of unaccounted for events, the value of 25 has been chosen to be the maximum circle sector in which the direction of all cars going in a direction can be found. This value is used in the clustering process.
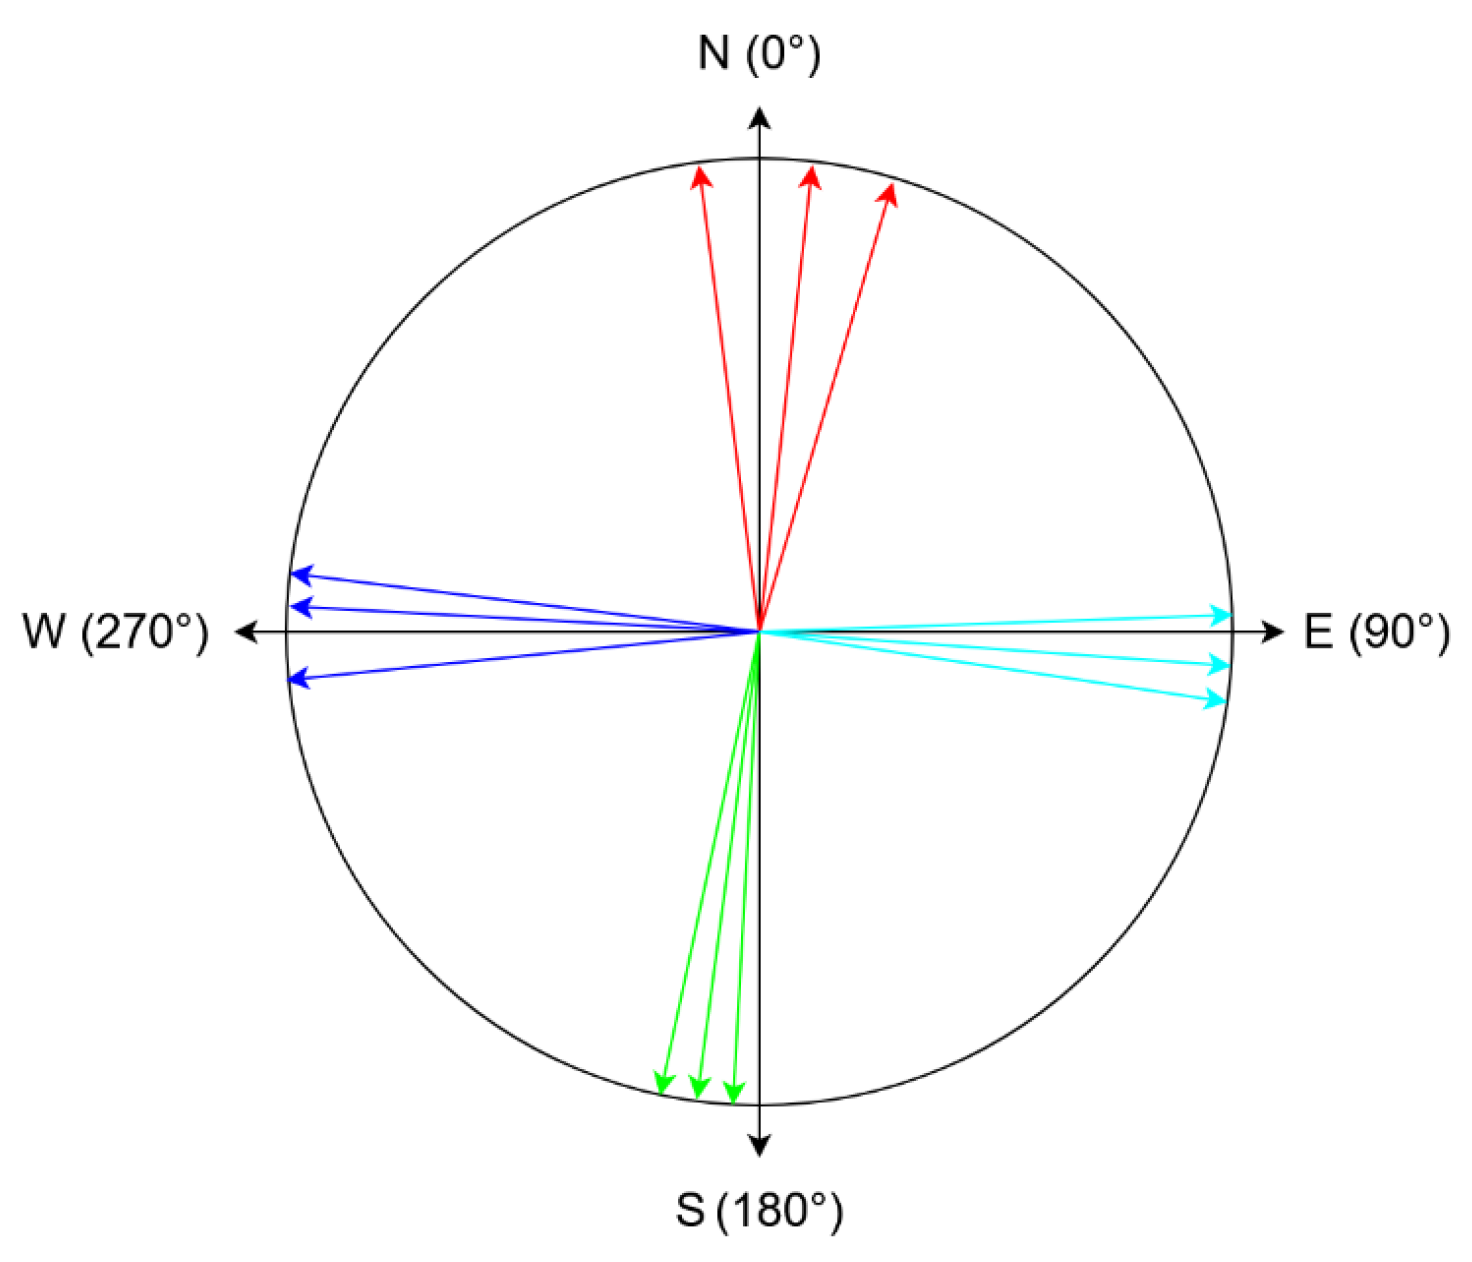
The clustering algorithm works by going through the sorted user directions and consists of four steps:
- Find the first gap greater than 25. In Figure 6, this would translate to iterating until reaching the first cyan direction, which would constitute the start of a direction sector.
- Go through direction values until the difference between the current direction and the start of the direction sector is bigger than 25. The current direction will be considered the start of the next direction sector. In Figure 6, this would coincide with finding the first green direction, which will become the start of the green direction sector.
- Compute the mean value of the directions in the sector that has just ended. In Figure 6, this translates into calculating the mean value of the cyan directions, which would result in the final cyan direction.
- If the start of the next sector is different from that start of the first sector computed, go back to step 2. In the example from Figure 6, the algorithm would compute the final green and blue directions. The calculation of the final red direction would coincide with finding the start of the first cyan direction again, which would end the algorithm.
4.2. Speed Alerts Consensus Algorithm
The speed consensus algorithm is one of the most critical parts of the system because it has the responsibility of creating a reliable snapshot of a system in which both fair and malicious users participate.
The algorithm computes the actual speed in a specific place, based both the users’ reputation and on the data collected from users that have passed through that point in the one-minute time interval. The speed is captured automatically, without the user’s intervention, if he/she wants to share it with the system.
After the one-minute mark has passed, the system goes through all geographic points where a speed report has been made and applies the following steps:
- Compute the main directions using the clustering process previously described.
- For each direction, calculate the mean speed with respect to the reputation of the user that has created the report.
- Check every user’s answer against the computed averageSpeed. The value computed at step 2 has a tolerance of 20%, thus, only if a user has reported a velocity that is in the interval [80% * averageSpeed, 120% * averageSpeed], will the answer be counted as correct.
At the end of this algorithm, the region node will have an overview of the traffic under its jurisdiction that will be sent to the master node. The region node is responsible for creating a new block within the region blockchain, and the same data is sent to the master node. Together with reliable data from other region nodes, the master node will create a new block in the master blockchain.
4.3. The Alert System
The alert system is used for reporting and interacting with special events such as accidents, potholes, road-side constructions, or any other type of alert that might be of use to drivers. It is an indispensable component of the proposed solution because it informs drivers about events that they should pay attention to, thus encouraging them to act more proactively.
This also offers users an opportunity to interact with that alert and give feedback about whether it is valid. Interacting with an already existing alert is conditioned by the proximity between the user and the event. If a user is further than a certain distance from the alert, his vote will be ignored.
When an alert is first created, it is in a voting state that lasts 10 min, in which alerts stay active for users to vote. At the end of the 10 min, a decision about the validity of the alert is taken, based on the number of votes. At this point, users are also rewarded reputation points based on their votes and on the consensus answer. Both the signaling of a road event and its voting are done manually by the users, using the client application.
If the alert is deemed active, it remains that way until the number of negative votes surpasses the positive ones or until an hour has passed until the last positive interaction. The latter condition tackles the case in which an alert has amassed a lot of positive votes, and it would take a considerable amount of time for the vote balance to tip the other way.
It should be noted that alert votes are represented by a user’s reputation—this way, the system is guaranteed to be fair by tackling the impact of malicious interactions.
The alert system takes place only within the respective area, and the entity that manages the entire communication flow is the region node. The user nodes do not communicate directly with each other but through the region node. If a road event is validated, a new block is created within the region blockchain, and the data related to this event are sent to the master node. Together with other reliable data from other region nodes, the master node creates a new block within the master blockchain.
4.4. Reputation System
The reputation system is a central point of the proposed solution which implements a consensus algorithm where a user’s weight is directly proportional to his reputation, and the user’s answer directly influences a user’s reputation when compared to the final solution of the topic. This creates a feedback loop that makes the system self-stabilize over time and output reliable data for drivers and third parties to use.
The reputation of a user is represented by a number between 0 and 1, and it is used in the two previously highlighted cases. The following sections present how a user’s reputation is affected in both events.
4.4.1. Speed Reports
At the end of the speed consensus algorithm, all the reports that a user has made in that one-minute interval are categorized into correct and incorrect answers. Using the cardinal of these two categories and the current reputation that a user has, the system computes a change in reputation.
The main idea of the algorithm is presented below. The speedCoefficient is a number that lowers the impact the algorithm has on the user’s reputation. This is a desired effect because users should not be able to easily attain a high reputation because it could be used by malicious users to play the system.
The change in reputation is calculated based on the correct answers, incorrect answers, and the speedCoefficient, as presented in Algorithm 1.
| Algorithm 1 Reputation update. |
| answerRatio = (noCorrectAns − noWrongAns)/noAns => ∈ [−1, 1] |
| reputationChange = answerRatio * speedCoefficient => ∈ [−speedCoef, +speedCoef] |
if reputationChange > 0:
|
else:
|
If the reputation of the user should grow, then 0.5 represents a critical point where the incentive is at a maximum. This is because, past a certain point, the reward starts to decrease in order to keep the maximum reputation capped at 1.
If the user’s reputation should decrease, then the change in reputation is always done with respect to the current reputation of a user. This penalizes trustworthy users more and makes sure that the minimum reputation cannot go below 0.
For example, if a user has a reputation of 0.9 and only makes invalid reports in a one-minute interval in which the region node collects data, his reputation would decrease in relation to 0.9. For this user to get back to approximately the reputation, he would need to have nine one-minute intervals in which his reputation increases at a maximum rate because the growth would happen with respect to 0.1. This creates a balanced system where users cannot easily attain reputation and where high reputation can be easily lost and hard to win back.
4.4.2. Alerts
In the case of alerts, the change in reputation occurs ten minutes after an alert is created, when the voting period ends, and the alert consensus algorithm outputs the validity of the alert.
Users are then rewarded based on how they voted. Computing the reputation change is similar to the speed reputation case presented in the previous section. The main difference is that there is always only one answer which is either correct or incorrect. This means that when it comes to alerts, the reputation change will always be the maximum possible.
Because a user automatically sends speed reports, but he has to interact with alerts manually, there are bound to be a lot fewer reputation rewards for alerts than for speed reports. In order to make alerts interaction impactful, the coefficient used for calculating alert reputation changes is bigger than the one used in the case of speed reports.
4.4.3. Initial Reputation and Coefficients
The initial reputation of a new user plays a critical role in balancing the system. First and foremost, it signifies the weight new users have when deciding the state of traffic. The value should also offer room for the reputation of malicious users to fall.
It also sets a standard of how important reports made by high reputation users are when compared to regular users. This is because ordinary users are not expected to drive too much, which has a direct impact on someone’s reputation. Such users are bound to manifest more false positives and false negatives, which would keep their reputation in the middle, at 0.5.
Based on this analysis, the initial reputation of a user has been set to 0.3.
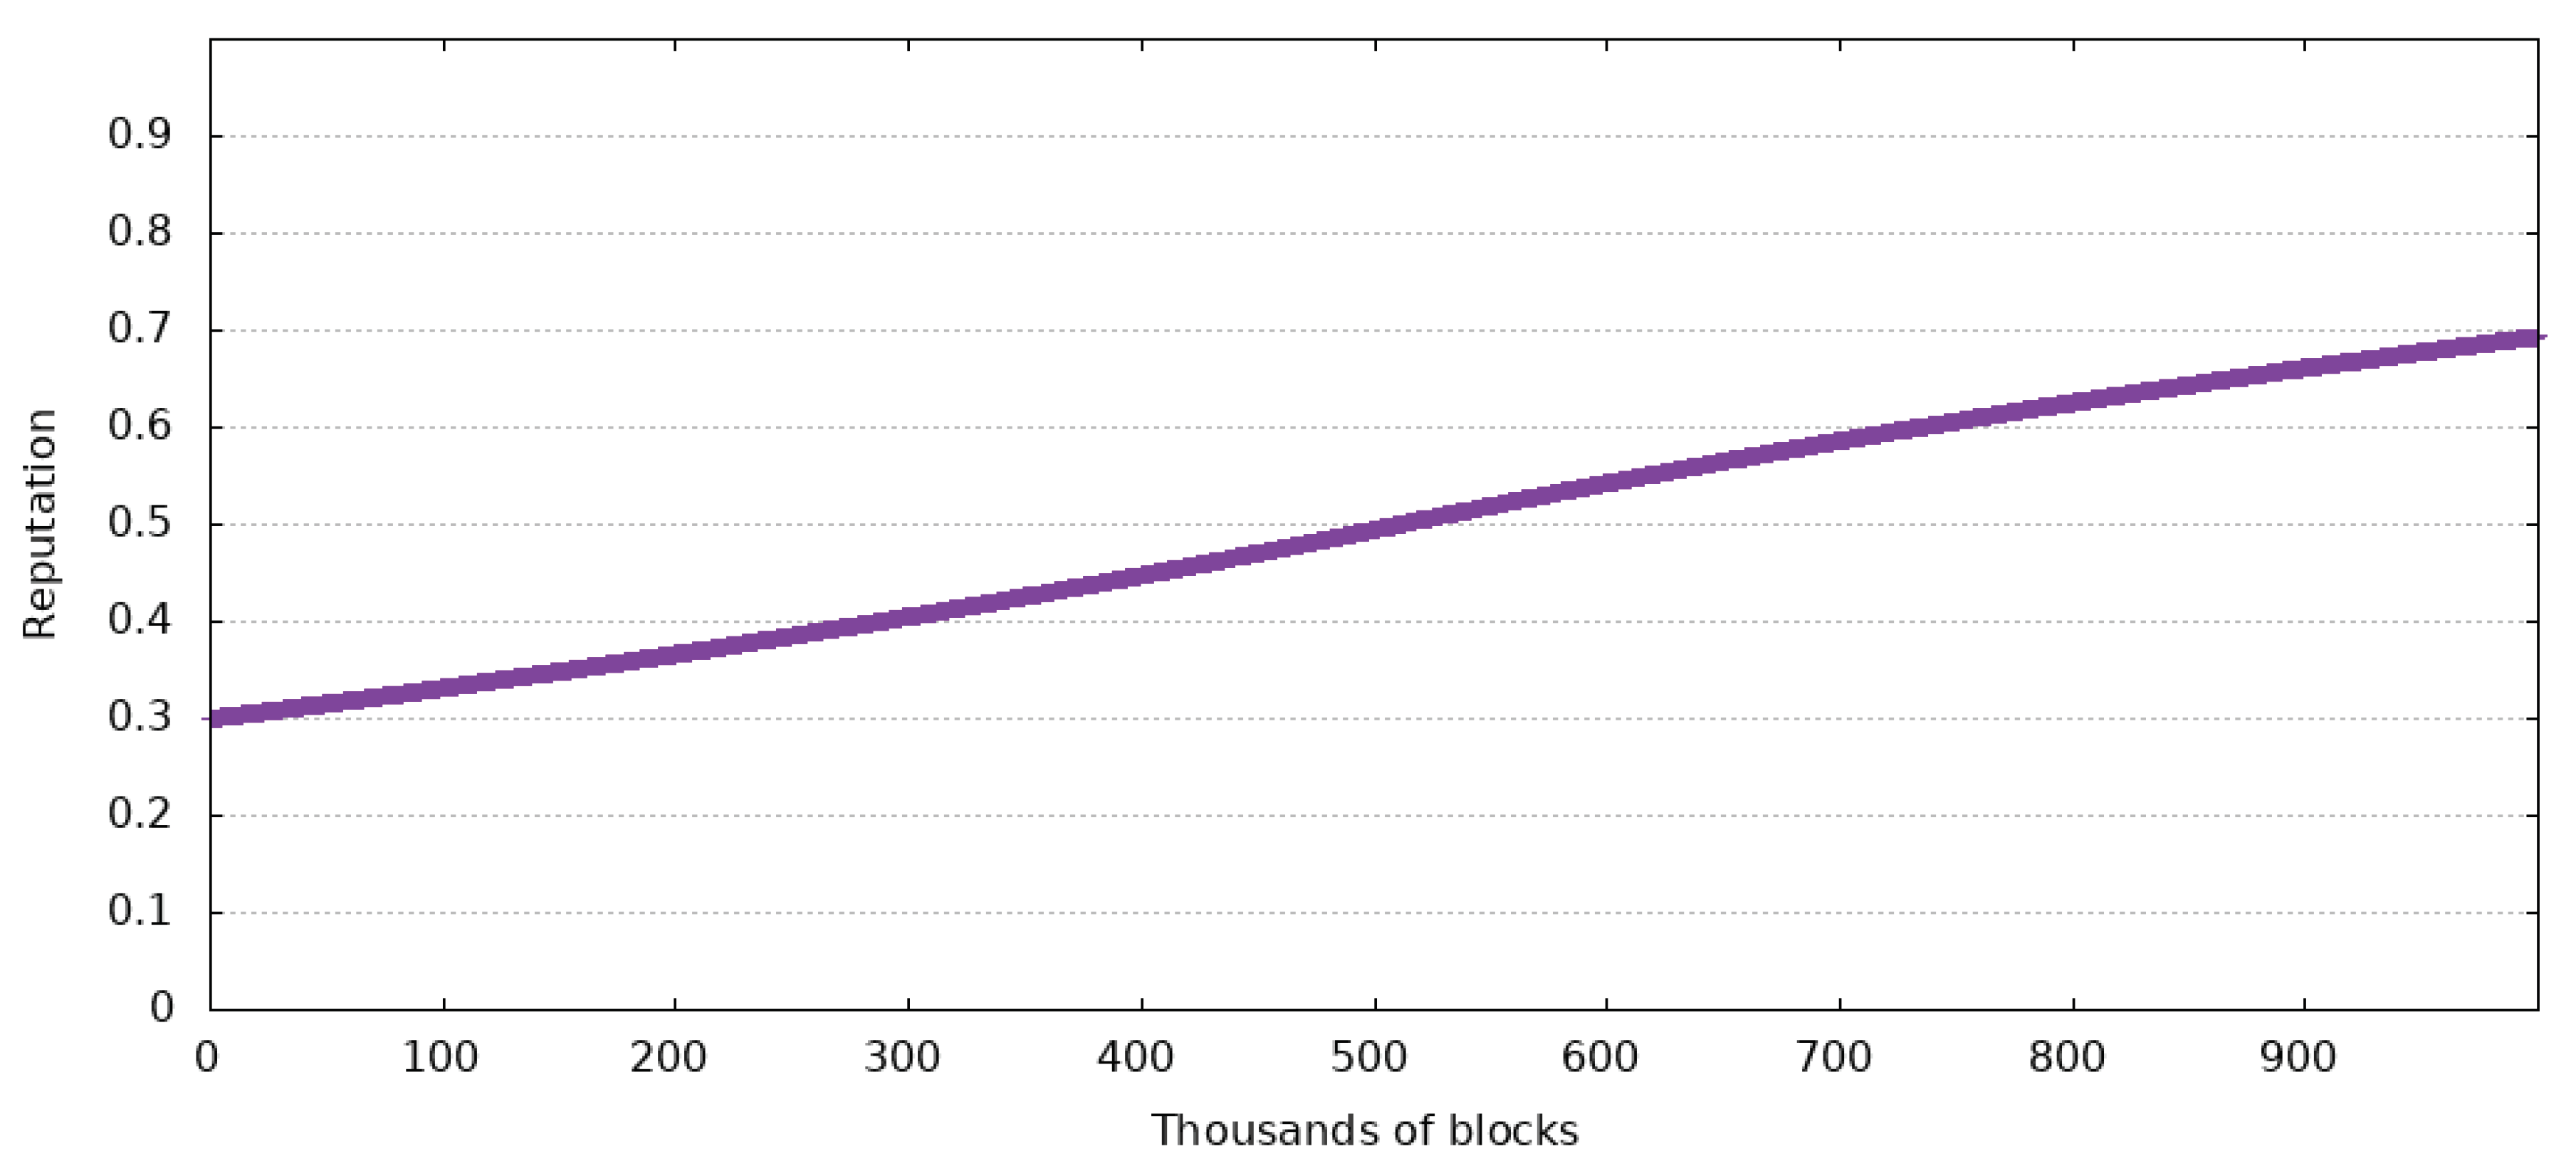
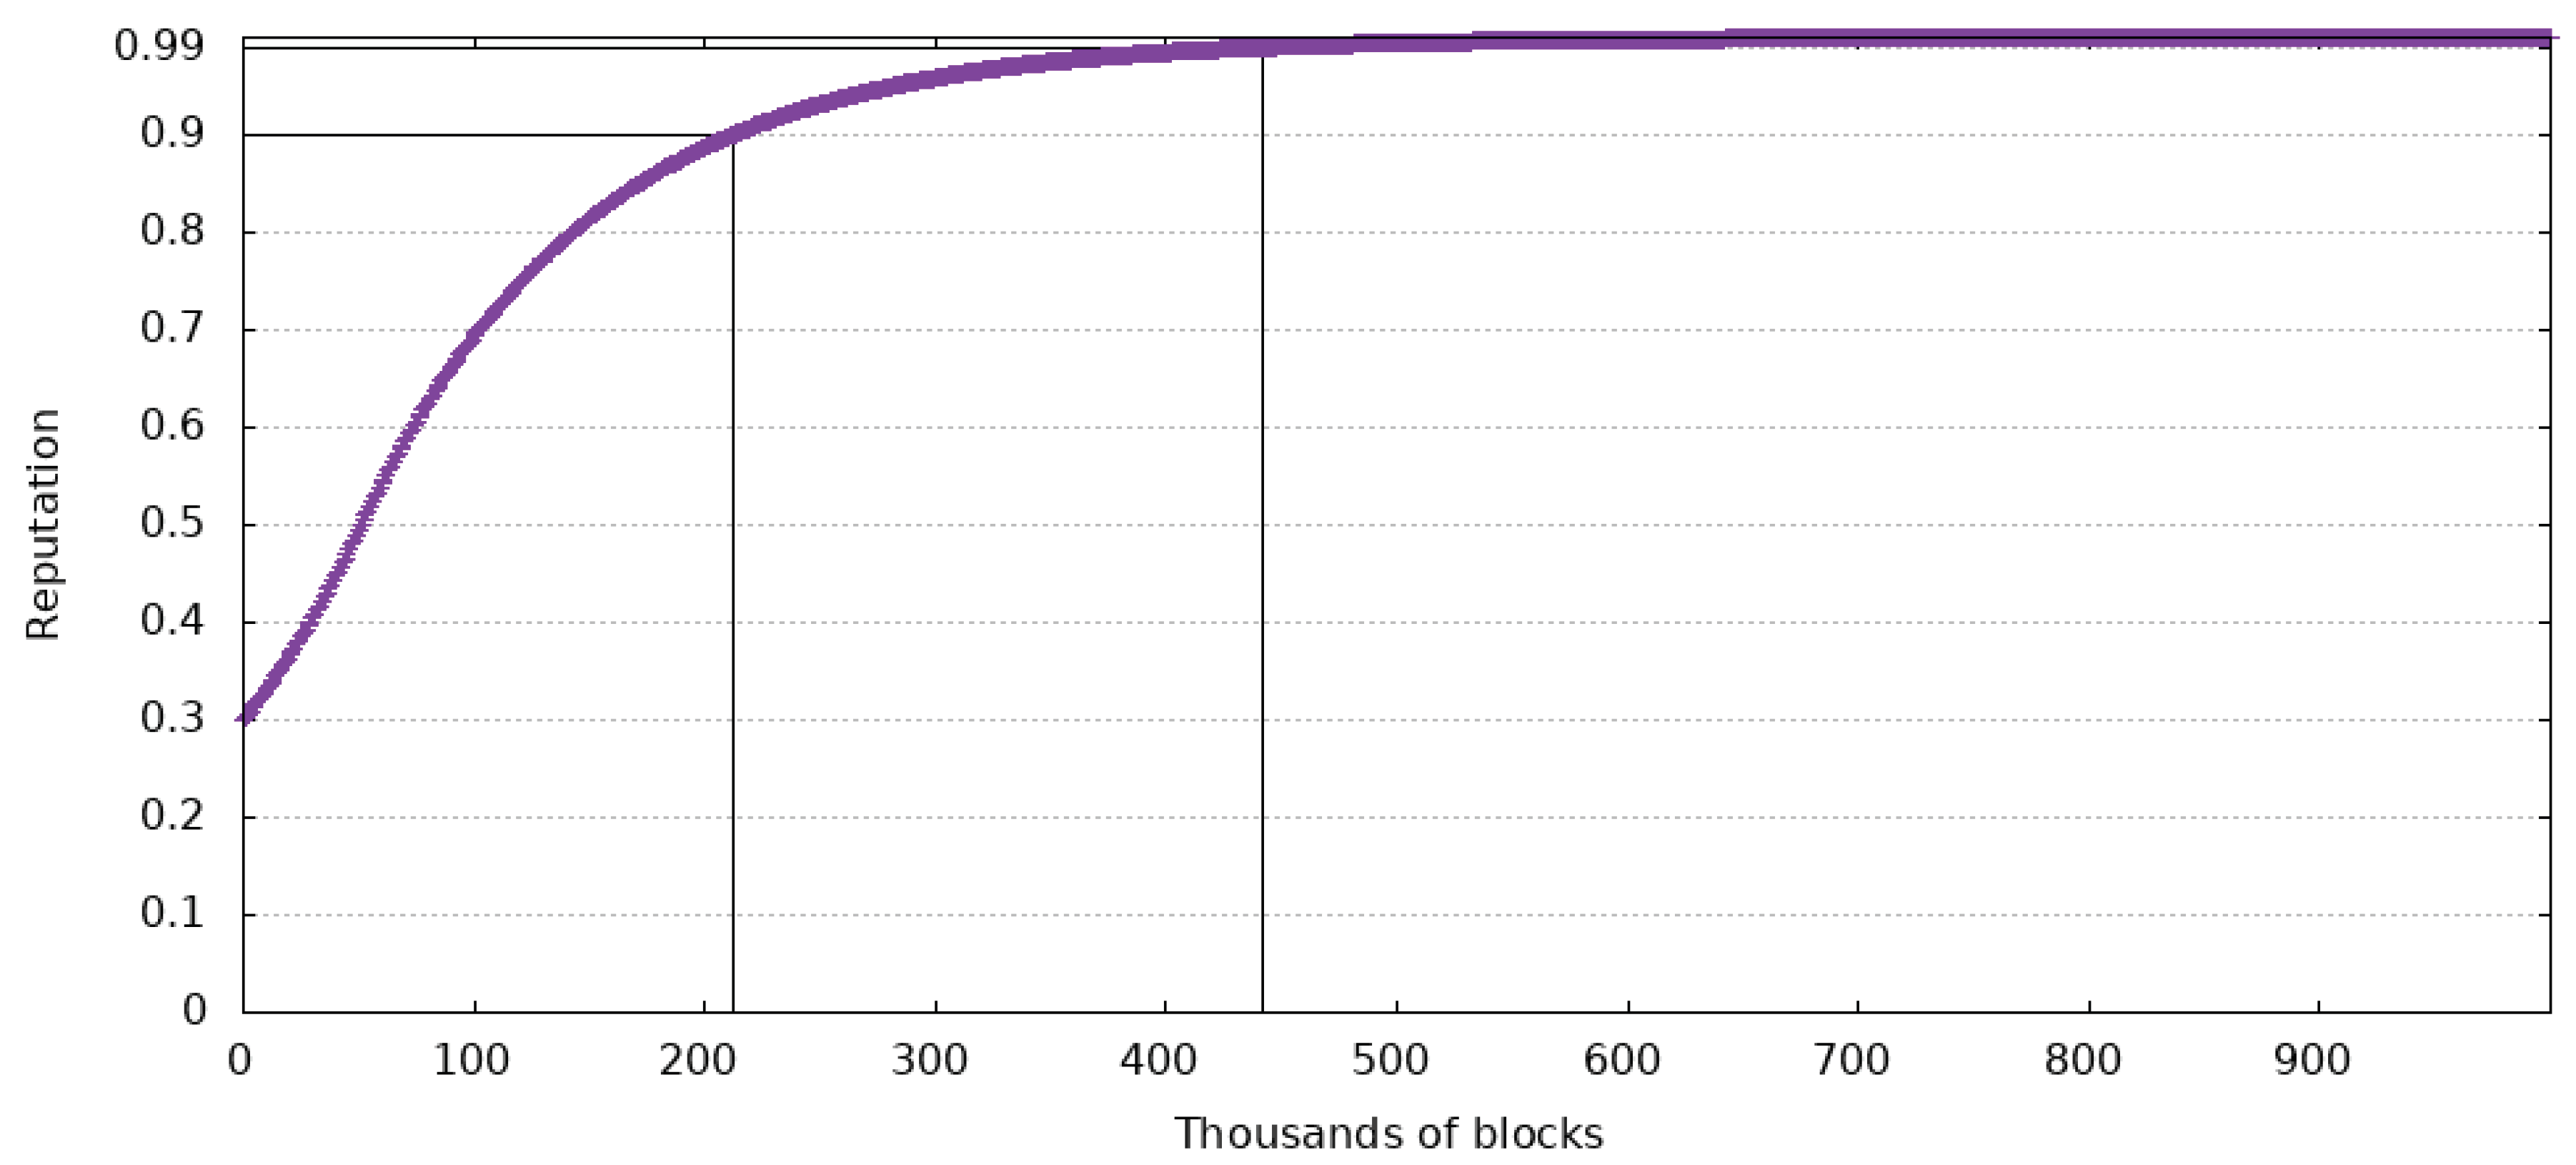
The speedCoefficient dictates how much a user’s reputation can change every time a block is created. Three numbers have been chosen as possible values: , , and . Figure 7, Figure 8 and Figure 9 show the impact these values have in the case of a user with an initial reputation of 0.3. The Figures also show when the reputation has reached 0.9 and 0.99.
The test that generated data from the Figures has been made for 1 million blocks after a user has started using the system. With a block created every minute, this equates to 694 days of continuous use. It is supposed that the user always makes accurate reports.
In the case of a maximum reputation change of , the user only reaches a maximum reputation of 0.6934, which is not a desirable outcome because the change happens too slowly. This spawns another problem: the ineffectiveness of the reputation system. If the change does not happen fast enough, the reputation will not affect the consensus for a very long time.
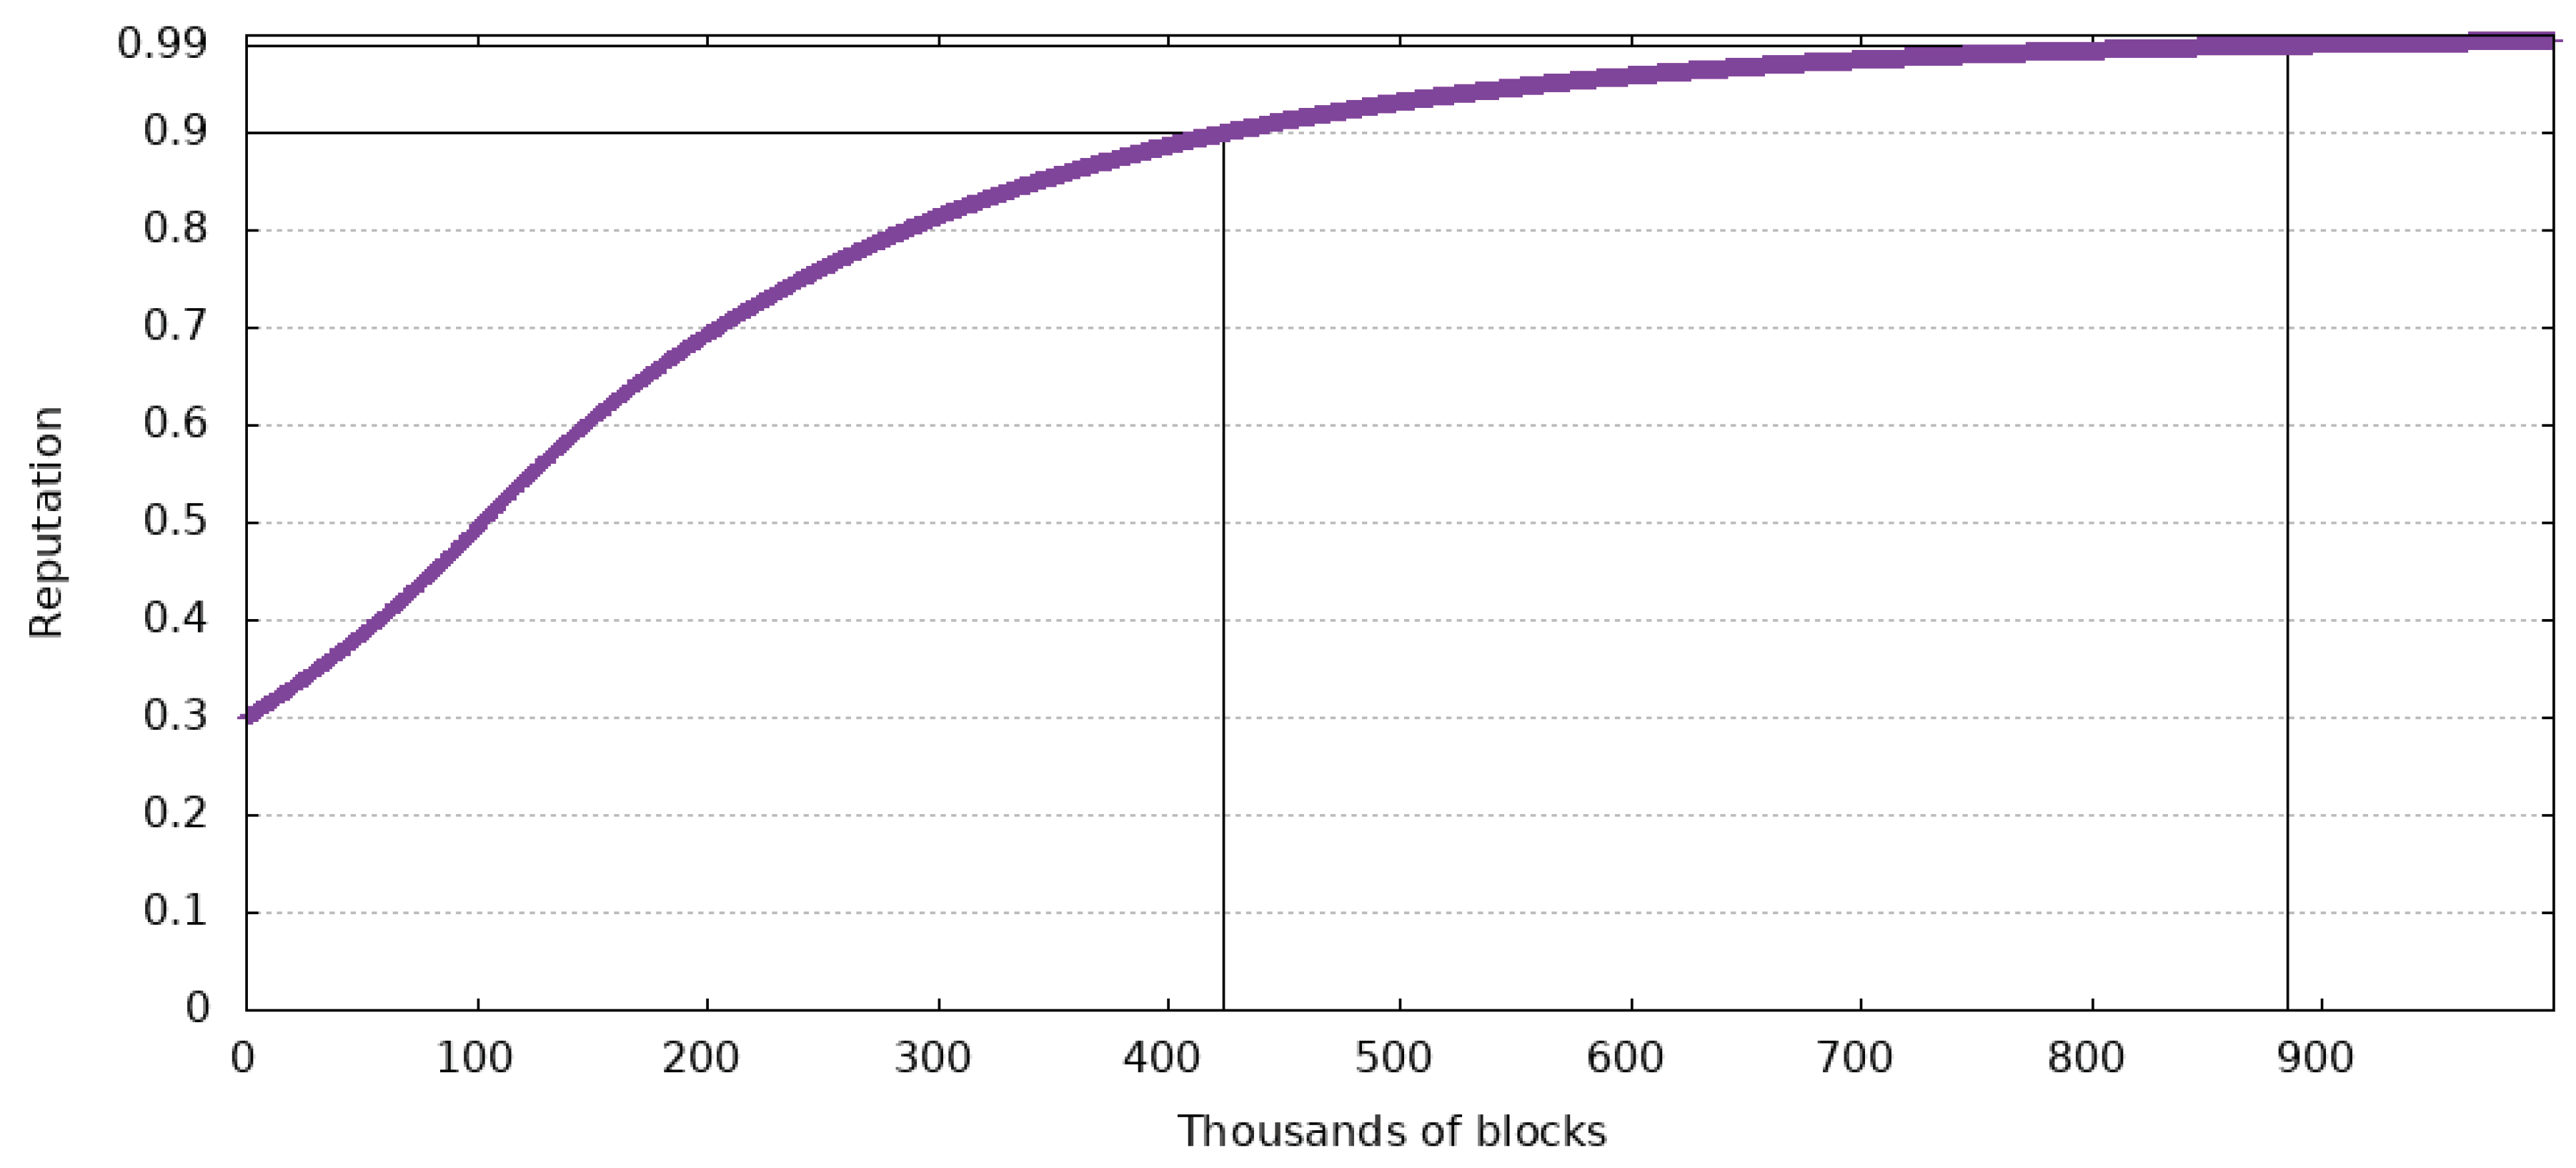
If the maximum reputation change is , ten times greater than the previous values, a user’s reputation will reach 0.9 in 212,025 blocks and 0.99 in 442,283 blocks. This means that a user could have a huge influence, of 90% of the possible maximum, in about 920 h of using the system. At the same time, 99% of the maximum reputation could be reached in 1842 h of constant use of the system. Even though these values are a lot better than the previous ones, malicious agents might exploit them.
Based on the previous Figures, the most balanced value for this variable is . In this case, a new user reaches a reputation of 0.9 in 442,052 blocks or 1766 h, and 0.99 in 884,568 blocks or 3685 h.
Out of all three cases, the last one manifests the most balanced slope for the considered time interval. It should also be noted that in a real-world case, it will be almost impossible for someone to only make accurate reports. This means that the time it takes a driver to reach 90% of the maximum reputation is prolonged.
4.5. Nodes Communication
The described communication flow considers two cases. The first case is communication between user nodes and region nodes. This case is specific to the two consensus algorithms: the speed alert consensus algorithm and the alert system. For security reasons, but also in order to enhance the users’ privacy, user nodes do not communicate directly with each other. The second case is the communication between the region nodes and the master node. Within this flow, there is the transfer of information such as road data and reputation from region nodes to master nodes, but also the reputation of users from the master node to the region nodes, the reputation of user nodes that transit several geographical areas and participate in consensus algorithms.
A special case is the communication between region nodes. It occurs when the master node is overloaded or down, and the region nodes communicate with each other for data transfer required by the routing algorithm or for the transfer of information such as the reputation of a user who has traversed neighboring regions.
Every node spawns several routines specialized in executing a specific task like sending or receiving a speed report, parsing all received speed reports, or creating a new block. Each job uses a different stream for every type of message: speed reports, alerts, users’ reputation and blocks.
Messages only transfer the needed data, without containing any redundancies. This way, the network load is kept at a minimum, resulting in a more responsive system overall.
Users send two types of messages to region nodes:
- Speed reports, which consist of position latitude and longitude and their speed
- Alerts, which consist of the position of the alert, what kind of alert it is and whether it is still active
Every minute, region nodes send the master node only one type of message which contains the three components that make up the data of a block: computed speed reports, alerts and users’ reputation.
4.6. Chain of Blocks Design
The system uses two types of blockchains: region blockchains and central blockchain. The region blockchain contains validated information from the area corresponding to the region node, each region node maintaining its own blockchain that contains blocks created by it. The central blockchain contains validated data from all regional nodes.
In terms of cost, such an approach causes a decrease in the level of processing required by the central node. Thus, the central node is relieved by the processing of the consensus algorithm and by the calculation of the average speed, processes that are performed by the regional nodes. Once this process is optimized, the central node offers better response times for other tasks such as calculating the optimal route between two locations.
From the security point of view, the main responsibility for the veracity of the data stored in blockchains belongs to the regional nodes. Once considered valid, the data is stored in the regional blockchain and transferred to the master node for storage in the central blockchain. The authentication of the regional nodes and of the master node is performed with the help of a PKI scheme.
The proposed system is an optimized variant compared to most of the proposed solutions that are based on blockchain technology. All the nodes do not work on the same task; we propose a special type of reliable node, the region node, that performs an expensive task: the consensus algorithm within a single region. At the same time, this type of node has the role of storing in an internal blockchain, the region blockchain, data regarding the traffic in its area of jurisdiction. The system also introduces a second type of reliable node, the master node, whose role is to store in a master blockchain all the information from all region nodes. However, as a possibility to guarantee the integrity of the blockchain, the master node can distribute to all the region nodes the hash of the last block created in the blockchain. This solution is not expensive either in terms of network traffic or in terms of storage.
The key advantages of blockchain technology like decentralization, secure by design, avoid a single point of failure are realized from a functional point of view through mechanisms such as storing the same information in several blockchains and on several nodes. Assuming that the master node is down, a routing algorithm searches for traffic information (the same information being stored in both master nodes and region nodes) at multiple region nodes, instead of a single node, more precisely the master node. This solution is useful not only when the master node is down, but also for load balancing between the entire processing system.
One of the main attributes of a blockchain is the way data is stored. In this respect, the current State of the Art implementations use two variants:
- A block-lattice data structure, which is a unique implementation of a Directed Acyclic Graph. As stated in the Nano Whitepaper [17], a block is just one transaction. In this case, every account has its own blockchain that contains inbound and outbound transactions. This ensures a higher number of transactions per second.
- A single monolithic block of chains. This is a classic implementation that is present in the two most popular public blockchains: Bitcoin and Ethereum. A node packs an arbitrary number of transactions into a block which is then added to the block of chains and broadcasted to all other nodes.
For the proposed solution, the latter option has been chosen due to:
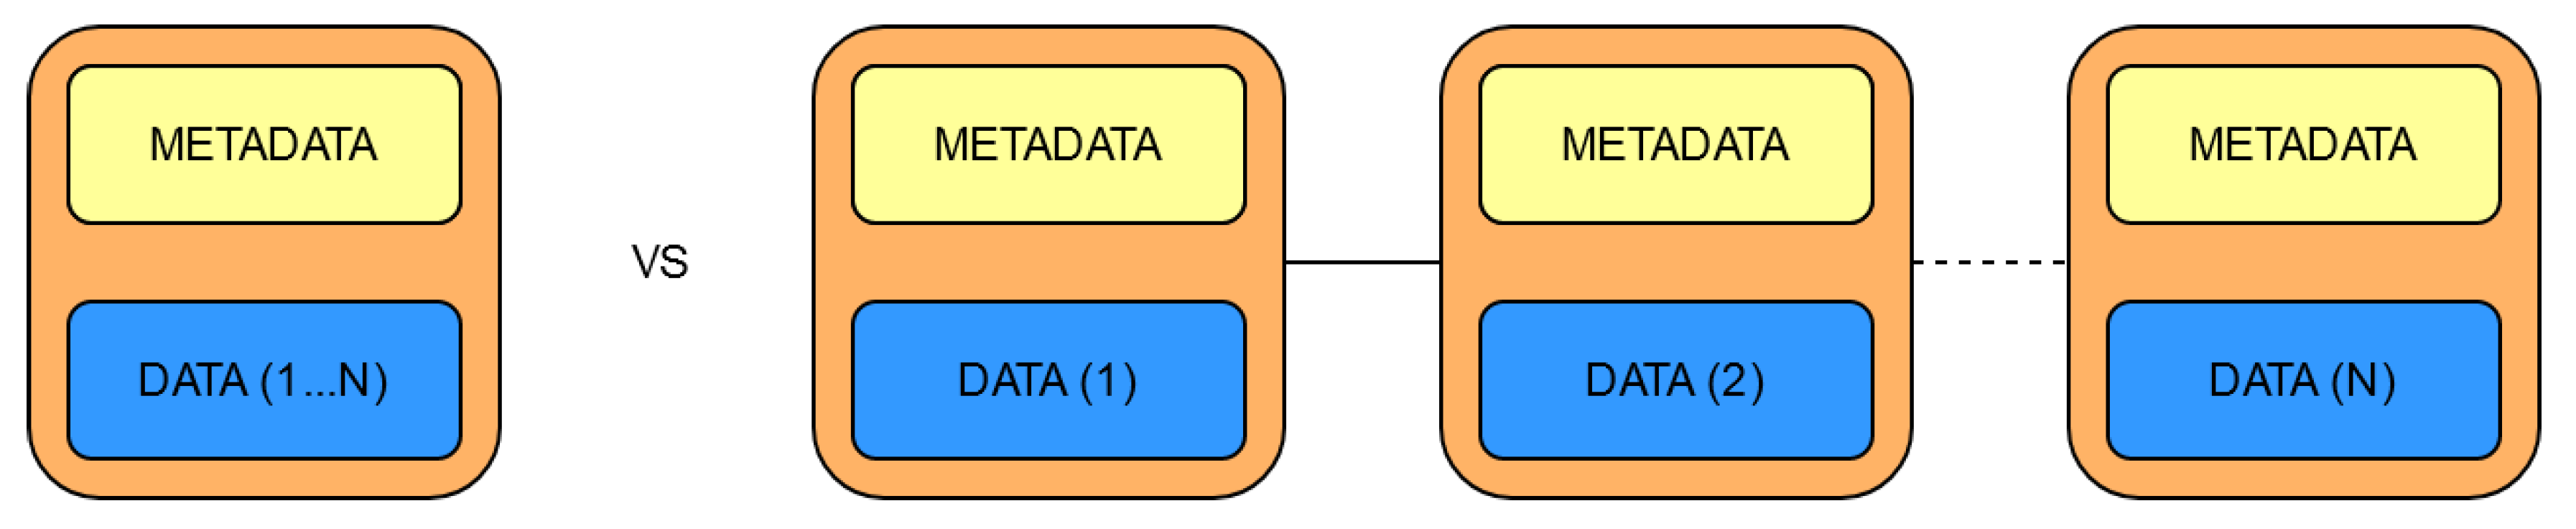
- Storage spaceA block contains both data and metadata. While the amount of data is variable, the size of the metadata is always the same because it always consists of:- index—the blocks order number in the chain of blocks (the first block is called the genesis block)- timestamp—the exact time at which the block has been created- hash—the hash of the entire block, not just de data- previous hash – the hash of the previous block, which helps in checking data consistency.As Figure 10 shows, this means that the same data takes less space if it is packed into a single block than if it is divided into more blocks because of the metadata.
- The way users or other nodes will interact with the dataHaving a single block at a regular interval makes it easier and more intuitive to query traffic status. This way, all blocks in a specific timeframe will be parsed, without checking whether they hold the requested data.
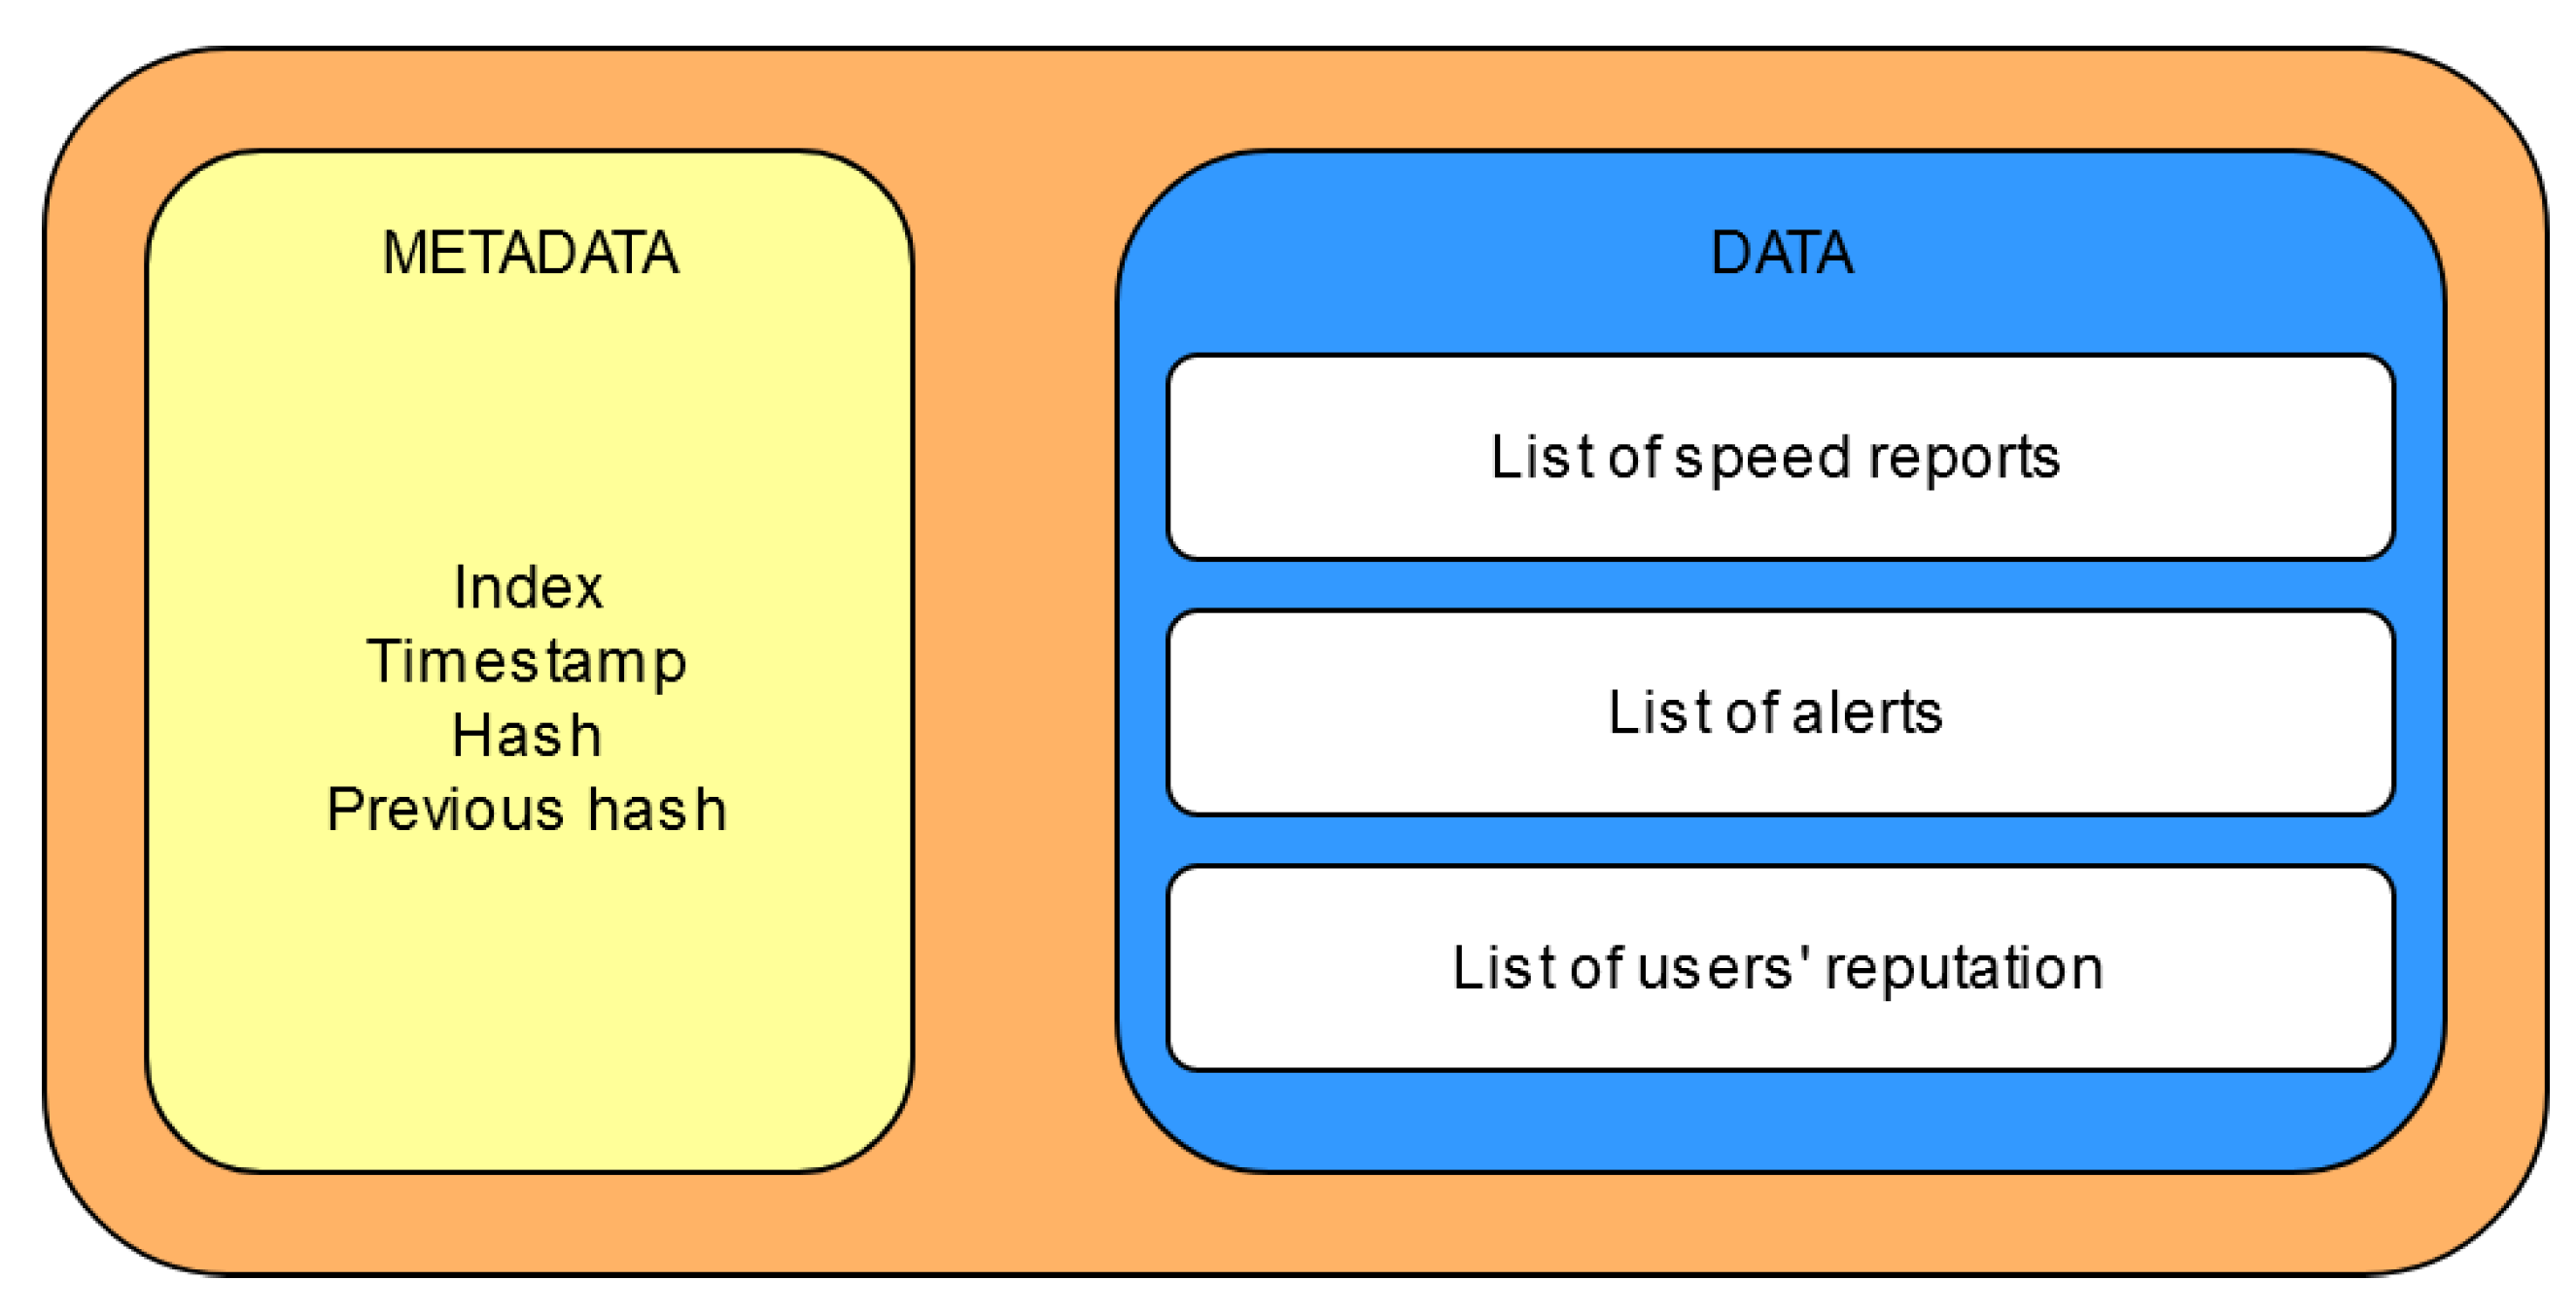
Figure 11 depicts the design of a block used in the blockchain. The relevant data is comprised of three lists:
- The list of speed reports holds data about the average velocity for a specific location and direction.
- The list of alerts contains relevant data such as an identifier, when it was created, and the votes it has received from users.
- The users’ reputation represents the last piece of user-relevant data, and it comes in the form of differences between the new and the old values.
A block contains new data that was not available when the previous block was created.
5. Experimental Evaluation
To evaluate the proposed solution, we developed a software application, more exactly an emulator, using technologies such as libp2p, the Golang programming language, and the Linux Ubuntu operating system. The application includes all the functionalities described above, such as creating transactions and blocks, checking data integrity, updating reputation, displaying blockchain, and so forth. The virtual network is emulated within a single operating system, the terminals acting as nodes.
In a blockchain project, as in all internet-based services, the communication layer is the foundation upon which everything is built. A reliable, safe, and peer-tested backbone offers developers more freedom to concentrate on the other parts of such a complex project.
Libp2p is an open-source modular peer-to-peer networking stack created by the team behind InterPlanetary File System and used in popular blockchain projects such as IPFS and Ethereum 2.0. This project aims to make processes addressable, independently of how many hoops it must pass through, while also guaranteeing the security of the new connection. One of libp2p’s main advantages is that it is effortless to implement, which makes it so that other projects can more easily communicate with one that uses this stack. Another main advantage is the fact that libp2p is transport agnostic, meaning that it can work through TCP, UDP, UDT, QUIC, and even secure transport protocols such as TLS and SSH. These represent a great advantage for a blockchain solution whose aim is to communicate with other systems such as a smart city. As previously stated, libp2p offers a secure connection through a component called secio. This creates a secure channel between the two processes involved whose handshake is done through asymmetric cryptographic keys.
The rest of the solution is developed exclusively in golang, which is a statically typed, compiled programming language developed at Google. It drew a lot of inspiration from other languages such as Algol, Pascal, and C because of their speed and conciseness. At the same time, it tried to resemble more modern languages such as Java and Ruby for their safety. It is also open-source, just like libp2p, which falls in line with the open-source aspect of the proposed solution. The reasoning behind this choice is that concurrency has been an integral part of the language since its inception. This makes it easier to create multi-threaded programs where every thread continuously runs its own routine, just like the product presented in this paper. The other main reason for choosing this language is the fact that the golang implementation of libp2p is the most popular and active one, which means that it is also the most thoroughly tested.
This Chapter focuses on analyzing metrics about how efficient the implementation is, from both memory usage and computational intensity perspectives. It also highlights why some choices have been made when it comes to values used throughout the solution, such as the one-minute timeframe both the region node and the master node gather data for.
Finally, it will present tests using an already existing dataset from Sim2Car, the University Politehnica of Bucharest’s traffic simulator, which contains real-world car pathways from both San Francisco and Rome. This will serve as an overview of the feasibility of the proposed solution and of the impact it could have when implemented.
The following data is the result of running the proposed solution on a system equipped with an Intel Core i5 8350u and 16 GB of dual-channel DDR4 RAM running at 2400 MHz.
5.1. Block Size
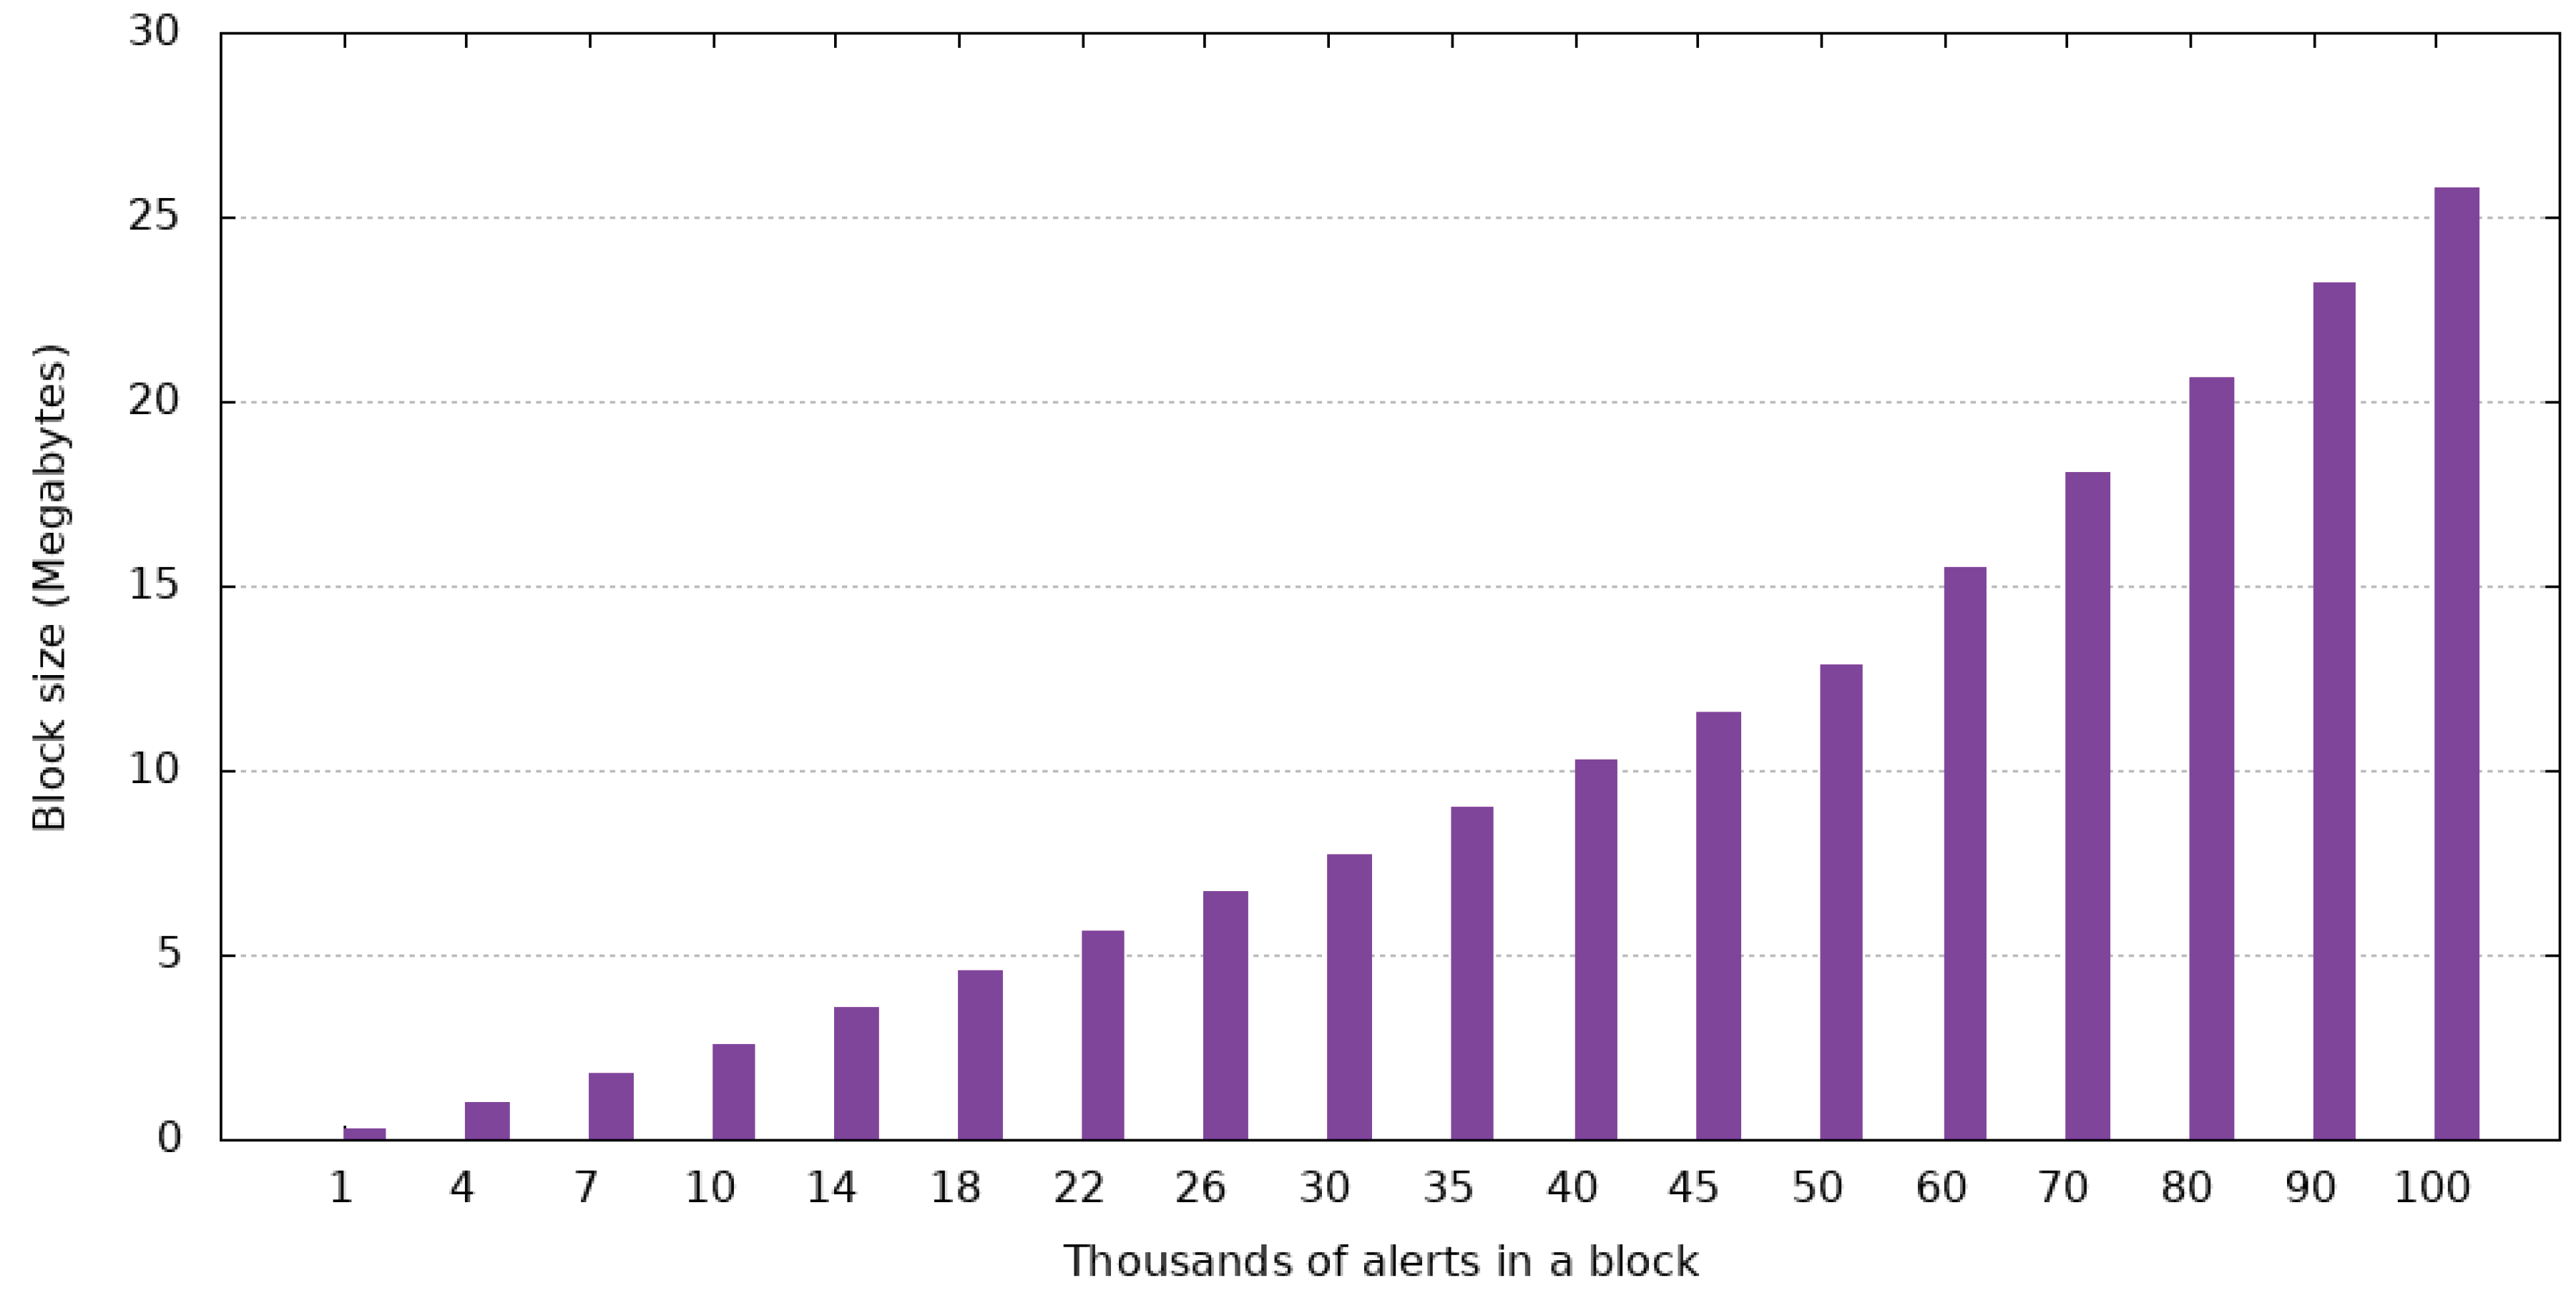
A block is comprised of metadata, speed reports, alerts, and reputation changes that have happened in the one-minute time interval. The size of the metadata is always the same, which means that the size of a block is entirely dependent on the other three components. Figure 12, Figure 13 and Figure 14 highlight the impact each type of data has on the size of a block.
As the data shows, alerts have the highest impact on the size of a block, with 100,000 of them taking up 25.8 MB. This is due to the amount of data needed to store such a piece of information. Because alerts are bound to be created only for exceptional cases, they are not expected to be as prevalent as reputation changes or speed alerts, which mitigates their contribution to the final size.
Reputation changes have the lowest impact due to the simple composition—user ID and the change in reputation. This behavior shows that the proposed solution can handle a high number of users from a memory usage perspective.
Lastly, the number of speed reports in the case of two-way streets has an impact that sits between the other two. Clustering reports that are close can lower the number of speed reports in a block. This way, for example, two speed reports that are 2 m apart can be combined to save space. This function is not part of the proposed solution, but it could be implemented in a future enhancement.
Data presented in Figure 12, Figure 13 and Figure 14 are cumulative, which means the size of a block containing all three types of data can be computed by adding up values from said Figures. This means that a block containing 100.000 speed reports, 50.000 alerts, and 100.000 reputation changes is going to be 22.4 MB.
For reference, the most famous cryptocurrency, Bitcoin, has a maximum block size of 1.4 MB, which is a lot lower than a generic block from the proposed solution. When considering that the system is expected to handle even more data, the maximum size of a block is bound to rise even higher. One counterexample is Bitcoin SV, a popular fork of Satoshi Nakamoto’s project, which initially had a maximum block size of 128 MB. This figure was later upgraded by the Quasar upgrade, which lifter the maximum block size to 2 GB.
5.2. Alert Propagation Time
The time it takes a new alert to reach other drivers is critical, especially in the case of an accident. This should be one of the main focuses of the system because it could make a huge difference in conditions such as fog, heavy rain, or snow, where the ability to observe the event and react to it is hindered.
As previously stated, alerts are created by users that send them to the region node. Both the region node and the master node have one-minute time intervals to collect data.
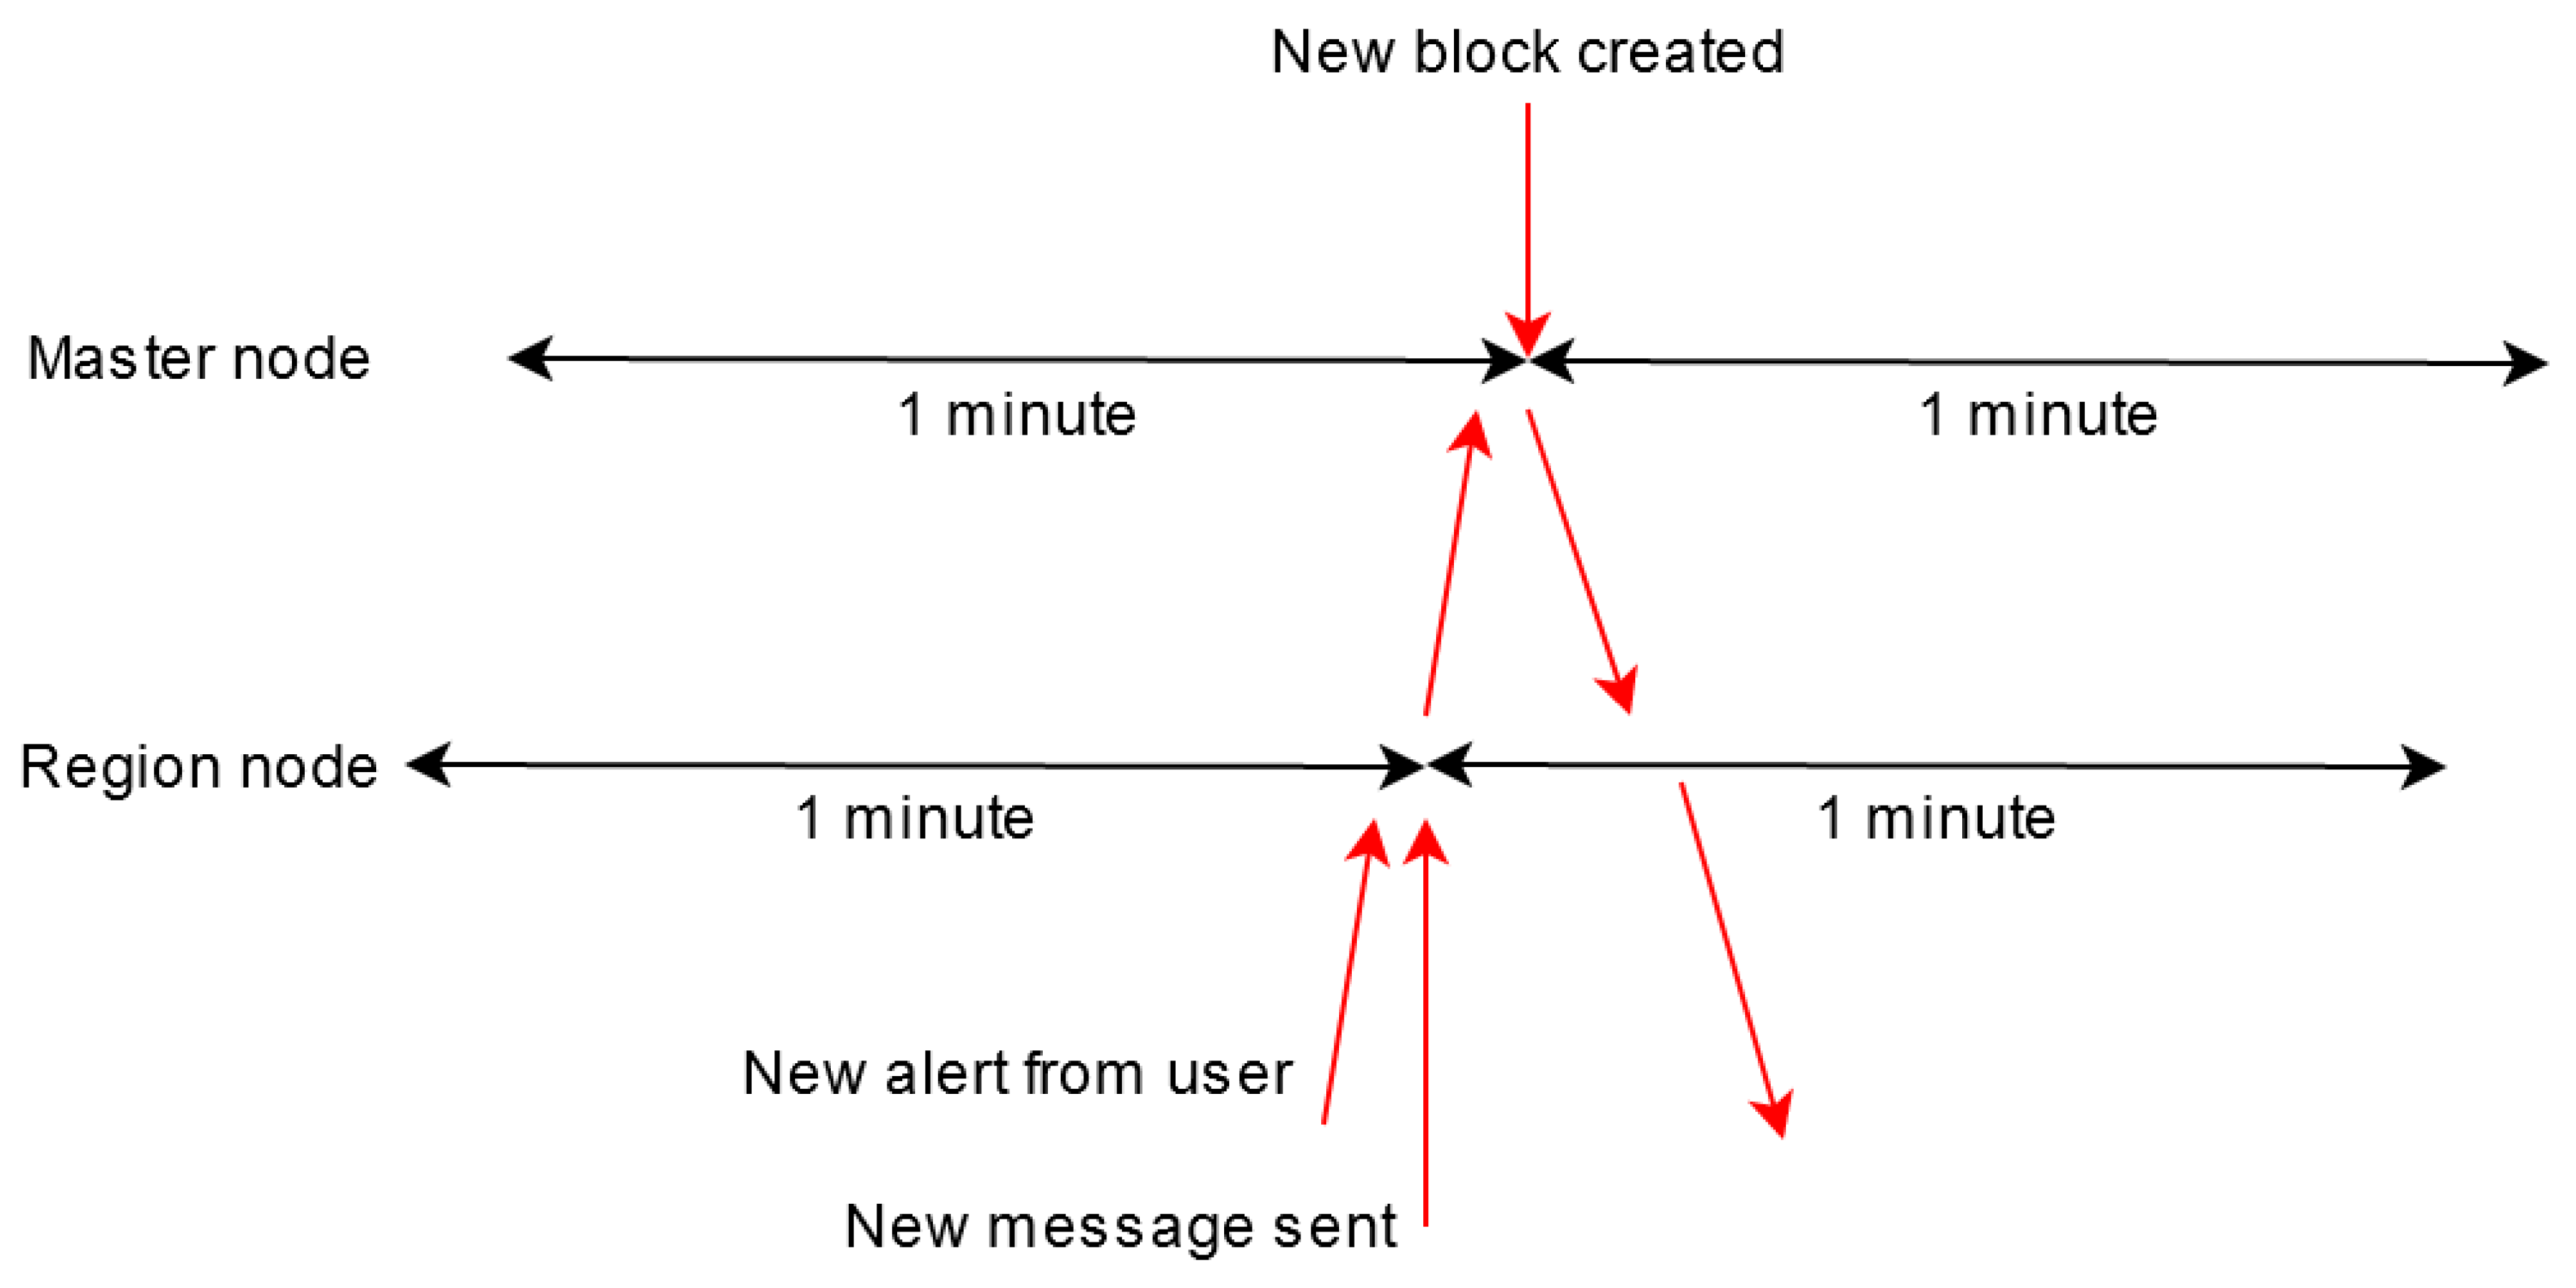
In a best-case scenario, the user would send an alert just before the region node creates the message containing validated data, and this message would reach the master node just before a new block was created. This scenario can be observed in Figure 15.
In this case, the propagation time is calculated as follows:
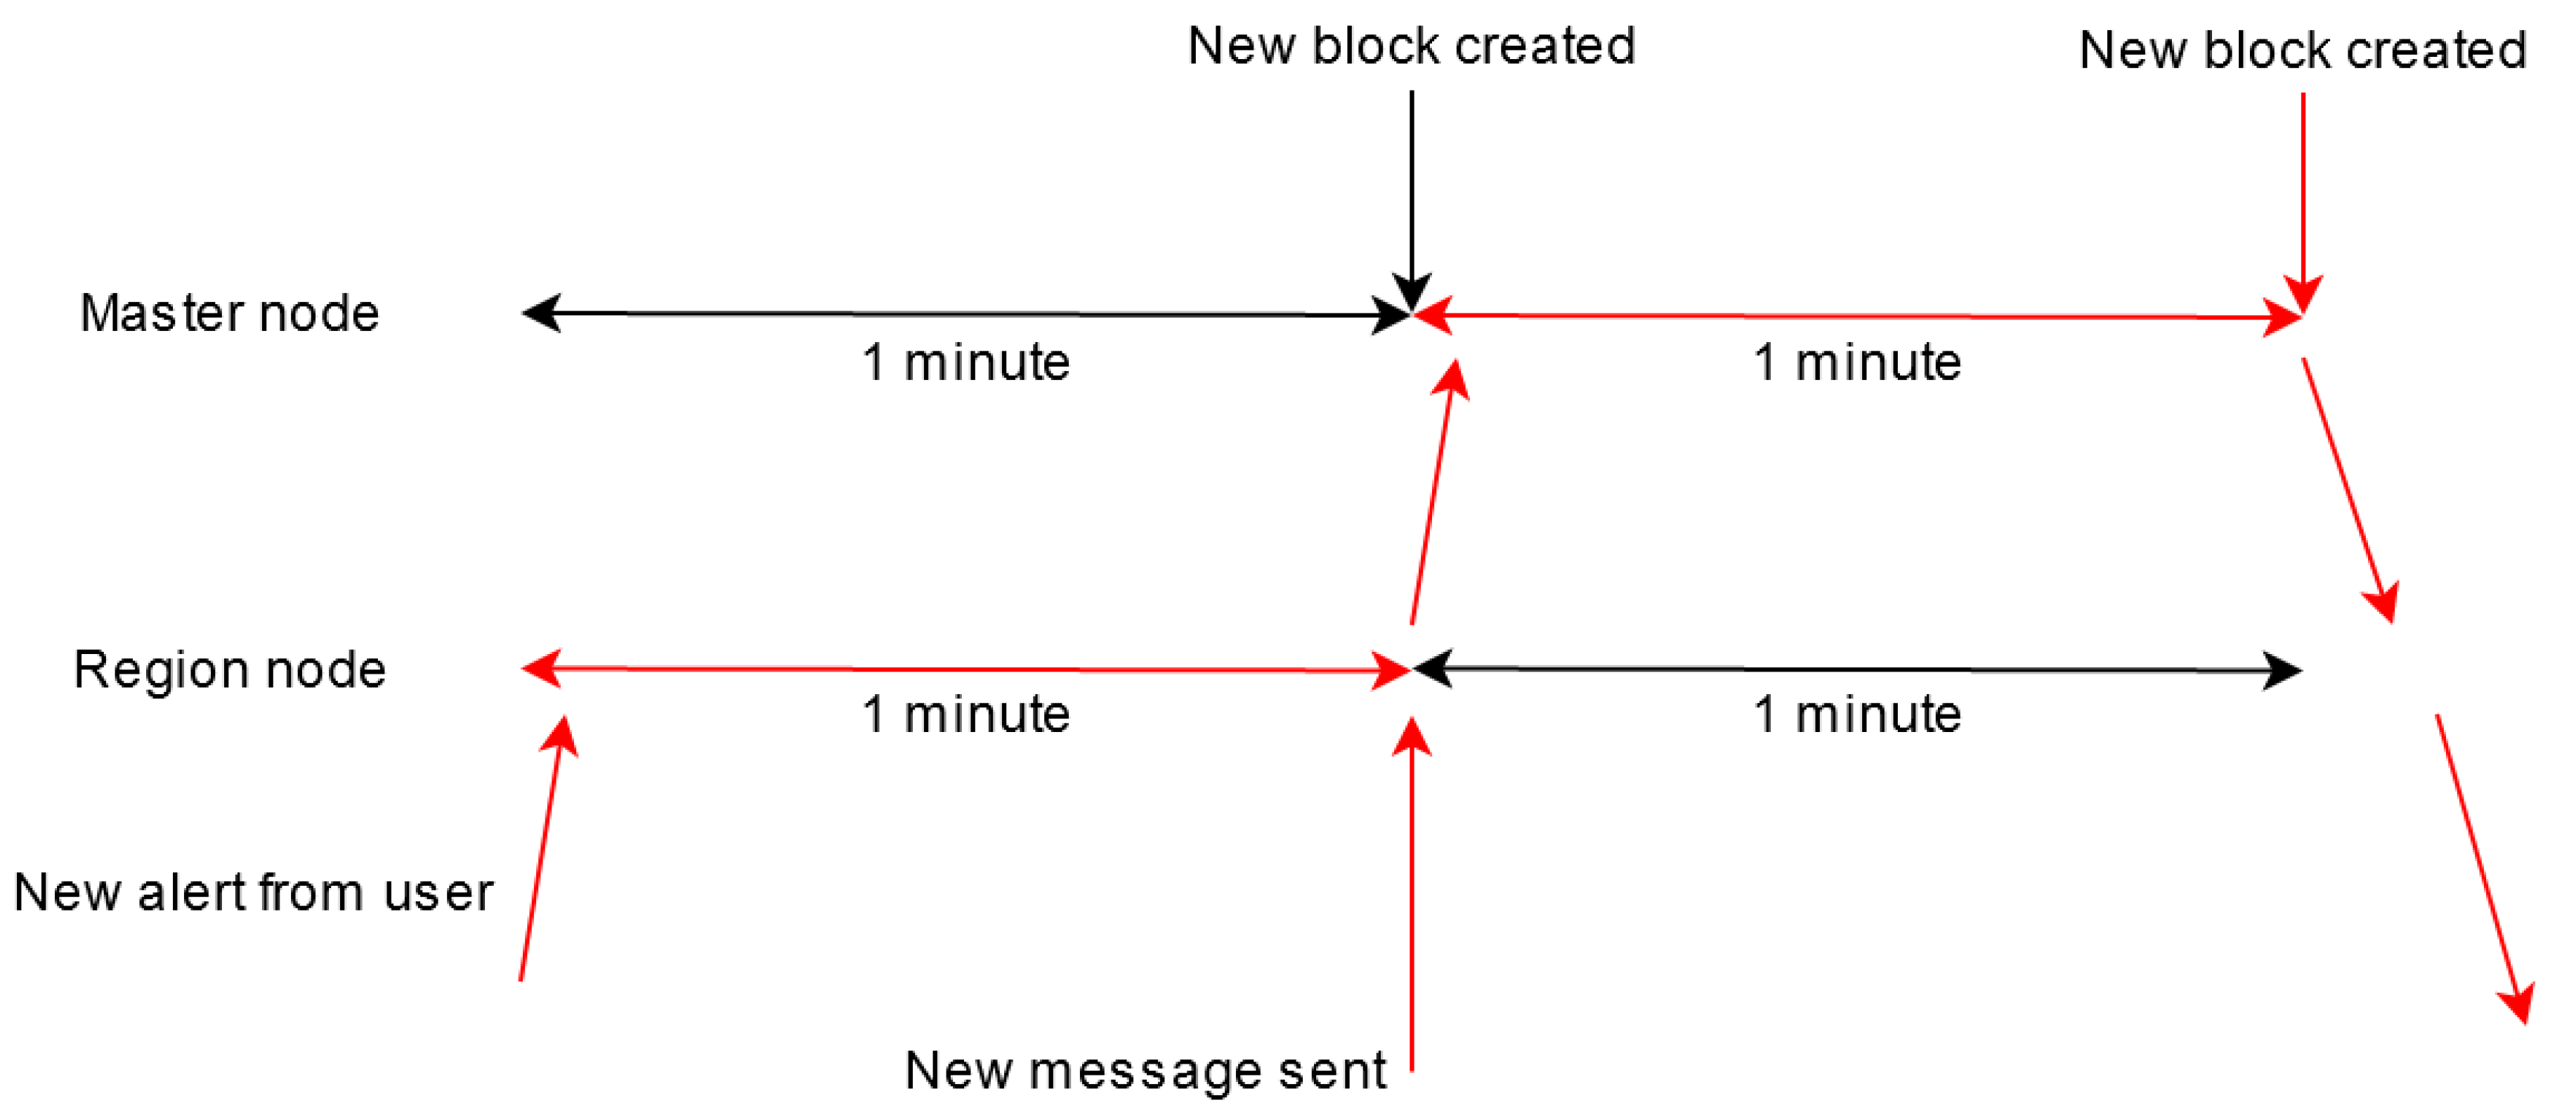
In a worst-case scenario, the user would send an alert when a region node begins its one-minute data collection period, and the message containing validated data would reach the master node of its own gathering period. Figure 16 depicts this scenario.
In this case, the propagation time is calculated as follows:
Based on the two presented cases, it can be deduced that the alert propagation time is dependent on two factors:
- When the user sends the alert with respect to when the region message will be sent. This factor cannot be influenced, and it is entirely dependent on the user.
- When the region node sends its message in relation to when the master node creates a new block. This factor is baked into the way the system is designed. If a region node connects to the master node at the wrong time, this could make it “forever be at a disadvantage” when compared to the other region nodes. This could possibly be circumvented by making the region waiting interval be dynamic.
A future enhancement could tackle critical events such as an accident. In this case, the region node could send the alert to all users without waiting for it to be added to the blockchain. This action would enable drivers to receive the warning as soon as possible.
5.3. Identifying Events from A Time Interval
One of the main use-cases that the proposed system is going to serve is being a data source for third parties. These can either be a city’s Intelligent Transportation System or another platform that specializes in offering traffic data and predictions. In both cases, the solution proposed in this paper should provide the possibility of finding past data from a specific time interval, as fast as possible.
The block IDs of the interval can be calculated by using three pieces of data: the creation time of the latest block in the chain of blocks, the desired timeframe, and the fact that the master node creates a block every minute, as proposed in Algorithm 2.
| Algorithm 2 Block ID computation. |
| startOffset = (latestBlock.CreationTime − queryStartTime).ToMinutes() |
| endOffset = (startOffset − (queryEndTime − queryStartTime)).ToMinutes() |
| startBlockID = latestBlock.ID − startOffset |
| endBlockID = latestBlock.ID − endOffset |
Since the action only involves four simple mathematical calculations, identifying the blocks associated with a time interval is instantaneous due to the computing power of modern-day computers.
If the querier is a type of node that holds the blockchain, it can immediately start parsing the needed data. There is also a possibility that it relies on other nodes to deliver its query, in which case the querier will have to wait for the delivery of its requested data.
5.4. Real-World Tests
This section aims to test the proposed solution in a real-world environment and investigate how the system works when confronted with a situation that it was designed for. It will examine how effective the system is in calculating traffic conditions and the impact the reputation system has on the outcome.
The data used in these tests has been extracted from Sim2Car, University Politehnica of Bucharest’s traffic simulator that is presented in Figure 17. It contains real-world car traces from San Francisco, Rome, and Beijing, which were obtained from cabs and interpolated to create a multitude of traces that resemble those of real cars. The simulator offers developers a way of creating and testing different implementations for Intelligent Transportation Systems such as smart traffic lights or dynamic traffic signs.
The number of region nodes in a given area is one of the main variables that influence the proposed solution. The higher this figure, the less work each region node has to do when running the consensus algorithm. But if the figure is too high (e.g., a node for every 500 m2), the communication overhead could outweigh the benefits of distributing the work. The impact of this variable is dependent on factors such as the hardware and network connecting the nodes; thus, testing could not be reliably conducted.
When the system is first deployed, every user will have the same initial reputation, which means that the system will act as if the reputation system does not exist. As the system continues to adapt, it will learn which users are to be trusted and which ones report malicious data. This way, the proposed solution will act better as time goes on.
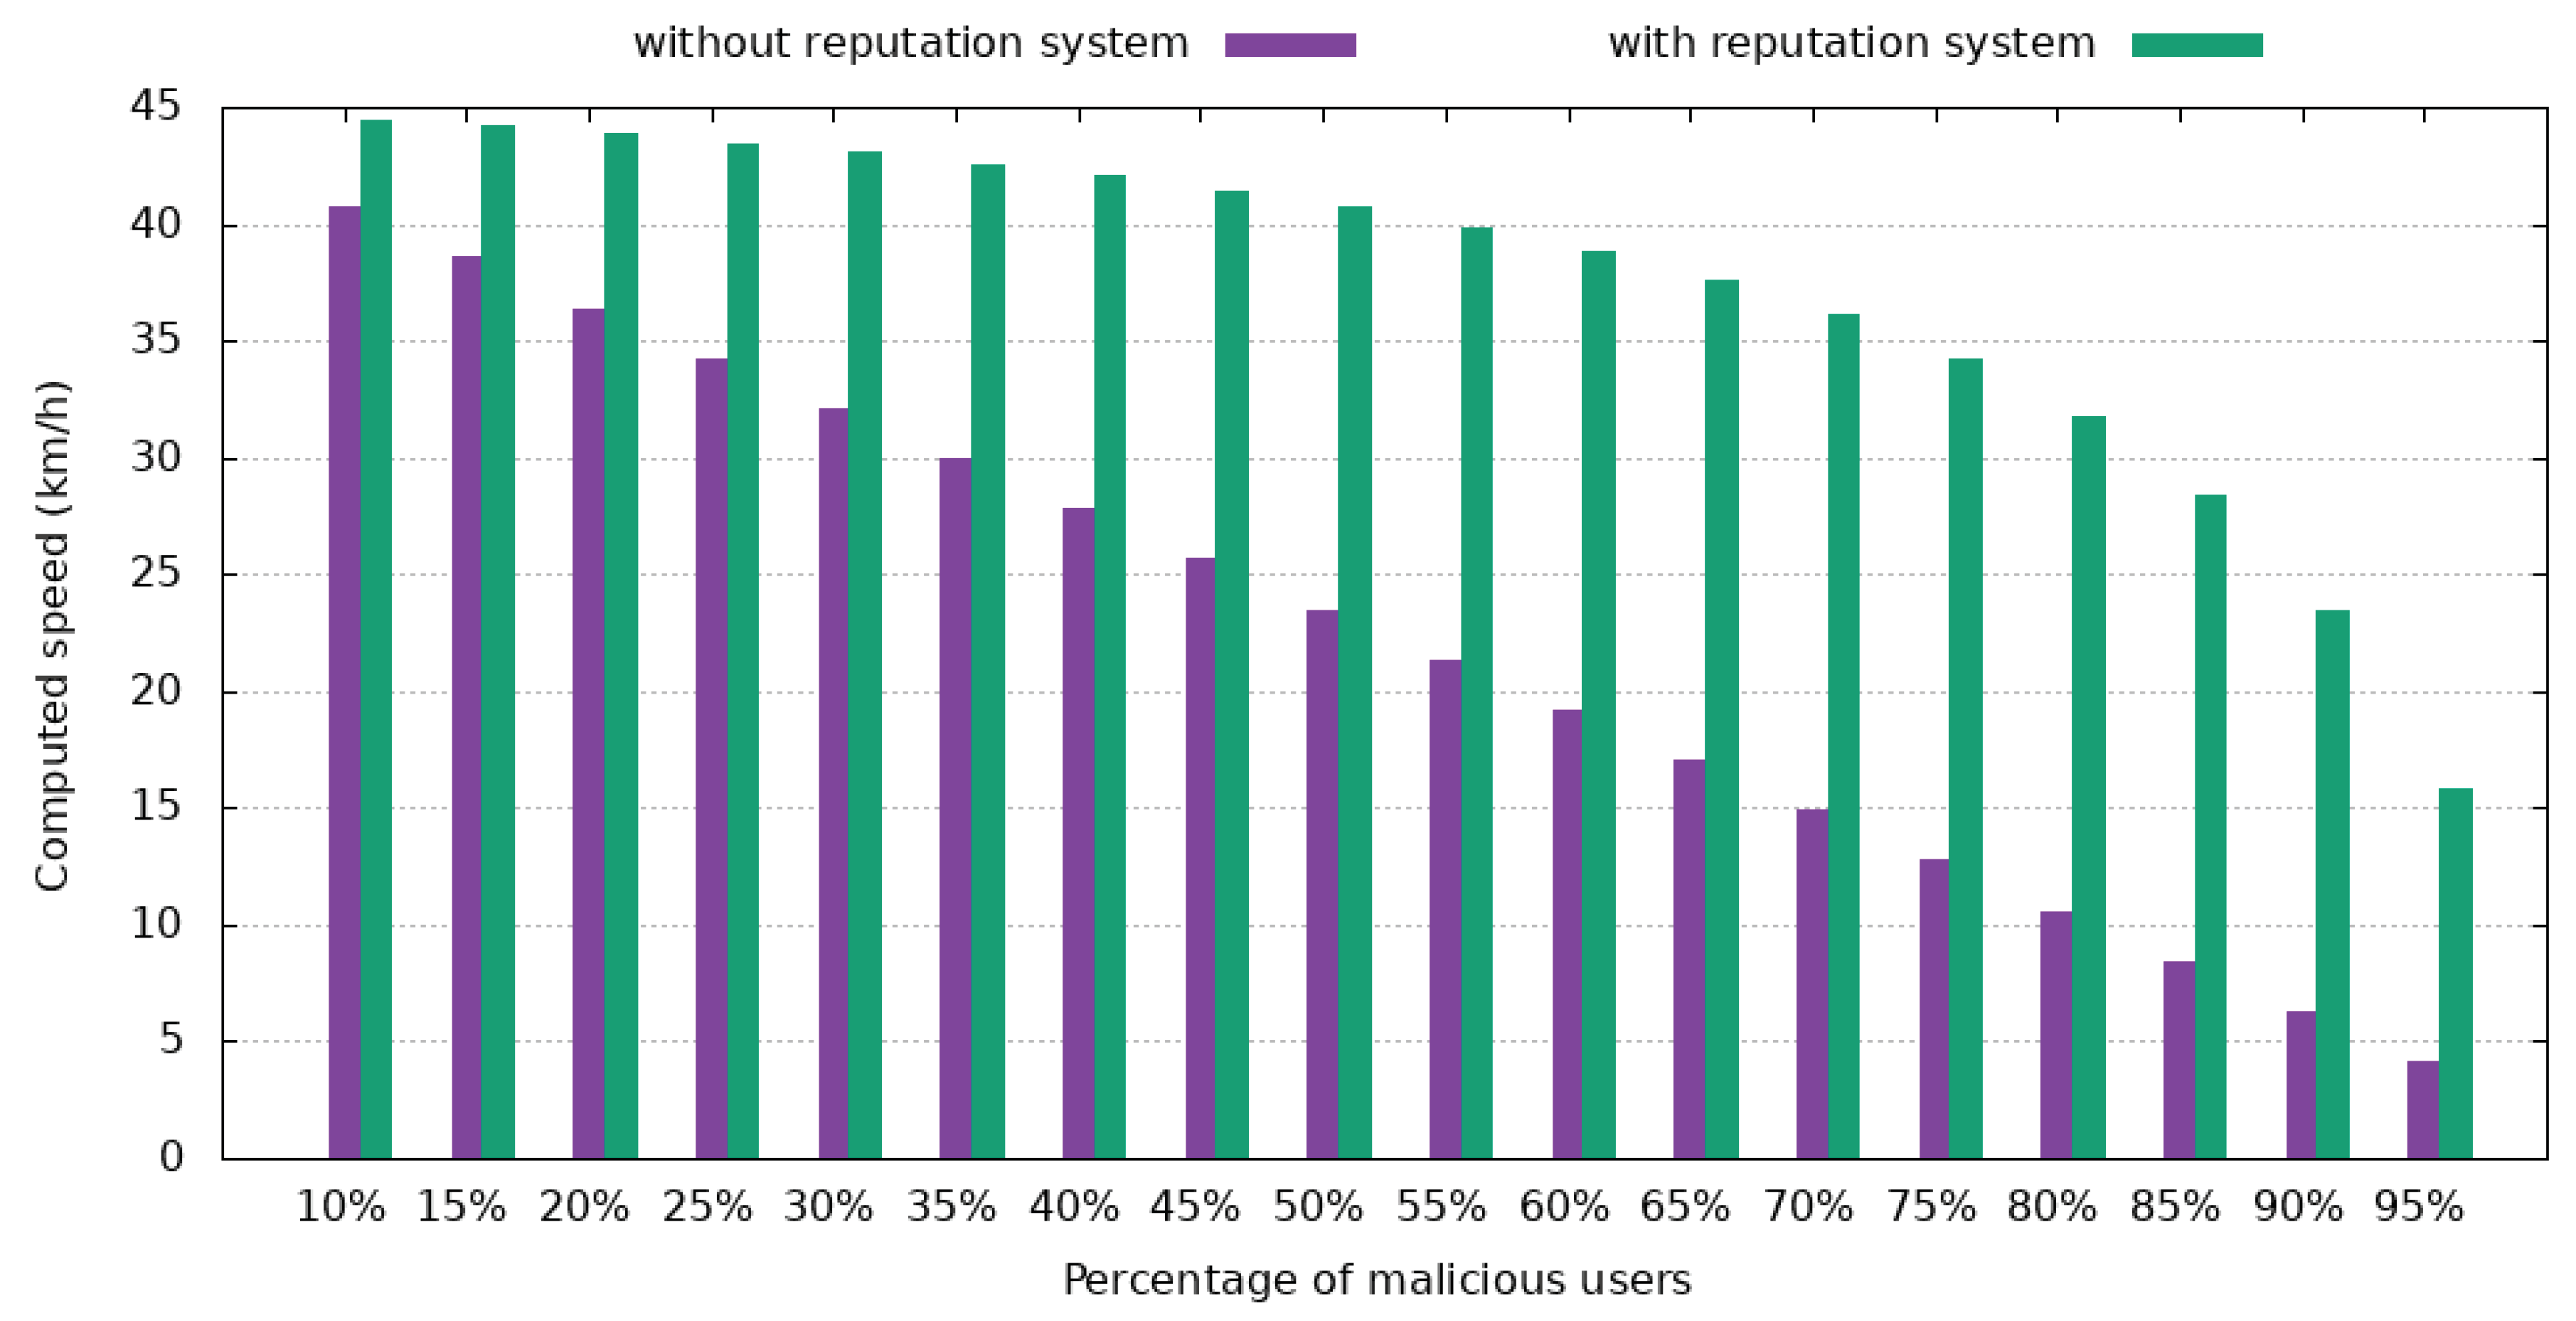
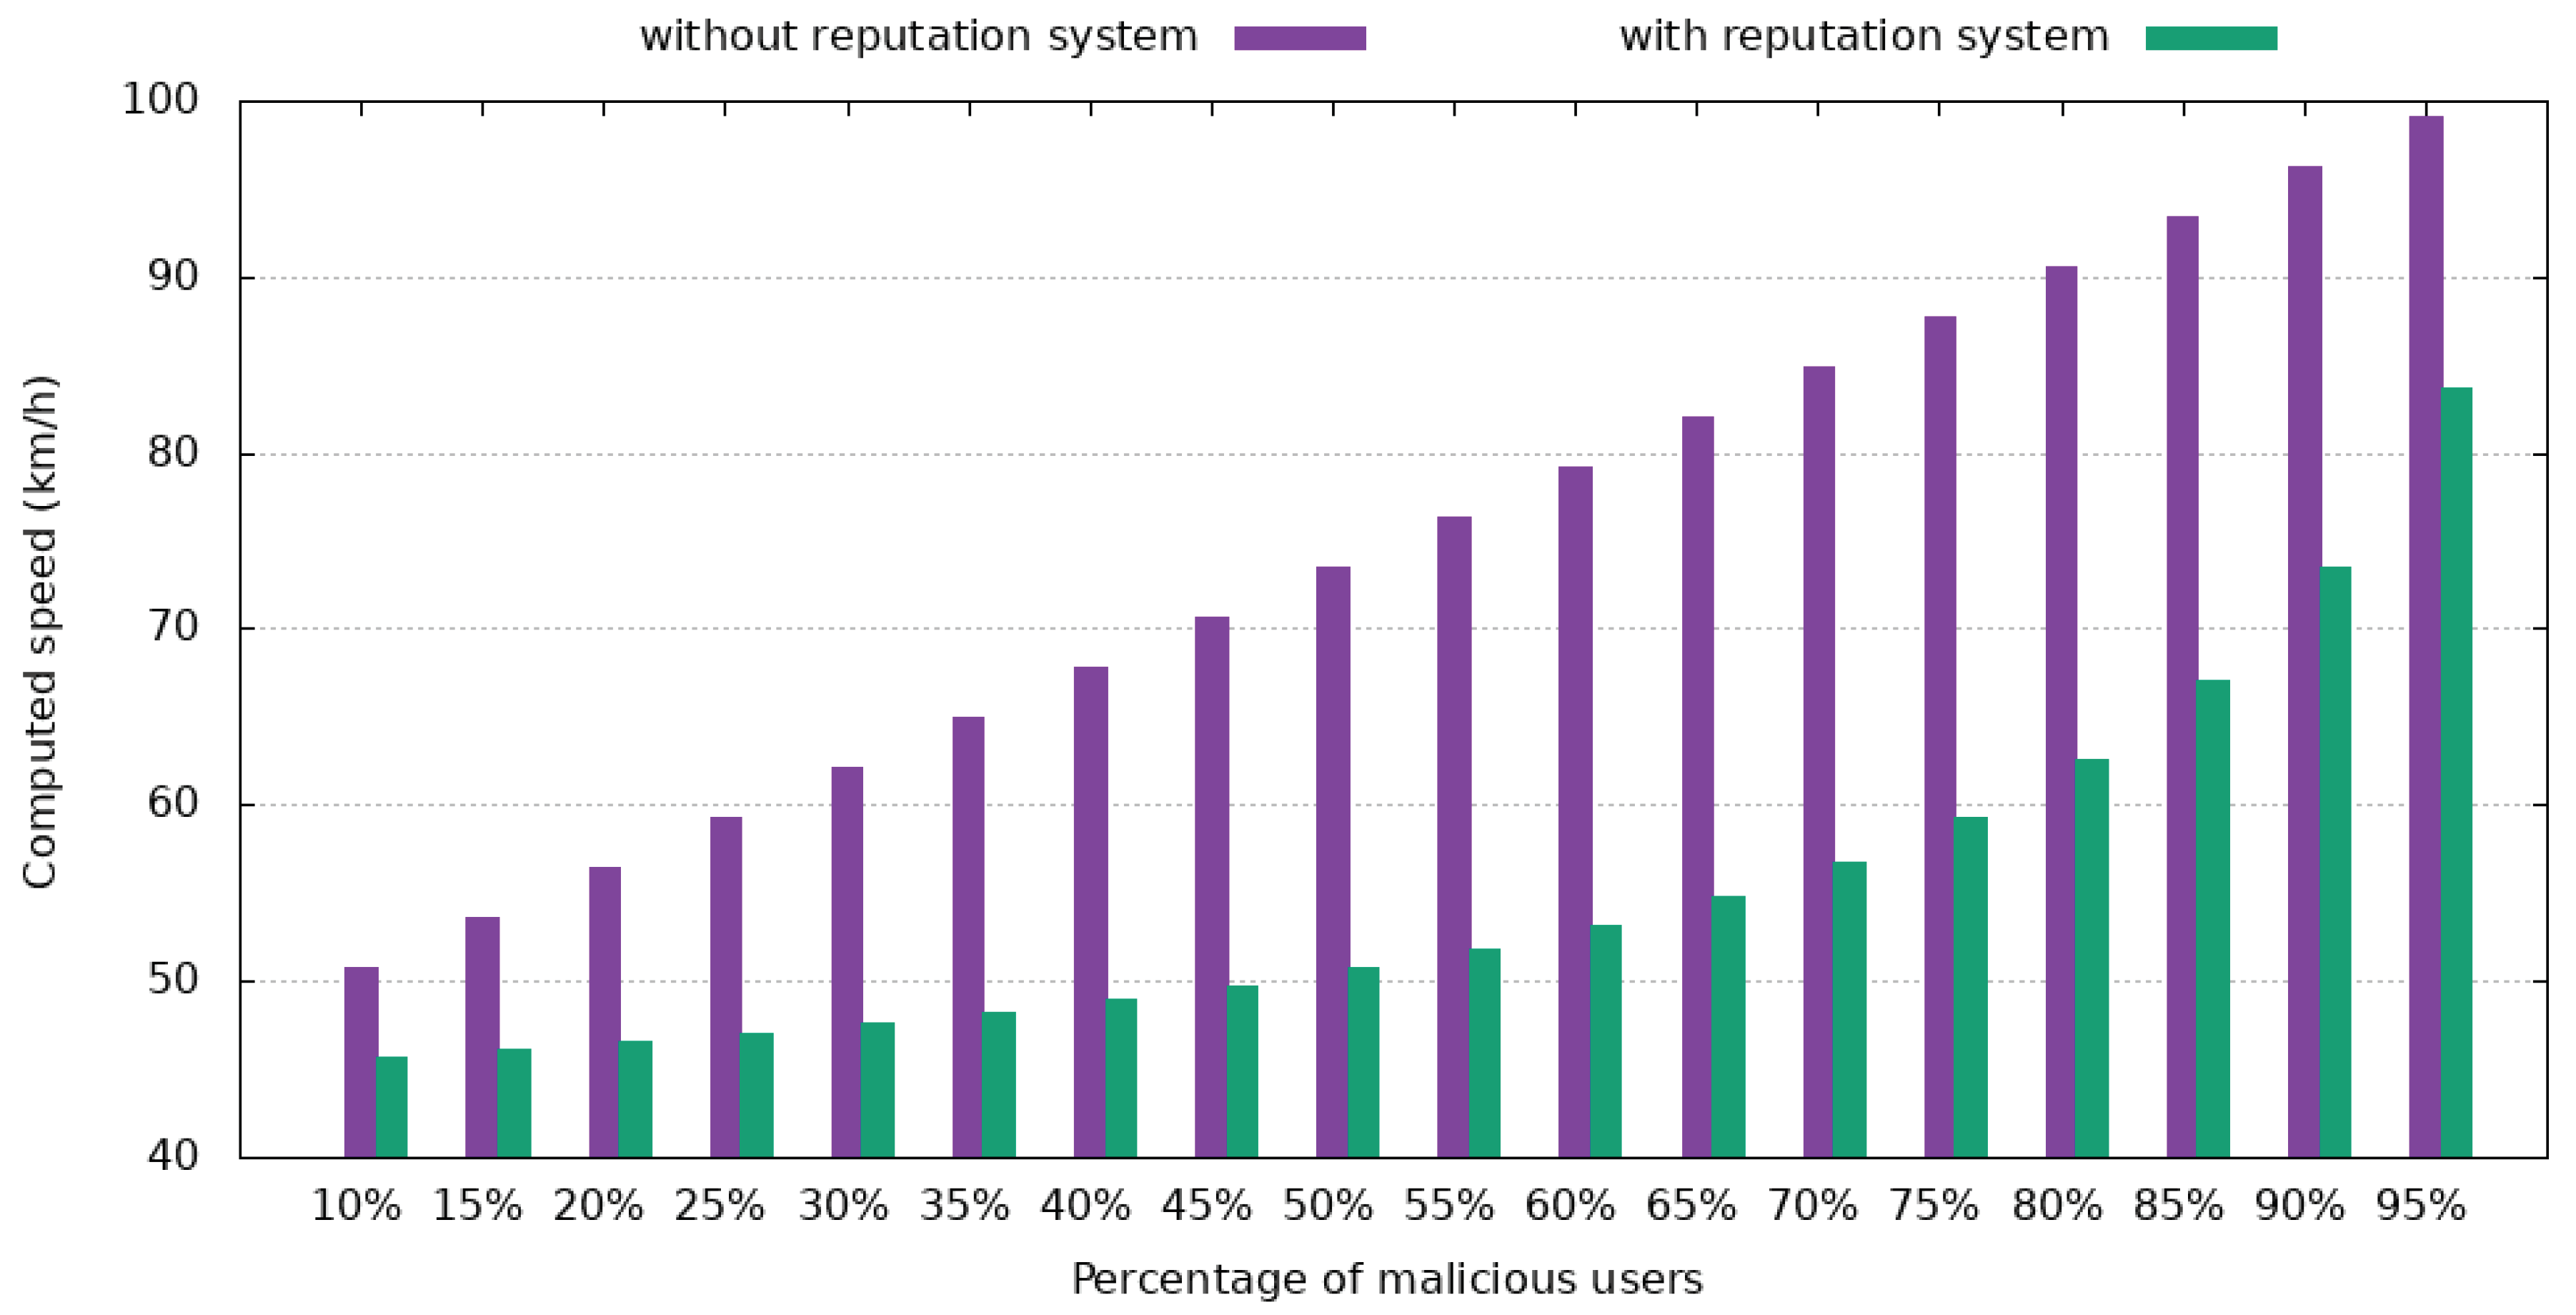
Figure 18 and Figure 19 depict a standard case where the median velocity is 45 km/h, as reported by trusted users, where the impact of the reputation system can be observed. In Figure 18, the malicious users report a velocity of 2 km/h to make the road seem congested and make other drivers choose alternate routes. In Figure 19, malicious users report a speed of 102 km/h, thus giving the impression that the road is free, which will result in more drivers choosing to go that way.
Both tests used a reputation of 0.9 for trustworthy users and 0.1 for malicious users.
As Figure 18 shows, even with 55% of drivers intentionally reporting unreliable data, the reputation system ensures that the computed median velocity is 39.85 km/h, which equates to a 12.4% deviation from the correct answer. For less than 40% of users being malicious, the variance is less than 6.6%.
Figure 19 presents the same trend as the previous case. When 55% of users are malicious and report a speed that is more than double of the real one, the final speed only increases by 15%. When less than 40% of users interacting with a report are malicious, a value that resembles a real-world case more closely, the computed velocity has an error of less than 8.7%.
Considering that the process of awarding reputation for speed reports uses a maximum deviation of 20% from the final answer, it means that even if 60% of users are malicious, all users will receive the correct reputation incentive.
These two cases show that the reputation system manages to counteract the impact of malicious users in a typical situation where the proposed solution receives multiple reports in a specific location. Despite this, there are other cases where a malicious user is alone on the street and, since there is no trustworthy user to tip the scale, he has full control over the state of that portion of the road. A future improvement of the proposed solution could take into account the reputation of the reporting user and the usual median velocity at that moment in time, based on previous data.
The authors of Reference [16] have conducted a test that focuses on the impact the data from a similar system has on an Intelligent Transportation System. For this test, it is supposed that malicious users managed to introduce data so that 20% of the traffic light junctions are congested. Table 2 highlights the impact this has on the average speed and on the fuel economy of cars. Testing has been done using the intelligent routing algorithm from Sim2Car in both San Francisco and Rome.
The data shows that for Rome, the average velocity has decreased by 1.16%, and the quantity of fuel used has also reduced by 0.96%. San Francisco shows the same downwards trend: −6.96% for average speed and −2.1% for fuel consumed.
Based on these results, it can be concluded that the average velocity has fallen because cars are routed away from what the system thinks are busy streets. This, in turn, makes it so that more cars are going through the same streets, thus resulting in a lower median speed. Because cars move less, the amount of fuel they use per hour is smaller. But because getting from point A to point B takes longer, the amount of fuel a driver uses for the same journey is higher than usual.
The proposed system aims to mitigate such attacks from malicious users. Even if unreliable data finds its way onto the blockchain, reports from other users will soon restore the real state of traffic and enable an intelligent routing algorithm to guide the cars as efficiently as possible.
6. Conclusions
This paper focuses on creating a blockchain system for storing reliable traffic data that can be used in various situations by both drivers and other Intelligent Transportation Systems. Due to the nature of a blockchain, data is challenging to tamper, which ensures its integrity.
In this paper it was also presented a reputation system that aims to help reach a consensus within a decentralized network of unreliable nodes, represented by the drivers. The network contains two other types of trusted nodes: region nodes—they gather data from users in their region, run the consensus algorithm on said data and create blocks within the region blockchain, and the master node—it gathers reliable data from region nodes and creates new blocks within the master blockchain.
Future research for the proposed solution will mainly focus on data:
- faster delivery in the case of critical events such as an accident
- more efficient packaging through clustering speed reports that are close together
- better reliability by taking into account metrics based on past data
Another future objective could be integrating the proposed solution with Sim2Car. This would enhance the testing capabilities of both platforms and offer researchers better insight into this field.
Author Contributions
Conceptualization, C.D.; software, D.C. and L.-A.H.; validation, C.D. and R.P.-P.; formal analysis, D.C. and L.-A.H.; investigation, D.C. and L.-A.H.; resources, C.D. and R.P.-P.; writing–original draft preparation, D.C. and R.P.-P.; writing–review and editing, D.C., C.D. and L.-A.H.; supervision, C.D.; project administration, C.D. All authors have read and agreed to the published version of the manuscript.
Funding
This research received no external funding.
Acknowledgments
The research presented in this paper is supported by projects: NETIO Tel-MonAer (cod SMIS2014+ 105976), SPERO (PN-III-P2-2.1-SOL-2016-03-0046, 3Sol/2017) and ROBIN (PN-III-P1-1.2-PCCDI- 2017-0734).
Conflicts of Interest
The authors declare no conflict of interest.
Abbreviations
The following abbreviations are used in this manuscript:
| ITS | Intelligent Transportation System |
| IPFS | InterPlanetary File System |
| VANET | Vehicular ad hoc Network |
References
- Sheller, M.; Urry, J. The Car and the City. Int. J. Urban Reg. Res. 2000, 24, 737–757. [Google Scholar] [CrossRef]
- Employment Trends in the EU Automotive Industry. Available online: https://www.acea.be/statistics/article/employment (accessed on 11 April 2020).
- Reyna, A.; Martin, C.; Chen, J.; Soler, E.; Diaz, M. On blockchain and its integration with IoT. Challenges and opportunities. Future Gener. Comput. Syst. 2018, 88, 173–190. [Google Scholar] [CrossRef]
- Chen, Y. Blockchain tokens and the potential democratization of entrepreneurship and innovation. Bus. Horiz. 2018, 61, 567–575. [Google Scholar] [CrossRef]
- Casino, F.; Dasaklis, T.K.; Patsakis, C. A systematic literature review of blockchain-based applications: Current status, classification and open issue. Telemat. Inf. 2019, 36, 55–81. [Google Scholar] [CrossRef]
- Wang, X.; Zha, X.; Ni, W.; Liu, R.P.; Guo, Y.J.; Niu, X.; Zheng, K. Survey on blockchain for Internet of Things. Comput. Commun. 2019, 136, 10–29. [Google Scholar] [CrossRef]
- Ibba, S.; Pinna, A.; Seu, M.; Pani, F.E. City sense: Blockchain-oriented smart cities. In Proceedings of the XP2017 Scientific Workshops, Cologne, Germany, 22–26 May 2017; ACM: New York, NY, USA, 2017. [Google Scholar]
- Yuan, Y.; Wang, F.-Y. Towards blockchain-based intelligent transportation systems. In Proceedings of the 19th International Conference on Intelligent Transportation Systems (ITSC), Rio de Janeiro, Brazil, 1–4 November 2016. [Google Scholar]
- Sharma, P.K.; Moon, S.Y.; Park, J.H. Block-VN: A distributed blockchain based vehicular network architecture in smart city. JIPS 2017, 13, 184–195. [Google Scholar]
- Ortega, V.; Bouchmal, F.; Monserrat, J.F. Trusted 5G vehicular networks: Blockchains and content-centric networking. IEEE Veh. Technol. Mag. 2018, 13, 121–127. [Google Scholar] [CrossRef]
- Khelifi, H.; Luo, S.; Nour, B.; Moungla, H.; Ahmed, S.H. Reputation-based blockchain for secure NDN caching in vehicular networks. In Proceedings of the Conference on Standards for Communications and Networking (CSCN), Paris, France, 29–31 October 2018. [Google Scholar]
- Zichichi, M.; Ferretti, S.; D’Angelo, G. A Distributed Ledger Based Infrastructure for Smart Transportation System and Social Good. In Proceedings of the IEEE 17th Annual Consumer Communications & Networking Conference (CCNC), Las Vegas, NV, USA, 10–13 January 2020; pp. 1–6. [Google Scholar]
- Dennis, R.; Owen, G. Rep on the block: A next generation reputation system based on the blockchain. In Proceedings of the 2015 10th International Conference for Internet Technology and Secured Transactions (ICITST), London, UK, 14–16 December 2015; pp. 131–138. [Google Scholar]
- Zhang, J. A Survey on Trust Management for VANETs. In Proceedings of the 2011 IEEE International Conference on Advanced Information Networking and Applications, Singapore, 22–25 March 2011; pp. 105–112. [Google Scholar]
- Mühlbauer, R.; Kleinschmidt, J. Bring Your Own Reputation: A Feasible Trust System for Vehicular Ad Hoc Networks. Actuator Netw. 2018, 7, 37. [Google Scholar] [CrossRef] [Green Version]
- Hîrțan, L.; Dobre, C.; González-Vélez, H. Blockchain-based Reputation for Intelligent Transportation Systems. Sensors 2020, 20, 791. [Google Scholar] [CrossRef] [PubMed] [Green Version]
- LeMahieu, C. Nano: A Feeless Distributed Cryptocurrency Network. Available online: https://nano.org/en/whitepaper (accessed on 24 March 2018).
Figure 1.
System overview.

Figure 2.
System design of the proposed solution.

Figure 3.
Solution logic.

Figure 4.
Example of cars going the same way but having different directions.

Figure 5.
Example of two cars changing to the same lane.

Figure 6.
Example of user directions used in the clustering process.

Figure 7.
Reputation change over time (speedCoefficient = ).

Figure 8.
Reputation change over time (speedCoefficient = ).

Figure 9.
Reputation change over time (speedCoefficient = ).

Figure 10.
One block vs. more blocks – same amount of data.

Figure 11.
Block structure.

Figure 12.
Impact of speed reports on the size of a block.

Figure 13.
Impact of alerts on the size of a block.

Figure 14.
Impact of reputation changes on the size of a block.

Figure 15.
Propagation time - best-case scenario.

Figure 16.
Propagation time - worst-case scenario.

Figure 17.
Capture of San Francisco from Sim2Car with proposed region separation.

Figure 18.
Impact of malicious users reporting lower speeds.

Figure 19.
Impact of malicious users reporting higher speeds.


Table 1.
Possible cases for the situation depicted in Figure 4.
Table 1.
Possible cases for the situation depicted in Figure 4.
| Speed (km/h) | t (s) | No. Lanes Changed | Z (m) | Y (m) | (Degrees) |
|---|---|---|---|---|---|
| 50 | 15 | 1 | 3.5 | 208.3 | 1.0 |
| 50 | 15 | 2 | 7 | 208.3 | 1.9 |
| 50 | 15 | 3 | 10.5 | 208.3 | 2.9 |
| 50 | 10 | 1 | 3.5 | 138.9 | 1.4 |
| 50 | 10 | 2 | 7 | 138.9 | 2.9 |
| 50 | 10 | 3 | 10.5 | 138.9 | 4.3 |
| 50 | 5 | 1 | 3.5 | 69.4 | 2.9 |
| 50 | 5 | 2 | 7 | 69.4 | 5.8 |
| 50 | 5 | 3 | 10.5 | 69.4 | 8.6 |
| 20 | 15 | 1 | 3.5 | 83.3 | 2.4 |
| 20 | 15 | 2 | 7 | 83.3 | 4.8 |
| 20 | 15 | 3 | 10.5 | 83.3 | 7.2 |
| 20 | 10 | 1 | 3.5 | 55.5 | 3.6 |
| 20 | 10 | 2 | 7 | 55.5 | 7.2 |
| 20 | 10 | 3 | 10.5 | 55.5 | 10.7 |
| 20 | 5 | 1 | 3.5 | 27.8 | 7.2 |
| 20 | 5 | 2 | 7 | 27.8 | 14.1 |
| 20 | 5 | 3 | 10.5 | 27.8 | 20.7 |
Table 2.
Impact of malicious data on average speed and fuel economy.
| City | Normal Traffic | 20% Blocked Intersections | ||
|---|---|---|---|---|
| Avg Speed (km/h) | Avg Fuel (L/h) | Avg Speed (km/h) | Avg Fuel (L/h) | |
| Rome | 41.24 | 11.49 | 40.76 | 11.38 |
| San Francisco | 41.09 | 11.4 | 38.23 | 11.16 |
Publisher’s Note: MDPI stays neutral with regard to jurisdictional claims in published maps and institutional affiliations. |
© 2020 by the authors. Licensee MDPI, Basel, Switzerland. This article is an open access article distributed under the terms and conditions of the Creative Commons Attribution (CC BY) license (http://creativecommons.org/licenses/by/4.0/).
Share and Cite
MDPI and ACS Style
Cocîrlea, D.; Dobre, C.; Hîrţan, L.-A.; Purnichescu-Purtan, R. Blockchain in Intelligent Transportation Systems. Electronics 2020, 9, 1682. https://doi.org/10.3390/electronics9101682
AMA Style
Cocîrlea D, Dobre C, Hîrţan L-A, Purnichescu-Purtan R. Blockchain in Intelligent Transportation Systems. Electronics. 2020; 9(10):1682. https://doi.org/10.3390/electronics9101682
Chicago/Turabian StyleCocîrlea, Dragoş, Ciprian Dobre, Liviu-Adrian Hîrţan, and Raluca Purnichescu-Purtan. 2020. "Blockchain in Intelligent Transportation Systems" Electronics 9, no. 10: 1682. https://doi.org/10.3390/electronics9101682
Note that from the first issue of 2016, this journal uses article numbers instead of page numbers. See further details here.