Responses of Ground-Dwelling Spider (Arachnida: Araneae) Communities to Wildfire in Three Habitats in Northern New Mexico, USA, with Notes on Mites and Harvestmen (Arachnida: Acari, Opiliones)

Abstract
:
1. Introduction
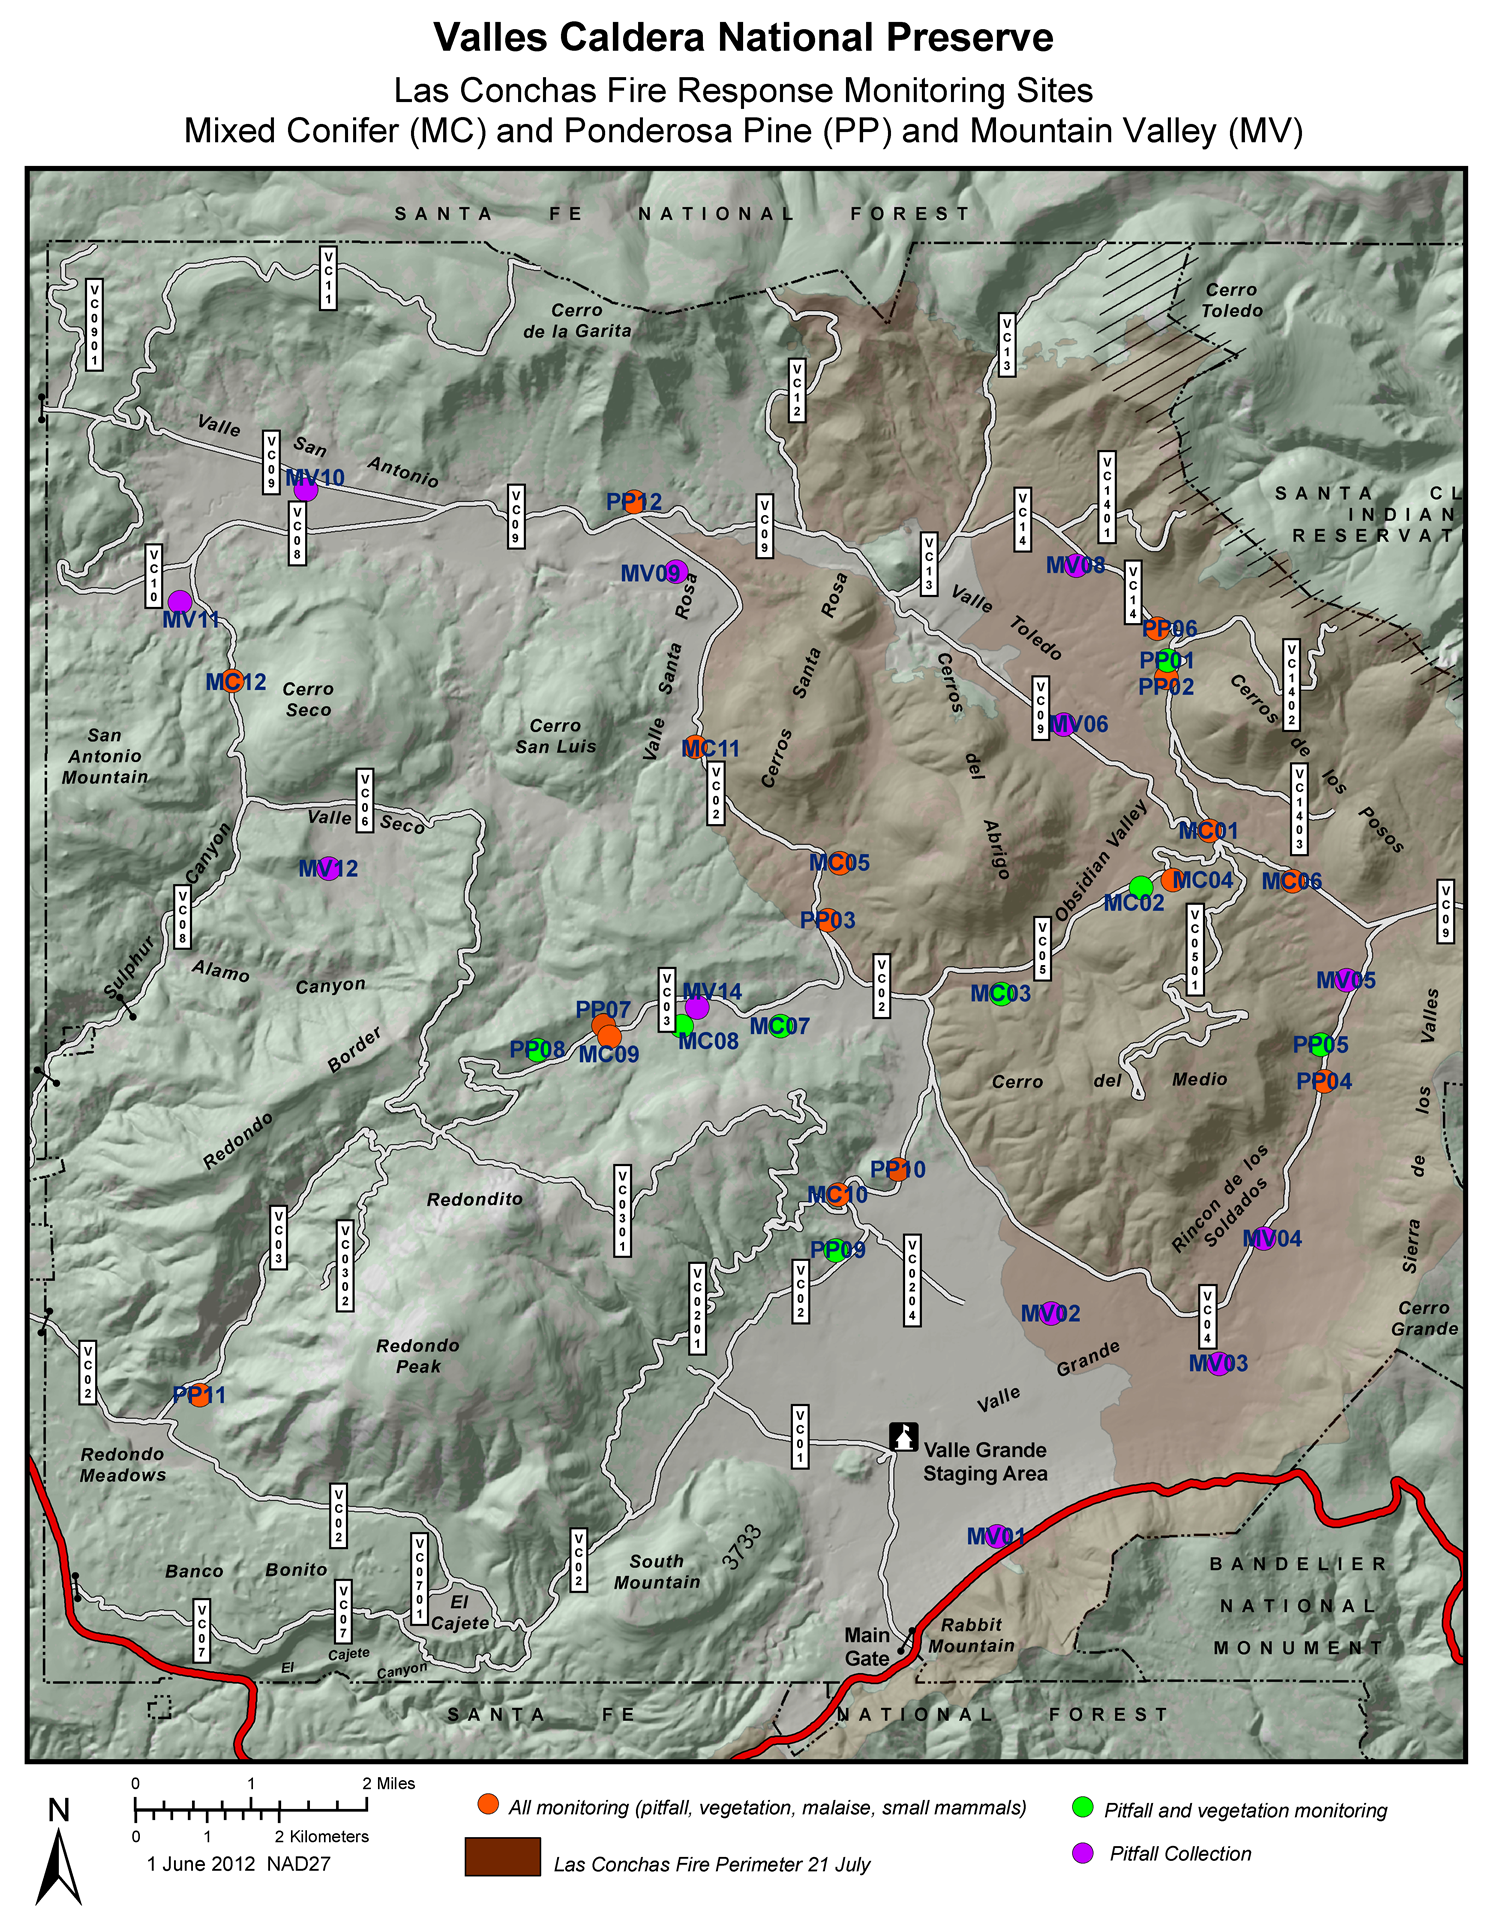
2. Materials and Methods
3. Results
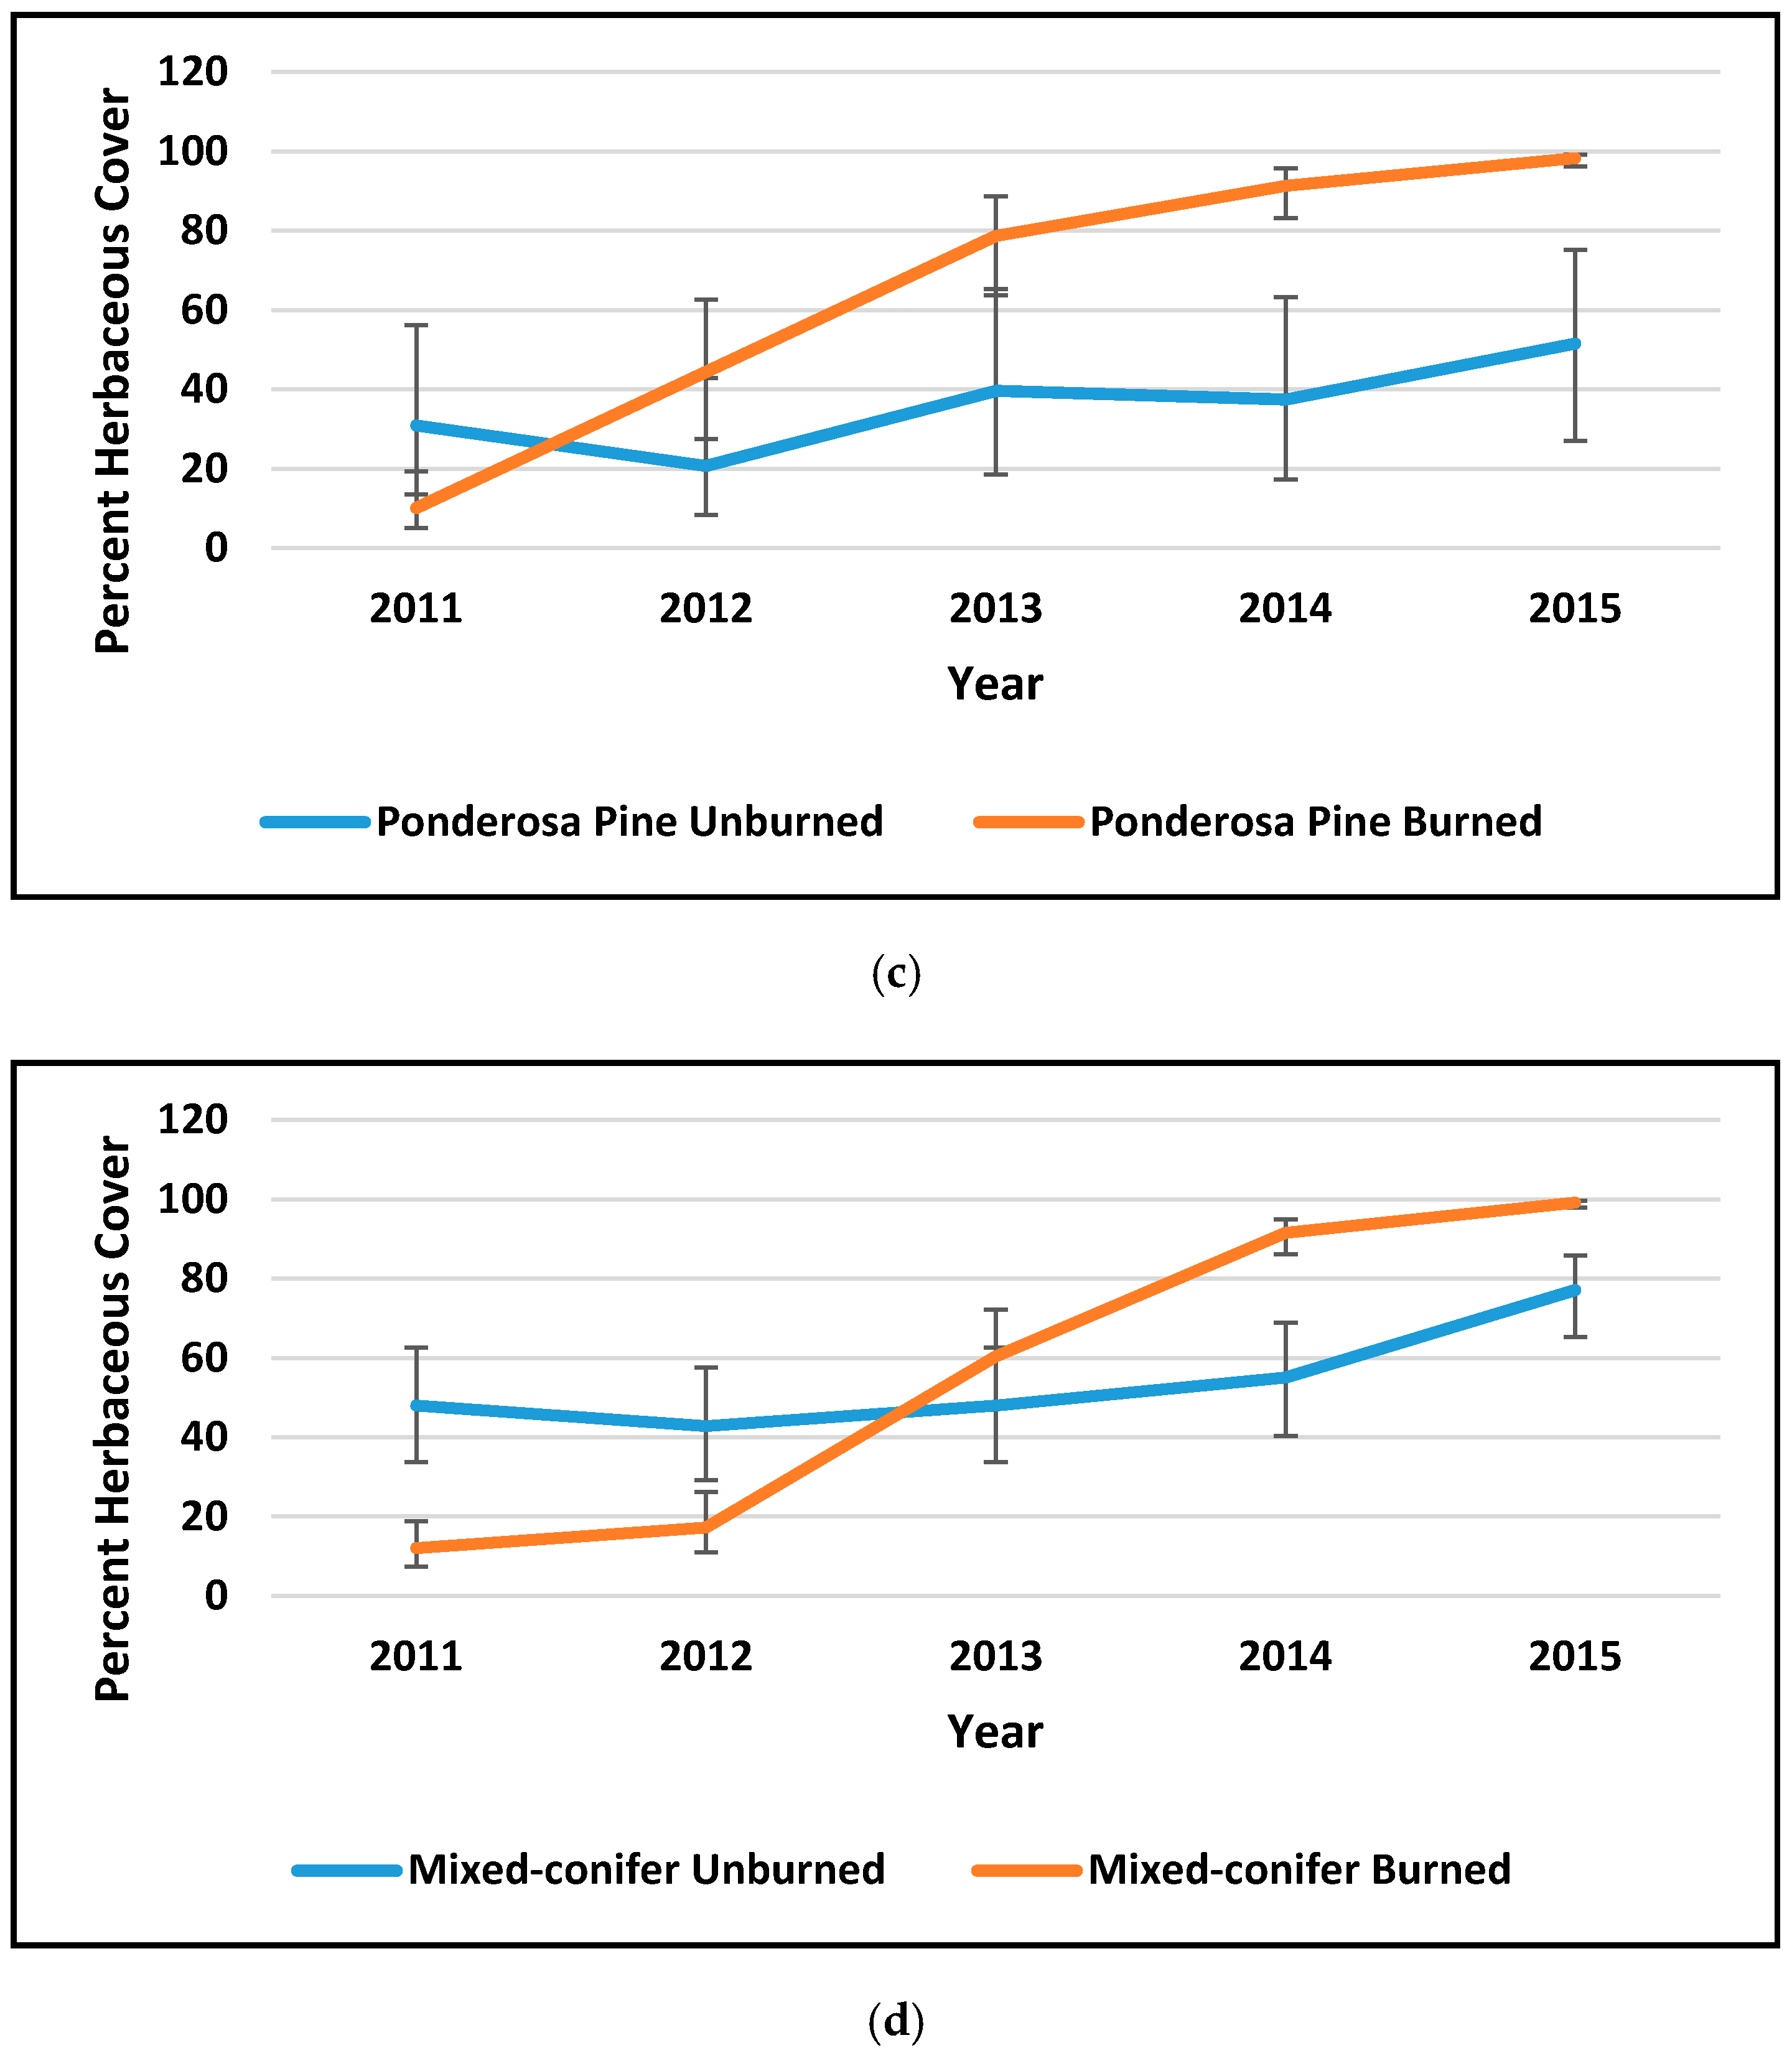
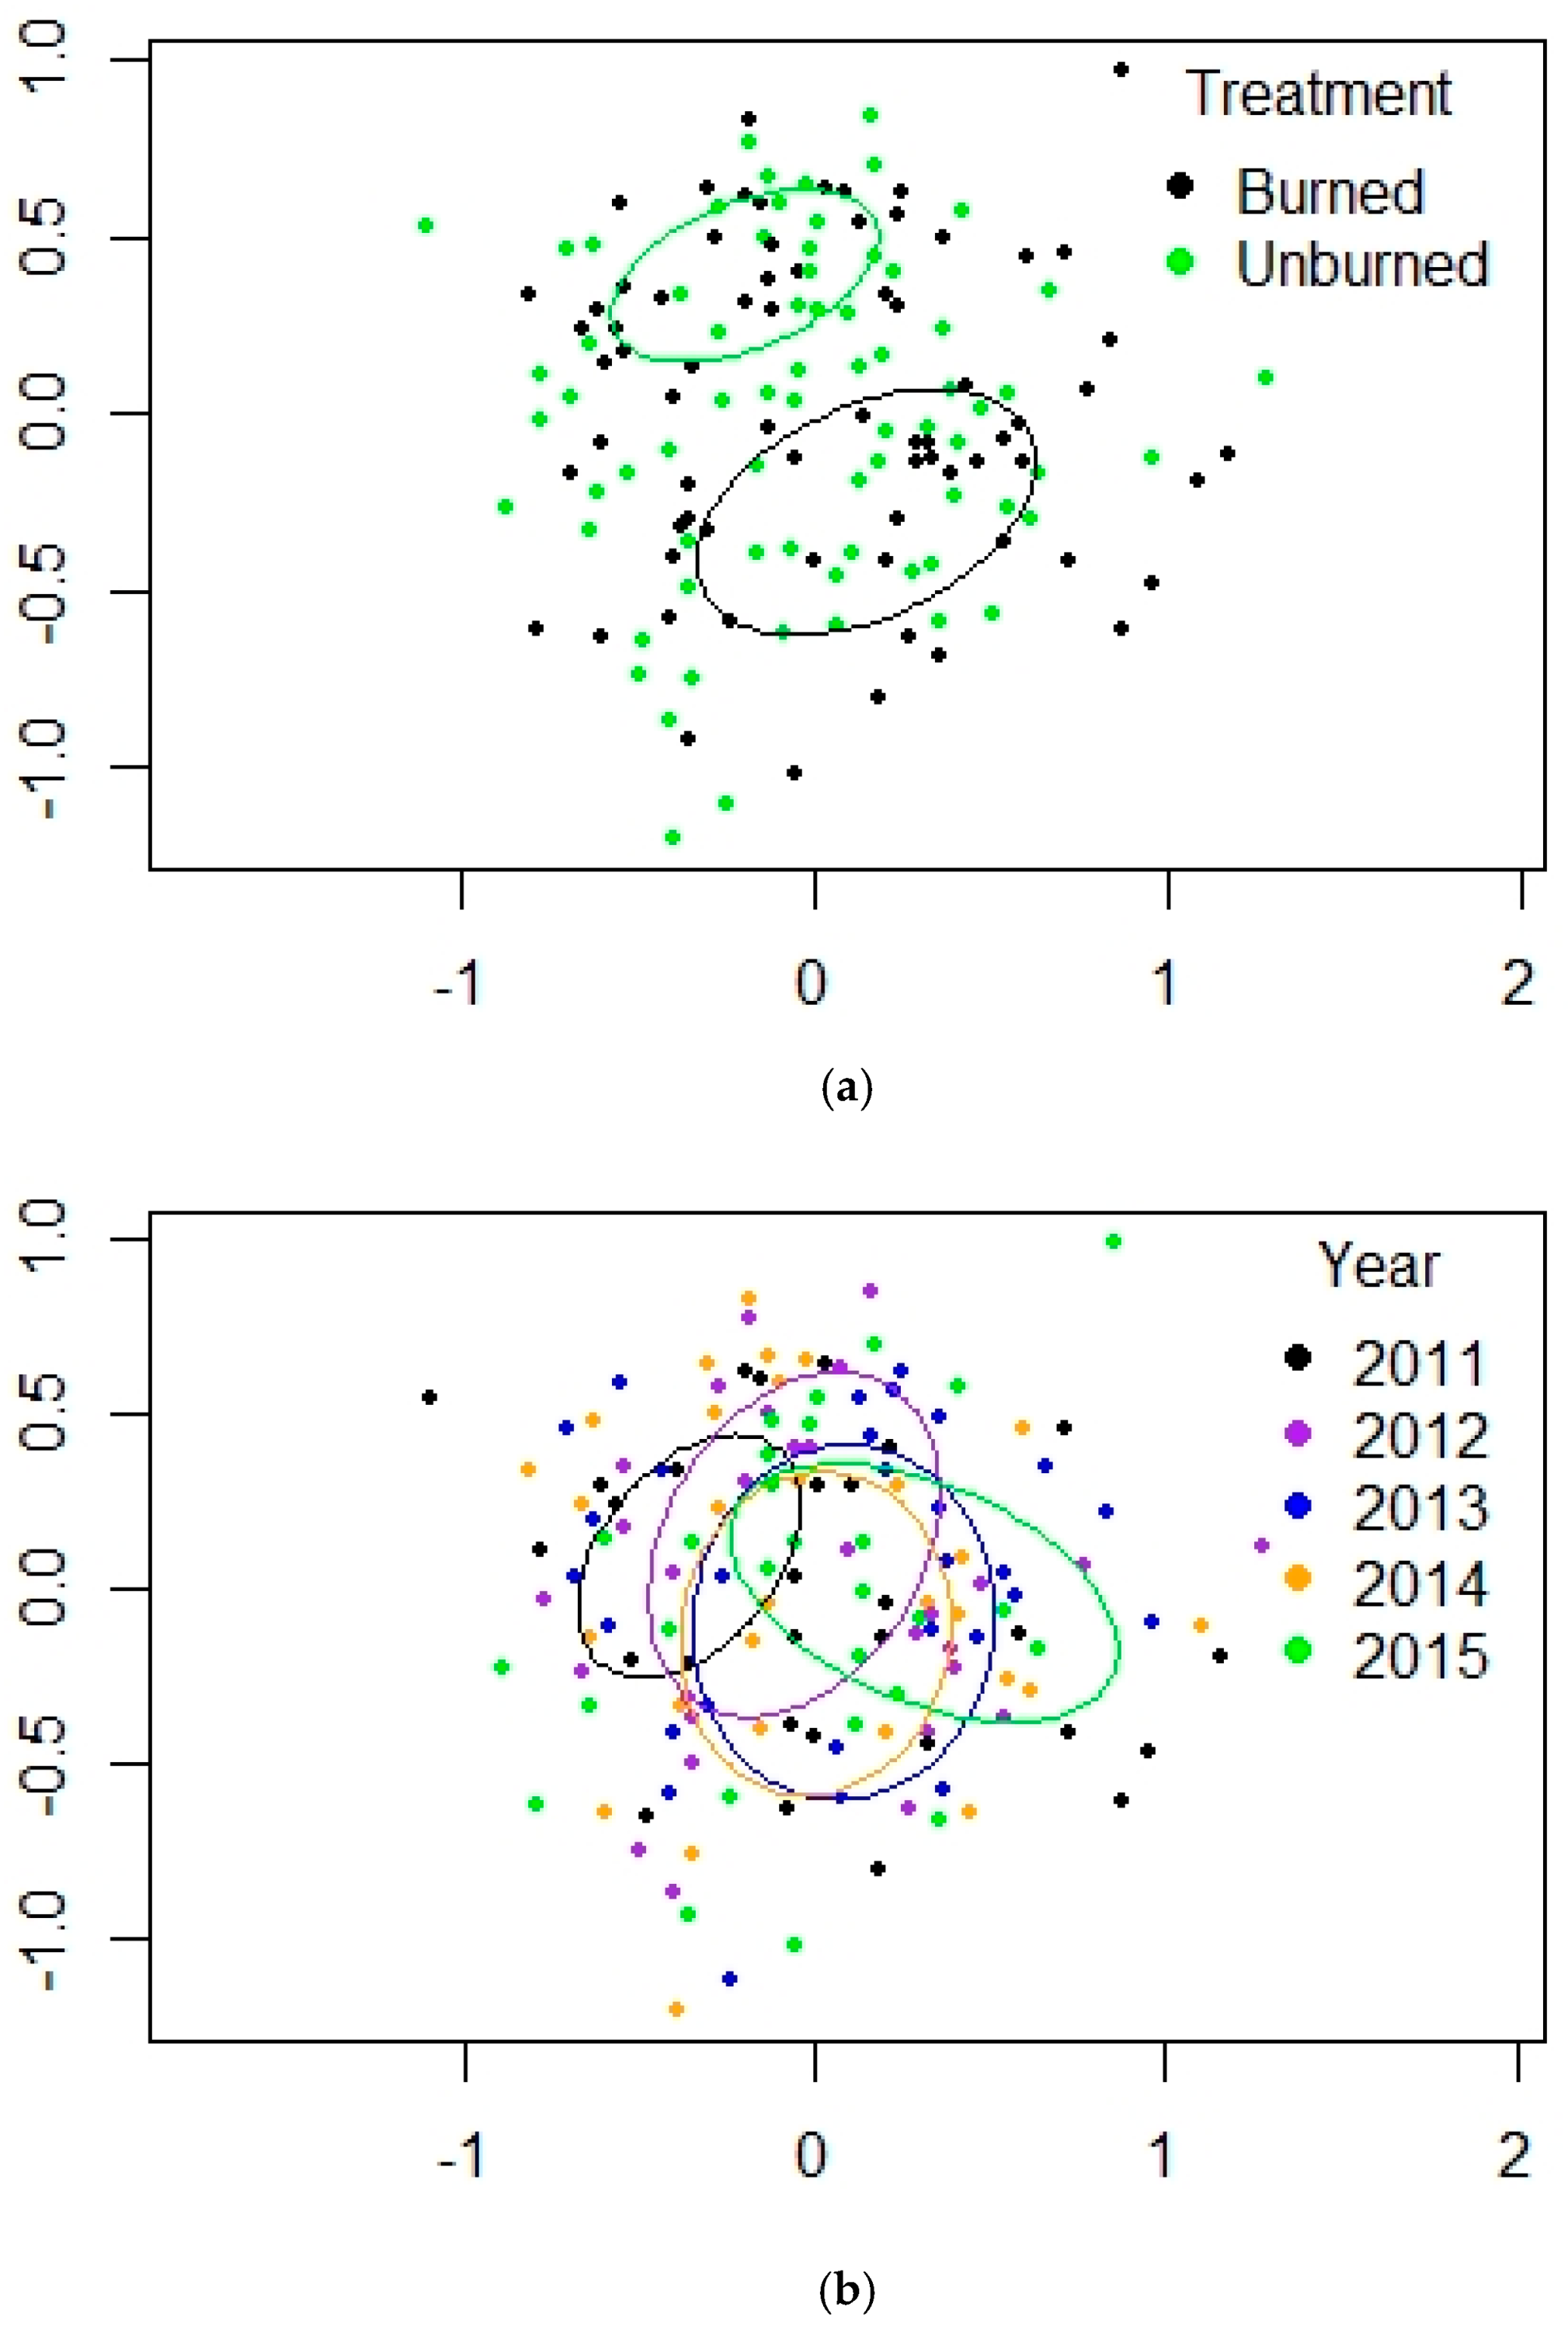
3.1. Ponderosa Pine Forest (PP)
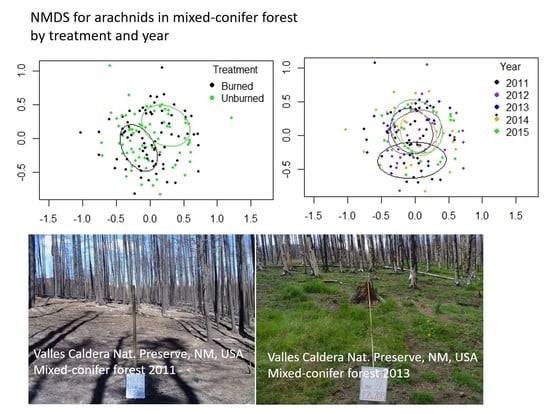
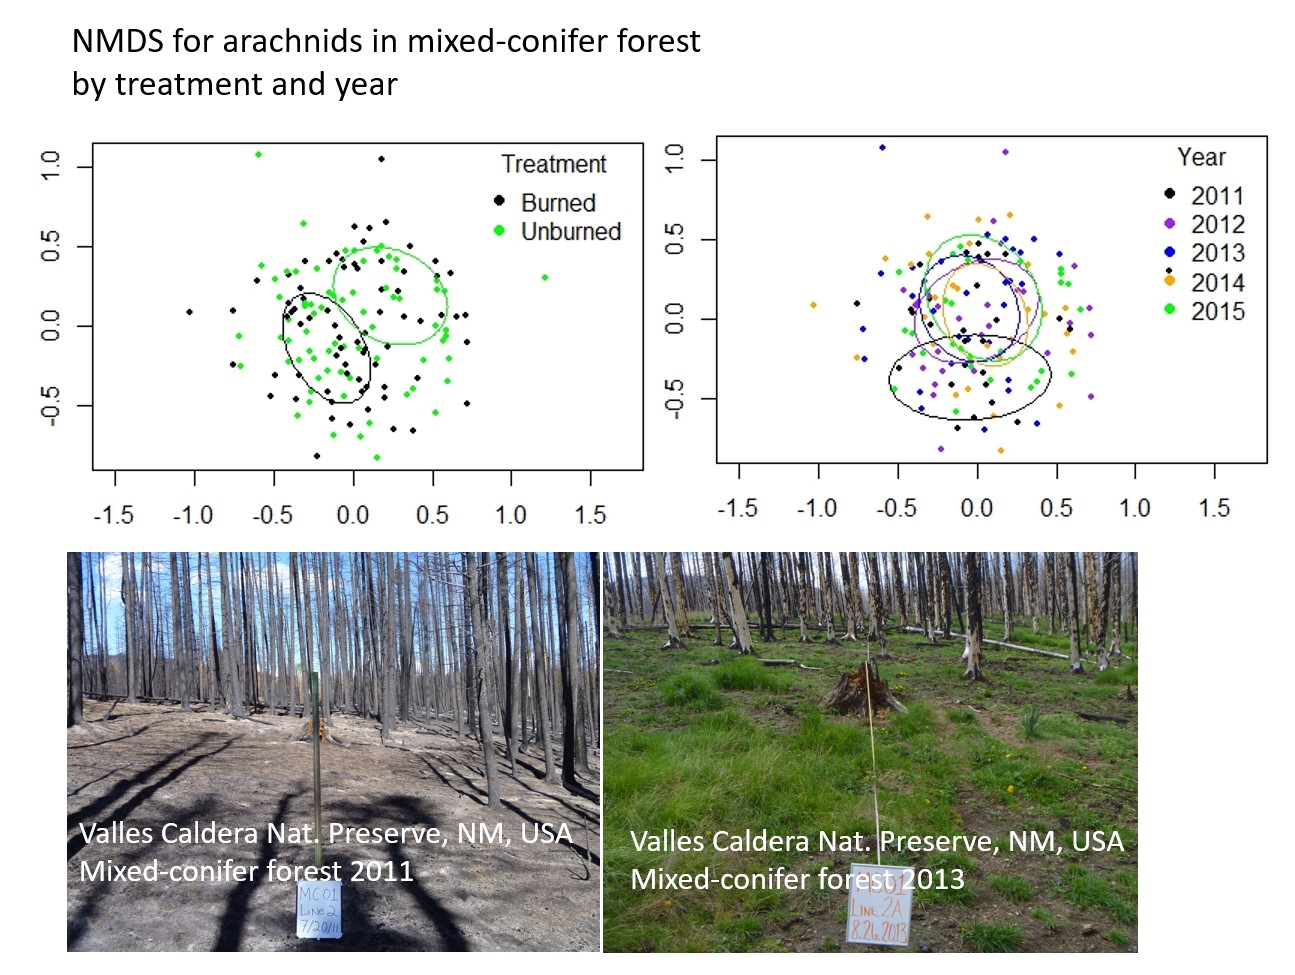
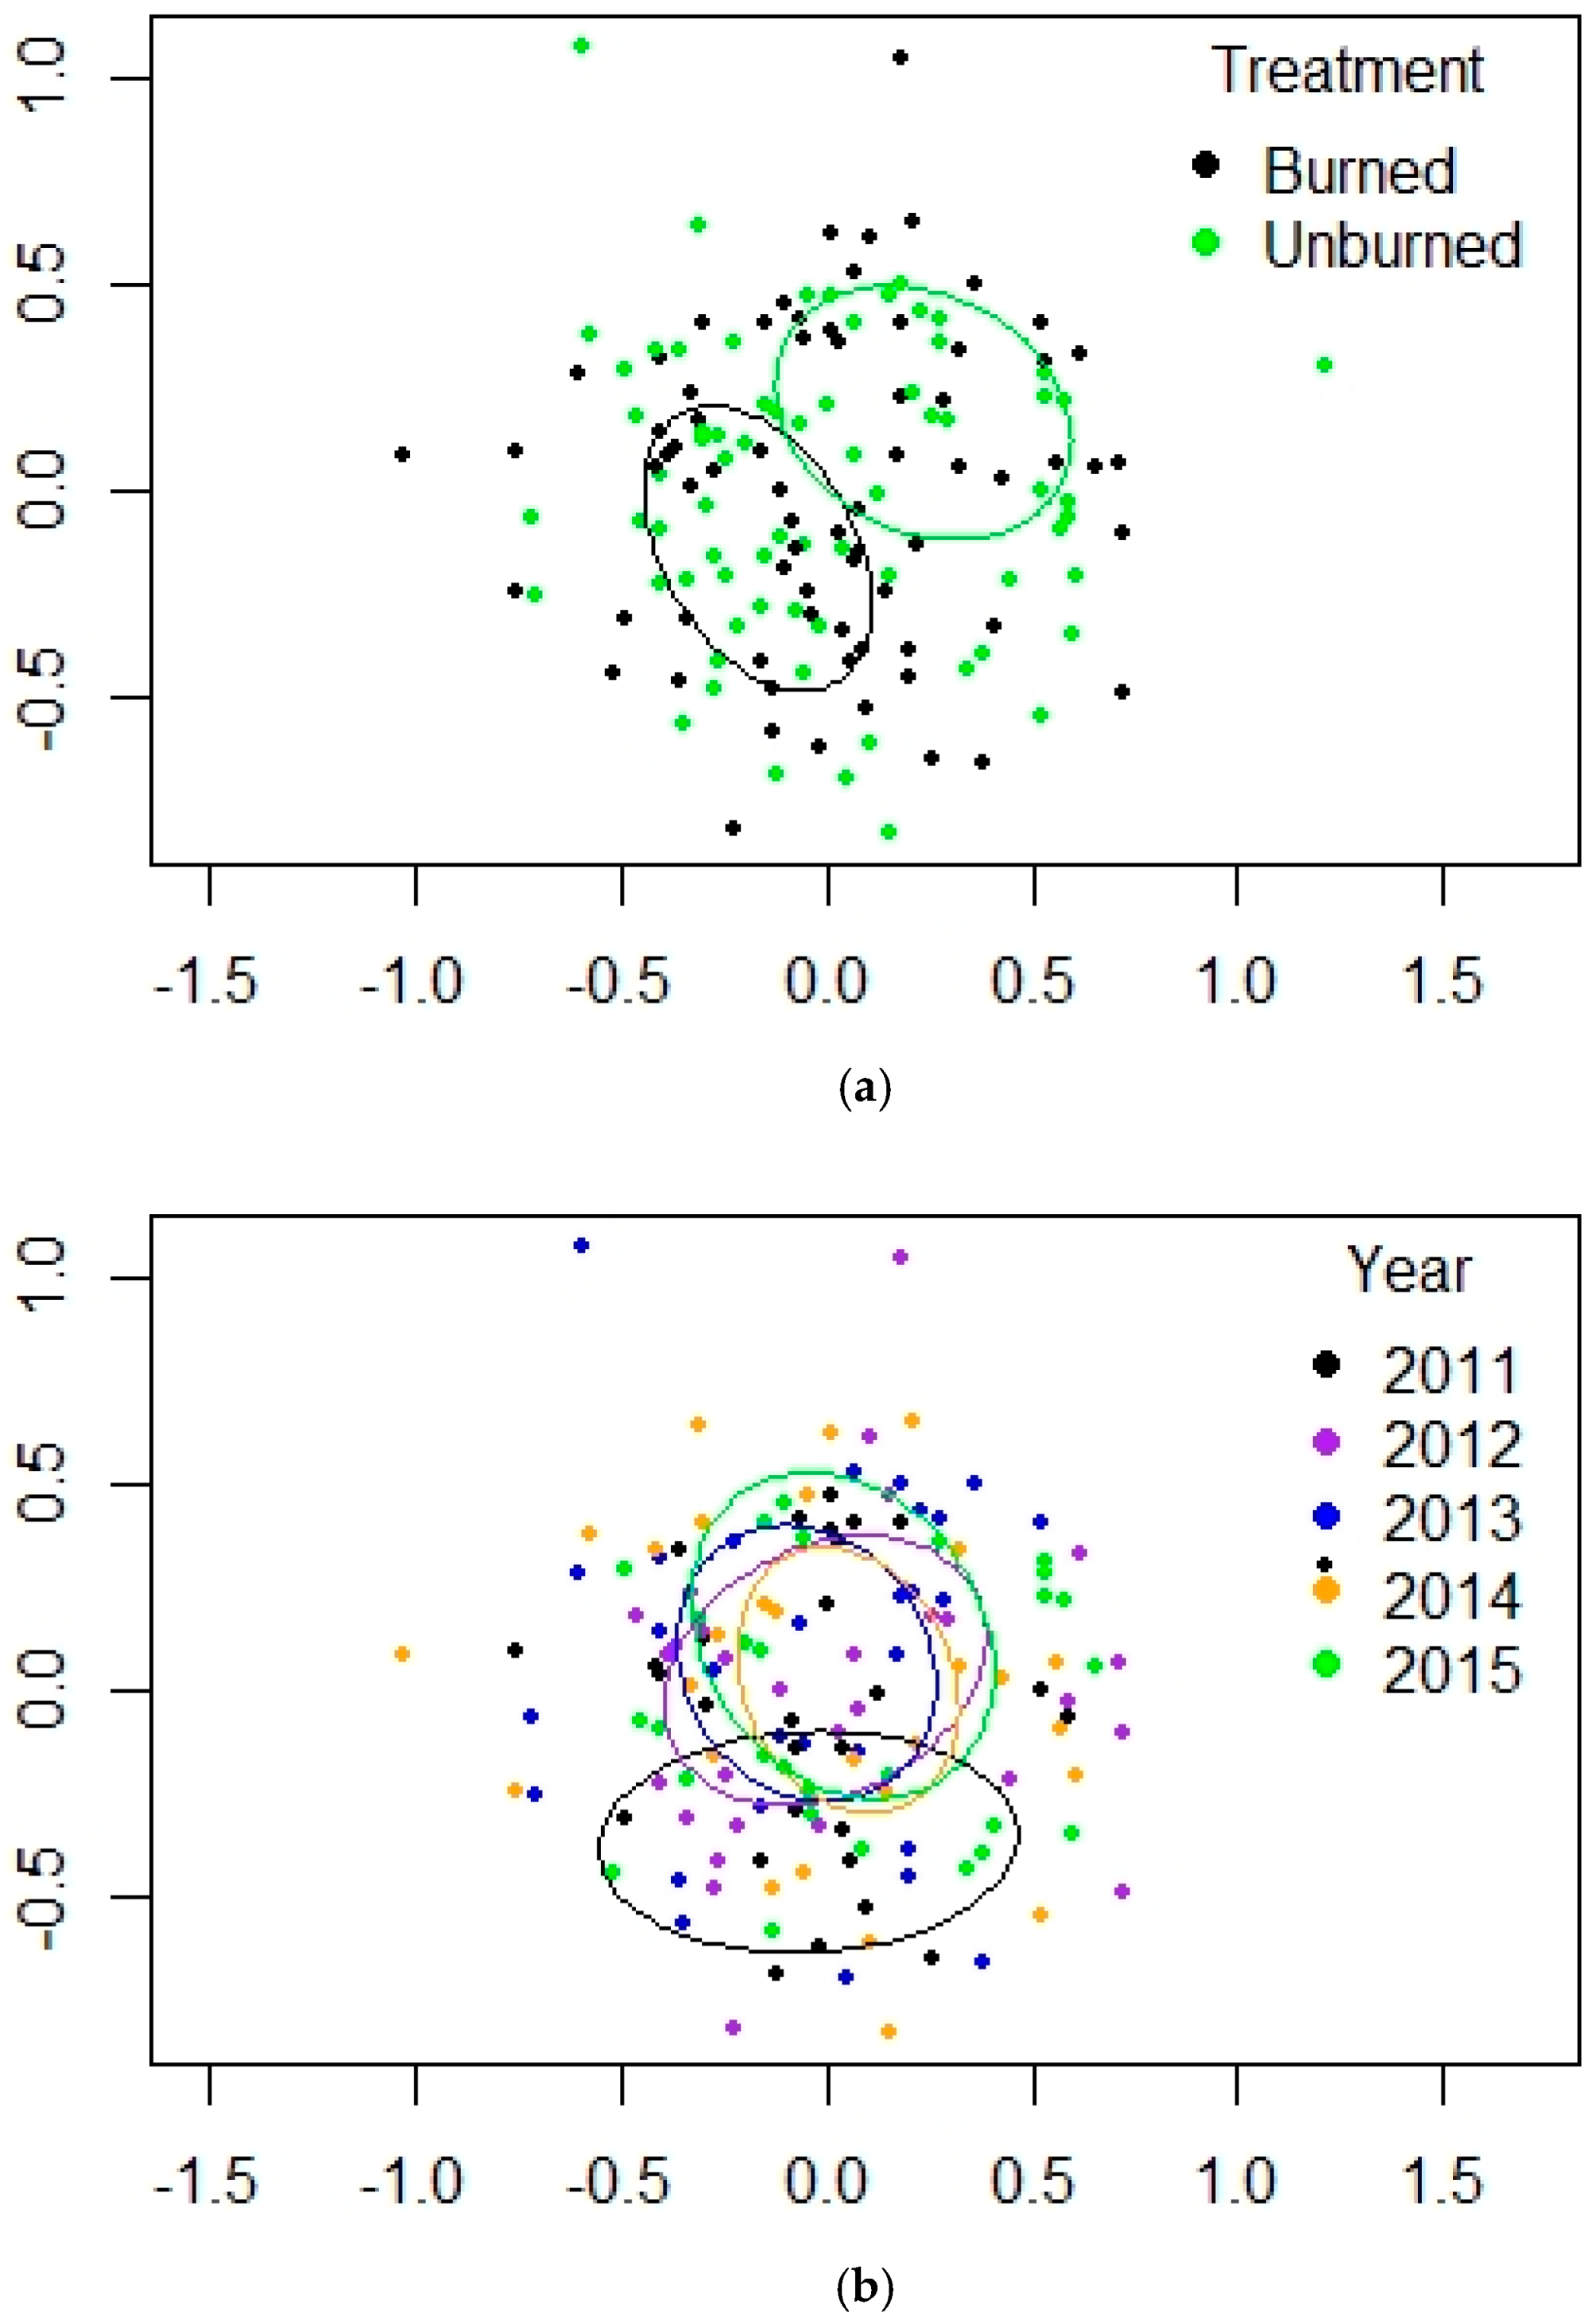
3.2. Mixed-Conifer Forest (MC)
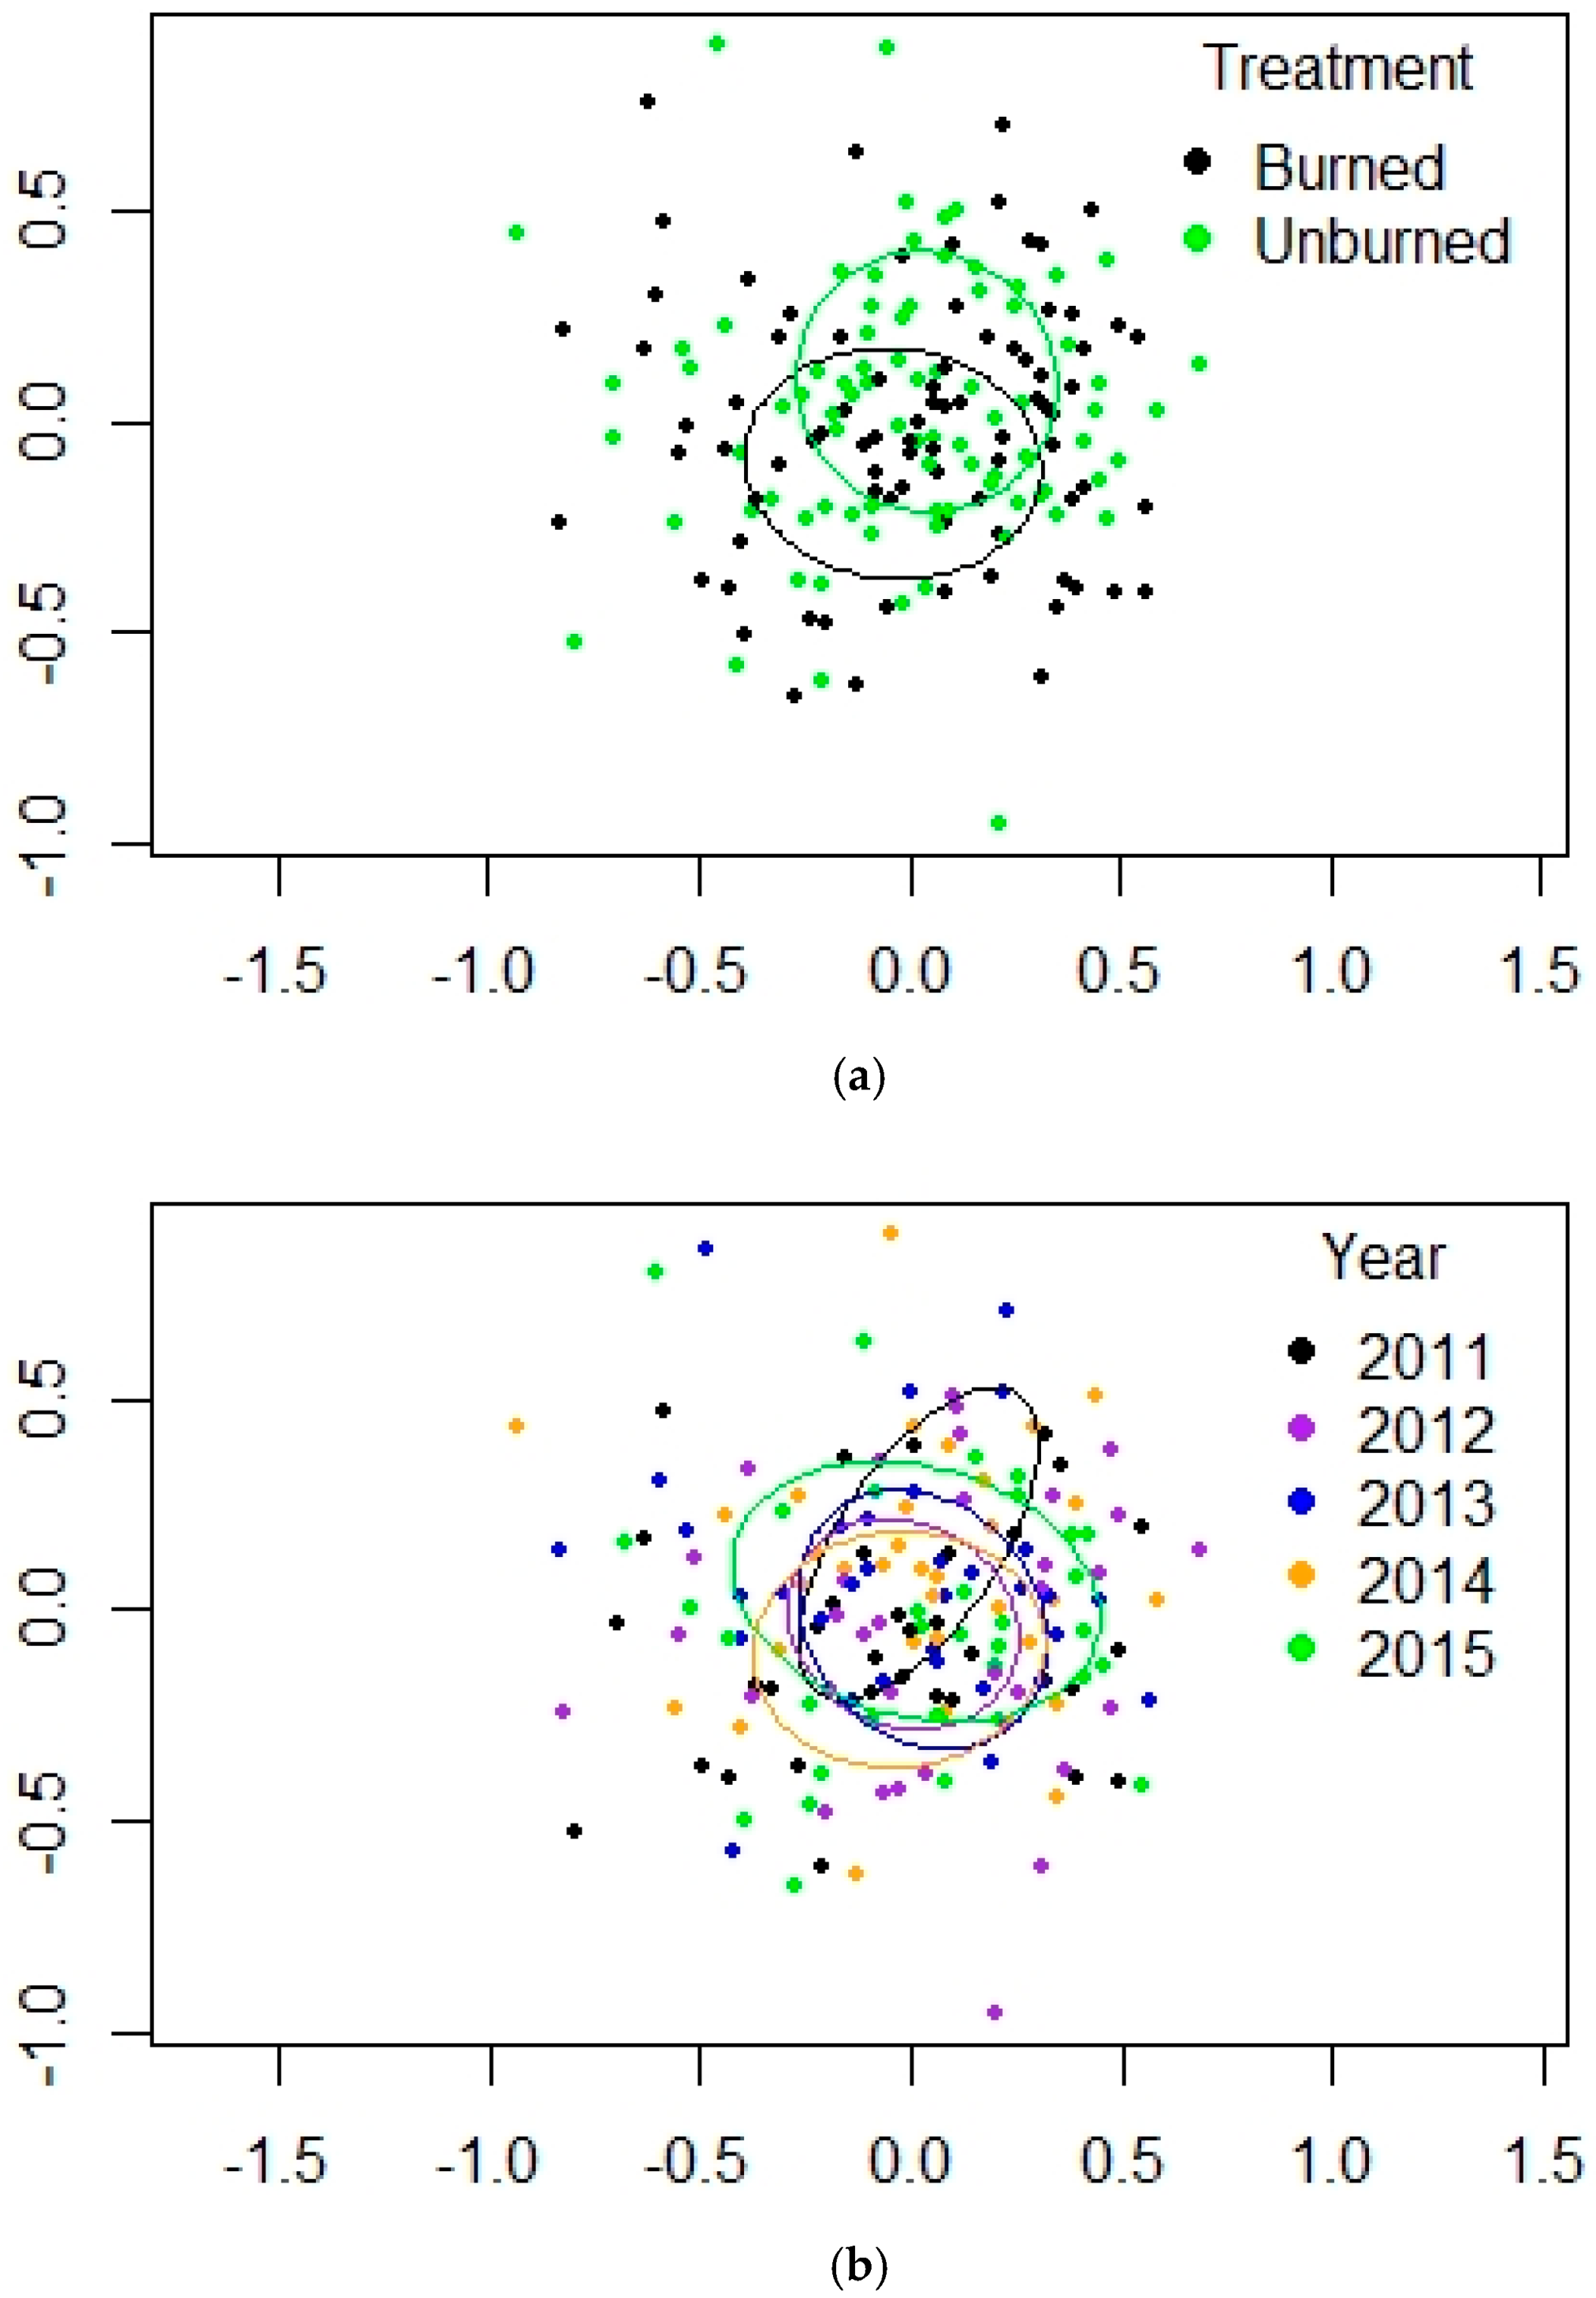
3.3. Mountain Valley Grassland (MV)
4. Discussion
Supplementary Materials
Funding
Acknowledgments
Conflicts of Interest
Appendix A

| 2011 | 2012 | 2013 | 2014 | 2015 | |||||||
|---|---|---|---|---|---|---|---|---|---|---|---|
| Order Family | Genus Species | B | U | B | U | B | U | B | U | B | U |
| Araneae Anyphaenidae | Anyphaena marginalis (Banks) | 0 | 135 | 1 | 50 | 0 | 123 | 0 | 112 | 0 | 133 |
| Clubionidae | Clubiona oteroana Gertsch | 5 | 3 | 0 | 0 | 0 | 0 | 1 | 0 | 2 | 0 |
| Dictynidae | Cicurina sp. | 21 | 7 | 25 | 9 | 34 | 19 | 10 | 14 | 30 | 14 |
| Hackmania saphes (Chamberlin) | 0 | 0 | 0 | 0 | 0 | 6 | 0 | 2 | 0 | 5 | |
| Gnaphosidae | Drassodes neglectus (Keyserling) | 7 | 5 | 8 | 31 | 2 | 15 | 7 | 5 | 1 | 1 |
| Gnaphosa immatures | 17 | 19 | 11 | 49 | 13 | 17 | 5 | 12 | 3 | 23 | |
| Gnaphosa muscorum (L. Koch) | 6 | 65 | 23 | 192 | 20 | 152 | 56 | 103 | 21 | 43 | |
| Gnaphosa parvula Banks | 0 | 0 | 0 | 0 | 1 | 0 | 0 | 0 | 0 | 0 | |
| Haplodrassus immatures | 105 | 26 | 47 | 17 | 10 | 16 | 10 | 5 | 5 | 7 | |
| Haplodrassus bicornis (Emerton) | 0 | 0 | 0 | 0 | 1 | 1 | 0 | 0 | 0 | 0 | |
| Haplodrassus eunis Chamberlin | 0 | 0 | 1 | 16 | 0 | 26 | 3 | 31 | 1 | 24 | |
| Haplodrassus signifier (C.L. Koch) | 11 | 16 | 21 | 23 | 26 | 6 | 12 | 8 | 14 | 7 | |
| Micaria immatures | 0 | 0 | 1 | 1 | 2 | 1 | 2 | 0 | 3 | 0 | |
| Micaria aenea Thorell | 1 | 1 | 1 | 1 | 1 | 1 | 2 | 0 | 0 | 0 | |
| Micaria foxi Gertsch | 0 | 0 | 1 | 0 | 0 | 0 | 0 | 0 | 0 | 0 | |
| Micaria gertschi Barrows & Ivie | 0 | 0 | 0 | 0 | 2 | 0 | 1 | 0 | 0 | 0 | |
| Micaria pulicaria (Sundevall) | 2 | 0 | 0 | 1 | 2 | 0 | 1 | 0 | 1 | 0 | |
| Micaria riggsi Gertsch | 0 | 0 | 5 | 0 | 5 | 0 | 1 | 0 | 2 | 0 | |
| Zelotes immatures | 16 | 7 | 2 | 13 | 1 | 4 | 0 | 5 | 1 | 4 | |
| Zelotes fratris Chamberlin | 17 | 9 | 3 | 10 | 3 | 17 | 0 | 15 | 4 | 9 | |
| Zelotes lasalanus Chamberlin | 0 | 0 | 1 | 2 | 2 | 0 | 2 | 0 | 0 | 0 | |
| Zelotes puritanus Chamberlin | 0 | 0 | 3 | 2 | 0 | 1 | 0 | 1 | 0 | 0 | |
| Hahniidae | Neoantistea gosiuta Gertsch | 13 | 1 | 2 | 4 | 2 | 1 | 1 | 0 | 1 | 0 |
| Linyphiidae | Agyneta immatures | 3 | 3 | 0 | 0 | 0 | 0 | 0 | 0 | 0 | 0 |
| Agyneta simplex (Emerton) | 6 | 0 | 0 | 0 | 0 | 0 | 0 | 0 | 0 | 0 | |
| Agyneta uta (Chamberlin) | 0 | 0 | 6 | 40 | 22 | 9 | 72 | 19 | 35 | 48 | |
| Erigone dentosa O. Pickard- Cambridge | 0 | 0 | 8 | 1 | 148 | 0 | 513 | 3 | 253 | 0 | |
| Grammonota gentilis Banks | 2 | 1 | 9 | 1 | 15 | 1 | 22 | 0 | 67 | 0 | |
| Helophora orinoma (Chamberlin) | 0 | 4 | 0 | 3 | 1 | 1 | 4 | 0 | 0 | 0 | |
| Incestophantes lamprus (Chamberlin) | 0 | 3 | 0 | 1 | 0 | 9 | 0 | 6 | 2 | 5 | |
| Islandiana immatures/undet. females | 0 | 0 | 2 | 0 | 2 | 0 | 0 | 0 | 0 | 0 | |
| Islandiana coconino Ivie | 0 | 0 | 0 | 0 | 0 | 0 | 2 | 0 | 0 | 0 | |
| Islandiana flaveola (Banks) | 35 | 0 | 15 | 4 | 15 | 0 | 7 | 0 | 13 | 0 | |
| Islandiana lasalana (Chamberlin & Ivie) | 0 | 0 | 0 | 0 | 0 | 0 | 0 | 1 | 1 | 0 | |
| Lepthyphantes immatures | 1 | 1 | 0 | 0 | 0 | 0 | 0 | 0 | 0 | 1 | |
| Lepthyphantes intricatus (Emerton) | 0 | 0 | 0 | 0 | 0 | 0 | 1 | 1 | 0 | 0 | |
| Lepthyphantes turbatrix (O. P.-Cambridge) | 0 | 0 | 0 | 3 | 0 | 0 | 0 | 1 | 0 | 3 | |
| Mermessus immatures | 6 | 0 | 7 | 1 | 4 | 3 | 5 | 2 | 2 | 1 | |
| Mermessus major Millidge | 0 | 0 | 0 | 0 | 0 | 0 | 1 | 0 | 0 | 0 | |
| Mermessus taibo (Chamberlin & Ivie) | 6 | 14 | 9 | 4 | 16 | 1 | 3 | 6 | 4 | 6 | |
| Mermessus trilobatus (Emerton) | 0 | 0 | 0 | 0 | 0 | 0 | 0 | 0 | 2 | 0 | |
| Pocadicnemis occidentalis Millidge | 0 | 9 | 1 | 75 | 0 | 31 | 0 | 77 | 0 | 75 | |
| Spirembolus immatures | 1 | 4 | 0 | 0 | 1 | 0 | 1 | 0 | 0 | 0 | |
| Spirembolus pallidus Chamberlin & Ivie | 0 | 4 | 0 | 7 | 0 | 9 | 4 | 31 | 2 | 18 | |
| Spirembolus spirotubus (Banks) | 1 | 0 | 0 | 0 | 1 | 0 | 0 | 0 | 0 | 0 | |
| Tachygyna immatures | 0 | 0 | 0 | 0 | 0 | 0 | 0 | 0 | 0 | 5 | |
| Tachygyna haydeni Chamberlin & Ivie | 0 | 1 | 0 | 1 | 0 | 0 | 1 | 2 | 1 | 0 | |
| Tachygyna tuoba Chamberlin & Ivie | 1 | 4 | 0 | 13 | 0 | 11 | 1 | 33 | 0 | 8 | |
| Walckenaeria immatures | 1 | 0 | 0 | 1 | 0 | 0 | 0 | 0 | 0 | 2 | |
| Walckenaeria communis (Emerton) | 0 | 0 | 0 | 2 | 0 | 0 | 0 | 1 | 0 | 3 | |
| Walckenaeria maesta Millidge | 0 | 0 | 0 | 2 | 0 | 4 | 0 | 0 | 0 | 0 | |
| Walckenaeria spiralis (Emerton) | 0 | 5 | 0 | 4 | 0 | 41 | 0 | 12 | 0 | 28 | |
| Wubana drassoides (Emerton) | 0 | 9 | 0 | 13 | 0 | 8 | 1 | 8 | 0 | 10 | |
| Lycosidae | Alopecosa kochi (Keyserling) | 15 | 46 | 3 | 141 | 0 | 31 | 17 | 55 | 7 | 33 |
| Hogna sp. | 1 | 12 | 0 | 19 | 1 | 7 | 0 | 2 | 0 | 0 | |
| Pardosa immatures | 8 | 6 | 12 | 81 | 7 | 171 | 45 | 23 | 180 | 40 | |
| Pardosa coloradensis Banks | 0 | 0 | 0 | 0 | 10 | 0 | 11 | 0 | 52 | 0 | |
| Pardosa concinna (Thorell) | 0 | 0 | 11 | 1 | 97 | 1 | 137 | 2 | 142 | 0 | |
| Pardosa distincta (Blackwall) | 0 | 0 | 0 | 0 | 36 | 1 | 172 | 1 | 363 | 0 | |
| Pardosa montgomeryi Gertsch | 0 | 11 | 0 | 0 | 1 | 0 | 14 | 0 | 68 | 0 | |
| Pardosa uncata (Thorell) | 20 | 21 | 13 | 112 | 14 | 43 | 4 | 62 | 6 | 115 | |
| Pardosa xerophila Vogel | 0 | 0 | 0 | 0 | 9 | 0 | 31 | 0 | 23 | 1 | |
| Pardosa yavapa Chamberlin | 0 | 11 | 1 | 142 | 1 | 51 | 13 | 84 | 2 | 150 | |
| Philodromidae | Thanatus immatures | 0 | 1 | 1 | 0 | 0 | 0 | 0 | 0 | 1 | 0 |
| Thanatus formicinus (Clerck) | 0 | 0 | 1 | 1 | 0 | 0 | 0 | 0 | 0 | 0 | |
| Thanatus coloradensis Keyserling | 0 | 0 | 1 | 1 | 0 | 0 | 2 | 0 | 1 | 1 | |
| Thanatus vulgaris Simon | 0 | 0 | 0 | 0 | 0 | 0 | 1 | 0 | 0 | 0 | |
| Phrurolithidae | Scotinella pugnata (Emerton) | 8 | 0 | 2 | 0 | 0 | 0 | 0 | 0 | 0 | 0 |
| Thomisidae | Xysticus immatures | 9 | 5 | 5 | 16 | 7 | 13 | 3 | 8 | 1 | 5 |
| Xysticus apachecus Gertsch | 0 | 3 | 0 | 1 | 0 | 1 | 0 | 0 | 0 | 1 | |
| Xysticus cunctator Thorell | 0 | 0 | 0 | 0 | 4 | 0 | 1 | 0 | 0 | 0 | |
| Xysticus emertoni Keyserling | 0 | 0 | 0 | 8 | 0 | 5 | 2 | 6 | 4 | 7 | |
| Xysticus ferox (Hentz) | 0 | 0 | 0 | 0 | 0 | 0 | 3 | 0 | 3 | 0 | |
| Xysticus gulosus Keyserling | 0 | 0 | 0 | 0 | 0 | 0 | 0 | 1 | 1 | 0 | |
| Xysticus locuples Keyserling | 0 | 0 | 0 | 1 | 0 | 0 | 0 | 0 | 0 | 0 | |
| Xysticus luctuosus (Blackwall) | 0 | 0 | 0 | 0 | 0 | 0 | 1 | 0 | 0 | 0 | |
| Xysticus montanensis Keyserling | 1 | 0 | 1 | 3 | 0 | 8 | 3 | 1 | 0 | 2 | |
| Opiliones Sclerosomatidae | Leiobunum sp. | 2 | 0 | 1 | 15 | 6 | 92 | 2 | 0 | 6 | 38 |
| Togwoteeus biceps (Thorell) | 4 | 62 | 55 | 9 | 28 | 93 | 47 | 7 | 45 | 158 | |
| Acari Mesostigmata | 1 | 0 | 3 | 34 | 64 | 1 | 25 | 1 | 468 | 156 | |
| Oribatida | 2 | 1 | 1 | 15 | 1 | 6 | 0 | 15 | 0 | 9 | |
| Trombidiformes | Undetermined | 0 | 4 | 4 | 0 | 0 | 6 | 3 | 27 | 3 | 8 |
| Anystidae | 0 | 6 | 0 | 34 | 2 | 4 | 0 | 16 | 1 | 9 | |
| Erythraeidae | 27 | 28 | 182 | 20 | 183 | 43 | 96 | 8 | 326 | 2 |
| 2011 | 2012 | 2013 | 2014 | 2015 | |||||||
|---|---|---|---|---|---|---|---|---|---|---|---|
| Order Family | Genus Species | B | U | B | U | B | U | B | U | B | U |
| Araneae Amaurobiidae | Callobius arizonicus (Chamberlin & Ivie) | 0 | 5 | 1 | 12 | 0 | 5 | 0 | 3 | 0 | 1 |
| Dictynidae | Cicurina sp. | 22 | 58 | 53 | 55 | 65 | 39 | 211 | 36 | 99 | 57 |
| Gnaphosidae | Drassodes neglectus (Keyserling) | 9 | 5 | 19 | 14 | 18 | 7 | 4 | 7 | 8 | 1 |
| Gnaphosa immatures | 17 | 7 | 21 | 13 | 66 | 24 | 9 | 8 | 72 | 10 | |
| Gnaphosa muscorum (L. Koch) | 3 | 8 | 71 | 73 | 40 | 56 | 137 | 71 | 57 | 45 | |
| Gnaphosa parvula Banks | 0 | 1 | 2 | 0 | 0 | 0 | 2 | 0 | 2 | 0 | |
| Haplodrassus immatures | 64 | 8 | 13 | 22 | 11 | 21 | 9 | 25 | 11 | 13 | |
| Haplodrasus bicornis (Emerton) | 0 | 0 | 0 | 0 | 1 | 0 | 0 | 0 | 0 | 0 | |
| Haplodrassus eunis Chamberlin | 0 | 0 | 9 | 15 | 8 | 6 | 27 | 12 | 8 | 14 | |
| Haplodrassus signifier (C.L. Koch) | 29 | 7 | 25 | 20 | 11 | 9 | 41 | 21 | 23 | 12 | |
| Micaria immatures | 0 | 0 | 2 | 2 | 6 | 2 | 2 | 1 | 1 | 0 | |
| Micaria aenea Thorell | 0 | 0 | 0 | 10 | 0 | 5 | 0 | 0 | 0 | 0 | |
| Micaria gertschi Barrows & Ivie | 0 | 0 | 0 | 3 | 6 | 7 | 1 | 0 | 1 | 1 | |
| Micaria pulicaria (Sundevall) | 0 | 1 | 1 | 5 | 1 | 0 | 1 | 0 | 1 | 1 | |
| Micaria riggsi Gertsch | 0 | 0 | 0 | 0 | 4 | 0 | 3 | 0 | 4 | 0 | |
| Micaria rossica Thorell | 0 | 0 | 1 | 0 | 8 | 0 | 32 | 0 | 44 | 1 | |
| Orodrassus coloradensis (Emerton) | 0 | 0 | 1 | 4 | 0 | 4 | 0 | 1 | 0 | 0 | |
| Zelotes immatures | 8 | 5 | 5 | 7 | 0 | 12 | 3 | 5 | 1 | 3 | |
| Zelotes fratris Chamberlin | 7 | 4 | 1 | 10 | 0 | 4 | 7 | 3 | 5 | 3 | |
| Zelotes puritanus Chamberlin | 1 | 0 | 5 | 0 | 11 | 0 | 5 | 1 | 4 | 0 | |
| Hahniidae | Neoantistea gosiuta Gertsch | 4 | 1 | 0 | 2 | 1 | 4 | 1 | 0 | 2 | 1 |
| Linyphiidae | Agyneta immatures/undet. females | 0 | 0 | 2 | 4 | 8 | 6 | 4 | 1 | 0 | 2 |
| Agyneta danielbelangeri Duperre | 0 | 0 | 0 | 0 | 0 | 0 | 0 | 0 | 1 | 13 | |
| Agyneta uta (Chamberlin) | 0 | 0 | 0 | 2 | 3 | 1 | 52 | 7 | 7 | 35 | |
| Ceratinella brunnea Emerton | 2 | 1 | 0 | 3 | 0 | 2 | 0 | 1 | 0 | 2 | |
| Ceratinella ornatula (Crosby & Bishop) | 0 | 0 | 0 | 0 | 0 | 8 | 0 | 5 | 3 | 0 | |
| Erigone dentosa O. Pickard-Cambridge | 1 | 5 | 3 | 10 | 43 | 0 | 403 | 1 | 324 | 25 | |
| Grammonota gentilis Banks | 0 | 1 | 0 | 1 | 4 | 0 | 1 | 0 | 24 | 1 | |
| Helophora orinoma (Chamberlin) | 0 | 18 | 0 | 34 | 1 | 28 | 2 | 39 | 3 | 70 | |
| Incestophantes lamprus (Chamberlin) | 0 | 0 | 0 | 2 | 3 | 2 | 0 | 0 | 0 | 3 | |
| Islandiana coconino Ivie | 0 | 0 | 0 | 0 | 3 | 0 | 0 | 0 | 1 | 0 | |
| Islandiana flaveola (Banks) | 0 | 0 | 0 | 0 | 2 | 1 | 0 | 1 | 0 | 6 | |
| Lepthyphantes immatures | 3 | 1 | 0 | 3 | 1 | 1 | 0 | 0 | 0 | 1 | |
| Lepthyphantes intricatus (Emerton) | 0 | 1 | 1 | 1 | 2 | 0 | 5 | 0 | 0 | 0 | |
| Lepthyphantes turbatrix (O. Pickard-Cambridge) | 0 | 0 | 0 | 1 | 3 | 0 | 4 | 2 | 5 | 1 | |
| Mermessus immatures/undet. females | 17 | 6 | 4 | 0 | 3 | 0 | 6 | 0 | 3 | 0 | |
| Mermessus taibo (Chamberlin & Ivie) | 1 | 0 | 11 | 4 | 18 | 1 | 10 | 0 | 14 | 0 | |
| Mermessus trilobatus (Emerton) | 0 | 0 | 9 | 0 | 0 | 0 | 0 | 0 | 3 | 0 | |
| Pocadicnemis occidentalis Millidge | 0 | 2 | 1 | 3 | 0 | 3 | 0 | 2 | 0 | 0 | |
| Scotinotylus undet. females | 0 | 1 | 1 | 3 | 0 | 0 | 3 | 0 | 0 | 2 | |
| Scotinotylus pallidus (Emerton) | 0 | 0 | 0 | 1 | 0 | 0 | 0 | 0 | 0 | 4 | |
| Scotinotylus pollucis Millidge | 1 | 0 | 0 | 0 | 0 | 1 | 0 | 4 | 0 | 0 | |
| Scotinotylus sanctus (Crosby) | 5 | 1 | 0 | 0 | 0 | 0 | 0 | 0 | 0 | 0 | |
| Sisicottus immatures/undet. females | 0 | 0 | 0 | 1 | 0 | 0 | 0 | 0 | 0 | 2 | |
| Sisicottus montanus (Emerton) | 0 | 5 | 0 | 29 | 0 | 12 | 0 | 8 | 0 | 0 | |
| Sisicottus orites (Chamberlin) | 0 | 1 | 0 | 1 | 0 | 0 | 1 | 53 | 0 | 43 | |
| Spirembolus immatures/undet. females | 0 | 2 | 0 | 1 | 0 | 0 | 0 | 0 | 0 | 0 | |
| Spirembolus pallidus Chamberlin & Ivie | 0 | 0 | 0 | 1 | 1 | 0 | 0 | 6 | 0 | 1 | |
| Spirembolus spirotubus (Banks) | 0 | 0 | 0 | 1 | 0 | 0 | 0 | 0 | 0 | 0 | |
| Tachygyna immatures/undet. females | 0 | 0 | 0 | 0 | 0 | 1 | 1 | 5 | 0 | 4 | |
| Tachygyna haydeni Chamberlin & Ivie | 0 | 1 | 0 | 7 | 0 | 4 | 0 | 10 | 0 | 30 | |
| Tachygyna tuoba Chamberlin & Ivie | 0 | 1 | 0 | 2 | 0 | 20 | 0 | 30 | 0 | 6 | |
| Tapinocyba sp. | 0 | 0 | 0 | 0 | 1 | 6 | 0 | 4 | 2 | 23 | |
| Tapinocyba cf. cameroni Duperre & Paquin | 0 | 0 | 0 | 0 | 0 | 0 | 0 | 0 | 0 | 1 | |
| Tapinocyba minuta (Emerton) | 0 | 0 | 0 | 1 | 0 | 0 | 0 | 0 | 0 | 0 | |
| Walckenaeria communis (Emerton) | 2 | 1 | 0 | 2 | 0 | 0 | 0 | 2 | 0 | 3 | |
| Wubana drassoides (Emerton) | 0 | 26 | 0 | 8 | 0 | 8 | 0 | 12 | 0 | 17 | |
| Lycosidae | Alopecosa kochi (Keyserling) | 4 | 0 | 2 | 27 | 9 | 7 | 12 | 8 | 12 | 10 |
| Hogna sp. | 0 | 4 | 0 | 0 | 0 | 3 | 2 | 0 | 3 | 4 | |
| Pardosa immatures | 10 | 15 | 4 | 55 | 15 | 113 | 18 | 23 | 94 | 24 | |
| Pardosa coloradensis Banks | 0 | 0 | 1 | 0 | 0 | 0 | 8 | 0 | 94 | 1 | |
| Pardosa concinna (Thorell) | 0 | 0 | 9 | 0 | 22 | 0 | 196 | 1 | 476 | 1 | |
| Pardosa distincta (Blackwall) | 0 | 1 | 0 | 3 | 5 | 1 | 36 | 1 | 163 | 6 | |
| Pardosa montgomeryi Gertsch | 0 | 0 | 0 | 3 | 5 | 0 | 13 | 0 | 49 | 0 | |
| Pardosa uncata (Thorell) | 26 | 43 | 42 | 280 | 69 | 111 | 199 | 120 | 123 | 97 | |
| Pardosa xerophila Vogel | 0 | 0 | 0 | 0 | 0 | 0 | 10 | 1 | 0 | 2 | |
| Pardosa yavapa Chamberlin | 0 | 0 | 0 | 0 | 0 | 0 | 11 | 0 | 5 | 1 | |
| Trochosa terricola Thorell | 0 | 0 | 0 | 5 | 0 | 1 | 0 | 1 | 0 | 3 | |
| Phrurolithidae | Phrurolithus camawhitae Gertsch | 1 | 0 | 17 | 2 | 0 | 0 | 0 | 0 | 0 | 0 |
| Phrurolithus connectus Gertsch | 1 | 0 | 0 | 0 | 0 | 0 | 0 | 0 | 0 | 0 | |
| Phrurolithus schwarzi Gertsch | 1 | 0 | 0 | 0 | 0 | 0 | 0 | 0 | 0 | 0 | |
| Salticidae | Pelegrina flavipes (Peckham & Peckham) | 0 | 0 | 0 | 0 | 0 | 10 | 0 | 1 | 0 | 0 |
| Theridiidae | Steatoda immatues | 0 | 0 | 0 | 4 | 0 | 1 | 2 | 4 | 0 | 0 |
| Steatoda albomaculata (DeGeer) | 0 | 0 | 0 | 0 | 1 | 0 | 0 | 0 | 0 | 0 | |
| Steatoda hespera Chamberlin & Ivie | 0 | 0 | 0 | 8 | 0 | 0 | 0 | 0 | 0 | 3 | |
| Thomisidae | Xysticus immatures | 4 | 4 | 5 | 3 | 11 | 8 | 6 | 3 | 6 | 0 |
| Xysticus cunctator Thorell | 0 | 0 | 1 | 0 | 1 | 0 | 1 | 0 | 9 | 0 | |
| Xysticus emertoni Keyserling | 0 | 0 | 0 | 0 | 0 | 1 | 1 | 0 | 8 | 0 | |
| Xysticus ferox (Hentz) | 0 | 0 | 0 | 0 | 0 | 1 | 0 | 0 | 0 | 0 | |
| Xysticus locuples Keyserling | 0 | 1 | 0 | 0 | 0 | 0 | 0 | 0 | 0 | 0 | |
| Xysticus luctuosus Keyserling | 0 | 0 | 0 | 0 | 0 | 0 | 0 | 0 | 0 | 1 | |
| Xysticus montanensis Keyserling | 0 | 2 | 0 | 1 | 1 | 4 | 0 | 0 | 0 | 1 | |
| Xysticus triguttatus Keyserling | 0 | 0 | 0 | 0 | 0 | 0 | 1 | 0 | 0 | 0 | |
| Opiliones Paronychidae | Sclerobunus robustus (Packard) | 5 | 0 | 2 | 5 | 1 | 2 | 1 | 4 | 0 | 0 |
| Sclerosomatidae | Leiobunum sp. | 0 | 0 | 23 | 1716 | 46 | 1259 | 30 | 139 | 51 | 673 |
| Togwoteeus biceps (Thorell) | 2 | 0 | 83 | 978 | 113 | 721 | 237 | 430 | 296 | 1102 | |
| Acari Mesostigmata | 0 | 0 | 0 | 16 | 16 | 1 | 18 | 8 | 440 | 16 | |
| Oribatida | 0 | 0 | 0 | 81 | 0 | 195 | 0 | 302 | 4 | 76 | |
| Trombidiformes | Undetermined | 0 | 0 | 0 | 14 | 1 | 1 | 0 | 14 | 0 | 0 |
| Anystidae | 0 | 0 | 0 | 10 | 1 | 10 | 0 | 32 | 0 | 6 | |
| Bdellidae | 0 | 0 | 0 | 6 | 0 | 6 | 0 | 7 | 0 | 3 | |
| Erythraeidae | 0 | 0 | 77 | 120 | 181 | 75 | 108 | 57 | 2 | 42 |
| 2011 | 2012 | 2013 | 2014 | 2015 | |||||||
|---|---|---|---|---|---|---|---|---|---|---|---|
| Order Family | Genus Species | B | U | B | U | B | U | B | U | B | U |
| Araneae Clubionidae | Clubiona oteroana Gertsch | 32 | 13 | 12 | 14 | 2 | 6 | 7 | 9 | 19 | 26 |
| Dictynidae | Cicurina sp. | 1 | 6 | 0 | 2 | 2 | 6 | 0 | 3 | 0 | 4 |
| Gnaphosidae | Gnaphosa immatures | 0 | 13 | 2 | 16 | 1 | 34 | 0 | 78 | 2 | 34 |
| Gnaphosa borea Kulczynski | 0 | 0 | 0 | 0 | 0 | 1 | 0 | 0 | 0 | 0 | |
| Gnaphosa muscorum (L. Koch) | 2 | 0 | 5 | 3 | 5 | 0 | 5 | 1 | 5 | 0 | |
| Gnaphosa parvula Banks | 4 | 50 | 0 | 31 | 0 | 44 | 0 | 178 | 1 | 59 | |
| Haplodrassus signifier (C.L. Koch) | 327 | 116 | 239 | 209 | 177 | 170 | 170 | 210 | 103 | 88 | |
| Micaria immatures | 12 | 3 | 0 | 2 | 10 | 3 | 4 | 0 | 1 | 0 | |
| Micaria aenea Thorell | 0 | 0 | 0 | 0 | 5 | 1 | 0 | 0 | 0 | 0 | |
| Micaria gertschi Barrows & Ivie | 10 | 1 | 0 | 0 | 0 | 0 | 0 | 0 | 1 | 1 | |
| Micaria riggsi Gertsch | 0 | 0 | 3 | 0 | 0 | 2 | 2 | 0 | 1 | 0 | |
| Micaria rossica Thorell | 1 | 0 | 26 | 3 | 93 | 11 | 79 | 4 | 41 | 0 | |
| Zelotes immatures | 6 | 2 | 11 | 0 | 3 | 2 | 2 | 6 | 0 | 2 | |
| Zelotes fratris Chamberlin | 0 | 0 | 0 | 0 | 0 | 0 | 0 | 0 | 2 | 0 | |
| Zelotes lasalanus Chamberlin | 3 | 1 | 3 | 15 | 4 | 18 | 3 | 23 | 7 | 8 | |
| Hahniidae | Neoantistea gosiuta Gertsch | 16 | 19 | 6 | 15 | 7 | 18 | 4 | 48 | 7 | 19 |
| Linyphiidae | Agyneta immatures | 31 | 15 | 8 | 12 | 22 | 15 | 24 | 12 | 13 | 14 |
| Agyneta hedini Paquin & Duperre | 0 | 0 | 0 | 0 | 0 | 0 | 0 | 0 | 1 | 0 | |
| Agyneta simplex (Emerson) | 15 | 1 | 0 | 0 | 0 | 0 | 0 | 0 | 0 | 0 | |
| Agyneta uta (Chamberlin) | 0 | 0 | 9 | 18 | 11 | 14 | 59 | 36 | 34 | 16 | |
| Ceratinella brunnea Emerton | 6 | 2 | 1 | 2 | 10 | 12 | 4 | 6 | 3 | 1 | |
| Erigone dentosa O. Pickard-Cambridge | 6 | 2 | 1 | 15 | 4 | 20 | 88 | 23 | 212 | 110 | |
| Grammonota gentilis Banks | 40 | 130 | 95 | 189 | 26 | 116 | 18 | 169 | 63 | 273 | |
| Islandiana immatures | 0 | 0 | 0 | 0 | 6 | 7 | 8 | 20 | 9 | 30 | |
| Islandiana coconino Ivie | 18 | 1 | 8 | 0 | 27 | 4 | 17 | 1 | 33 | 3 | |
| Islandiana flaveola (Banks) | 14 | 14 | 18 | 18 | 28 | 32 | 37 | 43 | 15 | 12 | |
| Mermessus immatures/undet. females | 0 | 2 | 0 | 5 | 1 | 0 | 2 | 6 | 0 | 2 | |
| Mermessus major (Millidge) | 0 | 1 | 0 | 0 | 0 | 0 | 0 | 0 | 0 | 1 | |
| Mermessus taibo (Chamberlin & Ivie) | 0 | 1 | 0 | 0 | 0 | 1 | 3 | 2 | 1 | 0 | |
| Mermessus trilobatus (Emerton) | 7 | 11 | 3 | 0 | 1 | 2 | 0 | 4 | 7 | 7 | |
| Spirembolus pallidus Chamberlin & Ivie | 0 | 0 | 0 | 0 | 0 | 0 | 2 | 3 | 0 | 1 | |
| Spirembolus spirotubus (Banks) | 0 | 0 | 3 | 3 | 5 | 12 | 0 | 0 | 0 | 0 | |
| Tachygyna haydeni Chamberlin & Ivie | 0 | 0 | 8 | 0 | 34 | 5 | 0 | 0 | 0 | 0 | |
| Tachygyna tuoba Chamberlin & Ivie | 0 | 0 | 1 | 3 | 0 | 0 | 0 | 0 | 0 | 0 | |
| Tapinocyba sp. | 0 | 0 | 0 | 0 | 0 | 0 | 30 | 0 | 0 | 0 | |
| Tapinocyba dietrichi Crosby & Bishop | 0 | 0 | 0 | 0 | 0 | 8 | 0 | 6 | 0 | 1 | |
| Walckenaeria immatures | 0 | 2 | 0 | 2 | 0 | 5 | 0 | 15 | 1 | 4 | |
| Walckenaeria communis (Emerton) | 0 | 0 | 0 | 1 | 0 | 4 | 0 | 5 | 0 | 0 | |
| Walckenaeria dondalei Millidge | 0 | 0 | 0 | 0 | 0 | 1 | 0 | 2 | 0 | 1 | |
| Walckenaeria spiralis (Emerton) | 0 | 1 | 0 | 0 | 0 | 0 | 0 | 0 | 0 | 0 | |
| Lycosidae | Alopecosa kochi (Keyserling) | 6 | 1 | 6 | 1 | 5 | 5 | 10 | 2 | 11 | 6 |
| Hogna sp. | 0 | 0 | 1 | 14 | 4 | 4 | 8 | 10 | 7 | 8 | |
| Pardosa immatures | 97 | 58 | 36 | 78 | 64 | 100 | 108 | 129 | 67 | 62 | |
| Pardosa coloradensis Banks | 0 | 0 | 0 | 6 | 9 | 37 | 10 | 9 | 4 | 14 | |
| Pardosa concinna (Thorell) | 100 | 190 | 392 | 595 | 218 | 214 | 449 | 368 | 416 | 367 | |
| Pardosa distincta (Blackwall) | 327 | 568 | 483 | 1002 | 439 | 798 | 893 | 1408 | 777 | 1340 | |
| Pardosa montgomeryi Gertsch | 32 | 15 | 39 | 8 | 102 | 5 | 166 | 12 | 170 | 36 | |
| Pardosa xerophila Vogel | 16 | 8 | 0 | 0 | 0 | 2 | 15 | 1 | 38 | 0 | |
| Schizocosa mccooki (Montgomery) | 1 | 3 | 0 | 0 | 4 | 3 | 0 | 0 | 0 | 0 | |
| Philodromidae | Ebo immatures | 0 | 1 | 1 | 11 | 1 | 6 | 0 | 0 | 4 | 13 |
| Ebo pepinensis Gertsch | 3 | 1 | 0 | 0 | 0 | 4 | 0 | 0 | 1 | 11 | |
| Ebo punctatus Sauer & Platnick | 0 | 0 | 0 | 0 | 0 | 0 | 5 | 12 | 0 | 0 | |
| Thanatus immatures | 79 | 22 | 21 | 27 | 28 | 37 | 16 | 29 | 18 | 9 | |
| Thanatus coloradensis Keyserling | 48 | 14 | 33 | 42 | 89 | 75 | 63 | 31 | 27 | 18 | |
| Thanatus formicinus (Clerck) | 0 | 0 | 1 | 0 | 0 | 1 | 0 | 0 | 0 | 0 | |
| Thanatus vulgaris Simon | 0 | 0 | 0 | 11 | 0 | 44 | 0 | 3 | 2 | 4 | |
| Salticidae | Pellenes sp. | 3 | 4 | 0 | 1 | 1 | 4 | 0 | 0 | 1 | 1 |
| Phidippus olympus Edwards | 6 | 0 | 6 | 4 | 3 | 2 | 0 | 0 | 1 | 0 | |
| Theridiidae | Euryopis immatures | 1 | 1 | 0 | 0 | 0 | 0 | 0 | 0 | 0 | 0 |
| Euryopis saukea Levi | 1 | 2 | 0 | 0 | 0 | 8 | 0 | 0 | 0 | 3 | |
| Euryopis scriptipes Banks | 0 | 0 | 0 | 0 | 0 | 1 | 0 | 0 | 0 | 0 | |
| Thomisidae | Xysticus immatures | 36 | 58 | 61 | 40 | 59 | 80 | 50 | 49 | 60 | 49 |
| Xysticus apachecus Gertsch | 1 | 0 | 2 | 0 | 0 | 0 | 0 | 0 | 0 | 0 | |
| Xysticus cunctator Thorell | 0 | 0 | 1 | 0 | 2 | 0 | 1 | 1 | 0 | 0 | |
| Xysticus ellipticus Turnbull, Dondale & Redner | 0 | 0 | 0 | 1 | 0 | 1 | 0 | 0 | 0 | 0 | |
| Xysticus emertoni Keyserling | 0 | 0 | 1 | 0 | 2 | 5 | 0 | 0 | 0 | 1 | |
| Xysticus ferox (Hentz) | 6 | 8 | 57 | 61 | 16 | 24 | 26 | 90 | 8 | 49 | |
| Xysticus montanensis Keyserling | 3 | 13 | 7 | 31 | 1 | 24 | 1 | 60 | 3 | 38 | |
| Xysticus paiutus Gertsch | 0 | 7 | 9 | 14 | 15 | 1 | 27 | 13 | 26 | 9 | |
| Xysticus triguttatus Keyserling | 102 | 12 | 67 | 57 | 70 | 32 | 124 | 43 | 33 | 13 | |
| Opiliones Sclerosomatidae | Leiobunum sp. | 0 | 0 | 0 | 14 | 0 | 27 | 0 | 5 | 0 | 0 |
| Togwoteeus biceps (Thorell) | 0 | 1 | 0 | 22 | 0 | 3 | 1 | 2 | 1 | 2 | |
| Acari Mesostigmata | 5 | 2 | 3 | 17 | 28 | 176 | 91 | 227 | 482 | 356 | |
| Oribatida | 1 | 0 | 1 | 0 | 2 | 5 | 1 | 3 | 0 | 0 | |
| Trombidiformes Anystidae | 32 | 10 | 0 | 2 | 10 | 15 | 1 | 0 | 17 | 9 | |
| Erythraeidae | 2170 | 1698 | 1269 | 382 | 2730 | 678 | 732 | 536 | 798 | 401 |
References
- Southwest Fire Consortium. Las Conchas Fact Sheet. Available online: https://www.swfireconsortium.org/wp-content/uploads/2012/11/Las-Conchas-Factsheet_bsw.pdf (accessed on 11 August 2020).
- Dennison, P.E.; Brewer, S.C.; Arnold, J.D.; Moritz, M.A. Large wildfire trends in the western United States, 1984–2011. Geophys. Res. Lett. 2014, 41, 2928–2933. [Google Scholar] [CrossRef]
- Rother, M.T.; Veblen, T.T. Limited conifer regeneration following wildfires in dry ponderosa pine forests of the Colorado Front Range. Ecosphere 2016, 7, e01594. [Google Scholar] [CrossRef]
- Westerling, A.L.R. Increasing western US forest wildfire activity: Sensitivity to changes in the timing of spring. Philos. Trans. R. Soc. B Biol. Sci. 2016, 371. [Google Scholar] [CrossRef] [PubMed]
- National Forests Website for CFLRP. Available online: www.nationalforests.org/collaboration-research/learning-tools/ (accessed on 1 March 2020).
- Higgins, J.W.; Cobb, N.S.; Sommer, S.; Delph, R.J.; Brantley, S.L. Ground-dwelling arthropod responses to succession in a pinyon-juniper woodland. Ecosphere 2014, 5, 5. [Google Scholar] [CrossRef] [Green Version]
- Brantley, S.L.; Chapman, C.A.; Cobb, N.S. Influence of Habitat and Region on Spider Communities Along Two Elevation Gradients in the Southwestern USA. In Proceedings of the 12th Biennial Conference on Research on the Colorado River Plateau, Flagstaff, AZ, USA, 16–19 September 2013; Ralston, B.E., Ed.; Scientific Investigations Report; U.S. Geological Survey: Reston, VA, USA, 2016; pp. 59–72. [Google Scholar] [CrossRef]
- Symbiota Collections of Arthropods Network (SCAN). Available online: http://scan-bugs.org/portal/ (accessed on 11 May 2020).
- Wise, D.H. Spiders in Ecological Webs; Cambridge University Press: Cambridge, UK, 1993. [Google Scholar] [CrossRef]
- Ubick, D.; Paquin, P.; Cushing, P.E.; Roth, V. Spiders of North America: An Identification Manual; American Arachnological Society: Keene, NH, USA, 2017. [Google Scholar]
- Uetz, G.W. Habitat Structure and Spider Foraging. In Habitat Structure: The Physical Arrangement of Objects in Space; Bell, S.S., McCoy, E.D., Mushinsky, H.R., Eds.; Chapman and Hall: London, UK, 1991; pp. 325–348. [Google Scholar] [CrossRef]
- Niwa, C.G.; Peck, R.W. Influence of prescribed fire on carabid beetle (Carabidae) and spider (Araneae) assemblages in forest litter in southwestern Oregon. Environ. Entomol. 2002, 31, 785–796. [Google Scholar] [CrossRef]
- Gillette, N.E.; Vetter, R.S.; Mori, S.R.; Rudolph, C.R.; Welty, D.R. Response of ground-dwelling spider assemblages to prescribed fire following stand structure manipulation in the southern Cascade Range. Can. J. For. Res. 2008, 38, 969–980. [Google Scholar] [CrossRef]
- Malmstrom, A.; Persson, T.; Ahlstrom, K.; Gongalsky, K.B.; Bengtsson, J. Dynamics of soil meso- and macrofauna during a 5-year period after clear-cut burning in a boreal forest. Appl. Soil Ecol. 2009, 43, 61–74. [Google Scholar] [CrossRef]
- Koponen, S. Early succession of a boreal spider community after forest fire. J. Arachnol. 2005, 33, 230–235. [Google Scholar] [CrossRef]
- Larrivee, M.; Fahrig, L.; Drapeau, P. Effects of a recent wildfire and clearcuts on ground-dwelling boreal forest spider assemblages. Can. J. For. Res. 2005, 35, 2575–2588. [Google Scholar] [CrossRef]
- Samu, F.; Kadarl, F.; Onodi, G.; Kertesz, M.; Sziranyi, A.; Szita, E.; Fetyko, K.; Neidert, D.; Botos, E.; Altbacker, V. Differential ecological responses of two generalist arthropod groups, spiders and carabid beetles (Araneae, Carabidae), to the effects of wildfire. Community Ecol. 2010, 11, 129–139. [Google Scholar] [CrossRef] [Green Version]
- Smith DiCarlo, L.A.; de Bano, S.J.; Burrows, S. Short-term response of two beneficial invertebrate groups to wildfire in an arid grassland system, United States. Rangel. Ecol. Manag. 2019, 72, 551–560. [Google Scholar] [CrossRef]
- Allen, C.D.; Savage, M.; Falk, D.A.; Suckling, K.F.; Swetnam, T.W.; Schulke, T.; Stacey, P.B.; Morgan, P.; Hoffman, M.; Klingel, J.T. Ecological restoration of southwestern ponderosa pine ecosystems: A broad perspective. Ecol. Appl. 2002, 12, 1418–1433. [Google Scholar] [CrossRef]
- Williams, A.P.; Allen, C.D.; Millar, C.I.; Swetnam, T.W.; Michaelsen, J.; Still, C.J.; Leavitt, S.W. Forest responses to increasing aridity and warmth in the southwestern United States. Proc. Natl. Acad. Sci. USA 2010, 107, 21289–21294. [Google Scholar] [CrossRef] [PubMed] [Green Version]
- Goff, F. Valles Caldera: A Geologic History; University of New Mexico Press: Albuquerque, NM, USA, 2009. [Google Scholar]
- Suazo, M.M.; Collins, S.L.; Parmenter, R.R.; Muldavin, E. Montane valley grasslands are highly resistant to summer wildfire. J. Veg. Sci. 2018, 29, 1017–1028. [Google Scholar] [CrossRef]
- Western Regional Climate Center (WRCC). Available online: https://wrcc.dri.edu (accessed on 11 May 2020).
- National Centers for Environmental Information (Formerly the National Climatic Data Center). Palmer Drought Severity Index. Available online: https://ncdc.noaa.gov/temp-and-precip/drought/historical-palmers/ (accessed on 29 September 2020).
- Topping, C.J.; Sunderland, K.D. Limitations to the use of pitfall traps in ecological studies exemplified by a study of spiders in a field of winter wheat. J. Appl. Ecol. 1992, 29, 485–491. [Google Scholar] [CrossRef]
- Norris, K.C. Quantifying change through time in spider assemblages: Sampling methods, indices and sources of error. J. Insect Conserv. 1999, 3, 309–325. [Google Scholar]
- Krantz, G.W.; Walter, D.E. A Manual of Acarology; Texas Tech University Press: Lubbock, TX, USA, 2009. [Google Scholar]
- Anderson, M.J.; Gorley, R.N.; Clarke, K.R. PERMANOVA for PRIMER: Guide to Software and Statistical Methods; PRIMER-E. Ltd.: Plymouth, UK, 2008. [Google Scholar]
- R Core Team. R: A Language and Environment for Statistical Computing; R Foundation for Statistical Computing: Vienna, Austria, 2017. [Google Scholar]
- Bergeron, J.A.C.; Spence, J.R.; Volney, W.J.A.; Pinzon, J.; Hartley, D.J. Effect of habitat type and pitfall trap installation on captures of epigaeic arthropod assemblages in the boreal forest. Can. Entomol. 2013, 145, 547–565. [Google Scholar] [CrossRef]
- Lowrie, D.C. The microhabitats of western wolf spiders of the genus Pardosa. Entomol. News 1973, 84, 103–116. [Google Scholar]
- Guiterman, C.H.; Margolis, E.Q.; Allen, C.D.; Falk, D.A.; Swetnam, T.W. Long-term persistence and fire resilience of oak shrubfields in dry conifer forests of northern New Mexico. Ecosystems 2018, 21, 943–959. [Google Scholar] [CrossRef]
- Abbott, I.; Burbridge, T.; Strehlow, K.; Mellican, A.; Wills, A. Logging and burning impacts on cockroaches, crickets and grasshoppers, and spiders in Jarrah forest, Western Australia. For. Ecol. Manag. 2003, 174, 383–399. [Google Scholar] [CrossRef]
- Platnick, N.I.; Shadab, M.U. A revision of the American spiders of the genus Micaria (Araneae, Gnaphosidae). Am. Mus. Novit. 1988, 2916, 1–64. [Google Scholar]
- Knudsen, J. Effects of Wildland Fire on ant Community Structure and Colonization of the Valles Caldera National Preserve, New Mexico, USA. Master’s Thesis, Texas Tech University, Lubbock, TX, USA, 2018. [Google Scholar]
- Buddle, C.M.; Spence, J.R.; Langor, D.W. Succession of boreal forest spider assemblages following wildfire and harvesting. Ecography 2000, 23, 424–436. [Google Scholar] [CrossRef]
- Langlands, P.R.; Brennan, K.E.C.; Ward, B. Is the reassembly of an arid spider assemblage following fire deterministic? Austral Ecol. 2012, 37, 429–439. [Google Scholar] [CrossRef]
- Sauer, R.J.; Platnick, N.I. The crab spider genus Ebo (Araneida: Thomisidae) in the United States and Canada. Can. Entomol. 1972, 104, 35–60. [Google Scholar] [CrossRef]
- Ziesche, T.M.; Roth, M. Influence of environmental parameters on small-scale distribution of soil-dwelling spiders in forests: What makes the difference, tree species or microhabitat? For. Ecol. Manag. 2008, 25, 738–752. [Google Scholar] [CrossRef]
- Holmberg, R.G.; Cokendolpher, J.C. Re-description of Togwoteeus biceps (Arachnida, Opiliones, Sclerosomatidae) with notes on its morphology, karyology and phenology. J. Arachnol. 1997, 25, 229–244. [Google Scholar]
- Camann, M.A.; Gillette, N.E.; Lamoncha, K.L.; Mori, S.R. Response of forest soil Acari to prescribed fire following stand structure manipulation in the southern Cascade Range. Can. J. For. Res. 2008, 38, 956–968. [Google Scholar] [CrossRef]
- Platnick, N.I. The spider family Anyphaenidae in America north of Mexico. Bull. Mus. Comp. Zool. 1974, 146, 205–266. [Google Scholar]
- Ferrenberg, S.; Wickey, P.; Coop, J.D. Ground-dwelling arthropod community responses to recent and repeated wildfires in conifer forest of Northern New Mexico, USA. Forests 2019, 10, 667. [Google Scholar] [CrossRef] [Green Version]
- Molina, R.; Marcot, B.G. Definitions and Attributes of Little-Known Species. In Conservation of Rare or Little-Known Species: Biological, Social, and Economic Considerations; Raphael, M.G., Molina, R., Eds.; Island Press: Washington, DC, USA, 2007; pp. 67–92. [Google Scholar]
Publisher’s Note: MDPI stays neutral with regard to jurisdictional claims in published maps and institutional affiliations. |


| Source | df | Pseudo-F | p-Value |
|---|---|---|---|
| Ponderosa Pine Forest (PP) | |||
| Fire | 1 | 12.061 | 0.007 ** |
| Year | 4 | 3.4166 | 0.001 *** |
| Fire × Year | 4 | 2.2966 | 0.001 *** |
| Mixed-conifer Forest (MC) | |||
| Fire | 1 | 7.3596 | 0.009 ** |
| Year | 4 | 7.1894 | 0.001 *** |
| Fire × Year | 4 | 3.164 | 0.001 *** |
| Mountain Valley Grassland (MV) | |||
| Fire | 1 | 12.128 | 0.009 ** |
| Year | 4 | 3.7021 | 0.001 *** |
| Fire × Year | 4 | 0.5723 | 0.985 n.s. |
| Habitat | PP | MC | MV |
|---|---|---|---|
| No. of runs | 500 | 500 | 800 |
| 2-D Stress | 0.26 | 0.28 | 0.28 |
| Goodness of fit TrmtR2 | 0.3253 ** | 0.2423 *** | 0.0545 ** |
| Goodness of fit Year R2 | 0.1261 ** | 0.1049 *** | 0.0331 n.s. |
| Non-metric fit R2 | 0.935 | 0.921 | 0.925 |
| Linear fit R2 | 0.668 | 0.610 | 0.658 |
| 3-D Stress | 0.18 | 0.20 | 0.20 |
| Goodness of fit Trmt R2 | 0.3256 ** | 0.2574 ** | 0.0692 ** |
| Goodness of fit Year R2 | 0.1227 ** | 0.0975 ** | 0.0531 * |
| Non-metric fit R2 | 0.968 | 0.961 | 0.958 |
| Linear fit R2 | 0.760 | 0.714 | 0.728 |
| Ponderosa Pine Forest | Mixed-Conifer Forest | Mountain Valley Grassland | ||||
|---|---|---|---|---|---|---|
| Factor | Average Similarity | Top 5 Taxa % Contribution | Average Similarity | Top 5 Taxa % Contribution | Average Similarity | Top 5 Taxa % Contribution |
| Burned | 34.02 | Pardosa 22.95 | 39.47 | Pardosa 20.95 | 52.11 | Pardosa 27.56 |
| Haplodrassus 13.96 | Gnaphosa 16.80 | Erythraeidae 25.20 | ||||
| Erythraeidae 10.39 | Cicurina 13.76 | Haplodrassus 13.80 | ||||
| Cicurina 9.89 | Haplodrassus 12.26 | Xysticus 11.23 | ||||
| Erigone 9.28 | Togwoteeus 9.52 | Thanatus 6.50 | ||||
| Cumulative 66.47% | Cumulative 73.30% | Cumulative 84.30% | ||||
| Unburned | 42.14 | Anyphaena 16.24 | 40.44 | Leptobunus 18.32 | 51.95 | Pardosa 30.39 |
| Pardosa 16.23 | Togowteeus 17.85 | Haplodrassus 13.75 | ||||
| Gnaphosa 14.00 | Pardosa 12.85 | Erythraeidae 13.22 | ||||
| Alopecosa 13.17 | Haplodrassus 9.03 | Xysticus 12.93 | ||||
| Haplodrassus 11.14 | Cicurina 6.51 | Grammonota 10.35 | ||||
| Cumulative 70.78% | Cumulative 64.55% | Cumulative 80.64% | ||||
| Year 2011 | 39.33 | Haplodrassus 28.14 | 37.84 | Pardosa 26.55 | 55.08 | Pardosa 23.88 |
| Gnaphosa 15.51 | Haplodrassus 24.07 | Haplodrassus 18.78 | ||||
| Pardosa 11.03 | Cicurina 18.11 | Erythraeidae 18.26 | ||||
| Erythraeidae 7.22 | Gnaphosa 8.32 | Xysticus 12.96 | ||||
| Alopecosa 6.47 | Mesmessus 5.22 | Thanatus 7.51 | ||||
| Cumulaltive 68.37% | Cumulative 81.97 | Cumulative 81.40% | ||||
| Year 2012 | 32.31 | Haplodrassus 23.88 | 39.57 | Togwoteeus 17.54 | 57.77 | Pardosa 30.26 |
| Pardosa 18.09 | Leiobunum 15.03 | Haplodrassus 17.80 | ||||
| Gnaphosa 13.87 | Gnaphosa 14.92 | Erythraeidae 14.90 | ||||
| Alopecosa 8.73 | Haplodrassus 11.17 | Xysticus 13.45 | ||||
| Erythraeidae 5.12 | Pardosa 9.72 | Thanatus 7.18 | ||||
| Cumulative 69.68% | Cumulative 68.37% | Cumulative 83.59% | ||||
| Year 2013 | 28.77 | Pardosa 20.45 | 39.82 | Pardosa 14.77 | 52.60 | Pardosa 26.03 |
| Gnaphosa 13.08 | Gnaphosa 14.75 | Erythraeidae 21.62 | ||||
| Haplodrasssus 11.44 | Togwoteeus 14.36 | Haplodrassus 13.49 | ||||
| Erigone 10.34 | Leiobunum 10.18 | Xysticus 12.12 | ||||
| Erythraeidae 7.85 | Cicurina 9.62 | Thanatus 8.38 | ||||
| Cumulative 63.17% | Cumulative 63.69% | Cumulative 81.64% | ||||
| Year 2014 | 38.39 | Pardosa 24.84 | 43.68 | Pardosa 18.25 | 51.02 | Pardosa 31.28 |
| Cicurina 14.66 | Togwoteeus 14.54 | Erythraeidae 17.67 | ||||
| Erigone 10.20 | Cicurina 12.00 | Haplodrassus 12.69 | ||||
| Gnaphosa 8.03 | Haplodrassus 11.01 | Xysticus 12.35 | ||||
| Togwoteeus 6.98 | Gnaphosa 9.67 | Thanatus 5.33 | ||||
| Cumulative 64.72% | Cumulative 65.47% | Cumulative 79.32% | ||||
| Year 2015 | 34.36 | Pardosa 40.49 | 40.07 | Pardosa 27.13 | 48.49 | Pardosa 30.18 |
| Haplodrassus 6.23 | Togwoteeus 20.77 | Erythraeidae 19.29 | ||||
| Agyneta 6.08 | Gnaphosa 9.84 | Grammonota 9.89 | ||||
| Erythraeidae 6.05 | Erigone 8.62 | Xysticus 8.83 | ||||
| Togwoteeus 5.98 | Leiobunum 8.54 | Haplodrassus 8.22 | ||||
| Cumulative 64.84% | Cumulative 74.90% | Cumulative 76.42% | ||||
| Habitat | Factor | Family (or Higher Taxon) | Genus | Indicator Value |
|---|---|---|---|---|
| Ponderosa Pine Forest | Burned | Gnaphosidae | Micaria | 0.300 *** |
| Linyphiidae | Erigone | 0.458 *** | ||
| Grammonota | 0.345 *** | |||
| Islandiana | 0.319 *** | |||
| Erythraeidae | 0.278 ** | |||
| Unburned | Anyphaenidae | Anyphaena | 0.586 *** | |
| Dictynidae | Hackmania | 0.179 * | ||
| Gnaphosidae | Drassodes | 0.179 * | ||
| Gnaphosa | 0.425 *** | |||
| Zelotes | 0.219 ** | |||
| Linyphiidae | Helophora | 0.239 *** | ||
| Incestophantes | 0.261 *** | |||
| Lepthyphantes | 0.177 * | |||
| Pocadicnemis | 0.350 *** | |||
| Spirembolus | 0.328 *** | |||
| Tachygyna | 0.317 *** | |||
| Walckenaeria | 0.293 *** | |||
| Wubana | 0.448 *** | |||
| Lycosidae | Alopecosa | 0.549 *** | ||
| Hogna | 0.176 * | |||
| Thomisidae | Xysticus | 0.246 ** | ||
| Sclerosomatidae | Leiobunum | 0.169 * | ||
| Oribatida | 0.294 *** | |||
| Trombidiformes | Undetermined | 0.175 * | ||
| Anystidae | 0.293 *** | |||
| Year 2011 | Clubionidae | Clubiona | 0.294 ** | |
| Gnaphosidae | Haplodrassus | 0.394 *** | ||
| Hahniidae | Neoantistea | 0.298 *** | ||
| Phrurolithidae | Scotinella | 0.282 ** | ||
| Year 2014 | Dictynidae | Cicurina | 0.352 ** | |
| Year 2015 | Linyphiidae | Grammonota | 0.362 *** | |
| Mesostigmata | 0.402 *** | |||
| Mixed-conifer Forest | Burned | Linyphiidae | Erigone | 0.348 *** |
| Mermessus | 0.348 *** | |||
| Phrurolithidae | Phrurolithus | 0.230 ** | ||
| Unburned | Amaurobiidae | Callobius | 0.282 *** | |
| Gnaphosidae | Orodrassus | 0.228 ** | ||
| Linyphiidae | Ceratinella | 0.268 *** | ||
| Helophora | 0.397 *** | |||
| Islandiana | 0.244 *** | |||
| Pocadicnemis | 0.201 ** | |||
| Sisicottus | 0.350 *** | |||
| Spirembolus | 0.216 ** | |||
| Tachygyna | 0.358 *** | |||
| Tapinocyba | 0.196 * | |||
| Wubana | 0.466 *** | |||
| Lycosidae | Trochosa | 0.252 *** | ||
| Salticidae | Pelegrina | 0.198 ** | ||
| Theridiidae | Steatoda | 0.289 *** | ||
| Sclerosomatidae | Leiobunum | 0.543 *** | ||
| Togwoteeus | 0.359 *** | |||
| Oribatida | 0.413 *** | |||
| Trombidiformes | Undetermined | 0.183 ** | ||
| Anystidae | 0.288 *** | |||
| Bdellidae | 0.317 *** | |||
| Year 2013 | Salticidae | Pelegrina | 0.272 *** | |
| Year 2015 | Linyphiidae | Grammonota | 0.440 *** | |
| Lycosidae | Pardosa | 0.428 *** | ||
| Mesostigmata | 0.353 *** | |||
| Mountain Valley Grassland | Burned | Gnaphosidae | Micaria | 0.195 ** |
| Linyphiidae | Tachygyna | 0.175 * | ||
| Erythraeidae | 0.282 ** | |||
| Unburned | Dictynidae | Cicurina | 0.224 ** | |
| Gnaphosidae | Gnaphosa | 0.238 *** | ||
| Hahniidae | Neoantistea | 0.187 * | ||
| Linyphiidae | Grammonota | 0.390 *** | ||
| Walckenaeria | 0.298 *** | |||
| Philodromidae | Ebo | 0.206 ** | ||
| Sclerosomatidae | Leiobunum | 0.148 ** | ||
| Year 2011 | Gnaphosidae | Haplodrassus | 0.316 *** | |
| Salticidae | Pellenes | 0.286 ** | ||
| Anystidae | 0.275 ** | |||
| Year 2013 | Linyphiidae | Tachygyna | 0.331 ** | |
| Year 2014 | Linyphiidae | Tapinocyba | 0.247 * | |
| Walckenaeria | 0.222 * | |||
| Year 2015 | Linyphiidae | Erigone | 0.460 *** |
© 2020 by the author. Licensee MDPI, Basel, Switzerland. This article is an open access article distributed under the terms and conditions of the Creative Commons Attribution (CC BY) license (http://creativecommons.org/licenses/by/4.0/).
Share and Cite
Brantley, S.L. Responses of Ground-Dwelling Spider (Arachnida: Araneae) Communities to Wildfire in Three Habitats in Northern New Mexico, USA, with Notes on Mites and Harvestmen (Arachnida: Acari, Opiliones). Diversity 2020, 12, 396. https://doi.org/10.3390/d12100396
Brantley SL. Responses of Ground-Dwelling Spider (Arachnida: Araneae) Communities to Wildfire in Three Habitats in Northern New Mexico, USA, with Notes on Mites and Harvestmen (Arachnida: Acari, Opiliones). Diversity. 2020; 12(10):396. https://doi.org/10.3390/d12100396
Chicago/Turabian StyleBrantley, Sandra L. 2020. "Responses of Ground-Dwelling Spider (Arachnida: Araneae) Communities to Wildfire in Three Habitats in Northern New Mexico, USA, with Notes on Mites and Harvestmen (Arachnida: Acari, Opiliones)" Diversity 12, no. 10: 396. https://doi.org/10.3390/d12100396