


Abstract
Recently, measurements of few-picosecond (ps, 10−12 s) pulses of laser-driven protons were realised by the observation of transient opacity in SiO2. This ultrafast response could be understood by the formation of self-trapped excitonic states in the material, creating a rapid de-excitation channel for conduction band electrons. Here we extend this work to examine the onset and evolution of an ion-induced opacity in transparent dielectrics, namely multicomponent variants of SiO2. The fast recovery observed in SiO2 is in sharp contrast to borosilicate (BK7) and soda-lime glasses. We find that the opacity decay timescales for BK7 and soda-lime glass are orders of magnitude greater than the 3.5 ps proton pump pulse duration and discuss the underlying processes which may be affecting the extended recovery of the material. Simultaneous probing with 2nd harmonic radiation allows estimates of ultrafast electron dynamics due to proton interactions in matter to be investigated, this indicates that a rapid evolution of an initially unstructured ion-induced dose distribution seeds the longer term recovery pathways in the irradiated dielectrics. When combined, these results demonstrate the efficacy of utilising ultrafast laser-driven ionising radiation along with highly synchronised probe pulses to enable the study of ion-induced damage in matter on ultrafast timescales in real time.
Export citation and abstract BibTeX RIS

Original content from this work may be used under the terms of the Creative Commons Attribution 4.0 licence. Any further distribution of this work must maintain attribution to the author(s) and the title of the work, journal citation and DOI.
1. Introduction
Understanding the effects of ionising radiation in matter has been a focus of research for decades; from investigating the response of cells when undergoing hadron therapy in medicine [1], changing the optical properties of a material [2, 3], or the damage induced in materials deployed in radiation harsh environments such as space—where cosmic rays and other forms of ionising radiation can pose a threat to sensitive electronic equipment [4–6]. Many of these studies focus on the longer term effects such as cell death or the effect on structural integrity and permanent damage centre formation in the material [7–10]. However, understanding how the associated early stage dynamics underpin the formation of these final states is very challenging, both experimentally and computationally. This is because the nascent phase can evolve over time frames that span from femtoseconds (fs, 10−15 s) to nanoseconds (ns, 10−9 s) [11]. This is particularly true for ion interactions in matter where a nanostructured instantaneous dose distribution rapidly evolves and interacts with the surrounding unperturbed medium [12].
Here we address this problem using a pump-probe technique with a high degree of synchronicity to observe the response of materials to laser-driven ions immediately after interaction with the sample. In the past, tracking the temporal evolution of ion-matter interactions has been performed using pulsed ion radiolysis combined with chemical scavengers [13–15], however there are some drawbacks to this technique. Firstly, chemical scavenging requires the addition of substances which react in some way to the absorption of energy from the proton (e.g. photo-emission). While it is relatively easy to introduce and tune the concentration of a scavenger for a particular application in aqueous solutions, this is very difficult to replicate in solid state samples. Furthermore, to achieve high temporal resolution measurements the high concentration of chemical scavenging agent required can result in the scavenger itself taking part in the radiolysis [16, 17]. Finally, although the use of traditional radio-frequency (RF) particle accelerators provide stable high energy pulses, this is at the cost of long pulse durations (>100 ps) with significant levels of timing jitter with respect to optical probe pulses, due to the ion and probe sources being coupled electronically [18].
Recently, the first ultrafast measurements of ion-induced damage in condensed matter have been shown in SiO2 [12]. The ultrafast response of the SiO2 enabled the absolute measurement of laser-driven proton bursts as short as 3.5 ps. In this paper we study the evolution of ion-induced opacity in alternative transparent dielectric materials using this methodology. By exposing the samples to the same few-picosecond proton pulses and through the use of a highly synchronised pump-probe technique, we examine the evolution of the sample for hundreds of picoseconds after the initial proton interaction.
1.1. Ionisation dynamics
Proton interactions in condensed matter initially create a highly structured dose distribution in the form of nanometre-scale tracks of ionisation damage along the proton trajectory. These tracks represent ultrasteep energy density gradients over distances of a few nanometres, seeding a rapid diffusion of the excited electron population into the surrounding, unperturbed material [21]. For dielectrics, this implies that electrons are excited into the conduction band, where they essentially become free and are able to diffuse throughout the material. This is illustrated in figure 1, which shows a simple model of electron diffusion (based on the modelling of Osmani et al [19]), note that this does not include any inhibiting factors, such as the structure of the material or the presence of electron trapping sites caused by defects. This demonstrates a possible route for how electron density can transition from an electron-hole plasma (>1021 cm−3) to free electron gas (∼1019 cm−3) conditions on the order of hundreds of femtoseconds [22].
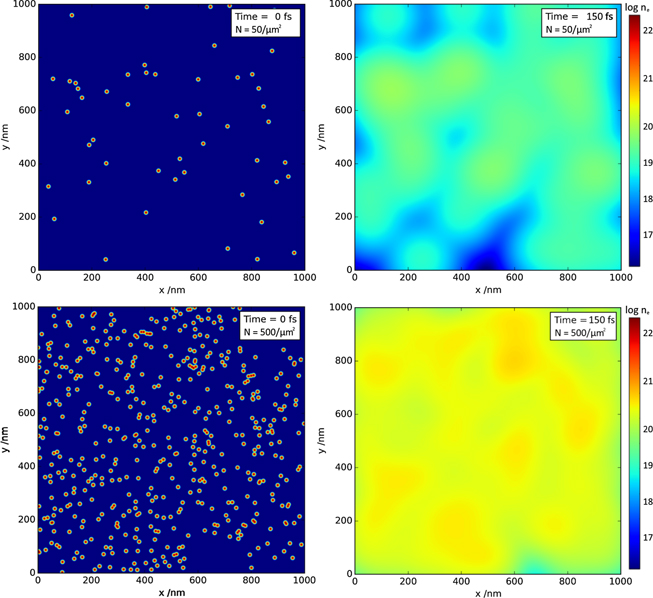
Figure 1. Electron diffusion model produced using coefficients from Osmani et al [19] with electron energies obtained from FLUKA and GEANT4 simulations [20, 47]. This model illustrates the diffusion of electrons instigated by the steep energy gradients created by the ion tracks in the glass sample. Plots show the log of electron density ne (cm−3) at t = 0 fs and t = 150 fs timestamps. The top pair of plots show that for a low proton flux, the electron density falls to below 1019 cm−3 within 150 fs suggesting that recombination can take place. The bottom plots indicate that for a greater proton flux, the electron density remains higher over the same period of time, inhibiting the recombination process.
Download figure:
Standard image High-resolution imageWhen excited into the conduction band, the electrons can undergo free free absorption of optical radiation in a process similar to inverse bremsstrahlung []. This represents a reduction in transmission in the glass when it is probed at optical wavelengths, providing an effective experimental route to study the immediate aftermath of these interactions (i.e. sub nanosecond timescales). This is referred to throughout the paper as an opacity. In the case of SiO2, for example, two main routes for recombination are possible; namely direct (or band-to-band) recombination, which involves the excited electron moving from its state in the conduction band to the associated empty state in the valence band, or via the formation of self-trapped excitons (STEs). STEs can enable an ultrafast pathway for de-excitation of the electrons, since they form within 150 fs [23]. Now that the electron forming the exciton is trapped in a state approximately 4 eV below the conduction band it is no longer considered free and will not contribute to absorption at the wavelength of the optical probe. If, however, these fast decay pathways are not available to the electrons or the de-excitation process is somehow inhibited (such as in trap-assisted recombination [24]), the recovery time of the material is extended beyond the duration of the proton burst.
2. Experimental technique
Target Normal Sheath Acceleration (TNSA)
Compared to the proton beams produced using radiofrequency accelerators, laser-driven ion acceleration has the advantage of offering significantly shorter pulse durations, where the proton bunch time can be of the order of a few picoseconds [26] with dramatically enhanced synchronicity to the probe source as both can originate from the same seed laser pulse. The use of laser-driven protons from TNSA has been an active research area for decades [27–29]. TNSA is a method of laser-driven ion acceleration where the proton source does not come directly from the several-micron thick target foil, but from the contaminants—namely the H+ ions present on target surface. During the interaction of an intense laser pulse with such a foil, the front side is rapidly ionised to form a plasma, which partially absorbs the main pulse. The electric field of the laser accelerates the electrons in the foil to relativistic energies towards the rear side of the target ionising the hydrocarbon contaminates on the rear surface of the foil. While some high energy electrons escape, lower energy electrons are trapped by the net positive charge on the rear surface, leading to the formation of a sheath field, generating large electric fields (TV m−1) capable of accelerating ions. As the H+ ions present in surface contaminants have the highest charge:mass ratio, they are rapidly accelerated by the strong electric field over a distance of a few micrometres normal to the rear surface of the target foil [29].
Due to the nature of proton generation via TNSA, the generated proton spectrum is not monoenergetic but will instead contain a wide range of energies with a sharp cut-off. This wide energy spectrum experiences significant velocity dispersion as it propagates through vacuum between the target and sample. While the global pulse duration rapidly increases due to velocity dispersion, the original ultrashort pulse duration is conserved in narrow energy bandwidths of the spectrum. This is because the initial foil target acts as a cold cathode with negligible inherent thermal energy spread. Previously shown in Dromey et al [12] it is possible to recover the original ultrafast nature of the pulse, as shown in figure 2. When looking at 1 MeV bandwidths (e.g. 9 MeV–10 MeV), after 5 mm of propagation the pulse duration is only a few picoseconds, as opposed to the 100 ps pulse expected for the entire spectrum. By exploiting the nature of proton stopping in matter as a form of energy filtering it is possible to recover the initial short pulse duration.

Figure 2. Proton pulse duration as a function of depth. (a) Calculated proton trajectory curves in glass (ρ = 2.5 g cm−3) using SRIM data [25]. Coloured lines represent cutoff regions corresponding to 1 MeV intervals. The large temporal spread is due to different propagation times across the vacuum, stretching the pulse in time. (b) Shows the arrival time for energy bandwidths remaining in the glass at three different depths when accounting for 5 mm of vacuum propagation. Here T0 refers to the time of the laser-target interaction.
Download figure:
Standard image High-resolution imageUsing the TARANIS laser facility at Queen's University Belfast [30]; protons were accelerated via the TNSA mechanism to an endpoint energy of 10 MeV and a flux on the order of 1011 cm−2 (verified using stacks of radiochromic film [30]). The generated proton burst then propagated a distance of 5.0 ± 0.5 mm under vacuum before being collimated to a width of 100 μm to 500 μm using a 1 mm thick aluminium slit placed in front of the sample. The interaction region within the sample is back-illuminated by the probe beam and then imaged onto the entrance of a 1 m imaging spectrometer at 12× magnification. A schematic of the experimental setup is shown in figure 3.

Figure 3. Sketch of the experimental setup. An intense laser pulse (≈6 × 10¹⁹ W cm−2) incident on a 12 μm thick aluminium foil generates a proton pulse via the TNSA mechanism. The protons propagate 5.0 ± 0.5 mm through vacuum and are collimated using a 1 mm thick Al slit placed in front of the sample. Low energy protons and co-propagating keV electrons are removed using a 10 μm Al foil placed in front of the sample. A probe pulse synchronised to the main laser pulse is used to back-illuminate the interaction region. The duration of this pulse can be tuned using a small compressor stage to provide either a transform limited pulse duration of 470 fs or a chirped pulse up to 200 ps. Alternatively a 1.2 ns pulse can be used by bypassing the compressor entirely. The interaction region is imaged at 12× magnification onto the entrance of a 1 m Czerny–Turner spectrograph for optical streaking.
Download figure:
Standard image High-resolution image2.1. 2D imaging
Imaging directly onto the CCD provides a 2D snapshot of the generated opacity as seen in figure 4 taken with a transform limited 470 fs probe pulse. It is possible to observe the evolution of opacity by taking several of these snapshots, delaying the probe for each image by adding (or subtracting) path length to the probe beam before interaction with the sample. This probing method provides an initial understanding of evolution time scales, an indication of the level of opacity generated in the samples and is useful for determining the instantaneous spatial profile of the proton pulse. However, as the illumination profile of the probe will fluctuate on a shot to shot basis, small variations can appear as false opacity when looking at relative transmission. Also, due to the nature of laser-driven proton acceleration, the generated transient opacities on a shot-by-shot basis are not directly comparable. This is highlighted in figures 4(b) and (c), where for the same time delay there is a significant difference in the spatial profile of the opacity.
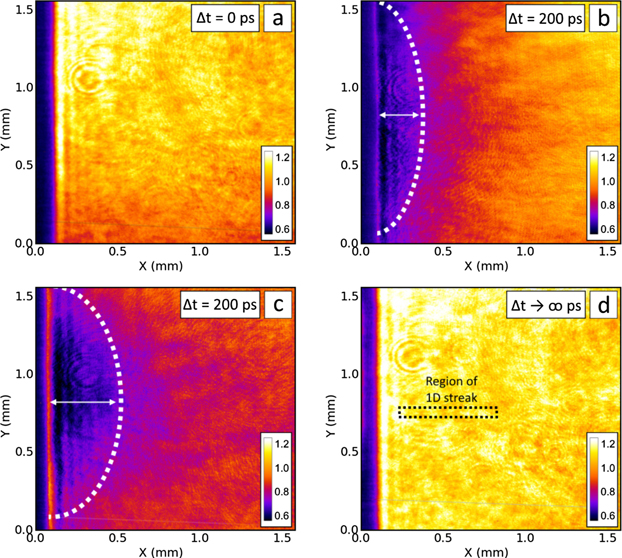
Figure 4. Examples of 2D images obtained during the investigation of soda-lime glass. Panels show relative transmission of the probe during the ion interaction compared to the sample probed beforehand. The proton burst is incident from the left-hand side. (a) Shows transmission of the sample before the protons arrive, at a time corresponding to the laser-target interaction. (b) And (c) both show opacity generated in the glass by the proton radiation at a time 200 ps after the laser target interaction. The variation in depth of the opacity is likely due to a higher flux and/or maximum proton energy in the shot shown in (c). Panel (d) shows that the glass has recovered after the proton interaction. The dashed region indicates the approximate area imaged when using the optical streak technique. The relative delays are controlled using a delay stage. The zero-position was obtained when the two pulses were overlapped using a high-speed photodetector and confirmed by imaging the formation of an air-plasma. The colorbars in each figure show the relative transmission of the probe compared to a reference shot. Each panel represents a separate laser shot where protons are generated.
Download figure:
Standard image High-resolution image2.2. Optical streaking
Shot-to-shot variations in proton flux and energy are inherent to the TNSA process due to fluctuations in laser intensity, targets and near-time pulse contrast. It is therefore necessary to employ a technique that can realise the temporal evolution of the induced opacity on a single shot basis. This can be achieved via optical streaking [12], whereby a pulse is extracted from the laser chain of a chirped pulse amplification (CPA) system before compression to provide a chirped 1.2 ns probe. Additionally, this pulse can be sent to a separate compression stage to obtain pulse durations in the range of 50–200 ps. As the frequencies in the pulse will arrive at different time steps of the proton interaction with the sample, the evolution of the generated opacity is encoded in the probe pulse. This is then extracted by spectrally resolving the probe using an imaging spectrometer and CCD. A schematic overview of this technique is shown in figure 5.
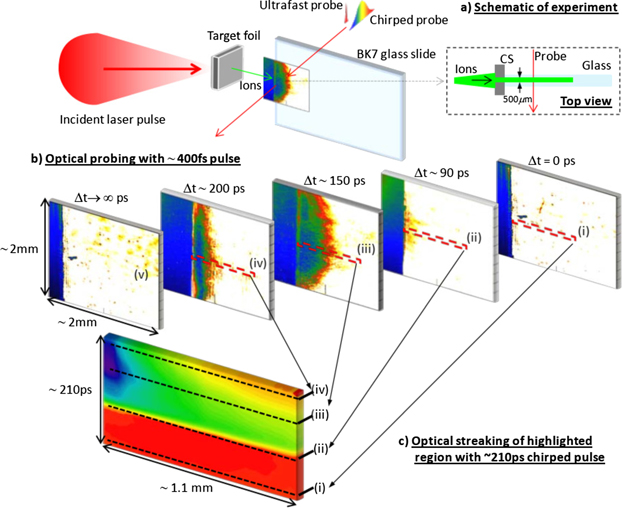
Figure 5. Overview of the optical streaking technique. (a) Highlights the interaction region where either an ultrafast or chirped probe illuminates the interaction region of a glass slide after radiation has been generated with the main laser pulse. When using an ultrafast probe for 2D imaging as shown in (b) the evolution of the opacity can be tracked in separate shots, changing the delay between the main and probe laser pulses to view discrete timesteps of the interaction. To avoid shot-to-shot fluctuations and view the evolution on a single-shot basis, this can instead be observed using a chirped probe and optical streaking as shown in (c). Here a small slice of the interaction region is imaged onto the entrance slit of a spectrometer. As the frequencies in the chirped probe arrive at slightly different times, the evolution of the opacity is encoded in the frequency spectrum of the chirped pulse.
Download figure:
Standard image High-resolution imageTo highlight the evolution of opacity across an optical streak, images are taken of the interaction region using the probe pulse without also firing the main laser pulse to produce generate TNSA protons. These shots are called probe only, or PO, images. On main shots when both laser pulses are fired, an optical streak of the region is obtained with opacity information encoded in it. Each final image shows the evolution of opacity generated in the sample compared to a reference PO streak. The PO images serve two purposes, firstly to highlight changes in the sample as a result of the generated opacity and secondly to verify that no permanent damage has been caused to the sample as a result of the interaction, either from debris or localised melting in the glass.
A second colour probe can be introduced to the technique to simultaneously probe the interaction region alongside the fundamental wavelength. In this scheme, a type I beta barium borate (BBO) crystal is introduced at the beginning of the probe line after it is extracted from the main laser chain. Through frequency doubling, the crystal generates a 2nd harmonic probe at 527 nm. This propagates alongside the fundamental 1053 nm to simultaneously probe the interaction region. After the sample the two probes are separated using dichroic mirrors before entering separate imaging spectrometers.
3. Results
The two samples under examination in this experiment are both variants of silica-based glasses. Borosilicate glass (BK7) is most commonly found in laboratories and used for its high resistance to thermal shock. Mainly composed of SiO2 (70%), it also contains boron oxide (11%) and several other oxide compounds in smaller quantities. A more familiar material is Soda-lime silica, the most common form of glass found worldwide, it accounts for approximately 90% of all glass produced. Similarly to BK7, soda-lime is composed of around 70% SiO2 and numerous other compounds, including Fe2O3. Both samples are highly transmissive over a broad wavelength range and, critically, the transmission does not vary over the narrow spectrum of the probe pulse [31].
Figure 6 shows lineouts from a typical optical streaks obtained using a 1.2 ns probe. The inset image shows the spatiotemporal evolution of opacity, with propagation into the sample shown on the y-axis and evolution on the x-axis from full transmission of the probe before the protons arrive to the onset of opacity initially generated from the highest energy protons (corresponding to the cut-off energy of the TNSA spectrum) and the subsequent recovery of the glass. The decay constant (τd, defined as the time taken for the opacity to drop to 1/e or ∼36% of its initial value) is up to 620 ± 10 ps in the glass sample and remains consistent for the three depths indicated in the figure. For low depths (and correspondingly high proton flux) the total recovery time of the opacity extends beyond the temporal window of the probe. This gradually decreases further into the sample whereby the full recovery can be seen towards the end of the proton range.
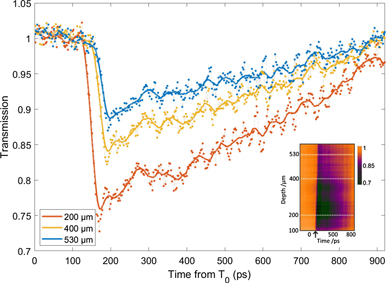
Figure 6. Optical streaking data obtained experimentally for BK7 using a 1.2 ns optical probe. The inset graphic shows the optically streaked image with an arrow to indicate the onset of the opacity. Raw experimental data is represented by points, the solid line shows a moving average. A Gaussian blur has been performed on the inset image for presentation, lineouts have been obtained from raw data.
Download figure:
Standard image High-resolution imageFigure 7 shows opacity data from soda-lime glass in comparison to the BK7 sample shown in figure 6. The soda-lime glass sample exhibited a much stronger response to the proton pulse. Both the lifetime of the opacity and its strength (the reduction in transmission) are significantly greater in this sample, dropping to around 60% at lower depths and extending beyond the temporal window of the probe pulse. This data is included strictly for comparison to the BK7 as a full investigation would require much longer probe durations to observe the recovery in a single shot.

Figure 7. Experimental data showing evolution of opacity in soda-lime glass (ρ = 2.44 g cm−3) at different depths. Included is a comparison with BK7 (ρ = 2.51 g cm−3) towards the end of the proton range in the samples. The lineouts are taken at slightly different depths to account for the difference in proton stopping due to the varying density. Raw experimental data is represented by points, the solid lines show a moving average. A Gaussian blur has been performed on the inset image for presentation, lineouts have been obtained from raw data.
Download figure:
Standard image High-resolution image3.1. Electron density measurements
Although the 2D imaging technique alone proves inferior to optical streaking when investigating the evolution of the dynamics of a material, the use of a short pulse combined with interferometry can reveal insights into the changing electron density profiles in the sample after irradiation. This work has previously been performed for laser-irradiated samples of SiO2 and other insulators [32, 33]. The approach used by Audebert et al [32] can be implemented to provide an estimation of the electron density ne based on the observed phase shift ΔΦ

where λ and ω are the wavelength and frequency of the the laser probe and L is the length over which the refractive index n0 is modified.
Performing interferometry using a Wollaston prism [34] produces the interference fringes shown in figure 8. The first measured phase shift ΔΦ = 1.35 ± 0.15 rad in the interaction region indicates an electron density ne = 2.9 ± 0.3 × 1018 cm−3, this region is within the first 100 μm of the soda-lime glass, which was not imaged in the optical streak. However at a depth of 150 μm there is a measured ΔΦ = 0.7 ± 0.2 rad, reducing to 0.21 ± 0.05 rad at 300 μm. These values correspond to electron densities in range of 0.4 × 1018 cm−2 to 1.5 × 1018 cm−2. After this depth there is no measureable phase change observed. The measured densities are further indication that no permanent damage is induced in the sample and are well below electron–hole plasma conditions, therefore allowing recombination to occur.
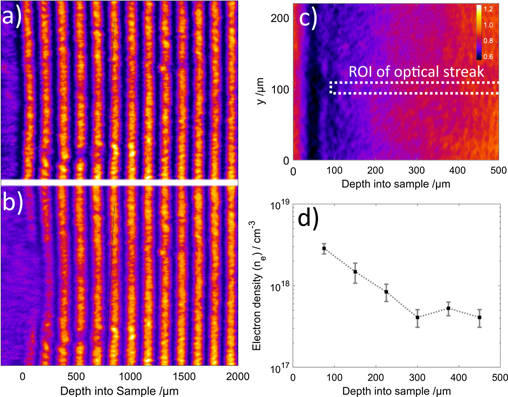
Figure 8. Interference fringes used to measure changes in electron density in soda-lime glass. (a) Reference probe image taken before proton interaction sample and (b) observed in the interaction region during proton irradiation. (c) Shows a comparable 2D image of generated opacity, to illustrate the regions of electron density shown in (d).
Download figure:
Standard image High-resolution image3.2. Carrier dynamics
Estimation of the carrier damping scattering time (CDST) can be obtained by comparison of the optical streaks taken using the first and second harmonic of the probe pulse [18] given as

where ω1 is the fundamental laser frequency, T1 and T2 refer to the relative transmission for the 1st and 2nd harmonic.
This was achieved by comparing the relative transmissions of two optical streaks taken simultaneously at 1053 nm and 527 nm, a lineout of which is shown in figure 9. Using this data and the equation above provides us with a τc = 0.42 ± 0.06 fs. This in agreement with that observed previously in SiO2 and BK7 [18, 35]. It is important to note that this value is very sensitive to the measured transmission, which will fluctuate on a shot-by-shot basis but can be observed consistently over the temporal window of a single shot.
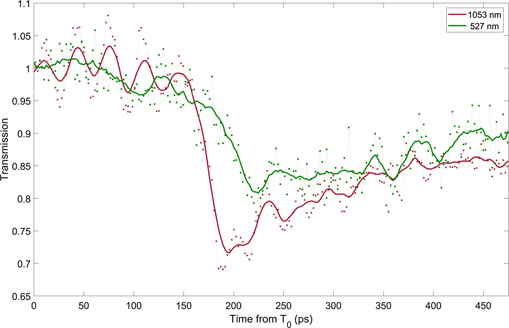
Figure 9. Relative transmission obtained from optical streaks in BK7 glass using a fundamental (ω) 1053 nm and a frequency doubled (2ω) 527 nm probe pulse. Raw experimental data is represented by points, the solid line shows moving average.
Download figure:
Standard image High-resolution imageAssuming the estimated collision times in soda-lime glass are comparable to BK7, we can combine this with the electron densities obtained from the interferometry measurement to verify the results based on the transmission of soda-lime glass in the optical streaks. From the Drude model, the absorption coefficient α can be calculated using the change in the extinction coefficient Δke caused by the generated opacity in the glass

where

Here D is the absorption length, n0 is the refractive index of the glass, Nc is the critical density at the probe wavelength, ω is the laser frequency, ne and τc are the previously calculated electron density and collision time. Using equations (3) and (4) with an estimated τc =0.4 fs and the measured electron density at 300 μm of 8 × 1017 cm−3 produces an estimated transmission of the probe of 52 ± 12% for an effective slit width of 100 μm. Combined, these measurements support our earlier hypothesis of a rapid evolution of dose by returning (to within uncertainty) our observed transmission in figures 4 and 7.
4. Discussion
The rapid recovery of SiO2 discussed by Dromey et al [12] allowed the TNSA pulse duration to be characterised as approximately 3.5 ps. When compared to the results shown here, the recovery of both BK7 and soda-lime are orders of magnitude longer than both the proton pulse duration and recovery observed in SiO2. In this section we will discuss possible underlying mechanisms which may contribute to the dramatically increased recovery time.
4.1. Defects and traps
Perhaps the main difference between glass and a crystal is the lack of long range order present in the atomic structure. Borosilicate and other silica-based glasses contain additional compounds that modify the atomic network. BK7 contains two main types of additions; 'glass forming' ions such as boron that can form part of the main atomic network and 'modifying' ions (typically sodium and aluminium) that interfere with the atomic structure but do not form part of the glass network. The glass will also contain a mixture of bridging and nonbridging oxygen atoms. A bridging oxygen is bonded to two network forming ions (e.g. silicon) forming a bridge, whereas a nonbridging oxygen is only bonded to one network forming ion. These additional modifiers are added to provide the glass with specific properties, e.g. the addition of boron gives a high resistance to thermal changes and chemical corrosion, whereas the addition of sodium oxide lowers the melting point of soda-lime glass. Although these additions provide unique benefits in applications for the glass, the increased complexity of the material structure introduces a much greater probability for these defects to occur [36].
The concept of energy bands was originally introduced to model electron-hole formation in crystals, however it can also be applied to glasses due to the short-medium range order they possess [37, 38]. Modifications are required to the model as instead of bands (i.e. in crystals) a glass will contain levels distributed in energy due to the defect sites and impurities in the material [39]. The energy gap between the conduction and valence bands now contains many interstitial levels that are able to trap either electrons or holes during the recombination process. Due to the increased complexity of the material caused by the additional ions and compounds, defect sites and therefore interstitial levels are much more prevalent in a glass such as BK7, especially compared to SiO2 [12]. These defects are commonly divided into four main categories, which are also illustrated in figure 10 [40–42].
- (a)Vacancies, caused when an atom is absent from its expected position, will, depending on the charge of the atom, be attracted or repulsed. In figure 10 the missing orange anion creates a positive charge relative to the lattice. This results in attraction of the surrounding orange anions and a repulsion of the nearby positive red cations.
- (b)Impurities are atoms or compounds present in the glass that were not added intentionally. If the charge of the impurity is even slightly different to the normal atom it will result in a deformation of the lattice.
- (c)Substitution defects, similar to impurities, are created when a different atom is present to what is generally in the surrounding network.
- (d)Interstitial atoms occur when they take a position that is normally unoccupied in the structure of the glass (e.g. between lattice positions). This creates a distortion in the local potential as the nearby atoms are repulsed.
In the majority of borosilicate glasses the most common form of defect is the boron-oxygen hole centre (BOHC) [43, 44]. This is a result of a boron-oxygen pair becoming dislocated from the lattice which then acts as a trapping site for generated holes.

Figure 10. Schematic illustration showing common categories of defects found in a crystal or glass atomic structure. For the purpose of explanation, the red atoms are considered positively charged (cations) and the orange negative (anions).
Download figure:
Standard image High-resolution image4.2. Electron recombination and recovery of the opacity
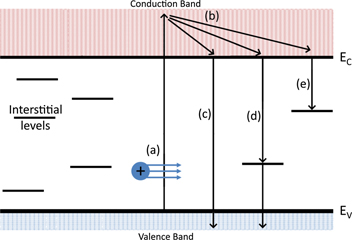
The experimental observations presented here originate from an opacity generated in the material due to an excited electron population in the conduction band, the lifetime of which is essentially dictated by the recombination processes available to these electrons. Previous investigations by Dromey et al [12] suggest that the formation of self-trapped excitons ∼150 fs after excitation provide a fast decay channel for these excited electrons so that they no longer contribute to the free-free absorption of the probe pulse. BK7, due to it being a multicomponent glass contains many defects; both inherent to the glass and those induced under irradiation. This results in a complex energy level structure similar to that illustrated in figure 11. The electron-hole pairs generated by the interaction can recombine in several different ways. Direct (or band-to-band) recombination involves the excited electron moving from its state in the conduction band to the associated empty state in the valence band. If this decay pathway is not preferred (e.g. due to a large band gap) recombination will take place in multiple steps via interstitial energy levels if they are available. These recombinations within the band gap are known as 'trap assisted' or Shockley–Read–Hall (SRH) processes, which involve the excited electrons decaying from the conduction band and then becoming trapped in the interstitial levels created by defects. This process is the dominant recombination mechanism for indirect band gap materials [24, 33]. Previous studies directly probing some of the defect centres in BK7 found that absorption took place over several nanoseconds [45]. When compared to the results shown here, it is possible that the extremely long recombination time would be responsible for the extended recovery of the opacity as electron decay would be inhibited due to electron/hole trapping in the interstitial levels, leaving a continued excited electron population in the conduction band.
Figure 11. Schematic of energy levels of a typical amorphous material. The interstitial energy levels are the result of defects in the material forming trapping sites for carriers. (a) Shows the creation of an electron–hole pair through ionisation from a proton, energy is then transferred to the lattice via (b) electron-phonon relaxation before the electron either recombines directly (c) or via an interstitial level (d). It is also possible that the electron will decay to a deep trapped state (e). Here Ec and Ev represent the edges of the conduction and valence bands.
Download figure:
Standard image High-resolution image
5. Conclusion & outlook
We have examined the onset and evolution of ion-induced opacity using an optical probe with a high degree of synchronicity to the ion source. Through the use of an optical streaking technique which permitted a 2.4 ps resolution over a 1 ns temporal window and up to 0.8 μm resolution in the spatial direction, we were able to observe the onset and recovery of the opacity on a single shot basis. The flexibility of this technique opens up many avenues for further research. Modifications to the glasses investigated, such as annealing, would alter the inherent defects present in the samples and therefore could dramatically change the material response. The optical streaking technique can be directly applied to the study of x-ray/electron interactions with the material alongside laser-driven protons. Additionally, the use of different wavelength probes to examine specific excited species in the samples, including the interstitial defect levels believed to be responsible for extending the recovery times of the ion-induced opacity. In addition, the use of shorter (few-picosecond) optical probes would permit observation of the primary radiation events that occur during the rising edge of the proton pulse.
The results presented here provide the first quantitative, real time measurements of ultrafast electron dynamics in the aftermath of ion interactions in transparent dielectrics. Estimates of the electron density and collision times are shown to be consistent with opacity observed here and in other work [11, 18, 46]. Importantly the prediction of the rapid evolution of the initial dose distribution from simulations is supported by these measurements.
Future work will focus on how these nascent dynamics impact irradiation in aqueous solutions and biologically relevant samples where understanding how the high energy density proton tracks transit to equilibrium may play a significant role in the subsequent radiolysis.
Acknowledgments
The authors would like to acknowledge support for this work from the EPSRC through the following grants EP/P016960/1, EP/L02327X/1 and EP/P010059/1.