A New Low-Cost and Reliable Method to Evaluate the Release of Hg0 from Synthetic Materials
by
 , and
, and
Marta Lazzaroni
1,2 ,
,
Barbara Nisi
2,3, 
Daniele Rappuoli
4,5,
Jacopo Cabassi
3 and
and
Orlando Vaselli
1,2,3,* 1
Department of Earth Sciences, University of Florence, Via G. La Pira 4, 50121 Florence, Italy
2
INSTM, National Interuniversity Consortium of Materials Science and Technology, Via G. Giusti 9, 50121 Florence, Italy
3
CNR-IGG, Institute of Geosciences and Earth Resources, Via G. La Pira 4, 50121 Florence, Italy
4
Unione dei Comuni Amiata Val d’Orcia, Unità di Bonifica, Via Grossetana, 209, Piancastagnaio, 53025 Siena, Italy
5
Parco Museo Minerario di Abbadia San Salvatore—Via Suor Gemma, Abbadia San Salvatore 1, 53021 Siena, Italy
*
Author to whom correspondence should be addressed.
Processes 2020, 8(10), 1282; https://doi.org/10.3390/pr8101282
Submission received: 1 September 2020
/
Revised: 9 October 2020
/
Accepted: 10 October 2020
/
Published: 13 October 2020
(This article belongs to the Special Issue Applications of Bioprocess Processes in Environmental Protection and Purification)
Abstract
:Mercury is a toxic and noxious element and is the only metal that naturally occurs as gas. One of the most challenging topics (included in the United Nations Minimata convention) is to understand the adsorption–release processes of manmade materials (e.g., concrete, bricks, tiles, painting). Adsorption of Hg by construction and demolition waste materials has recently been studied, but investigations on how much Hg0 can be released from these products are rather poor. The abandoned mining site of Abbadia San Salvatore (Siena, central Italy) where, for about one century, cinnabar was roasted to produce liquid mercury, is known for the high concentrations of (i) Hg0 in edifices and structures and (ii) total and leachate Hg in synthetic materials. In the present paper, a new, simple and low-cost method to measure the amount of GEM (Gaseous Elemental Mercury) released from anthropic materials (concrete, wall rocks, and tiles) located in the Hg0-rich environments of the former mining site, is proposed. The efficiency of a specific paint that was supposed to act as blocking agent to Hg0 was also tested.
1. Introduction
The World Health Organization (WHO) has classified mercury in the top ten chemicals that are regarded as a major public health concern. The Minamata event, officially recognized as the Minamata disease in 1956, e.g., [1,2], demonstrated the negative effects produced by methyl-mercury (Me-Hg) due to the human consumption of contaminated fish and shellfish, which biomagnified and bioaccumulated Me-Hg mercury contained in the wastewaters discharged into the sea by a local chemical plant. Me-Hg damage is irreversible, and a large and relevant variety of symptoms occurs such as blindness and deafness and affects the neurological and immune systems. Me-Hg tends to accumulate in fetal tissues, blood and brain and genetic mutations and deformity in newborn children were observed, though. However, the full comprehension of the processes able to induce toxicity is still to be clarified e.g., [3,4,5]. However, Me-Hg is not the only mercury compound able to negatively affect the human health. It has indeed been shown that mercury vapor (Hg0), commonly referred to as GEM (Gaseous Elemental Mercury), has neurotoxic effects. Elemental mercury is soluble in lipids [6,7,8]; if inhaled, almost 80% is absorbed, whereas the absorption percentage via dermal exposure and ingestion is less than 1%. Centuries of human activities have mobilized a large amount of mercury in different forms in the atmosphere and terrestrial and water systems [9]. For this reason, mercury is considered a global pollutant e.g., [10]. Mining activities, chloro-alkali plants, and raw material transformation industries have likely been the most important anthropogenic sources of mercury [11] and have impacted human and ecosystem health. Health problems are observed to be caused by human exposure to inorganic mercury during the exploitation of Hg-bearing ore deposits, especially during roasting processes to produce liquid mercury or pigments, e.g., [12,13,14]. After the United Nation’s Minamata convention in 2013, actions to ban new Hg-mines and closing those where Hg-exploitation was still active were undertaken to eliminate Hg-bearing products from daily life [15].
The former mining Hg-district of Abbadia San Salvatore (Tuscany, central Italy) has been one of the most important exploitation and production areas of liquid mercury worldwide. Presently, the mining area is under remediation after many years from its shutdown (1974). Recent investigations have highlighted that the 90 edifices and mining structures hosted by the mining area, which is located slightly to the north of the urban center of Abbadia San Salvatore (Figure 1), are characterized by high contents of GEM (up to >50,000 ng·m−3), particularly in those buildings where Gould and Nesa furnaces are situated [16]. Additionally, the concentration of total and leachable mercury in the synthetic materials (e.g., concrete, bricks, plaster, paint, roof tiles and so forth) showed remarkable high values likely related to absorption processes in a Hg-rich environment since from the surface inward, a drastic decrease of mercury was observed [16,17]. According to [18,19], when Construction and Demolition (C&D) waste materials are exposed to a gaseous Hg-rich atmosphere from 5 to 150 days, they tend to absorb gaseous mercury. Now, if we consider that walls and other synthetic materials in the edifice hosting the furnaces have been suffering years of high GEM contents, the high total and leachable concentrations of mercury can be explained. Nevertheless, as observed during warm seasons, it is also to be considered that ambient temperatures also favor the release of the absorbed mercury by these materials and then, responsible for the high GEM values in this edifice [16]. This is particularly important in the framework of the remediation operational activities that are expected to be carried out by the end of 2020. Additionally, specific paintings are supposed to be used to minimize or even avoid the release of mercury from the edifice’s walls. Consequently, the aims of this paper were those to (i) propose a new, efficient and low-cost method to determine the amount of Hg0 released from concrete, rock-wall, and roof tile samples from the former mining area of Abbadia San Salvatore and (ii) test paint to verify the capability to decrease the release of Hg from these synthetic materials by comparing treated and untreated samples. It is to mention that the sanitary emergence of COVID-19 slowed down the experimental runs due to the difficulties of collecting more samples from the mining area and the limited access to the university facilities.
2. Mercury Pollution in the Former Mining Area of Abbadia San Salvatore
The Mt. Amiata silicic complex (Tuscany, Italy), constituted by Quaternary volcanites, mainly trachytes, dacites and olivine-latites [20], emplaced between 305 and 231 ka [21,22], hosts a world-class mercury mining district. Cinnabar (HgS) was exploited since the Etruscan times [23], but the very first explorative studies were carried in 1846 while the industrial activity officially started in 1899 when the Cermak Spirek furnaces were ignited [16]. Since then, the production of mercury strongly increased, and in 1925 at least 50% of mercury worldwide was provided by the Mt. Amiata mining area [24] and about 70% of it was produced from that of Abbadia San Salvatore, which is located in the eastern flank of the Mt. Amiata (Figure 1a,b). The mining activity shut down in 1976 after almost one century due to the rapid decrease of the mercury demand and the increasing consciousness about its toxicity and noxiousness. It was estimated that more than 100,000 tons of mercury were produced from roasted cinnabar, and about 10,000 tons of gaseous mercury were dispersed in the environment, e.g., [16,23]. The Abbadia San Salvatore mining complex covers about 65 ha and hosts Gould and Nesa furnaces, which are occurring into two distinct buildings, and workers’ edifices, driers, condensers and laboratories for the production of pigments [17].
Numerous scientific studies and reports highlighted the environmental impact due to the mining activity that affected the geological and biological compartments, e.g., [16,22,25,26,27,28] and [29,30,31]. The remediation actions were consequently dictated by the regional authorities that established specific guidelines. The indoor and outdoor Gaseous Elemental Mercury (GEM) concentrations are expected to be <500 and <300 ng·m−3, respectively. Surface and groundwaters as well as leachable (after the interaction of CO2-saturated MilliQ water with the target product) mercury of synthetic products and geological (e.g., soil) materials inside the mining area are to be <1 μg·L−1, once the remediation will be completed. In 2008, an agreement between the Municipality of Abbadia San Salvatore and the owner of the mining concession E.N.I. (National Agency for Hydrocarbons, AGIP Division) was signed and aimed at an environmental rehabilitation of the mining area (including buildings and structures) for museum purposes and public green areas [17].
Since 2010, efforts have been made by the local authorities to evaluate the GEM concentrations indoor and outdoor the mining structures and, as expected, the edifices hosting the Gould and, though at a minor extent, Nesa furnaces resulted in being highly contaminated. The former building was parceled into several portions and GEM concentrations were repeatedly measured since 2016 with the highest values (>50,000 ng·m−3) recorded in the warmer months (July to September) [16,17]. In such Hg-rich environment, building materials (e.g., concrete, bricks, plaster and painting) can act as Hg-absorbers [18,19]. It was indeed evidenced that these synthetic materials in the building hosting the furnaces were characterized by high concentrations of total and leachable mercury (up to >10,000 mg·kg−1 and >1000 μg·L−1, respectively) at the surface, whereas the mercury contents were abruptly decreasing inwards [17] according to [18,19].
3. Materials and Methods
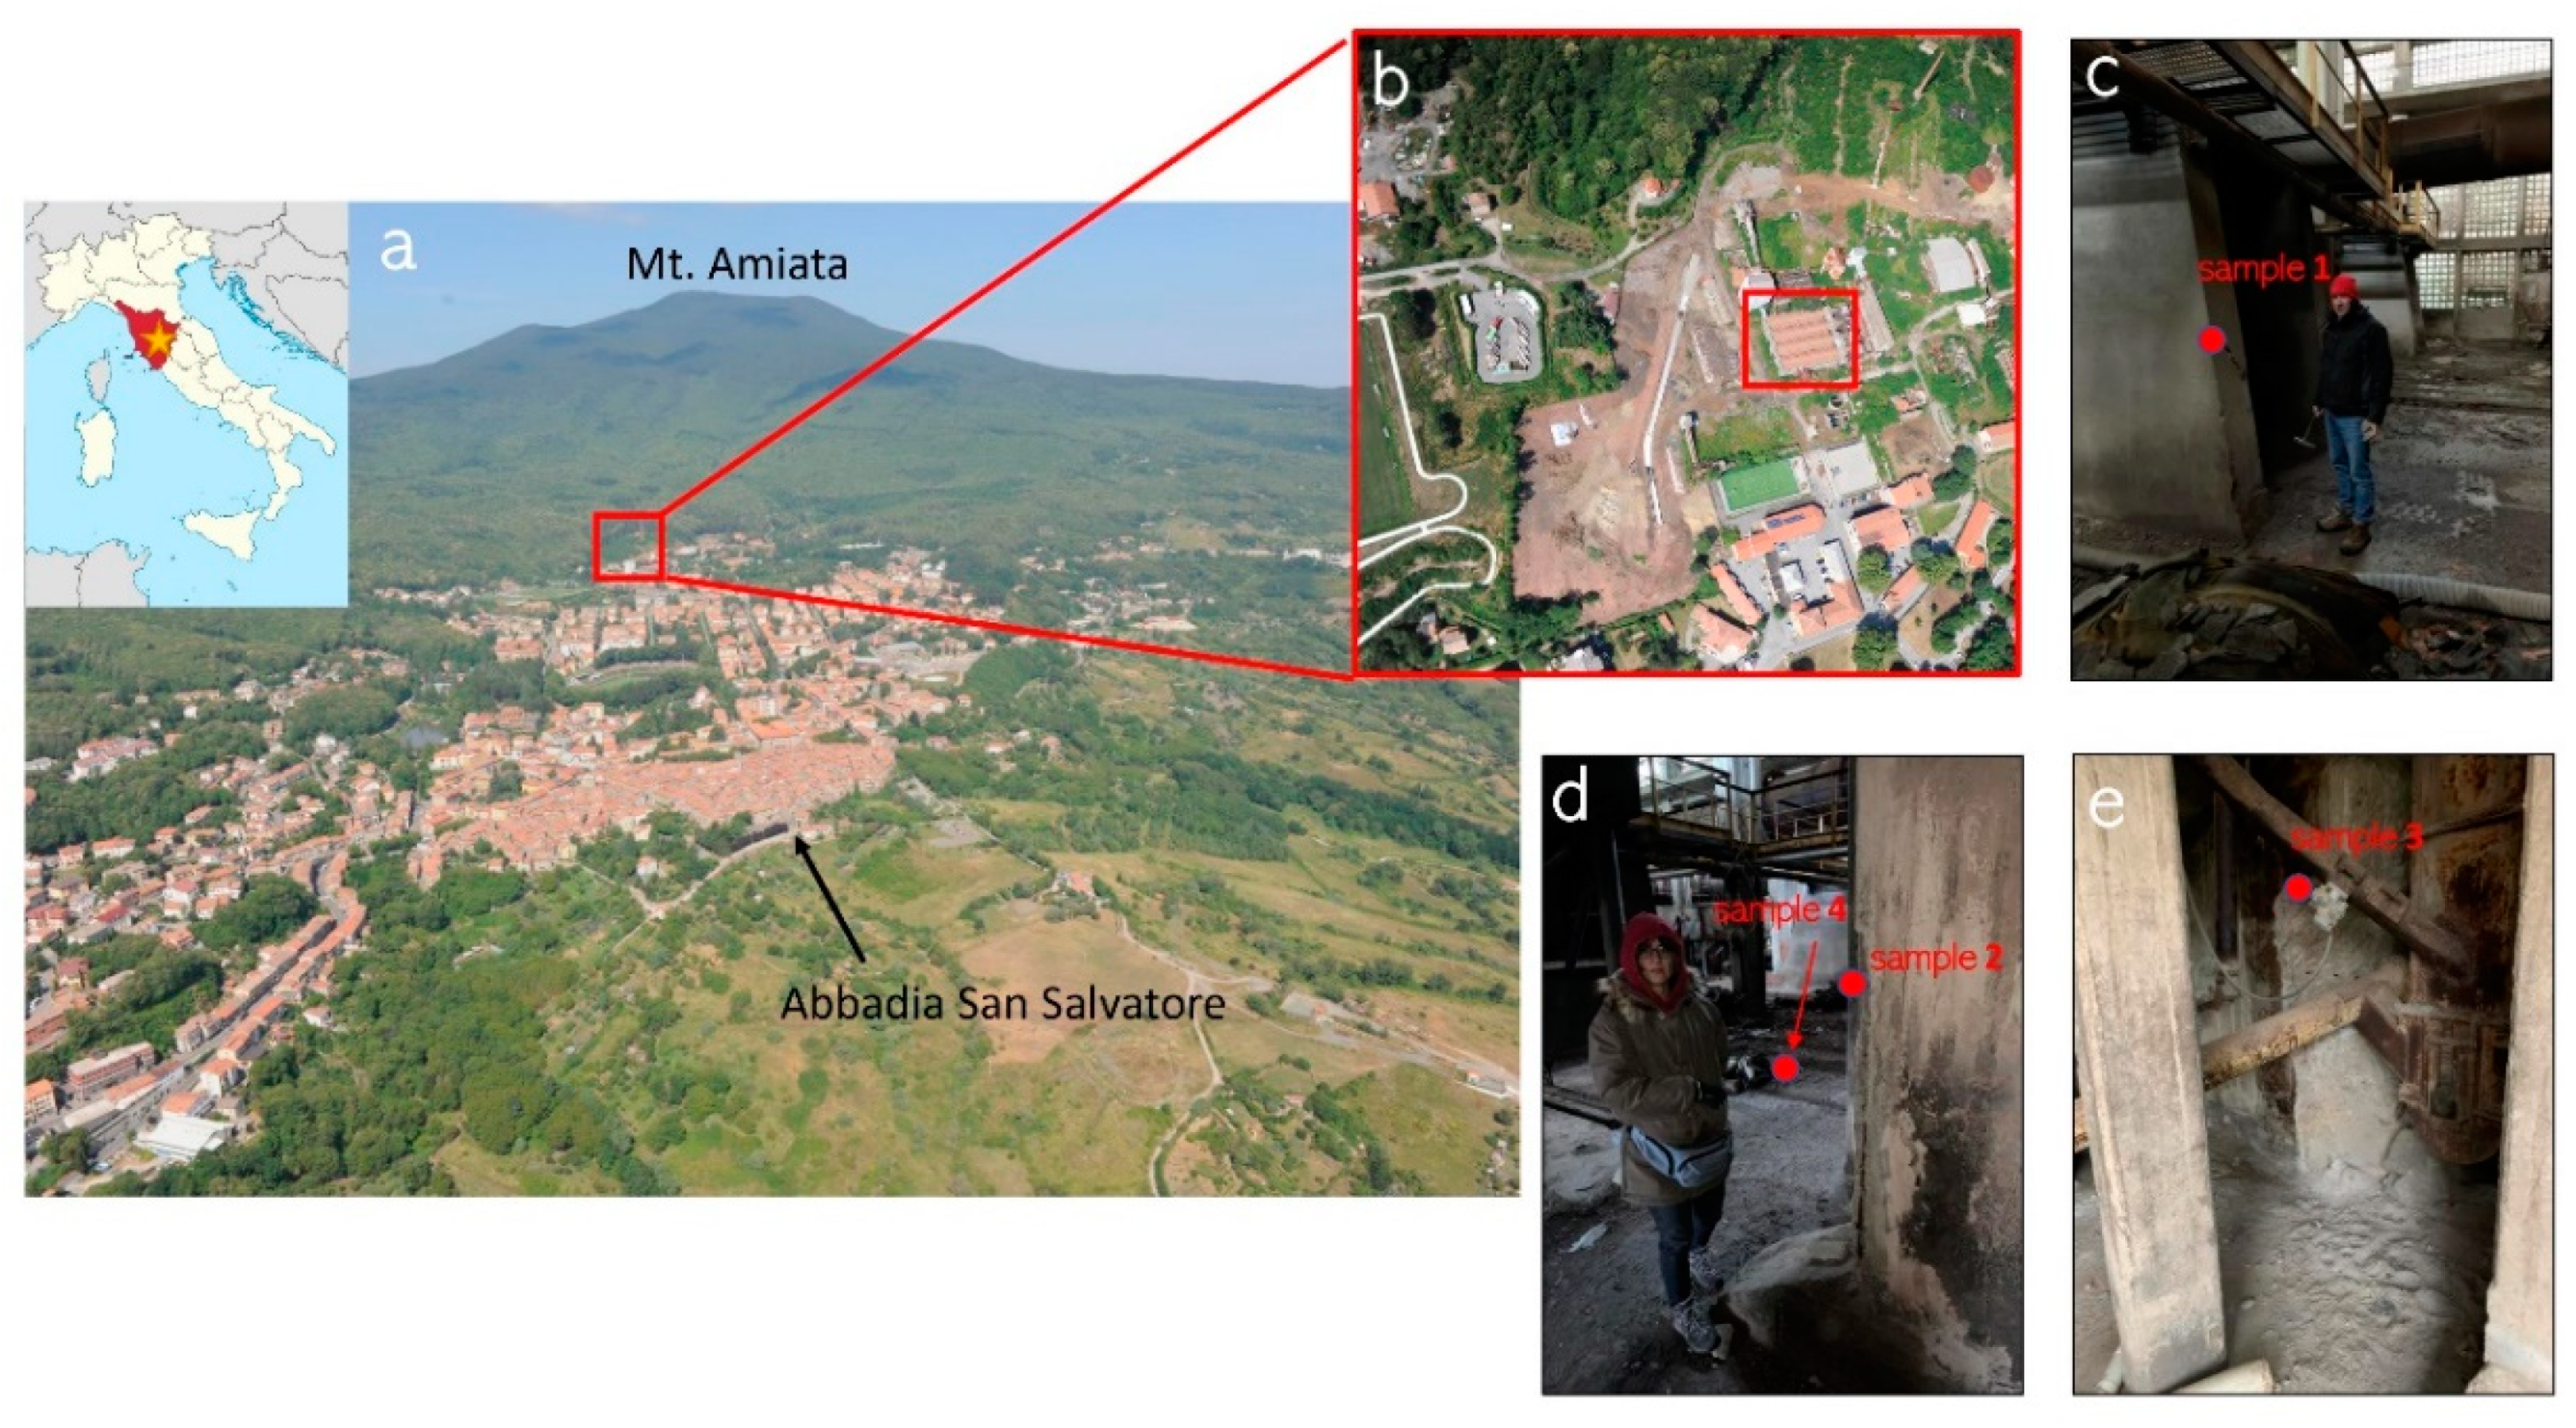
According to previous studies carried out in the former mining area of Abbadia San Salvatore [16,17], four samples of synthetic materials were selected from the edifice hosting the Gould furnaces (Figure 1b), i.e., the most Hg0-contaminated building, being the core of the whole industrial process [16,17]. The anthropic materials were, as follows: (i) sample 1: a piece of concrete collected from one of the main pillars (Figure 1c) and located approximately in the middle of the edifice; (ii) sample 2: a piece of concrete from another pillar, positioned at about 5 m from the open-to-the-air rare entrance of the edifice (Figure 1d); (iii) sample 3: a rock fragment from the wall of a fume tubing (Figure 1e) and (iv) sample 4: a tile fell down from the roof two years ago during a thunderstorm (Figure 1e). The samples were about 2 kg each.
As a first step, each sample was sawed to have fragments of about 10 × 10 × 10 cm with the exception of the tile roof, is characterized by a different morphology, whose fragments were 10 × 10 × 3 cm. A fragment from each synthetic material was crashed and grinded with a planetary mill for the determination of total and leachable mercury. Two fragments from each sample were used for analyzing the release of GEM content, as described below. Eventually, the last fragment was kept as a supplementary aliquot. The pH was measured with a Crison MM-40+ after adding 25 mL of MilliQ water to 2.5 g of powder material. Samples were stirred with a glass rod every 1 h, and after 8 h, the pH was determined.
To analyze the concentration of total mercury, the samples were digested with aqua regia following the method UNI EN 13,657:2004 and analyzed by ICP-AES (720 ES Agilent, Santa Clara, CA, USA) at the Laboratories of Gruppo CSA Ricerche (Rimini, Italy), according to the UNI EN ISO 11885:2009 recommendations. Leachable mercury was measured by weighing 10 g of powdered material into a 100 mL beaker to which 50 mL of CO2-saturated MilliQ water (obtained by bubbling pure CO2 into a Pyrex® bubbler, Corning Incorporated, Corning, NY, USA, previously cleaned with suprapur HCl, Merck KGaA, Darmstadt, Germany) for 15 min to reach a pH of about 4.5, to simulate the interaction between synthetic materials and meteoric waters [32]. The suspension was periodically swirled for about 3 h and allowed to decant overnight. The supernatant was filtered at 0.45 μm with cellulose nitrate filters. Mercury was then analyzed by ICP-MS (7500ce Agilent, Santa Clara, CA, USA) at the Laboratories of Gruppo CSA Ricerche (Rimini, Italy). The mercury measurements were carried out according to the EPA: 7473 2007. The analytical error for total and leachable mercury was <10%.
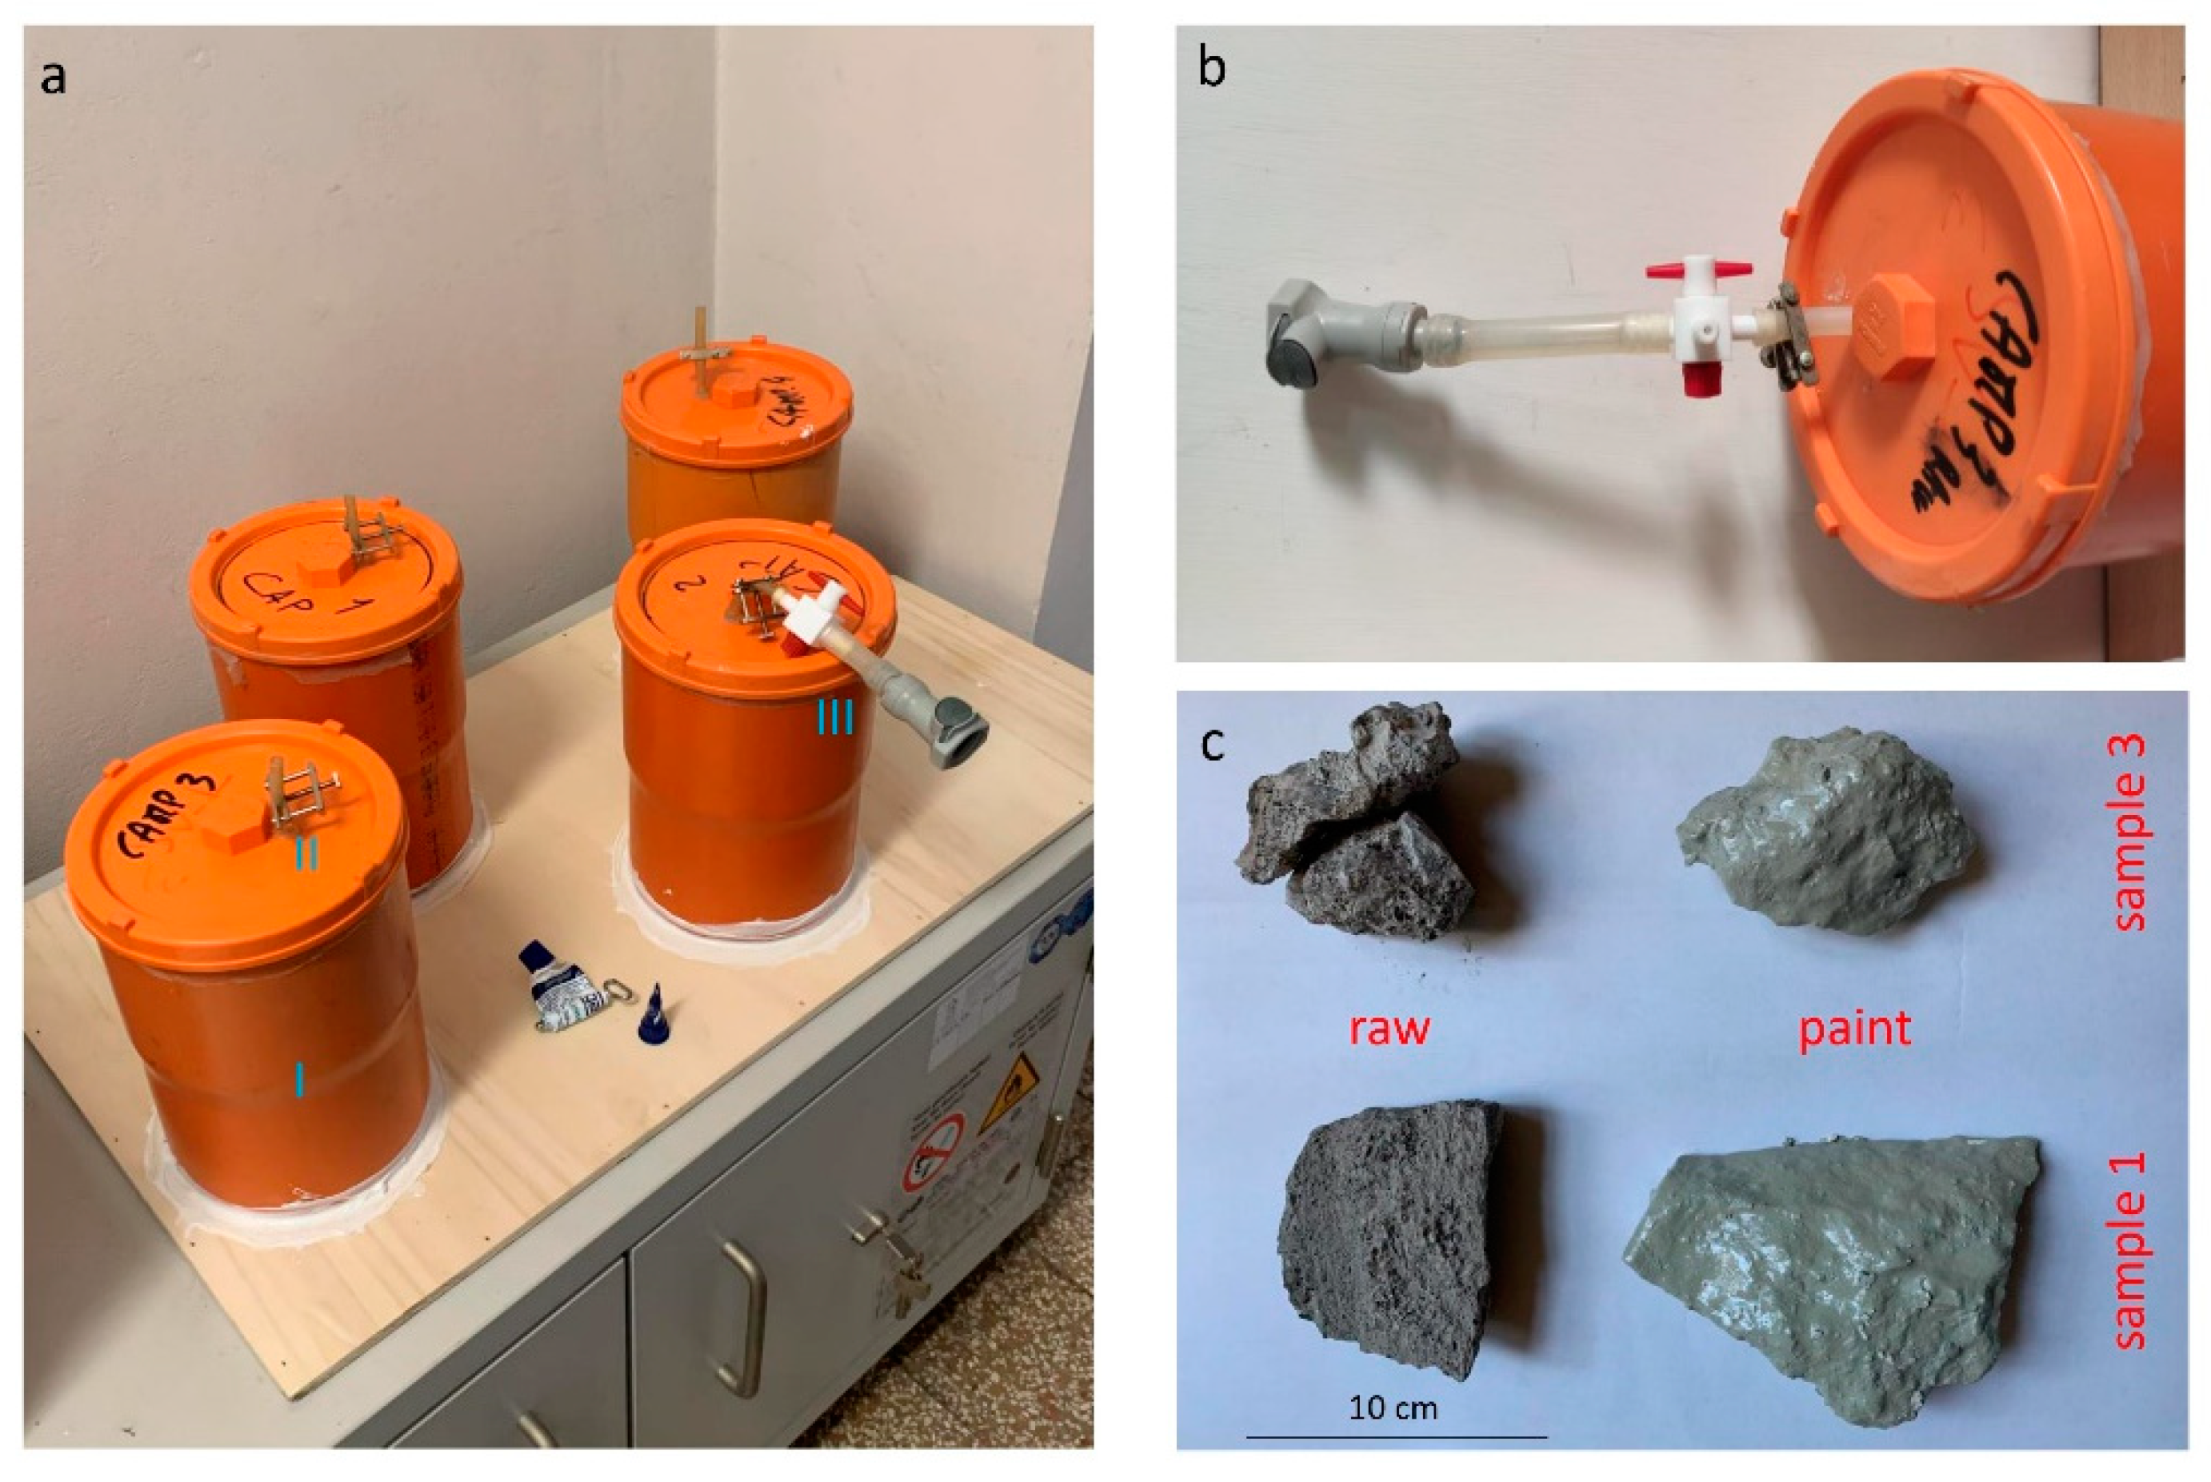
To measure the amount of GEM released, two fragments from each (total weight: sample 1: 344 g; sample 2: 590 g; sample 3: 245 g; sample 4: 433 g) were positioned below PVC cylindrical chambers (24 cm × 17 cm, volume = 5.4 × 103 cm3). At the top of the cylinders, a three-way valve was connecting the inner part of the chambers to a 60 mL syringe by a Rilsan® tube (Arkema, Colombes, France) that was closed with a hose clamp. The base of each cylindrical chamber was sealed with silicone paste to avoid any contact with the atmosphere, ensuring that the released Hg0 content was only associated with the synthetic material. The cylindrical chambers, the three-valve and the connecting pipe (which replaced the syringe prior to the analysis) to the instrumentation used to measure Hg0 are shown in Figure 2. The GEM content released by the synthetic materials was measured with different exposure times with a portable mercury analyzer Lumex® RA-915M (Lumex Instruments, Abbotsford, BC, Canada) to perform real-time Hg0. After each test, the cylindrical chambers were lifted up to allow new air to enter, thus avoiding memory effects. The accuracy of the method was 20%. The detection limit was governed by shot noise and equals CaDL (Characteristic Absolute Detection Limit) of 2 ng·m−3 (average measuring time = 5 s) and CaDL = 0.3 ng·m−3 (average measuring time = 30 s) at a flow rate of 12–13 L·min−1. The Lumex RA-915M dynamic range covered four orders of magnitude (2–50,000 ng·m−3) [33]. Before connecting the Lumex RA-915M with the three-way valve, the air in the laboratory was measured and resulted in always below 30 ng·m−3. Prior to each measurement, the air into the chambers was homogenized with the syringe to avoid stratification. During the recordings, the frequency of the data distribution mimics that of a Gaussian and the highest value was recorded and used for our purpose.
Since two samples (#1 and #2) showed significantly high GEM concentrations, they were used to test a paint that was supposed to be able to minimize the release of gaseous mercury from any kind of material. Thus, one of the two fragments from #1 and #2 was “painted,” whereas the other one (named “raw”) was left unpainted in order to compare the GEM values by using the cylindrical chambers as previously described (Figure 2c). The testing paint was consisting of three components: a base of lime with a density of about 500 g·m2 and an epoxy resin (component A) and a hardener (component B). After each painting, the materials were left dried in the open air for 24 h. No Hg0 measurements were carried out while the painted samples were drying.
4. Results
4.1. Total and Leached Hg
The concentrations of total and leachable mercury (in mg·kg−1 and μg·L−1, respectively) in the four samples are reported in Table 1. Total mercury was ranging between 16.9 (#4) and 242 (#3) mg·kg−1. The highest leachable Hg concentrations (up to 1350 μg L−1) were recorded in those samples where the highest contents of total mercury were measured, as already evidenced in [16]. The highest total and leachable Hg ratios pertained to #4 (33,800), whereas the lowest ones were relative to #1 (219) and #3 (179). The total and leachable Hg concentrations were within the analytical interval of the anthropic materials reported in [16] for similar samples collected from the building hosting the Gould furnaces. It is to mention that the pH of the analyzed samples was slightly alkaline and ranging between 8.1 and 8.3, which is typical for materials affected by degradation [34].
4.2. Release of Hg0 from Anthropic Materials
Measurements of the release of gaseous mercury from the studied materials were carried in four different days between December 2019 and January 2020. The same exposure times (between 1.40 to 7.00 h) for each batch of analysis were used to evaluate whether the release mercury was increasing in all samples accordingly. The results are reported in Table 2.
Independently on the exposure time, #4 showed the lowest Hg0 concentrations (from 29 to 115 ng·m−3). Higher contents of gaseous mercury (up to 1086 ng·m−3) were recorded in #2, indicating a slight increase with the exposure time. However, #1 and #3 registered the highest Hg0 concentrations. It is to mention that due to technical problems, in #1 Hg0 after 1.48 h was not measured. Nevertheless, when considering the exposure time of #3 (2.03 h), 1570 ng·m−3 were measured. Sample 1 showed a Hg0 content up to 3221 ng·m−3 on 24 December, 2019 while in January 2020, the highest content was 2625 ng·m−3 after 6.45 h. Sample 4 was instead characterized by strikingly high gaseous mercury concentrations that tended to increment with the exposure time and up to 7563 ng·m−3 of gaseous mercury were measured.
4.3. Comparing the Hg0 Concentrations between “Painted” and “Raw” Materials
Since one of the aims of this study was to test our method to verify whether specific paintings are able to reduce or minimize the release of Hg0 from synthetic materials, the two most emitting samples (#1 and #3) were chosen and properly treated. To the best of our knowledge, experimental tests of paint characterized by Hg0-rich samples have never been performed before. The two fragments from #1 and #3 were divided, as follows: one fragment was “painted” whereas the other one was let as it was (“raw”, hereafter). Consequently, the “painted” and “raw” fragments from #1 and #3 were positioned into the 4 cylindrical chambers and the concentration of the released Hg0 was measured as previously described. The exposure time was varied and progressively increased from about 2 to >170 h. In order to better compare the results, the weights of the “raw” and “painted” fragments of each sample were as similar as possible (about 150 g each). It is to note that no exponential or linear increments as the exposure time was increasing were recognized. As far as #3 is concerned, both the “painted” and “raw” samples after >170 h showed Hg0 concentrations that did not significantly differ from those recorded after about 95.4 h (Table 3). Setting aside #3, after about 2 and 6 h, the release of Hg0 from the “raw” samples was always lower than the corresponding “painted” sample (Table 3).
5. Discussion
The high concentrations of total and leachable mercury (up to 242 mg·kg−1 and 1350 μg·L−1, respectively) determined in the studied samples are likely associated with the elevated concentration of Hg0 occurring in the building where they were collected, although significant differences were recognized. The sample position and the typology of the studied samples likely played a key role. Samples #1 and #3 were indeed fragments from a pillar located not far from the rear entrance of the Gould-hosting edifice and from a roof tile recently fallen down into the edifice, respectively. Conversely, #1 and #3 were collected from a pillar in the inner part of the same edifice and a rock wall from a fume tubing, respectively, thus affected by GEM contents that in the summer period may reach >50,000 ng·m−3. In addition, porosity favors the absorption process of mercury. According to [34,35] and references therein concrete has a porosity that varies between 15 and 25% while that of the rock-wall is likely higher although no specific measurements were carried out. However, visual observation indicated that the material was consisting of a friable and hydrothermally altered volcanic rock. It is not clear how the adsorption process may be occurring but it is remarkable the fact that the less exposed samples (#2 and #4) showed Hg contents (total and leachable) lower than more than one order of magnitude when compared to those determined in samples 1 and 3 (Table 1). The pH values determined in the studied samples are not apparently playing any role since they were varying in a very narrow range (8.1–8.3). Thus, the pH only suggests that the investigated samples were affected by deterioration, as it is expected for materials left abandoned for more 30 years.
The ability of Hg0 in entering any kind of surface is also testified by techniques to determine porosity by mercury intrusion [36,37] and references therein. The processes that favor the stabilization and mobility of mercury need to be clarified and require specific investigations that were not within the aims of the present paper. It is indeed a matter of fact that the four synthetic materials showed different concentrations of released Hg0. The measured values were in agreement with the amount of total and leachable mercury concentrations, i.e., the higher the concentrations of Hg the higher the amount of emitted Hg0. This would also suggest that the higher the GEM concentrations to which the materials were exposed the higher the capability of Hg-absorption and –release. Consequently, a persistent emission of Hg0 since the closure of the mining activity at Abbadia San Salvatore is still active, as demonstrated by the high GEM contents in the indoor and outdoor edifice [16].
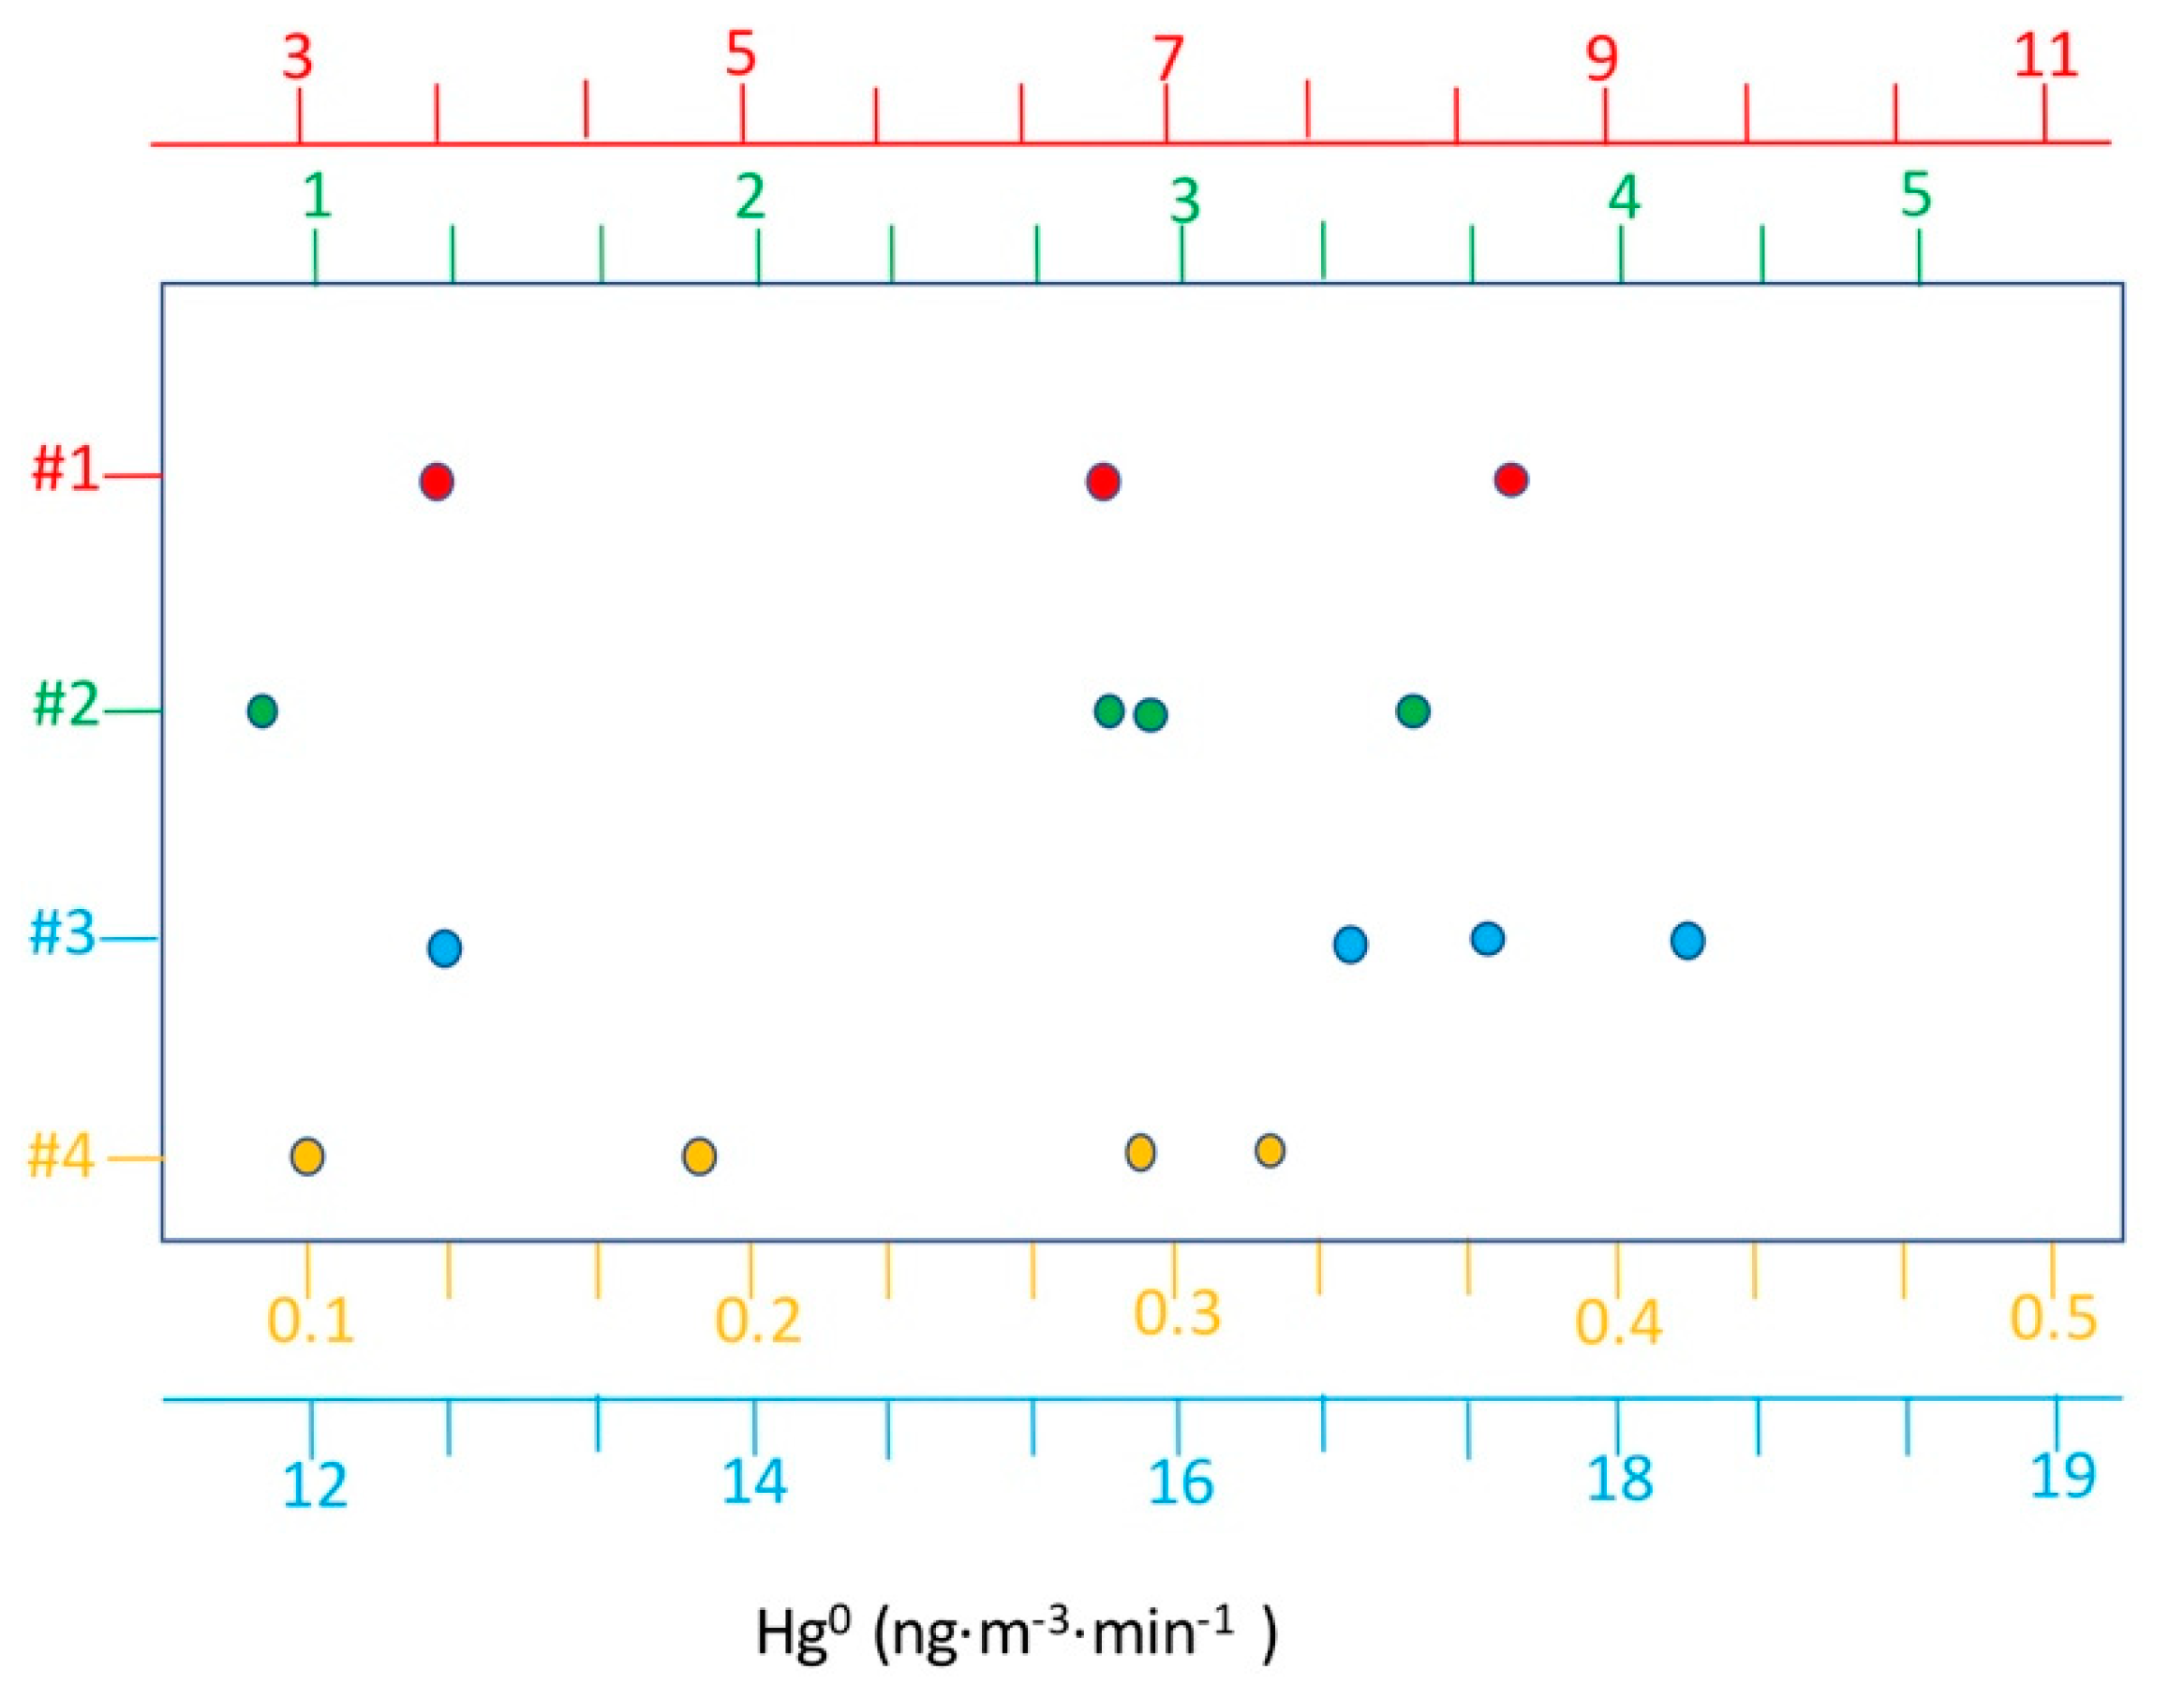
To normalize the amount of Hg0 emitted by the studied materials, the Hg0 concentrations were divided by the exposure time (expressed in minutes; Figure 3). The low Hg0 emitter samples, i.e., #2 and #4, showed Hg0 desorption values from 0.8 to 3.5 ng·m−3·min−1 and from 0.11 to 0.3 ng m−3·min−1, respectively, whereas #1 and #3 released significantly higher values, up to 8.6 and 18.9 ng·m−3·min−1, respectively (Figure 3), for exposure times from 1.48 to 7.00 h (Table 2). If a constant release of Hg0 of 16.5 ng·m3·min−1 (mean value derived by 4 measurements carried out for #3) after the closure of the mining activity (1976) is assumed, it is possible to provide a rough estimate of the amount of Hg0 released from the concrete that is hosted in the Gould edifice. As already observed by [16,17], the great majority of absorbed Hg0 from the surrounding areas is distributed at the surface of the synthetic materials. Hence, knowing the surface of the concrete (3897 m2) in the edifice where the Gould furnaces are located, it is possible to calculate how many grams of GEM have been released from 1976 to 2020. First, the ng·m−3·min−1 were transformed into ppb by vol. and then, the amount of gaseous mercury released in the last 44 years by the concrete walls was computed in about 178.3 g of Hg0 at 20 °C and 1 atm. This value has to be taken with caution since several factors may affect the computed concentration, such as temperature and pressure variations in winter and summer periods [3]. Nevertheless, this example may be representing a possible application of the proposed method. The most relevant result is however the possibility to verify how much mercury can be released from any kind of natural and synthetic material.
According to [38], indoor surfaces are adsorbing Hg0 when subjected to mercury vapor at room temperature and 203Hg concentration of 0.32 ± 0.04 mg·m−3, i.e., much higher than those recorded inside the Gould furnace-bearing building, for 20 days. The experimental runs by [38] evidenced that different materials (glass, wall paper, oil- and water-based paint, and so forth) were able to adsorb and desorb Hg vapor at different rates based on the exposure time (0.7 to 200 days). This finding agrees well with the results of our study, although the duration of our measurements was generally lower.
Several pretreatment techniques can be used to reduce water absorption or decrease porosity, e.g., [37] and then, avoid Hg absorption as in the case of edifices used to produce liquid Hg. However, they can be rather expensive and consequently, we attempted to verify whether coating protective paints may be able to prevent or minimize the release of Hg0 from synthetic materials as in the case of the studied products. Surface preparation and successive applications of coating paints are widely used to avoid, for example, particles of dust, powder, and rust to be dispersed into the environment because they may be containing toxic substances or corrosive agents, e.g., [38]. In this work, a coating paint, provided by a private company, was tested. To maximize the efficiency of the coating paint, the application procedure suggested by the supplier company was strictly followed. Samples 1 and 3, which showed the highest concentrations of released Hg0 (Table 2 and Table 3), were carefully cleaned to favor the impregnation of the paint. Then, the three-component paint was applied. Once stored inside the cylindrical chambers, the released Hg0 was measured as previously described. Following the same approach used in the first step of measurements, the incremental rate of Hg0 per minute was calculated. Strikingly, the Hg0 concentration measured for the “painted” material was systematically higher than that related to the “raw” materials (Table 3 where the Hg0 values are reported as ng·m−3) with the exception of the first run of #3 that lasted for about 2 h, with values of 20.7 and 24.1 ng·m−3·min−1, respectively. The results of the Hg0 (expressed in ng·m−3·min−1) released with time by the “raw” and “painted” samples are summarized in Figure 4, where the exposure time inside the cylindrical chambers increases from 1 to 7 (from 2 h in 5 March to 171 h, when the experiment started in 7 March 2020; Table 3). Independently by the “raw” and “painted” samples, the longer the exposure time the lower the incremental rate. It is a matter of fact that after 2 h (5 March 2020), samples 1 (“raw”) and 3 (“raw”) evidenced an Hg0 of 2.2 and 12.3 ng·m−3·min−1, respectively, while the respective “raw” samples showed 6.2 and 10.3 of 24.1 ng·m−3·min−1, respectively. Then, after ca. 171 h, the Hg0 values dropped down to <1.2 ng·m−3·min−1. This implies that in these experiments the exposure time is a critical factor since after a few hours the atmosphere inside the cylindrical chambers is likely saturated in Hg0 although it is clear that the “painted” material is largely more able to emit Hg0 with respect to the “raw” material. This observation indicates that when the exposure time overcomes a few hours, the adopted procedure does not allow to record an Hg0 increment. Consequently, the amount of released Hg0, the volume of cylindrical chambers and the sample dimensions are parameters to be considered when this procedure is to be adopted. It is possible to speculate that an equilibrium between the released and absorbed Hg0 may be achieved when the exposure times are >6 h. For example, when the incremental rate of #3 (“painted”) is indeed taken into account, the higher value was recorded after 2 h (Table 3). Hence, it is possible to state that the coating paint used in this work was not minimizing the release of Hg0 but it was acting as an absorber when compared to the “raw” product as evidenced by [38] for water-based paint. Independently on the capability to attract or release mercury, it is clear that the proposed method allows to quickly reveal whether any kind of material (previously subjected to medium-to-high concentrations of GEM) is able to act as an Hg0 emitter.
The amount of released Hg0 can also be estimated. As previously stated, there is no need to measure Hg0 for more than 6–7 h when cylindrical chambers and samples with a relatively small volume are used. The air inside the chamber is likely to be saturated in Hg0 afterwards and a sort of equilibrium between the local atmosphere and the product under examination is established. More specific investigations are thus to be carried out to have constraints about the absorption–desorption process occurring inside the cylindrical chambers.
6. Conclusions
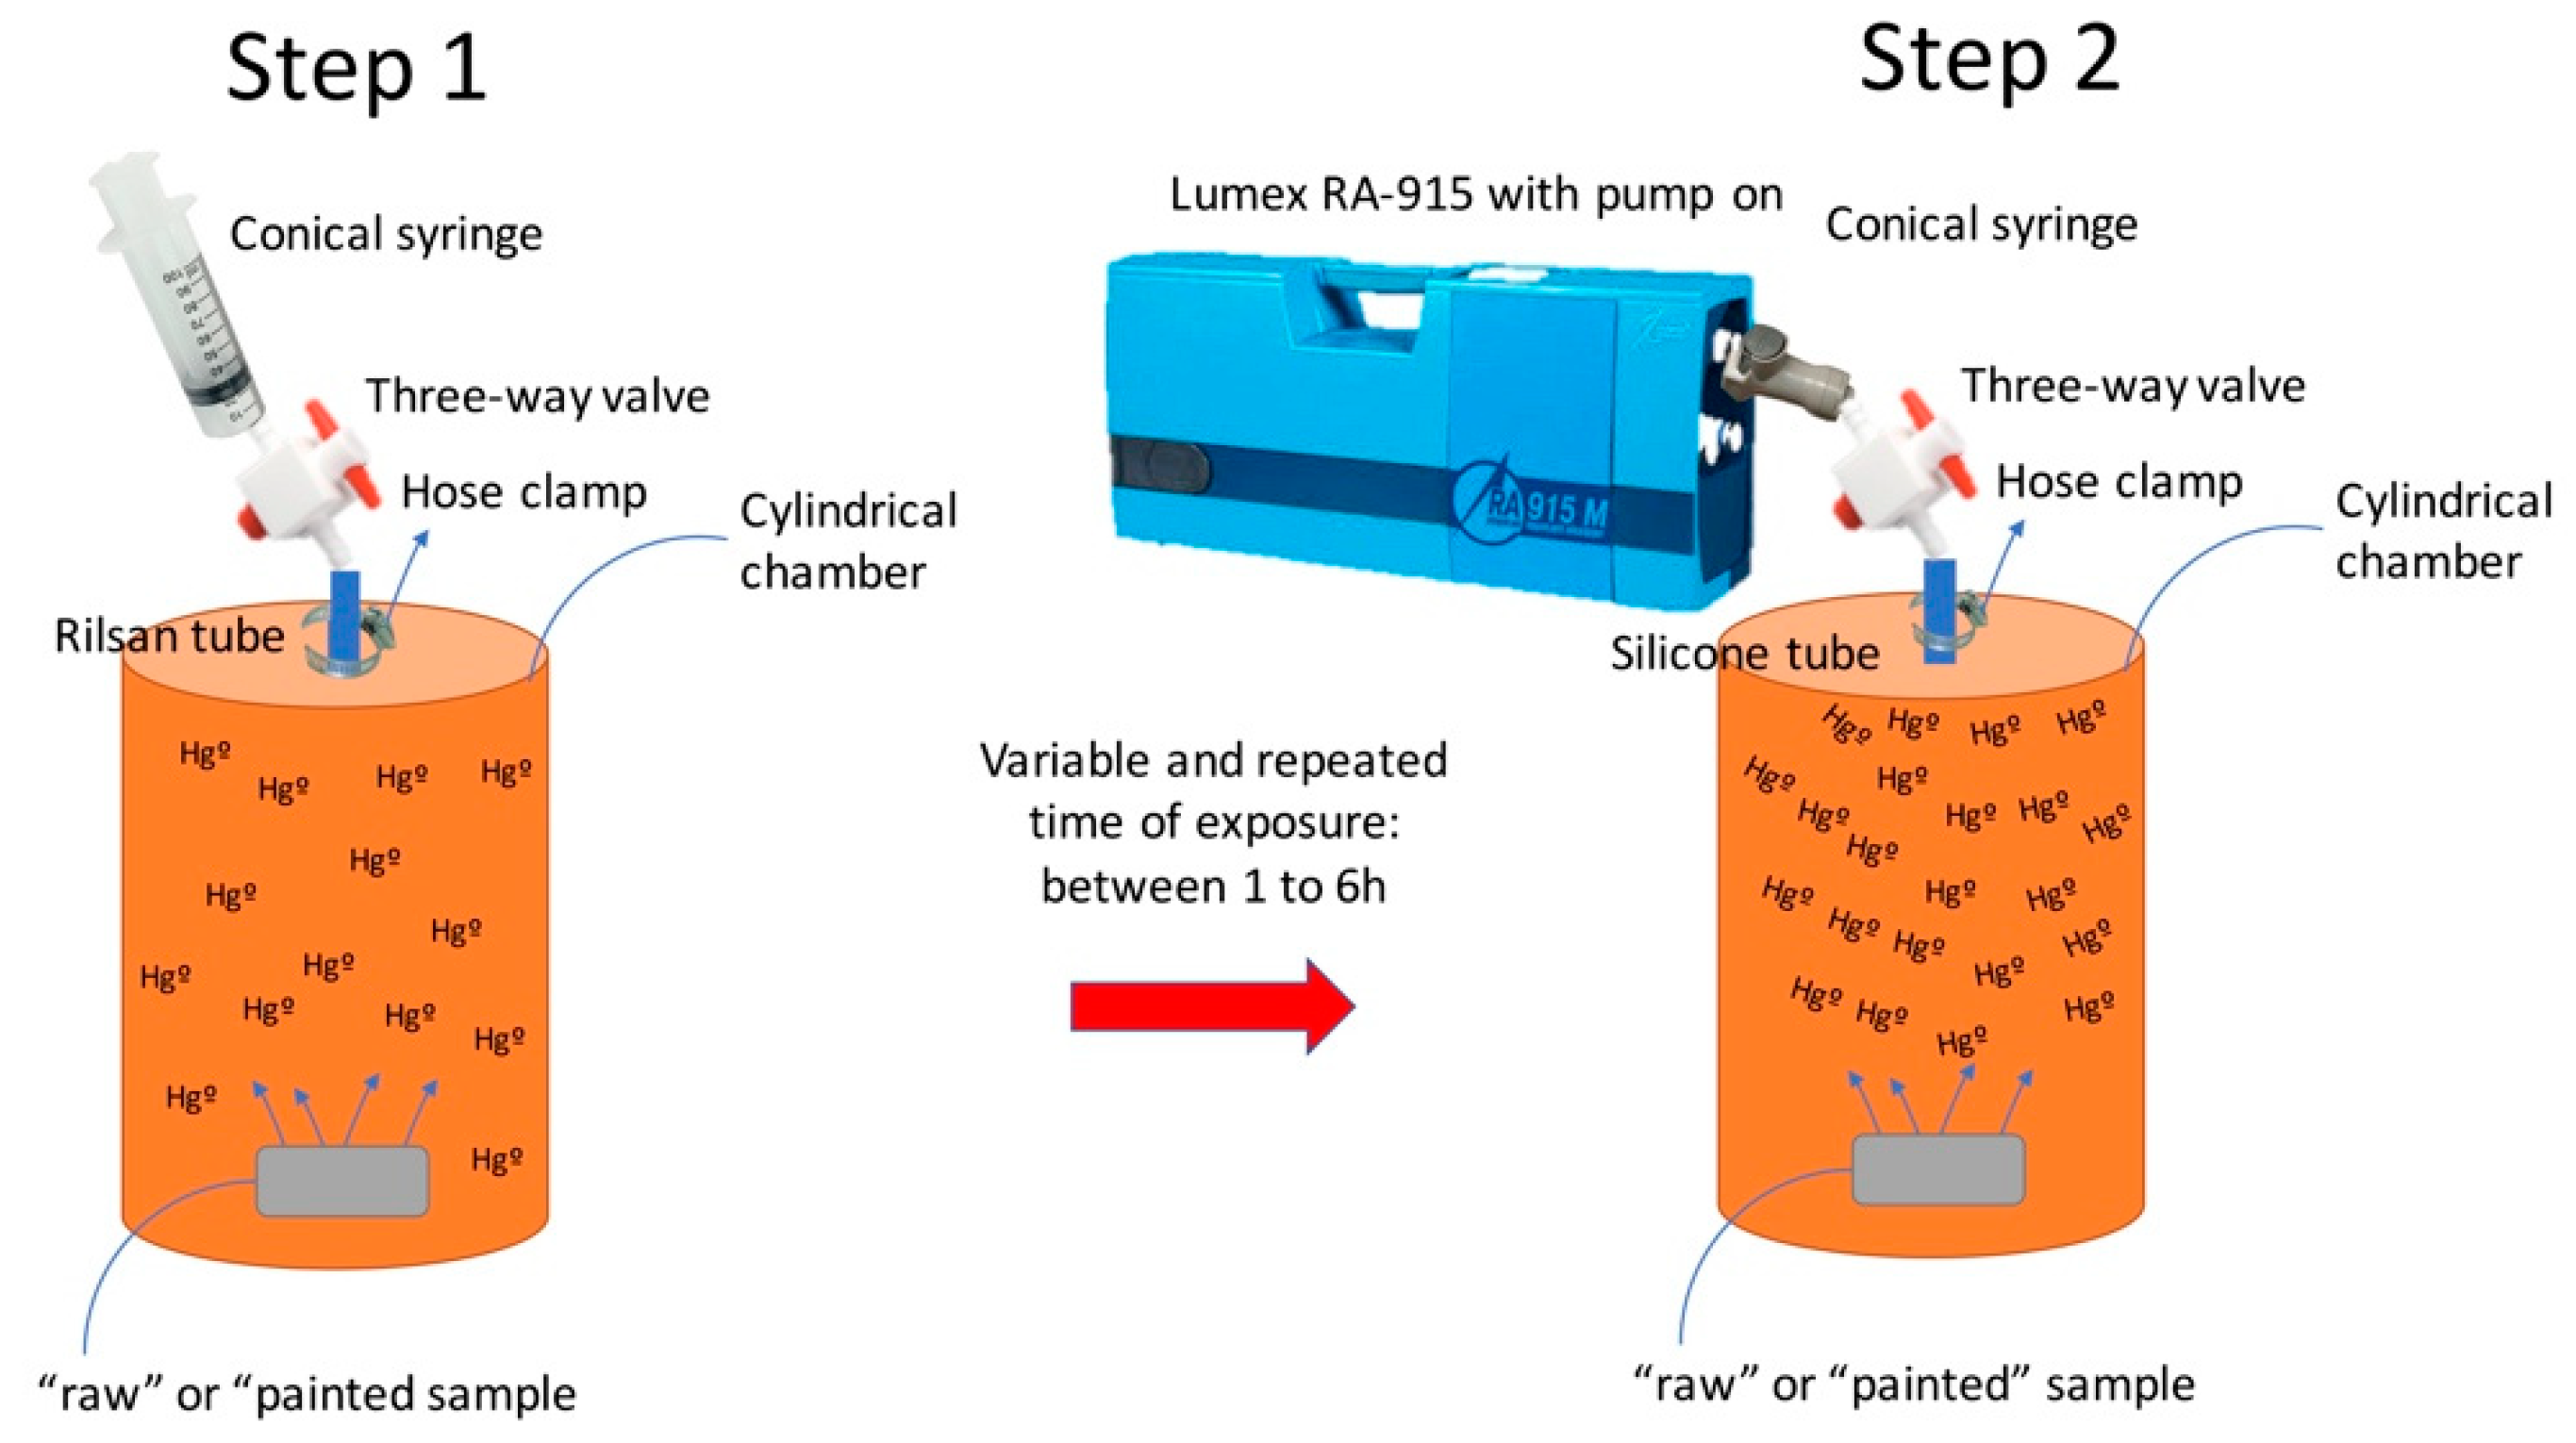
Considering the requalification of industrial-mining sites to museums or public areas where the production of liquid mercury has been active for a long time (such as the case of Abbadia San Salvatore), investigations to evaluate whether the synthetic materials are still emitting gaseous mercury are of pivotal importance. The proposed approach is a quick and low-cost method that allows to determine how fast and how much gaseous mercury is released. The tested methodology has other several advantages since it allows to: (i) save money if low Hg0 concentrations are measured, i.e., no further actions are to be carried out and (ii) test coating paints to verify their efficiency to minimize or prevent the emission of Hg0. Nevertheless, preliminary studies aimed at determining both indoor and outdoor GEM concentrations and the amount of total and leachable mercury are required. In the first case, it is possible to understand whether concrete, rock-wall, roof tiles, bricks, metals and rust might have been able to absorb Hg0 whereas in the second case the relationship observed between total and leachable and absorbed Hg might be able to predict the amount of Hg that could be released, as already reported in [16,17] and further supported by this study. The procedure adopted in this study is schematized in Figure 5 where the two main steps are reported. Further investigations should be able to understand how Hg0 is allocated in the synthetic (or natural materials) and how the absorption-desorption process is functioning. Moreover, tests on Hg-rich samples should be carried by using larger cylindrical chambers to avoid a steady-state phase since no Hg0 increments were observed when using longer exposure times.
Author Contributions
Conceptualization, O.V., B.N.; methodology, O.V., M.L.; formal analysis, O.V., M.L., B.N. and J.C.; investigation, O.V., D.R.; data curation O.V., M.L.; writing—original draft preparation, O.V., M.L., B.N. and J.C.; writing—review and editing, O.V., M.L., B.N., J.C., D.R.; funding acquisition, O.V., D.R. All authors have read and agreed to the published version of the manuscript.
Funding
This research received no external funding.
Acknowledgments
F. Piccinelli and A. Esposito are gratefully acknowledged for their help during the sampling activity. The Municipality of Abbadia San Salvatore and the Parco Museo Minerario di Abbadia San Salvatore are kindly thanked for the permission to enter the mining area. The two anonymous reviewers are warmly thanked for their useful comments and suggestions that improved an early version of the manuscript. Dylan Dong is acknowledged for handling this paper.
Conflicts of Interest
The authors declare no conflict of interest.
References
- Harada, M. Minamata Disease: Methylmercury Poisoning in Japan Caused by Environmental Pollution. Crit. Rev. Toxicol. 1995, 25, 1–24. [Google Scholar] [CrossRef] [PubMed]
- Yokoyama, H. Mercury Pollution in Minamata; Springer Science and Business Media LLC: Berlin/Heidelberg, Germany, 2018. [Google Scholar]
- Hong, Y.-S.; Kim, Y.-M.; Lee, K.E. Methylmercury Exposure and Health Effects. J. Prev. Med. Public Health 2012, 45, 353–363. [Google Scholar] [CrossRef] [PubMed] [Green Version]
- Rosenfeld, P.E.; Feng, L.G. Mercury, BPA, and Pesticides in Food. In Risks of Hazardous Wastes; Elsevier: Amsterdam, The Netherlands, 2011; pp. 223–235. [Google Scholar]
- Chan, H.M. Advances in Methylmercury Toxicology and Risk Assessment. Toxics 2019, 7, 20. [Google Scholar] [CrossRef] [PubMed] [Green Version]
- Broussard, L.A.; Hammett-Stabler, C.A.; Winecker, R.E.; Ropero-Miller, J.D. The Toxicology of Mercury. Lab. Med. 2002, 33, 614–625. [Google Scholar] [CrossRef]
- Bernhoft, R.A. Mercury Toxicity and Treatment: A Review of the Literature. J. Environ. Public Health 2011, 2012, 1–10. [Google Scholar] [CrossRef] [PubMed]
- Clarkson, T.W. Mercury: Major issues in environmental health. Environ. Health Perspect. 1993, 100, 31–38. [Google Scholar] [CrossRef] [PubMed]
- Mason, R.P.; Pirrone, N. Mercury Fate and Transport in the Global Atmosphere: Emissions, Measurements and Models; Springer: New York, NY, USA, 2009; p. 627. [Google Scholar]
- Driscoll, C.T.; Mason, R.P.; Chan, H.M.; Jacob, D.J.; Pirrone, N. Mercury as a Global Pollutant: Sources, Pathways, and Effects. Environ. Sci. Technol. 2013, 47, 4967–4983. [Google Scholar] [CrossRef]
- Spitz, K.; Trudinger, J. Mining and the Environment; CRC Press: Boca Raton, FL, USA, 2019. [Google Scholar]
- Vouk, V.B.; Fugaš, M.; Topolnik, Z. Environmental Conditions in the Mercury Mine of Idria. Occup. Environ. Med. 1950, 7, 168–176. [Google Scholar] [CrossRef] [Green Version]
- Ladd, C.; Zusin, E.; Valic, F.; Almonte, J.B.; Gonzales, T.V. Adsorbtion and excretion of mercury in miners. J. Occup. Med. 1966, 3, 127–131. [Google Scholar] [CrossRef] [PubMed]
- Bellander, T.; Merler, E.; Ceccarelli, F.; Boffetta, P. Historical Exposure to Inorganic Mercury at the smelter works of Abbadia San Salvatore, Italy. Am. Occup. Hyg. 1998, 42, 81–90. [Google Scholar] [CrossRef]
- United Nations Environment Programme (UNEP). Global Mercury Assessment 2013: Sources, Emissions, Releases and Environmental Transport; UNEP Chemicals Branch: Geneva, Switzerland, 2013. [Google Scholar]
- Vaselli, O.; Nisi, B.; Rappuoli, D.; Cabassi, J.; Tassi, F. Gaseous Elemental Mercury and Total and Leached Mercury in Building Materials from the Former Hg-Mining Area of Abbadia San Salvatore (Central Italy). Int. J. Environ. Res. Public Health 2017, 14, 425. [Google Scholar] [CrossRef] [Green Version]
- Vaselli, O.; Rappuoli, D.; Bianchi, F.; Nisi, B.; Niccolini, M.; Esposito, A.; Cabassi, J.; Giannini, L.; Tassi, F. One hundred years of mercury exploitation at the mining area of Abbadia San Salvatore (Mt. Amiata, Central Italy): A methodological approach for a complex reclamation activity before the establishment of a new mining park. El patrimonio geològico y minero. Identidad y motor de desarrollo. Publicaciones del Instituto Geològico y minero de España Serie: Cuadernos del Museo Geominero, n. 29. In Proceedings of the XVII Congreso Internacional sobre Patrimonio Geológico y Minero, Almaden, Spain, 21–24 September 2017; pp. 1109–1126. [Google Scholar]
- Youcai, Z.; Sheng, H. Pollution Control and Resource Recovery: Industrial Construction and Demolition Wastes; Butterworth-Heinemann: Oxford, UK, 2016; p. 345. [Google Scholar]
- Gao, X.; Gu, Y.; Xie, T.; Liu, Y.; Huang, S.; Zhao, Y. Simulation of Gaseous Mercury Adsorption of different building materials. J. Civ. Arch. Environ. Eng. 2014, 36, 6. [Google Scholar]
- Conticelli, S.; Boari, E.; Burlamacchi, L.; Cifelli, F.; Moscardi, F.; Laurenzi, M.A.; Pedraglio, L.F.; Francalanci, L.; Benvenuti, M.G.; Braschi, E.; et al. Geochemistry and Sr-Nd-Pb isotopes of Monte Amiata Volcano, Central Italy: Evidence for magma mixing between high-K calc-alkaline and leucititic mantle-derived magmas. Ital. J. Geosci. 2015, 134, 266–290. [Google Scholar] [CrossRef]
- Laurenzi, M.A.; Braschi, E.; Casalini, M.; Conticelli, S. New 40Ar-39Ar dating and revision of the geochronology of the Monte Amiata Volcano, Central Italy. Ital. J. Geosci. 2015, 134, 255–265. [Google Scholar] [CrossRef]
- Ferrara, R.; Mazzolai, B.; Edner, H.; Svanberg, S.; Wallinder, E. Atmospheric mercury sources in the Mt. Amiata area, Italy. Sci. Total. Environ. 1998, 213, 13–23. [Google Scholar] [CrossRef]
- Cipriani, C.; Tanelli, G. Risorse minerarie ed industria estrattiva in Toscana. Econ. Atti Mem. Accad. Toscana Sci. Lett. Colomb. 1983, 48, 241–282. [Google Scholar]
- Bargagli, R.; Iosco, F.P.; Barghigiani, C. Assessment of mercury dispersal in an abandoned mining area by soil and lichen analysis. Water Air Soil Pollut. 1987, 36, 219–225. [Google Scholar] [CrossRef]
- Ferrara, R.; Maserti, B.; Breder, R. Mercury in abiotic and biotic compartments of an area affected by a geochemical anomaly (Mt. Amiata, Italy). Water Air Soil Pollut. 1991, 56, 219–233. [Google Scholar] [CrossRef]
- Vaselli, O.; Nisi, B.; Rappuoli, D.; Bianchi, F.; Cabassi, J.; Venturi, S.; Tassi, F.; Raco, B. Geochemical characterization of the ground waters from the former Hg-mining area of Abbadia San Salvatore (Mt. Amiata, central Italy): Criticalities and perspectives for the reclamation process. Ital. J. Geosci. 2015, 134, 304–322. [Google Scholar] [CrossRef]
- Gray, J.E.; Rimondi, V.; Costagliola, P.; Vaselli, O.; Lattanzi, P. Long-distance transport of Hg, Sb, and as from a mined area, conversion of Hg to methyl-Hg, and uptake of Hg by fish on the Tiber River basin, west-central Italy. Environ. Geochem. Health 2013, 36, 145–157. [Google Scholar] [CrossRef]
- Rimondi, V.; Chiarantini, L.; Lattanzi, P.; Benvenuti, M.; Beutel, M.; Venturi, S.; Colica, A.; Costagliola, P.; Gabbani, G.; Gray, J.E.; et al. Metallogeny, exploitation and environmental impact of the Mt. Amiata mercury ore district (Southern Tuscany, Italy). Ital. J. Geosci. 2015, 134, 323–336. [Google Scholar] [CrossRef]
- Chiarantini, L.; Rimondi, V.; Benvenuti, M.; Beutel, M.W.; Costagliola, P.; Gonnelli, C.; Lattanzi, P.; Paolieri, M. Black pine (Pinus nigra) barks as biomonitors of airborne mercury pollution. Sci. Total. Environ. 2016, 569, 105–113. [Google Scholar] [CrossRef]
- Chiarantini, L.; Rimondi, V.; Bardelli, F.; Benvenuti, M.; Cosio, C.; Costagliola, P.; Di Benedetto, F.; Lattanzi, P.; Sarret, G. Mercury speciation on Pinus Nigra barks from Monte Amiata (Italy): An X-ray absorption spectroscopy study. Environ. Poll. 2017, 227, 83–88. [Google Scholar] [CrossRef]
- Venturi, S.; Vaselli, O.; Tassi, F.; Nisi, B.; Pennisi, M.; Cabassi, J.; Bicocchi, G.; Rossato, L. Geochemical and isotopic evidences for a severe anthropogenic boron contamination: A case study from Castelluccio (Arezzo, central Italy). Appl. Geochem. 2015, 63, 146–157. [Google Scholar] [CrossRef]
- Sholupov, S.E.; Pogarev, S.E.; Ryzhov, V.V.; Mashyanov, N.R.; Stroganov, A. Zeeman atomic absorption spectrometer RA-915+ for direct determination of mercury in air and complex matrix samples. Fuel Process. Technol. 2004, 85, 473–485. [Google Scholar] [CrossRef]
- Glasser, F.P.; Marchand, J.; Samson, E. Durability of concrete—Degradation phenomena involving detrimental chemical reactions. Cem. Concr. Res. 2008, 38, 226–246. [Google Scholar] [CrossRef]
- Ibrahim, A.; Mahmoud, E.; Yamin, M.; Patibandla, V.C. Experimental study on Portland cement pervious concrete mechanical and hydrological properties. Constr. Build. Mater. 2014, 50, 524–529. [Google Scholar] [CrossRef]
- Pepe, M.; Filho, R.D.T.; Koenders, E.A.; Martinelli, E. A novel mix design methodology for Recycled Aggregate Concrete. Constr. Build. Mater. 2016, 122, 362–372. [Google Scholar] [CrossRef]
- Ouyang, K.; Shi, C.; Chu, H.; Guo, H.; Song, B.; Ding, Y.; Guan, X.; Zhu, J.; Zhang, H.; Wang, Y.; et al. An overview on the efficiency of different pretreatment techniques for recycled concrete aggregate. J. Clean. Prod. 2020, 263, 121264. [Google Scholar] [CrossRef]
- Spedding, D.; Hamilton, R. Adsorption of mercury vapor by indoor surfaces. Environ. Res. 1982, 29, 30–41. [Google Scholar] [CrossRef]
- Bahadori, A. Essentials of Coating, Painting, and Lining for the Oil, Gas and Petrochemical Industries; Elsevier: Amsterdam, The Netherlands, 2015; p. 731. [Google Scholar]
Figure 1.
Location of the study area (general view and inset (a)). The Mt. Amiata is in the background while the former mining area of Abbadia San Salvatore (Siena, Italy) is located to the north of the urban center (red square). The samples were collected inside the building where the Gould furnaces are hosted (b). Four samples of anthropic materials were collected, as follows: sample 1 (c) and sample 2 (d) were consisting of concrete from two pillars inside the building; sample 3 (e) was picked up from the wall of the fume tubing; finally, sample 4 (d) was a tile fallen down about two years ago after a violent thunderstorm that hit the study area.

Figure 2.
The cylindrical chambers, sealed at the base with silicon paste, inside which the synthetic materials were positioned (a); the connection between the internal part of the chamber and the Lumex RA-915M controlled by a hose clamp and a three-way valve (b); the selected samples (#1 and #3) used to compare the release of GEM (Gaseous Elemental Mercury) by the “painted” and unpainted (“raw”) materials (c).

Figure 3.
Rate of released Hg0 (in ng·m3·min−1) for the four studied samples (Table 2) for each measurement session. The colored circles refer to the studied samples as labeled in the y-axis.
Figure 3.
Rate of released Hg0 (in ng·m3·min−1) for the four studied samples (Table 2) for each measurement session. The colored circles refer to the studied samples as labeled in the y-axis.

Figure 4.
Exposure time vs. rate of released Hg0 mercury (in ng·m−3·min−1) for samples 1 (“raw” and “painted”) and 3 (“raw” and “painted”). Legend: 1. March 5, 2020 (~2 h); 2. 5 March 2020 (~6 h); 3. 5 March, 2020 (~38 h); 4. 21 March, 2020 (~47 h); 5. 14 March, 2020 (~69 h); 6. 17 March, 2020 (~95 h); 7. 7 March, 2020 (~171 h). The dates represent when the experimental runs started (Table 3).

Figure 5.
Schematic representation of the adopted procedure to measure the amount of Hg0 released by geological and synthetic materials. The measurements were carried out into two steps. The first one uses a syringe and a three-way valve to mix the air into the cylindrical chamber to avoid stratification whilst in the second step the syringe is replaced by a connector that directly links to the Lumex RA-915M. The hose clamp is loosened and the three-way valve is turned to connect the air inside the cylindrical chamber to the Lumex to measure the emitted Hg0.


Table 1.
Total (in mg·kg−1) and leachable (in 1350 μg·L−1) mercury and total-Hg/leachable-Hg ratio for the four studied samples.
Table 1.
Total (in mg·kg−1) and leachable (in 1350 μg·L−1) mercury and total-Hg/leachable-Hg ratio for the four studied samples.
| ID | Material | Hgtot | Hgleachate | Hg tot/Hg Leachate |
|---|---|---|---|---|
| Type | (mg·kg−1) | (μg·L−1) | ||
| #1 | Concrete from the first pillar | 106 | 483 | 219 |
| #2 | Concrete from the second pillar | 79 | 19.9 | 3969 |
| #3 | Wall rock from the fume tubing | 242 | 1350 | 179 |
| #4 | Roof tile | 16.9 | 0.5 | 33,800 |
Table 2.
Concentration of gaseous mercury (in ng·m−3) released from the synthetic materials. The weight of each sample, the date and the exposure time are also reported; n.d.: not determined.
Table 2.
Concentration of gaseous mercury (in ng·m−3) released from the synthetic materials. The weight of each sample, the date and the exposure time are also reported; n.d.: not determined.
| Exposure Time | Hg0 | ||
|---|---|---|---|
| ID | Date | (h) | (in ng·m−3) |
| #1 | 24 December 2019 | 6.15 | 3221 |
| #2 | 24 December 2019 | 5.22 | 923 |
| #3 | 24 December 2019 | 6.20 | 6621 |
| #4 | 24 December 2019 | 5.51 | 115 |
| Exposure Time | Hg0 | ||
| ID | Date | (h) | (in ng·m−3) |
| #1 | 3 January 2020 | 1.48 | n.d. |
| #2 | 3 January 2020 | 1.41 | 358 |
| #3 | 3 January 2020 | 2.03 | 1570 |
| #4 | 3 January 2020 | 1.40 | 29 |
| Exposure Time | Hg0 | ||
| ID | Date | (h) | (in ng·m−3) |
| #1 | 15 January 2020 | 6.45 | 2625 |
| #2 | 15 January 2020 | 6.32 | 323 |
| #3 | 15 January 2020 | 6.41 | 7563 |
| #4 | 15 January 2020 | 6.35 | 74 |
| Exposure Time | Hg0 | ||
| ID | Date | (h) | (in ng·m−3) |
| #1 | 22 January 2020 | 6.34 | 1380 |
| #2 | 22 January 2020 | 6.47 | 1086 |
| #3 | 22 January 2020 | 6.37 | 6670 |
| #4 | 22 January 2020 | 7.00 | 45 |
Table 3.
Experimental tests on “raw” and “painted” fragments of samples 1 and 3 to evaluate the release of Hg0 at different exposure times.
Table 3.
Experimental tests on “raw” and “painted” fragments of samples 1 and 3 to evaluate the release of Hg0 at different exposure times.
| ID | Starting Day | Exposure Time (h) | Hg0 (ng·m−3) | Starting Day | Exposure Time (h) | Hg0 (ng·m−3) | Starting Day | Exposure Time (h) | Hg0 (ng·m−3) |
|---|---|---|---|---|---|---|---|---|---|
| #1 raw | 5 March 2020 | 2.06 | 278 | 5 March 2020 | 6.17 | 357 | 5 March 2020 | 38.22 | 521 |
| #1 painted | 5 March 2020 | 2.04 | 774 | 5 March 2020 | 6.17 | 1938 | 5 March 2020 | 38.2 | 6706 |
| #3 raw | 5 March 2020 | 2.02 | 1496 | 5 March 2020 | 6.17 | 2228 | 5 March 2020 | 38.18 | 5373 |
| #3 painted | 5 March 2020 | 2.00 | 1240 | 5 March 2020 | 6.17 | 3131 | 5 March 2020 | 38.16 | 11,446 |
| ID | Starting Day | Exposure Time (h) | Hg0 (ng·m−3) | Starting Day | Exposure Time (h) | Hg0 (ng·m−3) | Starting Day | Exposure Time (h) | Hg0 (ng·m−3) |
| #1 raw | 7 March 2020 | 171.30 | n.d. | 14 March 2020 | 69.00 | 1035 | 17 March 2020 | 95.40 | 2271 |
| #1 painted | 7 March 2020 | 171.28 | 6470 | 14 March 2020 | 68.58 | 3129 | 17 March 2020 | 95.40 | 3630 |
| #3 raw | 7 March 2020 | 171.26 | 7387 | 14 March 2020 | 68.56 | 8202 | 17 March 2020 | 95.40 | 8838 |
| #3 painted | 7 March 2020 | 171.24 | 12,587 | 14 March 2020 | 68.54 | 11,472 | 17 March 2020 | 95.40 | 12,632 |
| ID | Starting day | Exposure time (h) | Hg0 (ng·m−3) | ||||||
| #1 raw | 21 March 2020 | 47.20 | 420 | ||||||
| #1 painted | 21 March 2020 | 47.18 | 3098 | ||||||
| #3 raw | 21 March 2020 | 47.16 | 7524 | ||||||
| #3 painted | 21 March 2020 | 47.14 | 11,125 |
© 2020 by the authors. Licensee MDPI, Basel, Switzerland. This article is an open access article distributed under the terms and conditions of the Creative Commons Attribution (CC BY) license (http://creativecommons.org/licenses/by/4.0/).
Share and Cite
MDPI and ACS Style
Lazzaroni, M.; Nisi, B.; Rappuoli, D.; Cabassi, J.; Vaselli, O. A New Low-Cost and Reliable Method to Evaluate the Release of Hg0 from Synthetic Materials. Processes 2020, 8, 1282. https://doi.org/10.3390/pr8101282
AMA Style
Lazzaroni M, Nisi B, Rappuoli D, Cabassi J, Vaselli O. A New Low-Cost and Reliable Method to Evaluate the Release of Hg0 from Synthetic Materials. Processes. 2020; 8(10):1282. https://doi.org/10.3390/pr8101282
Chicago/Turabian StyleLazzaroni, Marta, Barbara Nisi, Daniele Rappuoli, Jacopo Cabassi, and Orlando Vaselli. 2020. "A New Low-Cost and Reliable Method to Evaluate the Release of Hg0 from Synthetic Materials" Processes 8, no. 10: 1282. https://doi.org/10.3390/pr8101282
Note that from the first issue of 2016, this journal uses article numbers instead of page numbers. See further details here.