Complex Characterization of Fine Fraction and Source Contribution to PM2.5 Mass at an Urban Area in Central Europe

 , , , ,
Abstract
:1. Introduction
- Methods based on evaluating measuring data; to identify the sources, a basic numerical data treatment is applied.
- Methods based on emission inventories and/or dispersion models to simulate aerosol emission, formation, transport and deposition.
- Methods based on statistical evaluation of PM chemical data acquired at receptor sites (receptor models). The fundamental principle of receptor modeling is that mass and species conservation can be assumed and a mass balance analysis can be used to identify and apportion the sources of airborne PM in the atmosphere [13]. Among them, there is Positive Matrix Factorization (PMF), which is a result of the works of Paatero and Tapper [14], and is an advanced source-receptor method of analysis. Owing to this technique, PM2.5 sources can be identified with a number of factors and it is possible to estimate their contribution in each factor [14,15].
2. Experiments
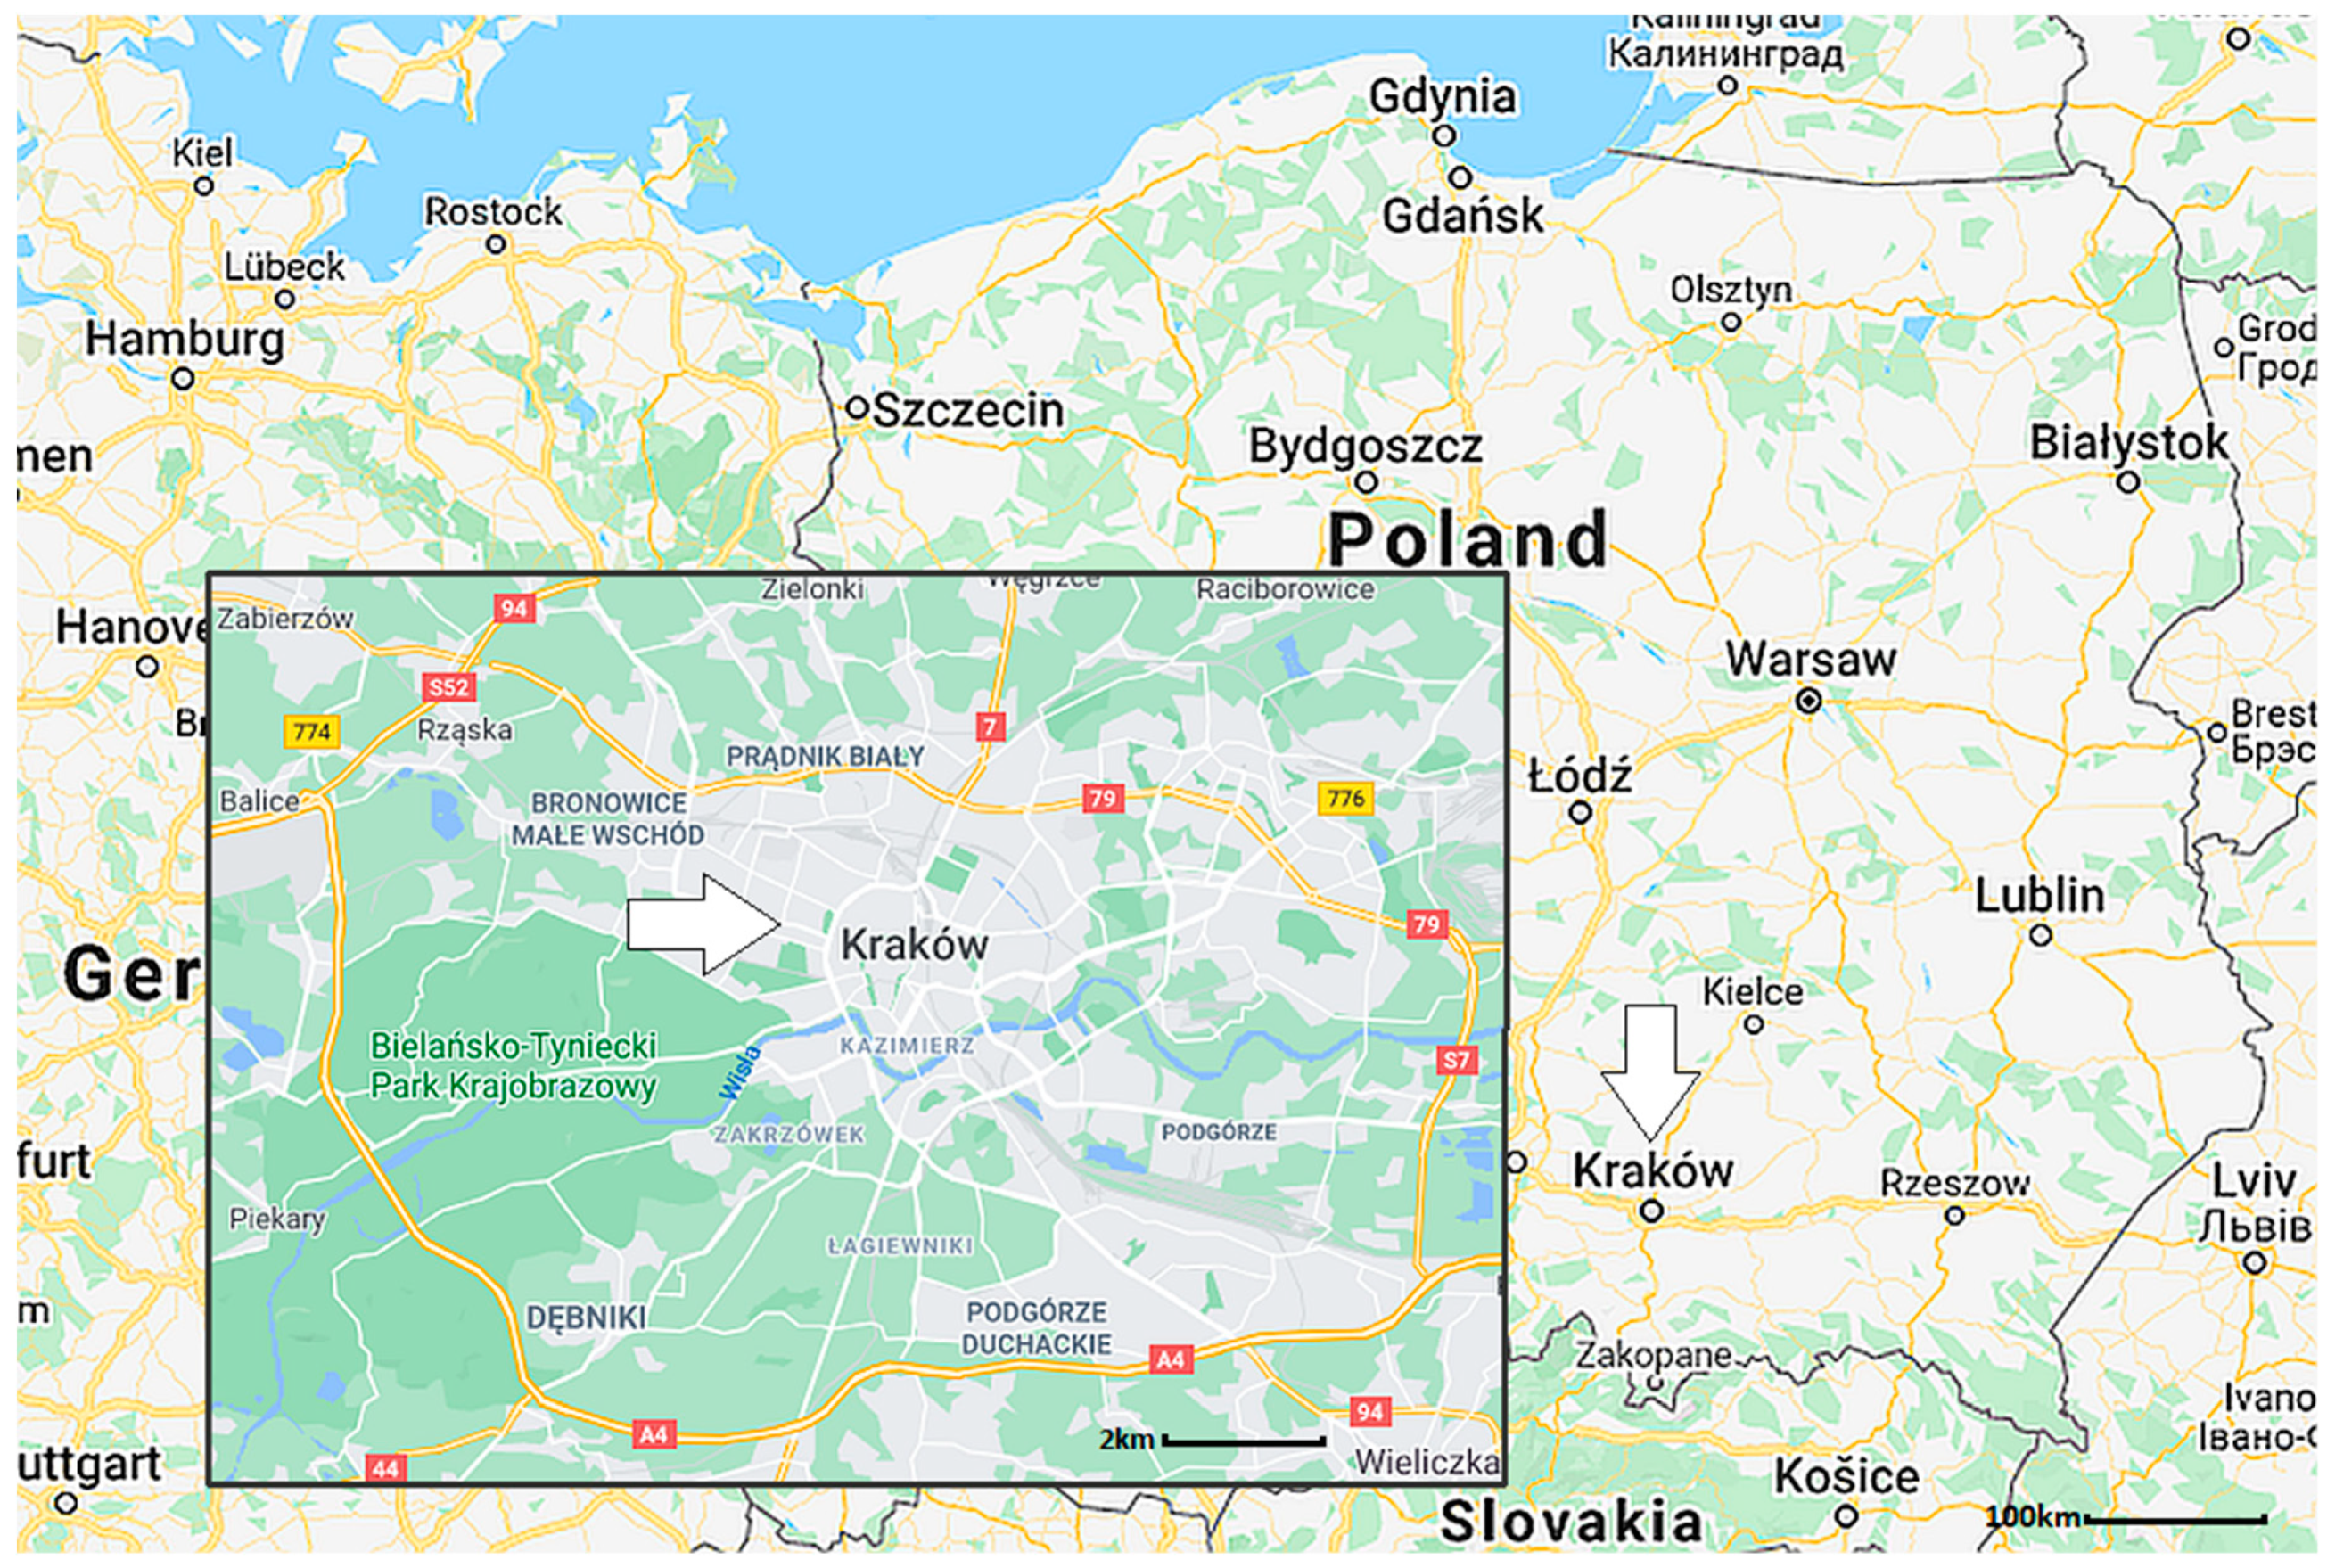
2.1. Sampling
2.2. Chemical Analyses
2.3. Source Apportionment
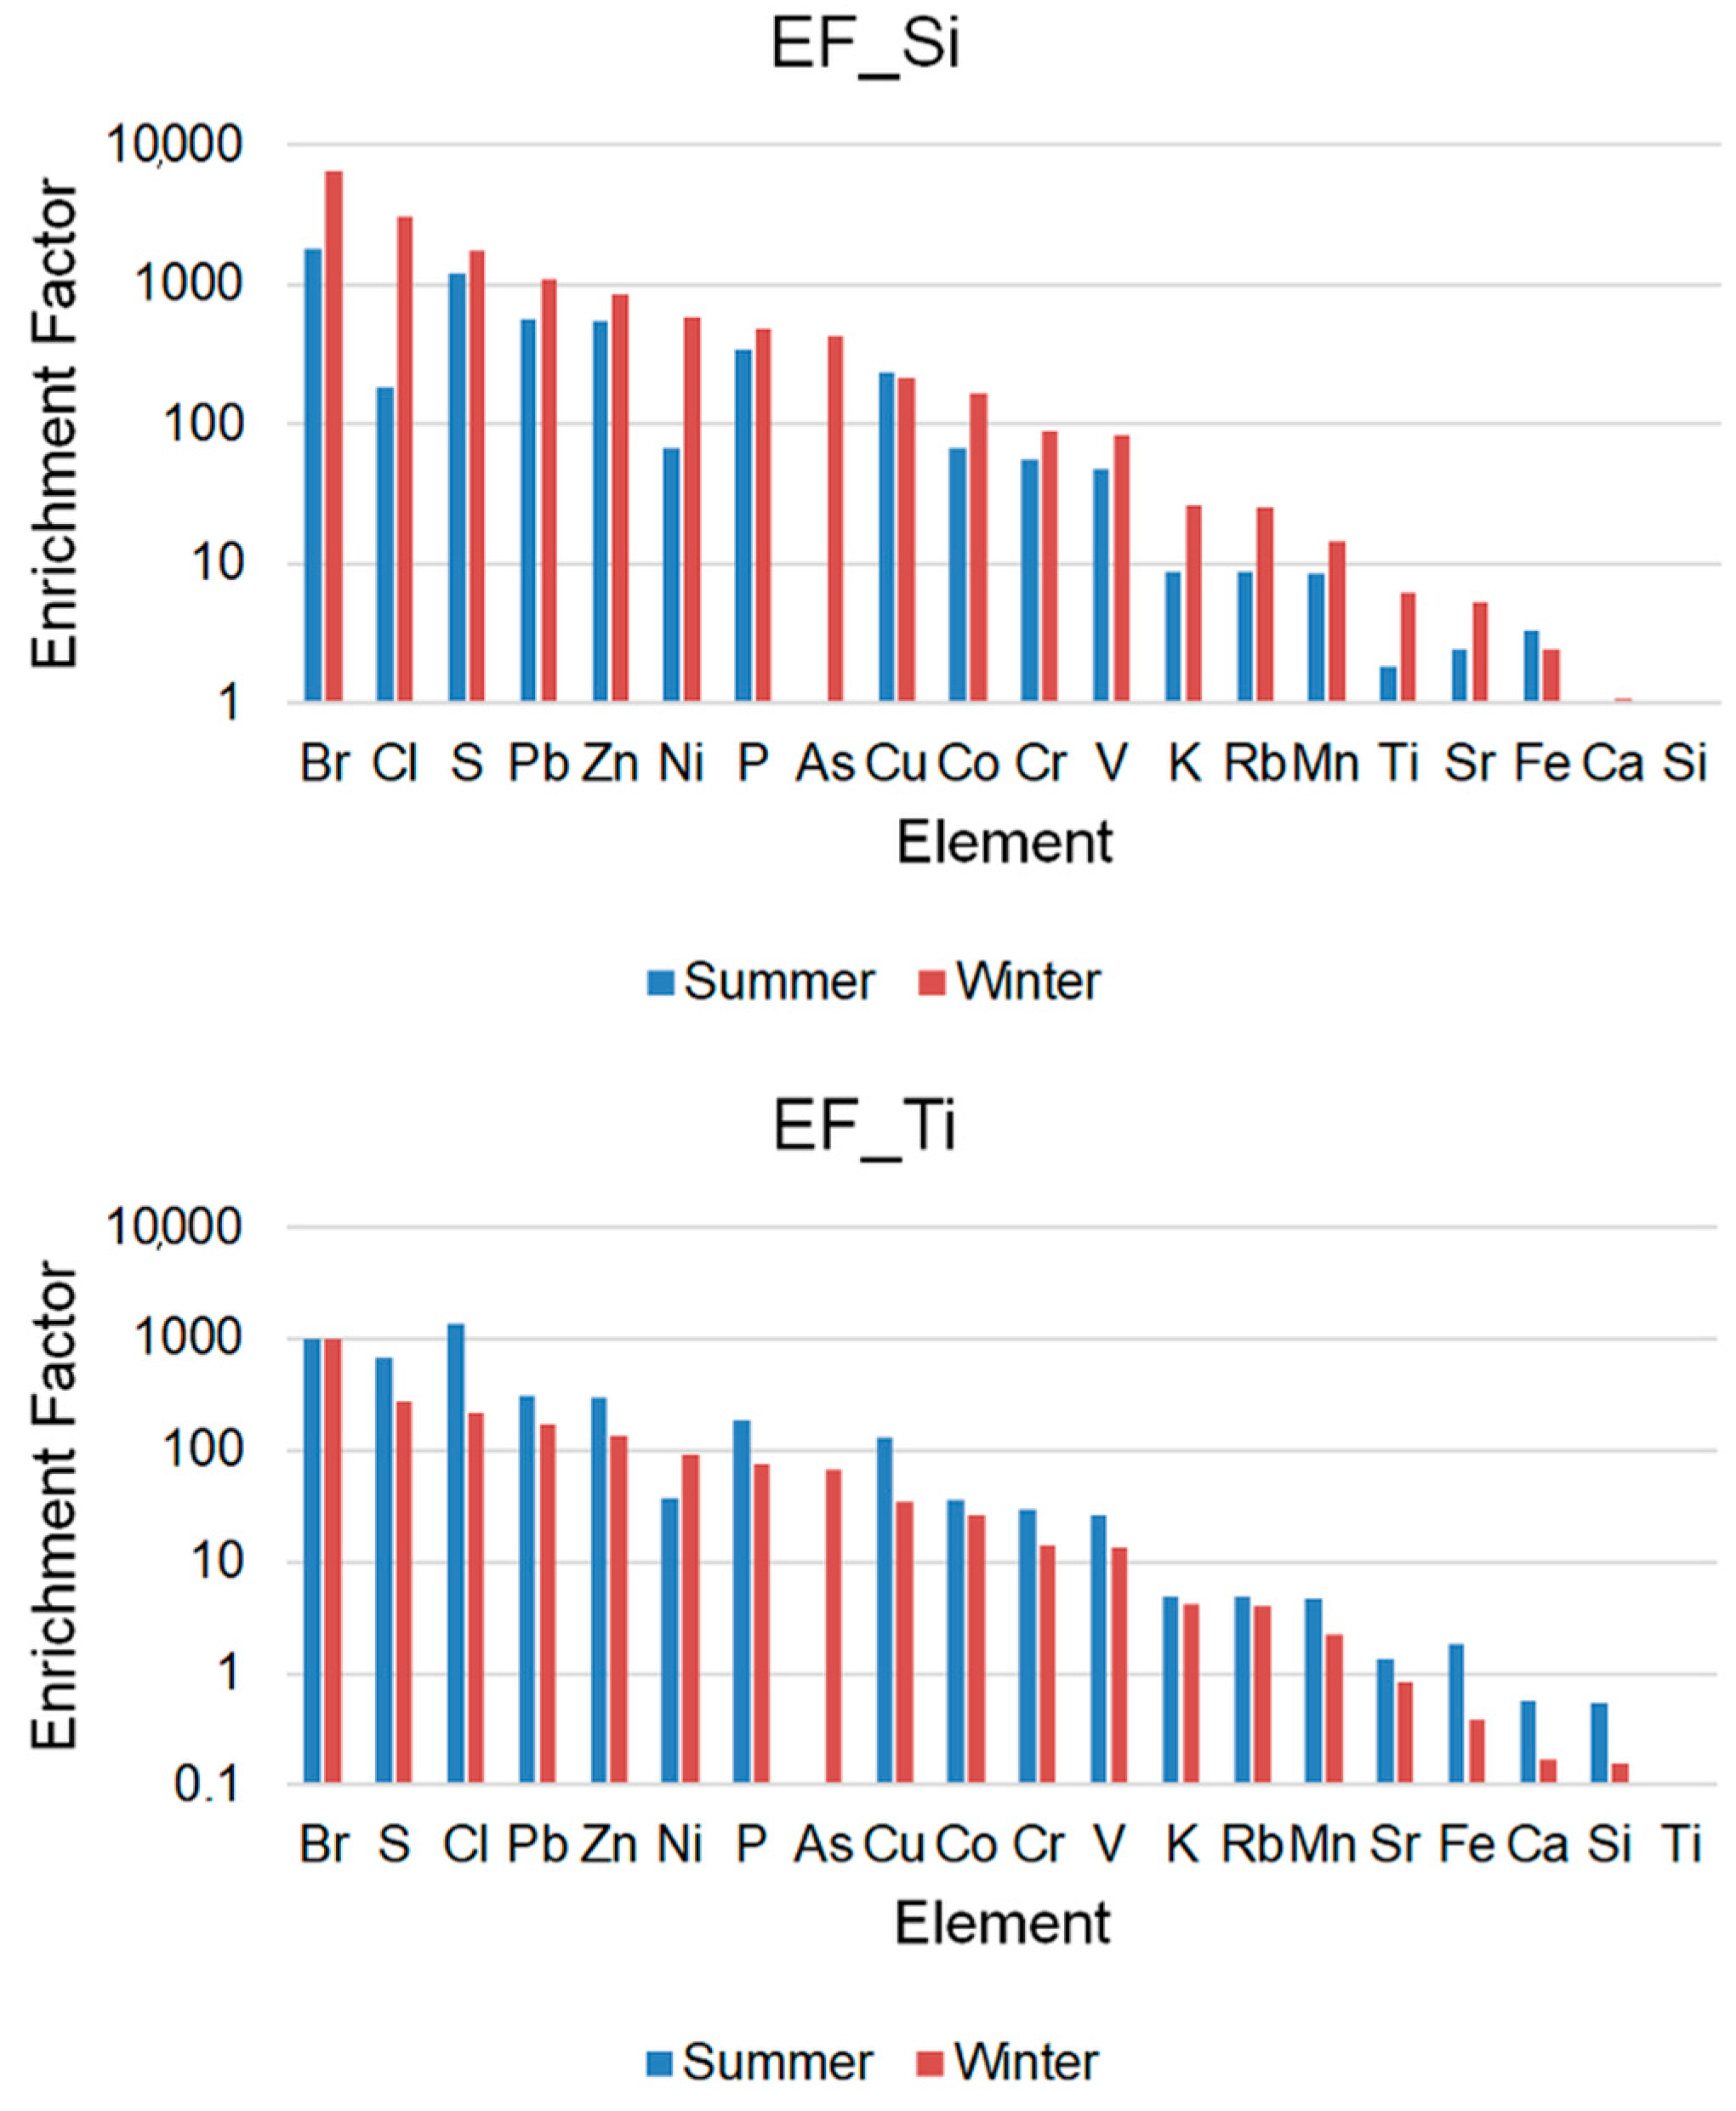
2.3.1. Enrichment Factors
2.3.2. Positive Matrix Factorization Analysis
3. Results and Discussion
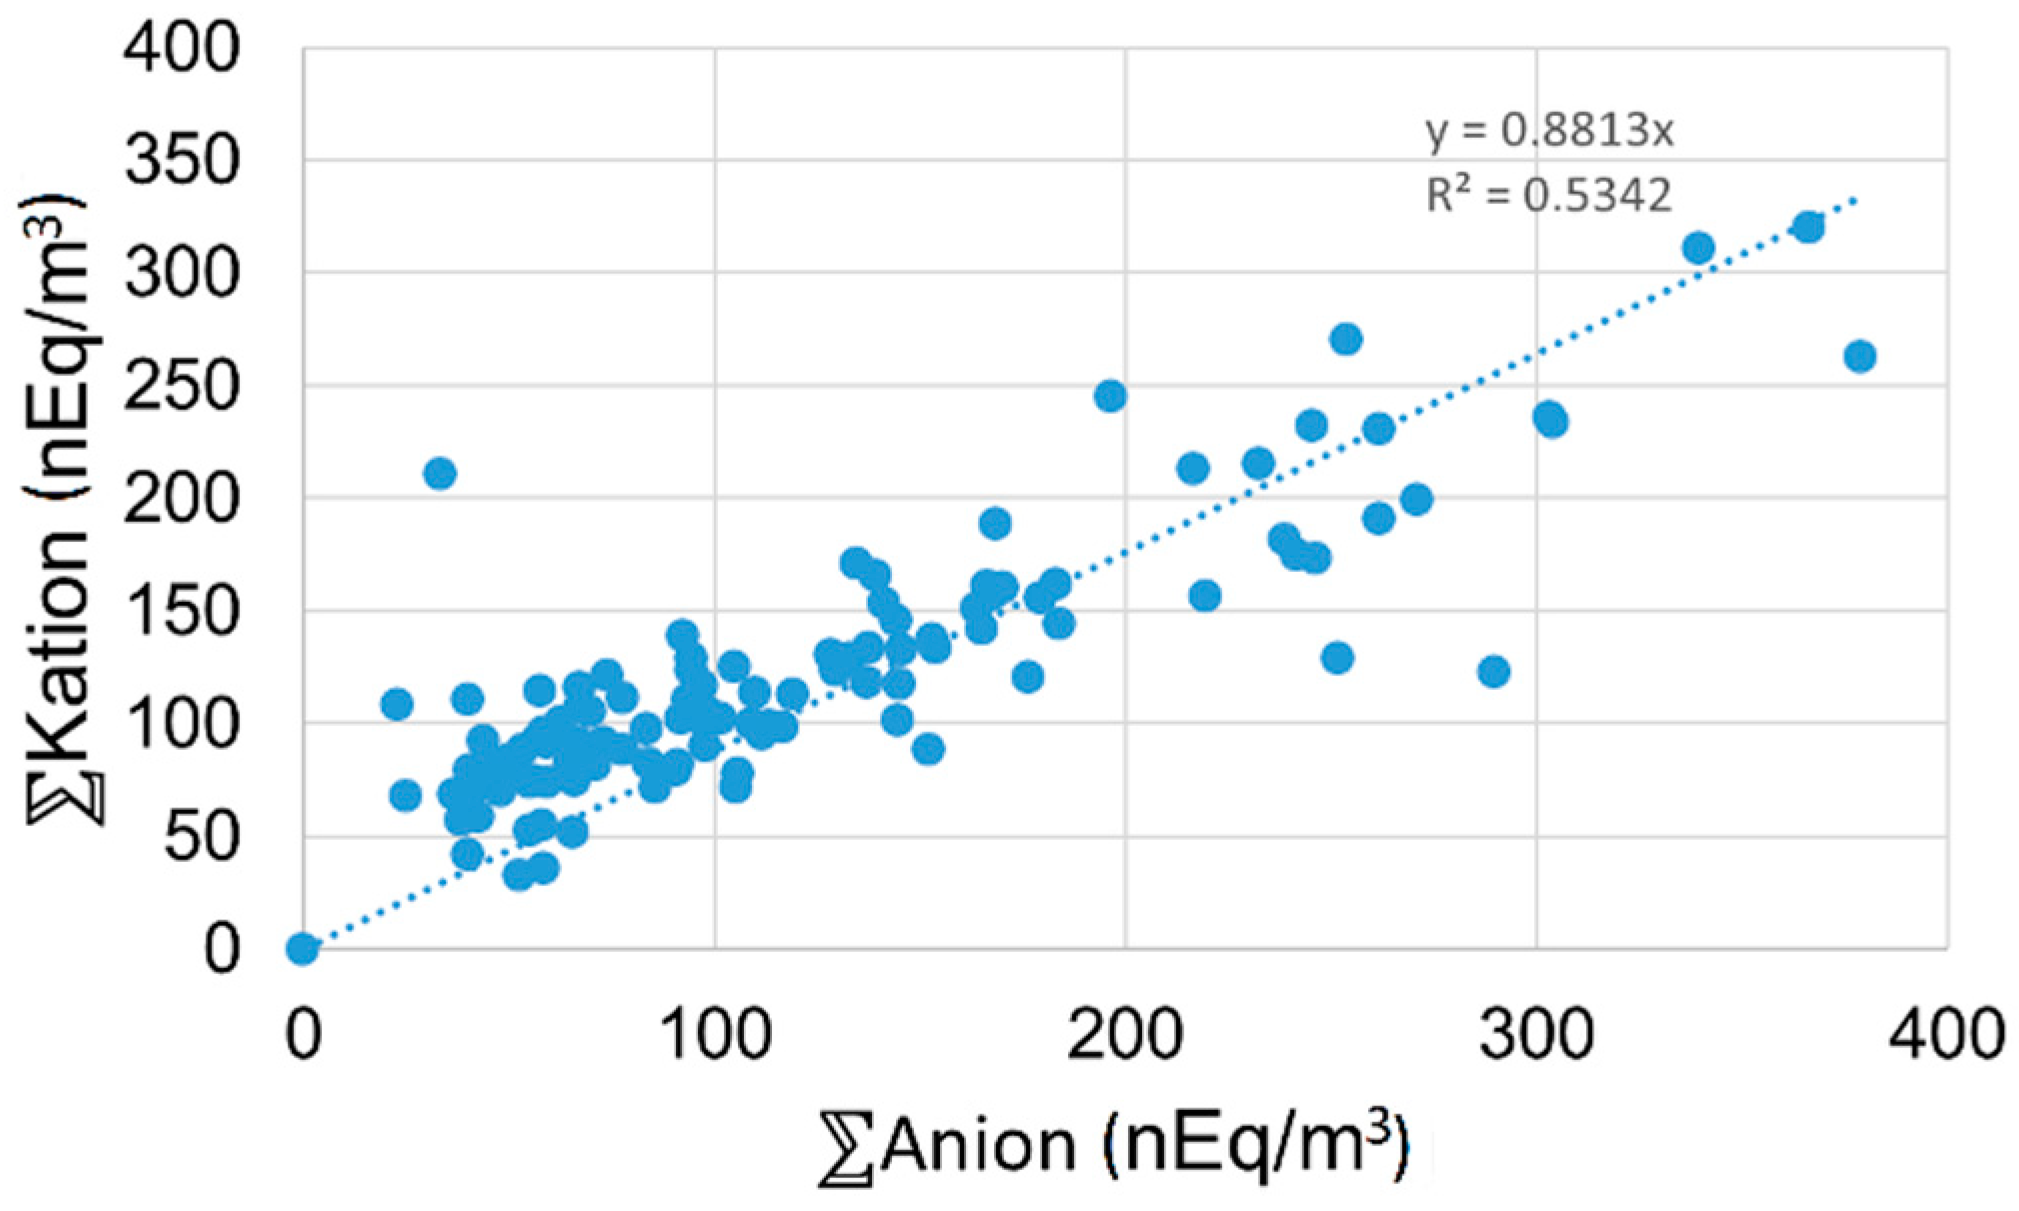
3.1. Chemical Analyses
3.2. Source Apportionment
3.2.1. Enrichment Factors
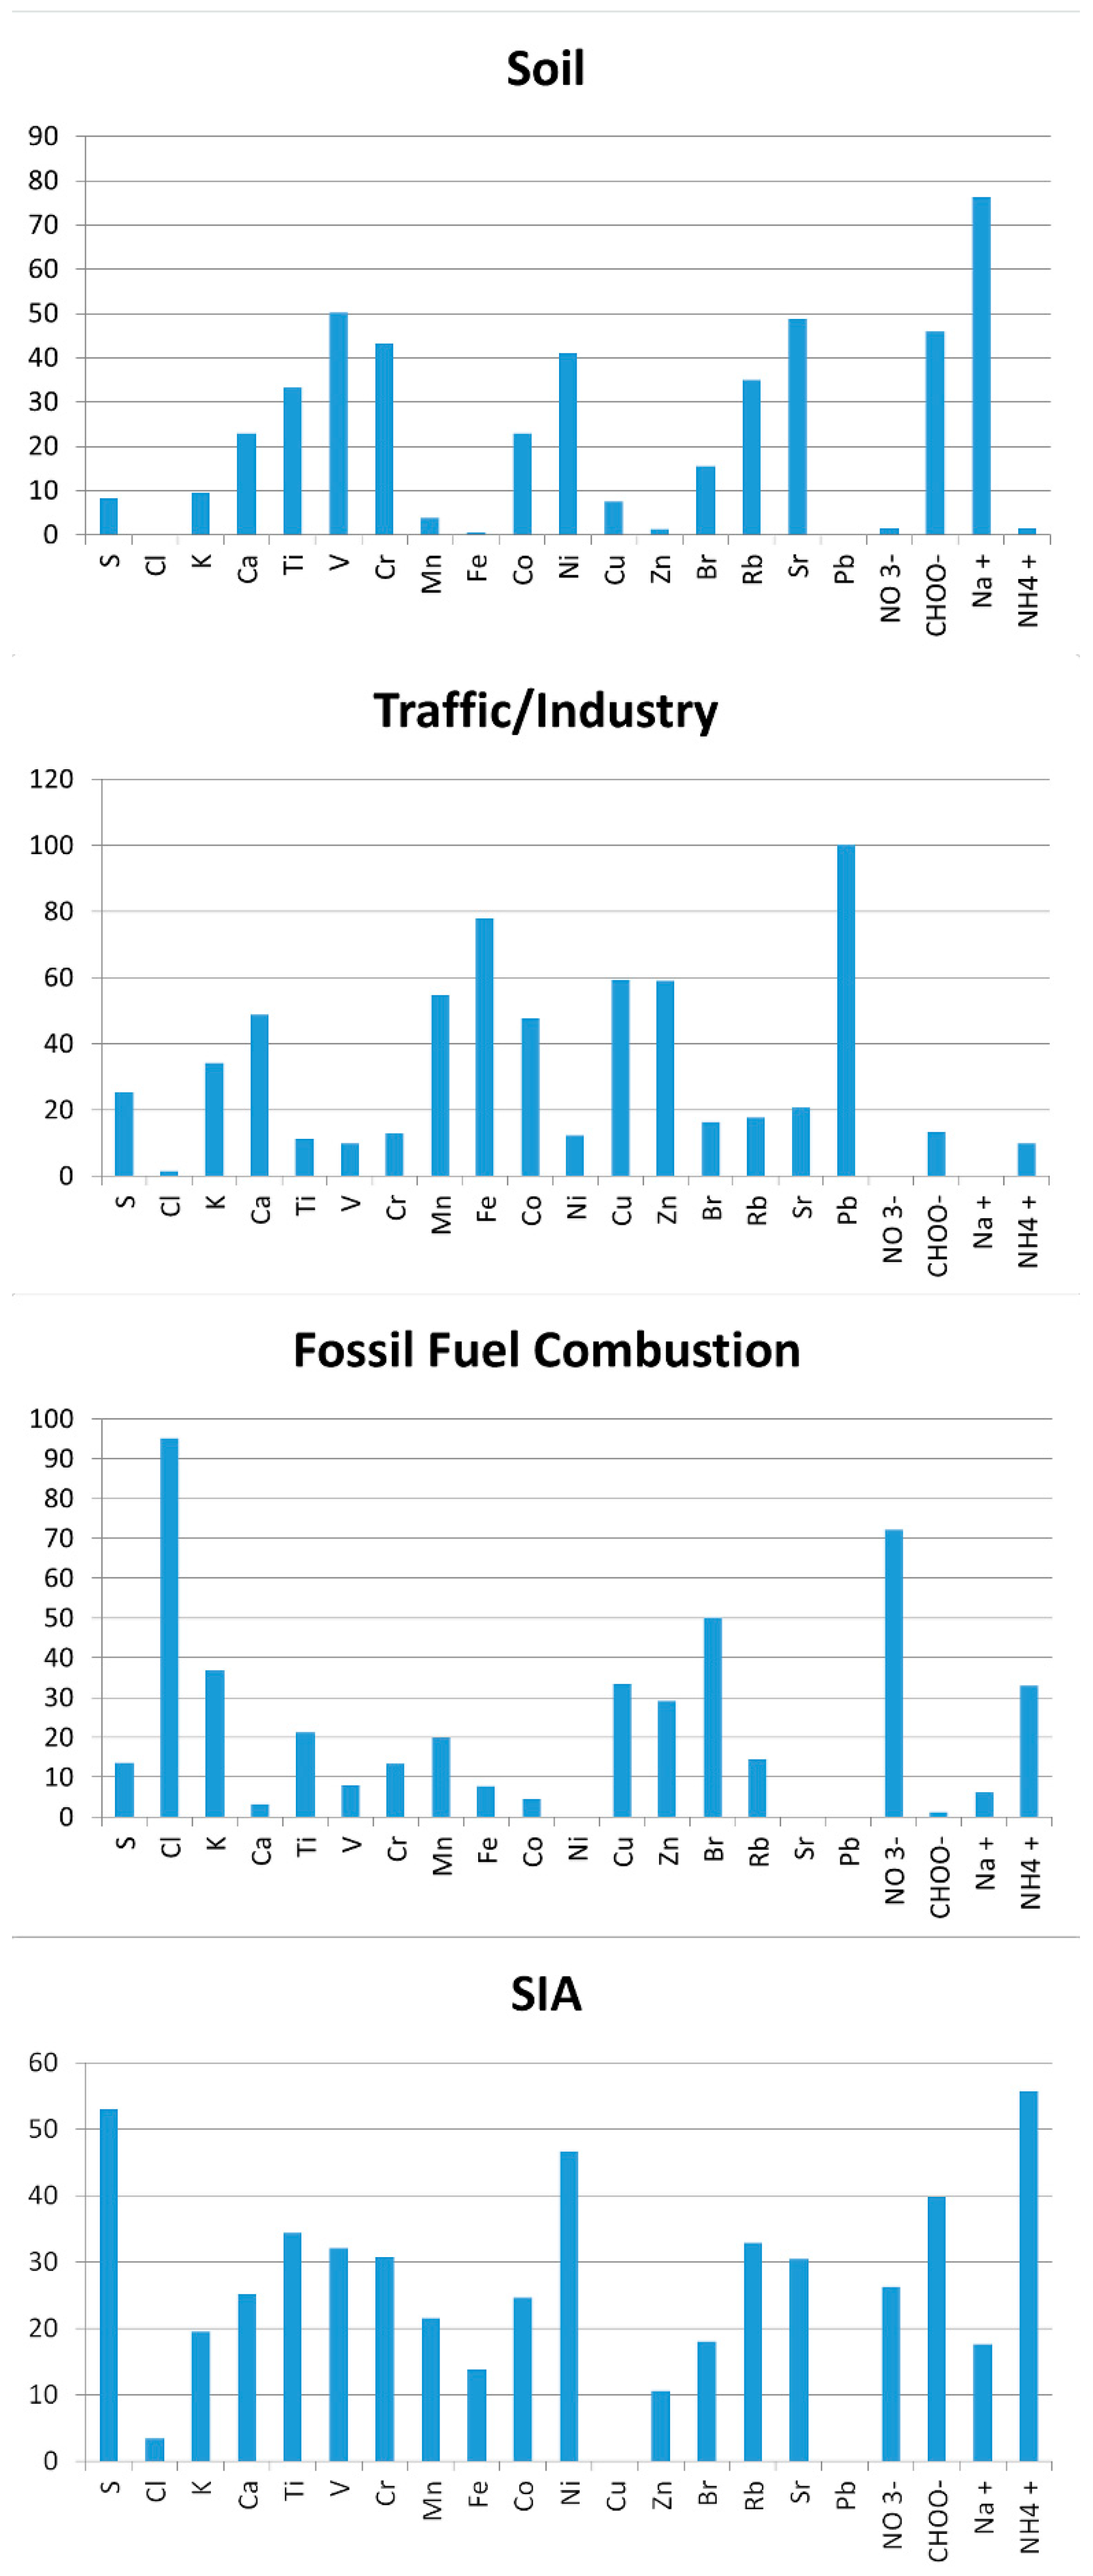
3.2.2. Positive Matrix Factorization (PMF)
4. Conclusions
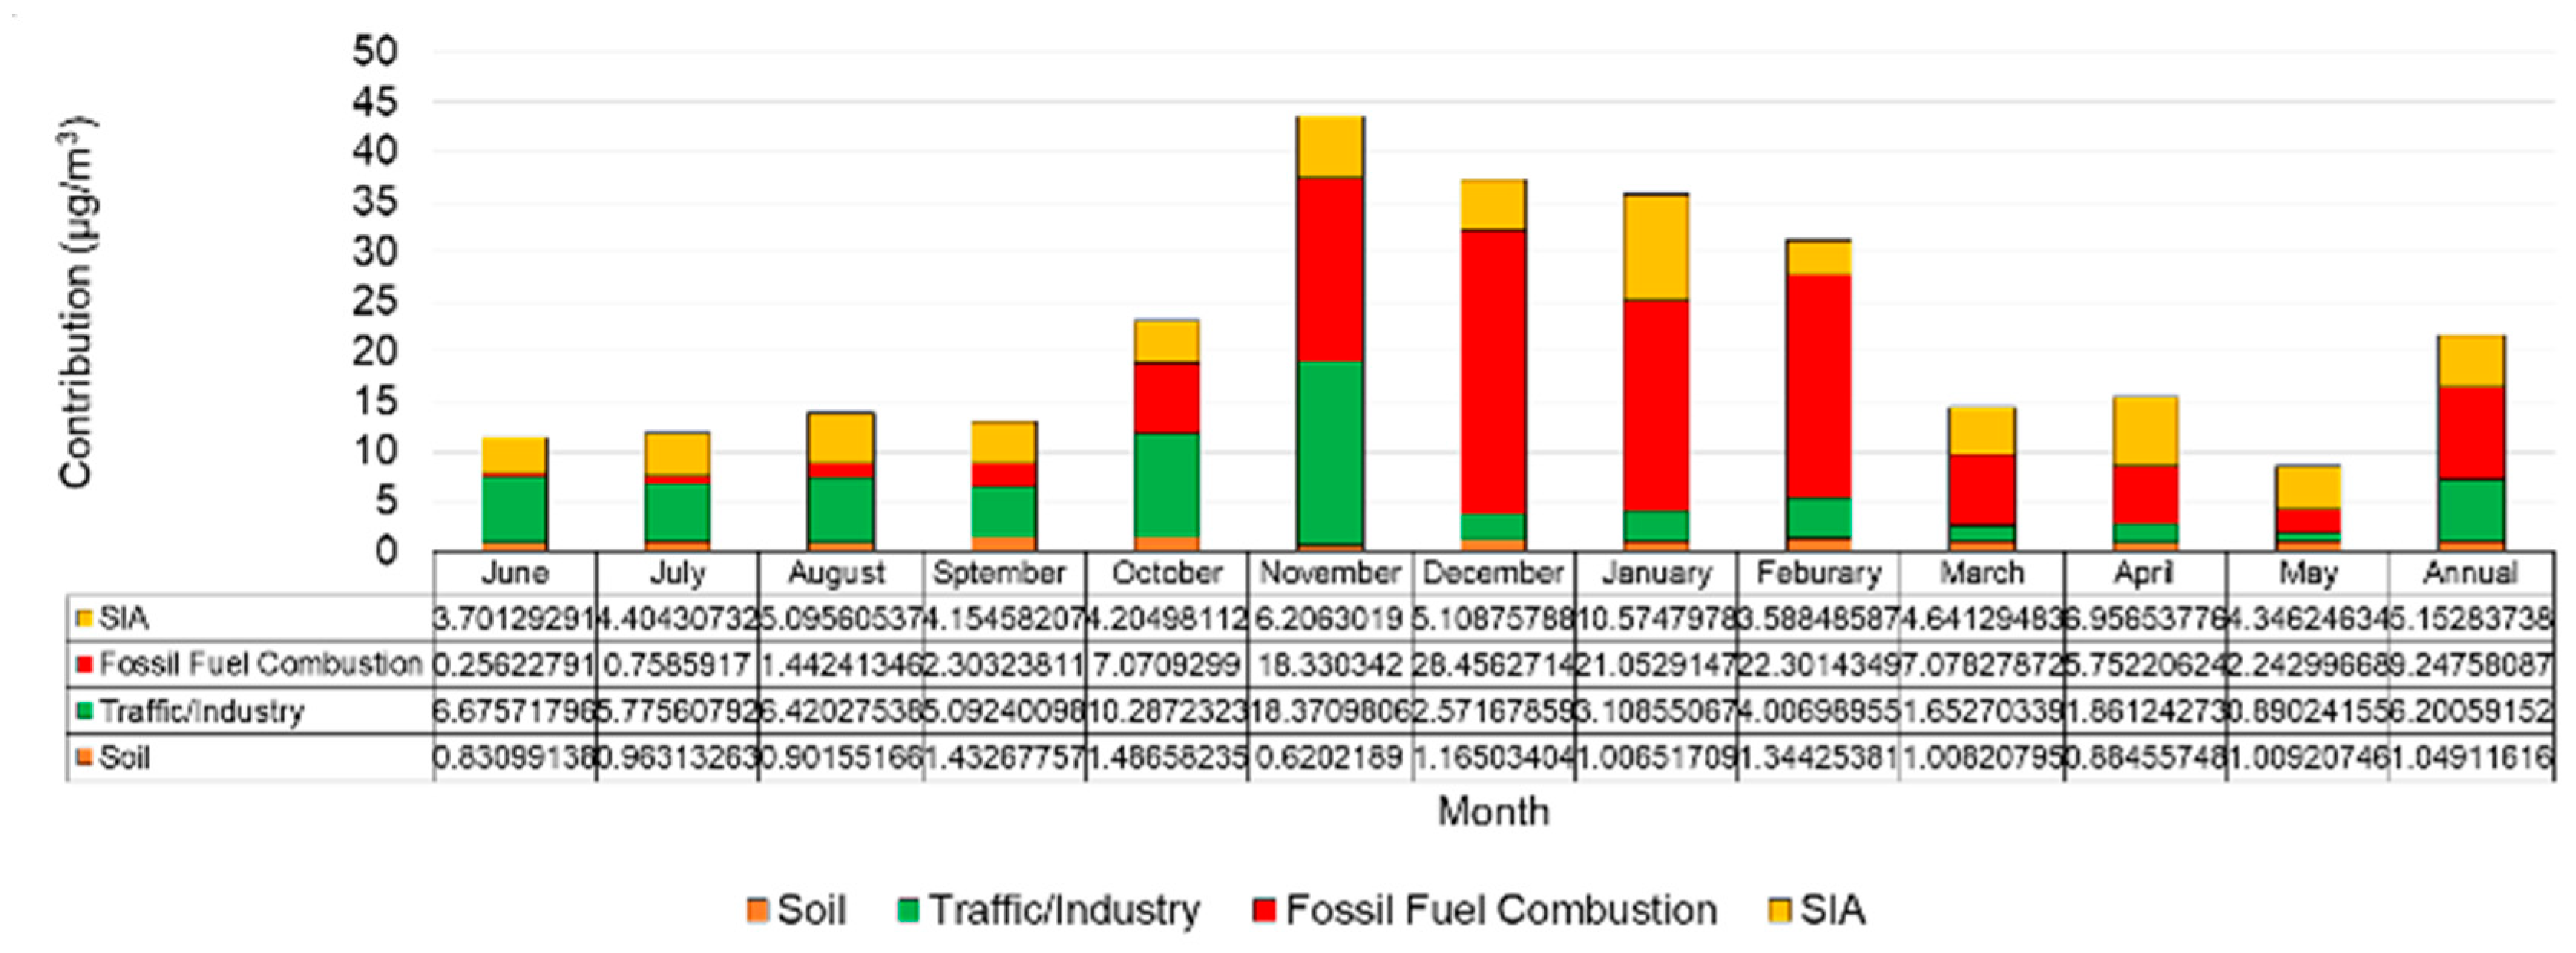
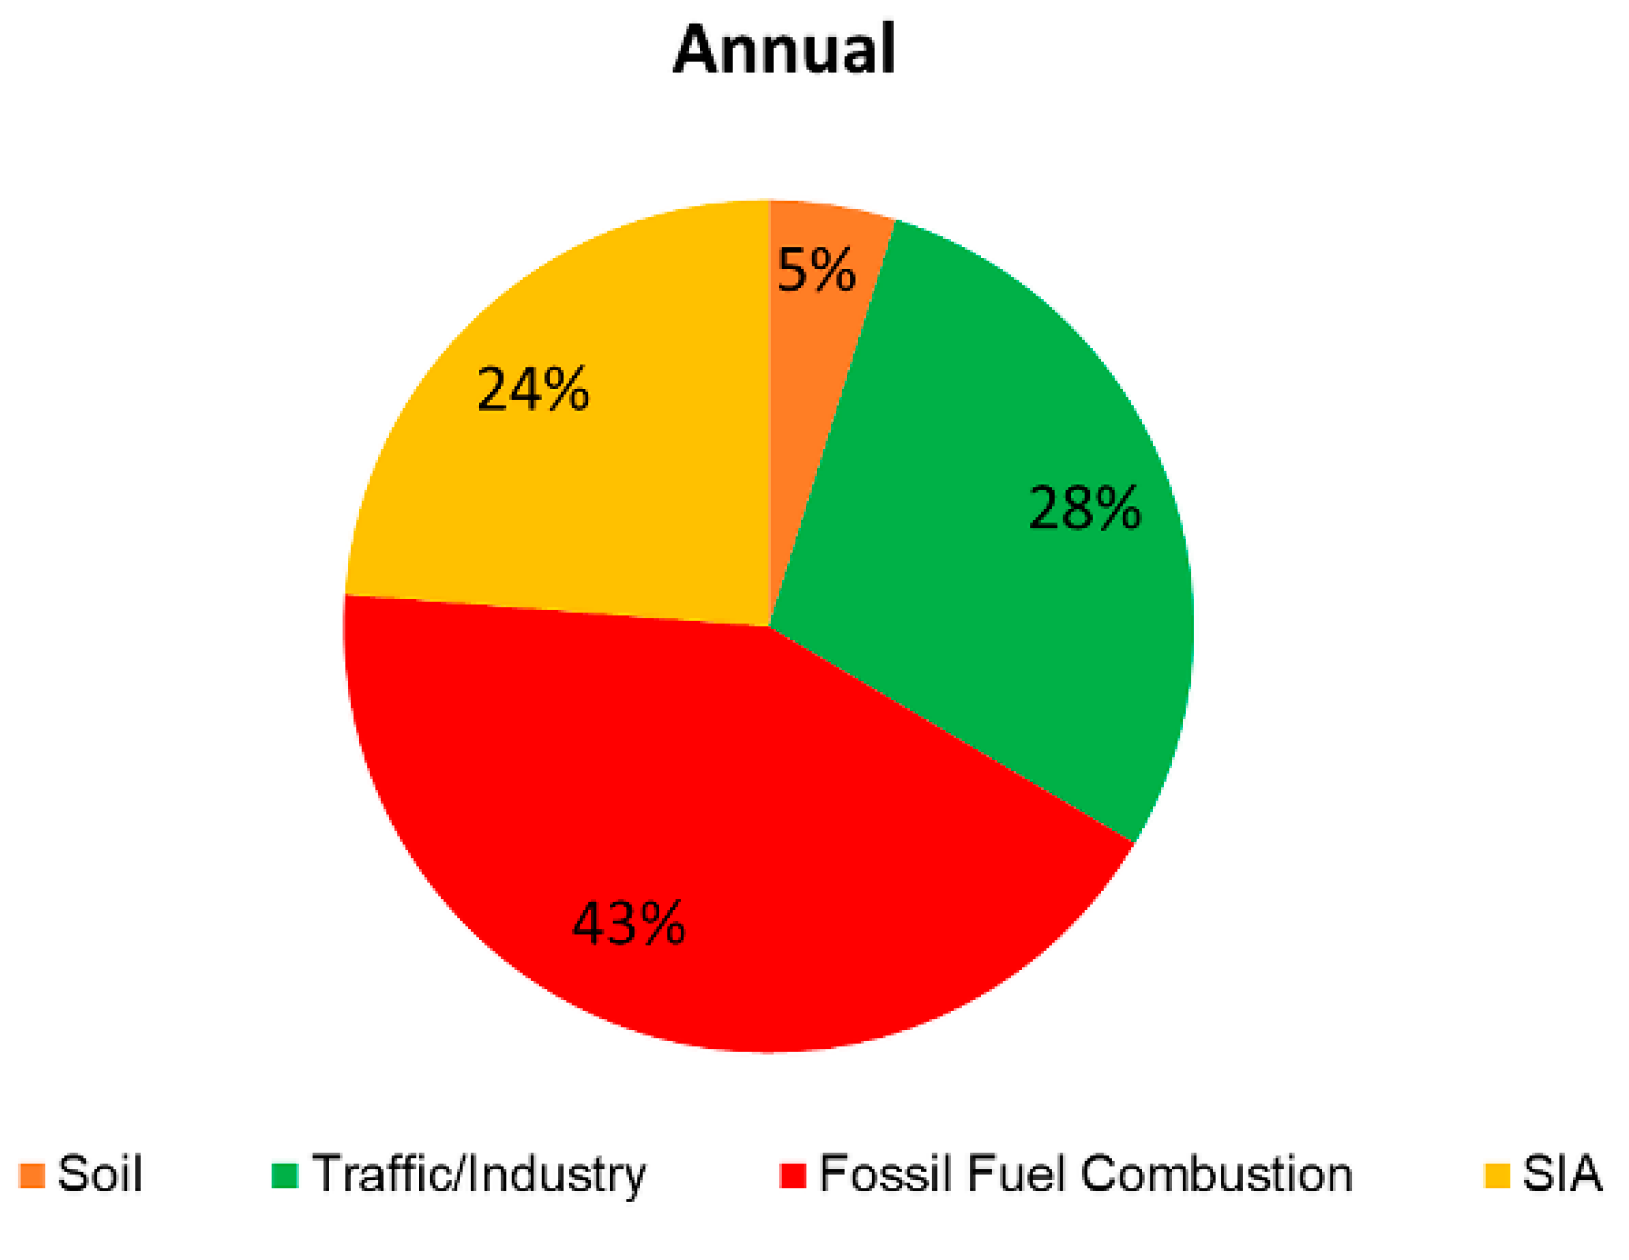
- During the summer period, secondary inorganic aerosols and particles from traffic and industry have the dominant contribution to particulate matter. The contribution of these sources is over 80% of PM. The contribution of secondary inorganic aerosols is slightly lower in relation to dust from traffic and industry. As for the absolute values, it is on average about 4–5 µg/m3 for secondary inorganic aerosols and 6 µg/m3 for traffic and industry.
- In winter, the dominant source for particulate matter is the combustion of solid fuels. In absolute values, it is on average about 25 µg/m3, which is over 60% of the PM. In the second place, there are secondary inorganic aerosols with a contribution of about 20%. The mean absolute value is slightly higher than in summer, and amounts to 6 µg/m3. For autumn and spring, these are intermediate values between summer and winter.
- The large jump in the concentration of particulate matter from traffic and industry in the period to November 2018 and from December 2018 remains to be explained. Until November, the average concentration of PM from this source was about 8.5 µg/m3, and from December, the average was about 3.4 µg/m3. In the PMF model, this source is characterized by such elements as Fe, Cu and Zn, the concentrations of which in the periods considered are adequately different.
- These results will be the basis for assessing the effects of the introduction of the ban on solid fuel combustion in Krakow from autumn 2019.
Author Contributions
Funding
Acknowledgments
Conflicts of Interest
References
- European Environment Agency (EEA). Air Quality in Europe—2019; Report no. 10; European Environment Agency (EEA): Copenhagen, Denmark, 2019. [Google Scholar]
- Ito, K.; Christensen, W.F.; Eatough, D.J.; Henry, R.C.; Kim, E.; Laden, F.; Lall, R.; Larson, T.V.; Neas, L.; Hopke, P.K.; et al. PM source apportionment and health effects: 2. An investigation of intermethod variability in associations between source-apportioned fine particle mass and daily mortality in Washington, DC. J. Expo. Sci. Environ. Epidemiol. 2006, 16, 300–310. [Google Scholar] [CrossRef] [PubMed] [Green Version]
- Kristensson, A.; Ausmeel, S.; Pauraite, J.; Eriksson, A.; Ahlberg, E.; Byčenkienė, S.; Degórska, A. Source Contributions to Rural Carbonaceous Winter Aerosol in North-Eastern Poland. Atmosphere 2020, 11, 263. [Google Scholar] [CrossRef] [Green Version]
- Cho, S.H.; Tong, H.; McGee, J.K.; Baldauf, R.W.; Krantz, Q.T.; Gilmour, M.I. Comparative Toxicity of Size-Fractionated Airborne Particulate Matter Collected at Different Distances from an Urban Highway. Environ. Health Perspect. 2009, 117, 1682–1689. [Google Scholar] [CrossRef] [PubMed] [Green Version]
- Weagle, C.L.; Snider, G.; Li, C.; van Donkelaar, A.; Philip, S.; Bissonnette, P.; Burke, J.; Jackson, J.; Latimer, R.; Stone, E.; et al. Global Sources of Fine Particulate Matter: Interpretation of PM2.5 Chemical Composition Observed by SPARTAN using a Global Chemical Transport Model. Environ. Sci. Technol. 2018, 52, 11670–11681. [Google Scholar] [CrossRef] [PubMed]
- Du, Y.; Xu, X.; Chu, M.; Guo, Y.; Wang, J. Air particulate matter and cardiovascular disease: The epidemiological, biomedical and clinical evidence. J. Thorac. Dis. 2016, 8, E8–E19. [Google Scholar] [PubMed]
- Lelieveld, J.; Klingmüller, K.; Pozzer, A.; Pöschl, U.; Fnais, M.; Daiber, A.; Münzel, T. Cardiovascular disease burden from ambient air pollution in Europe reassessed using novel hazard ratio functions. Eur. Heart J. 2019, 40, 1590–1596. [Google Scholar] [CrossRef] [Green Version]
- Münzel, T.; Gori, T.; Al-Kindi, S.; Deanfield, J.; Lelieveld, J.; Daiber, A.; Rajagopalan, S. Effects of gaseous and solid constituents of air pollution on endothelial function. Eur. Heart J. 2018, 39, 3543–3550. [Google Scholar] [CrossRef] [Green Version]
- Giannadaki, D.; Lelieveld, J.; Pozzer, A. Implementing the US air quality standard for PM2.5 worldwide can prevent millions of premature deaths per year. Environ. Health 2016, 15, 88. [Google Scholar] [CrossRef] [Green Version]
- Zieliński, A.; Wielgus, A.; Dreliszak, J.; Zukow, W. Air pollution—Selected health effects in Poland. J. Educ. 2018, 8, 2391–8306. [Google Scholar]
- Wielgosinski, G.; Czerwińska, J. Smog Episodes in Poland. Atmosphere 2020, 11, 277. [Google Scholar] [CrossRef] [Green Version]
- Glowny Inspektorat Ochrony Srodowiska. Roczna Ocena Jakości Powietrza W Województwie Malopolskim; Glowny Inspektorat Ochrony Srodowiska: Krakow, Poland, 2019. [Google Scholar]
- Viana, M.; Kuhlbusch, T.A.J.; Querol, X.; Alastuey, A.; Harrison, R.M.; Hopke, P.K.; Winiwarter, W.; Vallius, M.; Szidat, S.; Prévôt, A.S.H.; et al. Source apportionment of particulate matter in Europe: A review of methods and results. Aerosol Sci. 2008, 39, 827–849. [Google Scholar] [CrossRef]
- Paatero, P.; Tapper, U. Positive matrix factorization: A non-negative factor model with optimal utilization of error estimates of data values. Environmetrics 1994, 5, 111–126. [Google Scholar] [CrossRef]
- Belis, C.; Favez, O.; Mircea, M.; Diapouli, E.; Manousakas, M.-I.; Vratolis, S.; Gilardoni, S.; Paglione, M.; Decesari, S.; Mocnik, G.; et al. European Guide Air Pollut. Source Apportionment Recept Models; Publications Office of the European Union: Luxembourg, 2014. [Google Scholar]
- Wilczynska-Michalik, W.; Pietras, B.; Samek, L.; Furman, L.; Latkiewicz, A.; Rzeznikiewicz, K.; Michalik, M. Submicron Particles in Air Pollution in Krakow. Aura 2015, 8, 4–7. (In Polish) [Google Scholar]
- Air Protection Program for the Małopolskie Voivodeship 2020. Available online: https://powietrze.malopolska.pl/program-ochrony-powietrza/ (accessed on 9 October 2020).
- Samek, L.; Stegowski, Z.; Styszko, K.; Furman, L.; Fiedor, J. Seasonal contribution of assessed sources to submicron and fine particulate matter in a Central European urban area. Environ. Pollut. 2018, 241, 406–411. [Google Scholar] [CrossRef] [PubMed]
- Samek, L.; Stegowski, Z.; Furman, L.; Styszko, K.; Szramowiat, K.; Fiedor, J. Quantitative Assessment of PM2.5 Sources and Their Seasonal Variation in Krakow. Water Air Soil Pollut. 2017, 228, 290. [Google Scholar] [CrossRef] [Green Version]
- Krakow Population. Available online: http://www.krakow-info.pl (accessed on 28 August 2020).
- Rybak, J.; Wróbel, M.; Bihałowicz, J.S.; Rogula-Kozłowska, W. Selected Metals in Urban Road Dust: Upper and Lower Silesia Case Study. Atmosphere 2020, 11, 290. [Google Scholar] [CrossRef] [Green Version]
- Available online: http://meteo2.ftj.agh.edu.pl/meteo (accessed on 14 August 2020).
- Belis, C.A.; Karagulian, F.; Larsen, B.R.; Hopke, P.K. Critical review and meta-analysis of ambient particulate matter source apportionment using receptor models in Europe. Atmos. Environ. 2013, 69, 94–108. [Google Scholar] [CrossRef]
- Rudnick, R.L.; Gao, S. The composition of the continental crust. In Treatise on Geochemistry—The Crust; Rudnick, R.L., Holland, H.D., Turekian, K.K., Eds.; Elsevier: Oxford, UK, 2003; pp. 1–64. [Google Scholar]
- Karagulian, F.; Belis, C.A. Enhancing source apportionment with receptor models to foster the air quality directive implementation. Int. J. Environ. Pollut. 2012, 50, 190–199. [Google Scholar] [CrossRef]
- UNION, PEAN. Directive 2008/50/EC of the European Parliament and the Council of 21 May 2008. Off. J. Eur. Union 2008, 51, 1–361. [Google Scholar]
- WHO Air Quality Guadelines for Particulate Matter, Ozone, Nitrogen Dioxide and Sulfur Dioxide: Global Update 2005-Summary of Risk Assessment. Available online: http://apps.who.int/iris/bitstream/10665/69477/1/WHO_SDE_PHE_OEH_06.02_eng.pd (accessed on 25 April 2018).
- Blaszczak, B.; Widziewicz-Rzonca, K.; Ziola, N.; Klejnowski, K.; Juda Rezler, K. Chemical Characteristic of Fine Particulate Matter in Poland in Relation with data from Selected Rural and Urban Bacground Stations in Europe. Appl. Sci. 2019, 9, 98. [Google Scholar] [CrossRef] [Green Version]
- Juda-Rezler, K.; Reizer, M.; Maciejewska, K.; Blaszczak, B.; Klejnowski, K. Characterization of atmospheric sources at a Central European urban background site. Sci. Total Environ. 2020, 713, 136729. [Google Scholar] [CrossRef] [PubMed]
- Almeida, S.M.; Manousakas, M.; Diapouli, E.; Kertesz, Z.; Samek, L.; Hristova, E.; Sega, K.; Padilla Alvarez, R.; Belis, C.A.; Eleftheriadis, K. The IAEA European Region Study GROUP, Ambient particulate matter source apportionment using receptor modelling in Euroean and Central Asia urban areas. Environ. Pollut. 2020, 266, 115199. [Google Scholar] [CrossRef] [PubMed]
- Raport GIOS. Ocena Zanieczyszczeń Powietrza Na Stacjach Monitoringu Tła Regionalnego W Polsce W 2014 Roku W Zakresie Pyłu Pm10, Pm2.5 Oraz Depozycji Metali I Wwa, Państwowy Monitoring Srodowiska; Inspekcja Ochrony Srodowiska: Warsaw, Poland, 2015. [Google Scholar]
- Kabata-Pendias, A.; Pendias, H. Biogeochemia Pierwistków Sladowych; PWN: Warsaw, Poland, 1999. [Google Scholar]
- Yu, L.; Wang, G.; Zhang, R.; Zhang, L.; Song, Y.; Wu, B.; Li, X.; An, K.; Chu, J. Characterization and Source Apportionment of PM2.5 in an Urban Environment in Beijing. Aerosol Air Qual. Res. 2013, 13, 574–583. [Google Scholar] [CrossRef] [Green Version]
- Manousakas, M.; Diapouli, E.; Papaefthymiou, H.; Migliori, A.; Karydas, A.G.; Padilla-Alvarez, R.; Bogovac, M.; Kaiser, R.B.; Jaksic, M.; Bogdanovic-Radovic, I.; et al. Source apportionment by PMF on elemental concentrations obtained by PIXE analysis of PM10 samples collected at the vicinity of lignite power plants and mines in Megalopolis, Greece. Nuc. Instrum. Meth. B 2015, 349, 114–124. [Google Scholar] [CrossRef]


| Element/Ion | Summer 2018 | Autumn 2018 | Winter 2019 | Spring 2019 | Annual | W/S | LLD |
|---|---|---|---|---|---|---|---|
| PM2.5 | 14.8 ± 4.1 | 28 ± 12 | 34,8 ± 19 | 17 ± 8 | 24 ± 13 | 2.34 | |
| Si | 300 ± 92 | <LLD | 249 ± 94 | <LLD | 177 ± 43 | 0.83 | 300 |
| P | 103 ± 29 | 57 ± 24 | 120 ± 28 | <LLD | 39 ± 25 | 1.16 | 48 |
| S | 1122 ± 340 | 1303 ± 580 | 1344 ± 660 | 836 ± 340 | 1160 ± 500 | 1.20 | 60 |
| Cl | 102 ± 66 | 669 ± 540 | 1393 ± 710 | 358 ± 300 | 630 ± 590 | 13.7 | 21 |
| K | 130 ± 48 | 282 ± 120 | 318 ± 180 | 139 ± 68 | 230 ± 140 | 2.46 | 15 |
| Ca | 56 ± 25 | 150 ± 64 | 47 ± 17 | 30 ± 17 | 50 ± 30 | 0.85 | 8.6 |
| Ti | 7.0 ± 0.8 | 11 ± 7 | 20 ± 11 | 7.3 ± 3.6 | 7.1 ± 3.6 | 2.86 | 6.4 |
| V | 6.95 ± 2.80 | <LLD | 10.1 ± 4.9 | <LLD | 4.3 ± 2.6 | 1.45 | 5.4 |
| Cr | 7.51 ± 4.40 | 4.21 ± 1.50 | 10.20 ± 4.30 | <LLD | 5.1 ± 3.7 | 1.36 | 4.3 |
| Mn | 7.65 ± 3.20 | 13.14 ± 8.00 | 10.74 ± 4.50 | 4.81 ± 2.20 | 9.0 ± 6.0 | 1.40 | 1.2 |
| Fe | 154 ± 75 | 270 ± 210 | 94 ± 52 | 60 ± 37 | 150 ± 120 | 0.61 | 2.2 |
| Co | 1.70 ± 0.49 | 2.6 ± 1.1 | 3.5 ± 1.8 | 0.94 ± 0.46 | 2.4 ± 1.4 | 2.05 | 1.0 |
| Ni | 4.71 ± 2.50 | 2.18 ± 0.40 | 33 ± 40 | <LLD | 5.9 ± 8.0 | 7.07 | 1.0 |
| Cu | 9.8 ± 7.5 | 10.4 ± 6.1 | 7.4 ± 4.2 | 1.9 ± 1.0 | 5.9 ± 5.0 | 0.76 | 1.0 |
| Zn | 54 ± 32 | 136 ± 100 | 70 ± 36 | 31 ± 20 | 75 ± 56 | 1.30 | 1.0 |
| Br | 4.31 ± 1.30 | 7.64 ± 3.60 | 12.6 ± 4.70 | 4.8 ± 2.30 | 7.5 ± 4.1 | 2.92 | 0.8 |
| Rb | 1.11 ± 0.50 | 0.71 ± 0.25 | 2.6 ± 2.8 | 0.7 ± 0.2 | 1.2±1.0 | 2.33 | 0.8 |
| Sr | 1.15 ± 0.46 | 1.18 ± 0.86 | 2.07 ± 2.5 | 0.82 ± 0.76 | 1.0 ± 1.0 | 1.79 | 0.8 |
| Pb | 14.1 ± 4.2 | 21.9 ± 12.0 | 22.9 ± 9.3 | <LLD | 12.5 ± 9.8 | 1.62 | 0.8 |
| NO3− | 670 ± 280 | 2450 ± 1800 | 3320 ± 2000 | 2330 ± 1400 | 2240 ± 1700 | 4.96 | 40 |
| SO42− | 3050 ± 1200 | 3330 ± 1500 | 3020 ± 1700 | 2500 ± 1100 | 2990 ± 1400 | 0.99 | 20 |
| Cl− | 230 ± 130 | 680 ± 360 | 1440 ± 780 | 1290 ± 900 | 920 ± 710 | 6.30 | 90 |
| NH4+ | 960 ± 300 | 1640 ± 810 | 1890 ± 800 | 1220 ± 500 | 1450 ± 700 | 1.97 | 70 |
| Na+ | 290 ± 140 | 390 ± 170 | 410 ± 140 | 360 ± 130 | 370 ± 140 | 1.40 | 90 |
| Source | 2014/2015 Krakow [19] | 2016/2017 Krakow [18] | 2018/2019 Krakow Present Study | |||
|---|---|---|---|---|---|---|
| % | µg/m3 | % | µg/m3 | % | µg/m3 | |
| PM2.5 | - | 34.4 | - | 33.5 | - | 24 |
| Coal Combustion | 22.9 | 7.88 | 30.5 | 10.21 | 43 | 9.3 |
| Biomass Burning | 15.6 | 5.37 | ||||
| Secondary Sulphate | 17.1 | 5.88 | 38.6 | 12.93 | 24 | 5.2 |
| Secondary Nitrate | 19.3 | 6.63 | ||||
| Industry/Soil | 2.5 | 0.86 | 25.8 | 8.64 | 28 | 7.2 |
| Traffic | 8.3 | 2.86 | ||||
© 2020 by the authors. Licensee MDPI, Basel, Switzerland. This article is an open access article distributed under the terms and conditions of the Creative Commons Attribution (CC BY) license (http://creativecommons.org/licenses/by/4.0/).
Share and Cite
Samek, L.; Turek-Fijak, A.; Skiba, A.; Furman, P.; Styszko, K.; Furman, L.; Stegowski, Z. Complex Characterization of Fine Fraction and Source Contribution to PM2.5 Mass at an Urban Area in Central Europe. Atmosphere 2020, 11, 1085. https://doi.org/10.3390/atmos11101085
Samek L, Turek-Fijak A, Skiba A, Furman P, Styszko K, Furman L, Stegowski Z. Complex Characterization of Fine Fraction and Source Contribution to PM2.5 Mass at an Urban Area in Central Europe. Atmosphere. 2020; 11(10):1085. https://doi.org/10.3390/atmos11101085
Chicago/Turabian StyleSamek, Lucyna, Anna Turek-Fijak, Alicja Skiba, Przemyslaw Furman, Katarzyna Styszko, Leszek Furman, and Zdzislaw Stegowski. 2020. "Complex Characterization of Fine Fraction and Source Contribution to PM2.5 Mass at an Urban Area in Central Europe" Atmosphere 11, no. 10: 1085. https://doi.org/10.3390/atmos11101085