Integrated Ozonation-Enzymatic Hydrolysis Pretreatment of Sugarcane Bagasse: Enhancement of Sugars Released to Expended Ozone Ratio

 ,
,
Abstract
:1. Introduction
2. Materials and Methods
2.1. Substrate
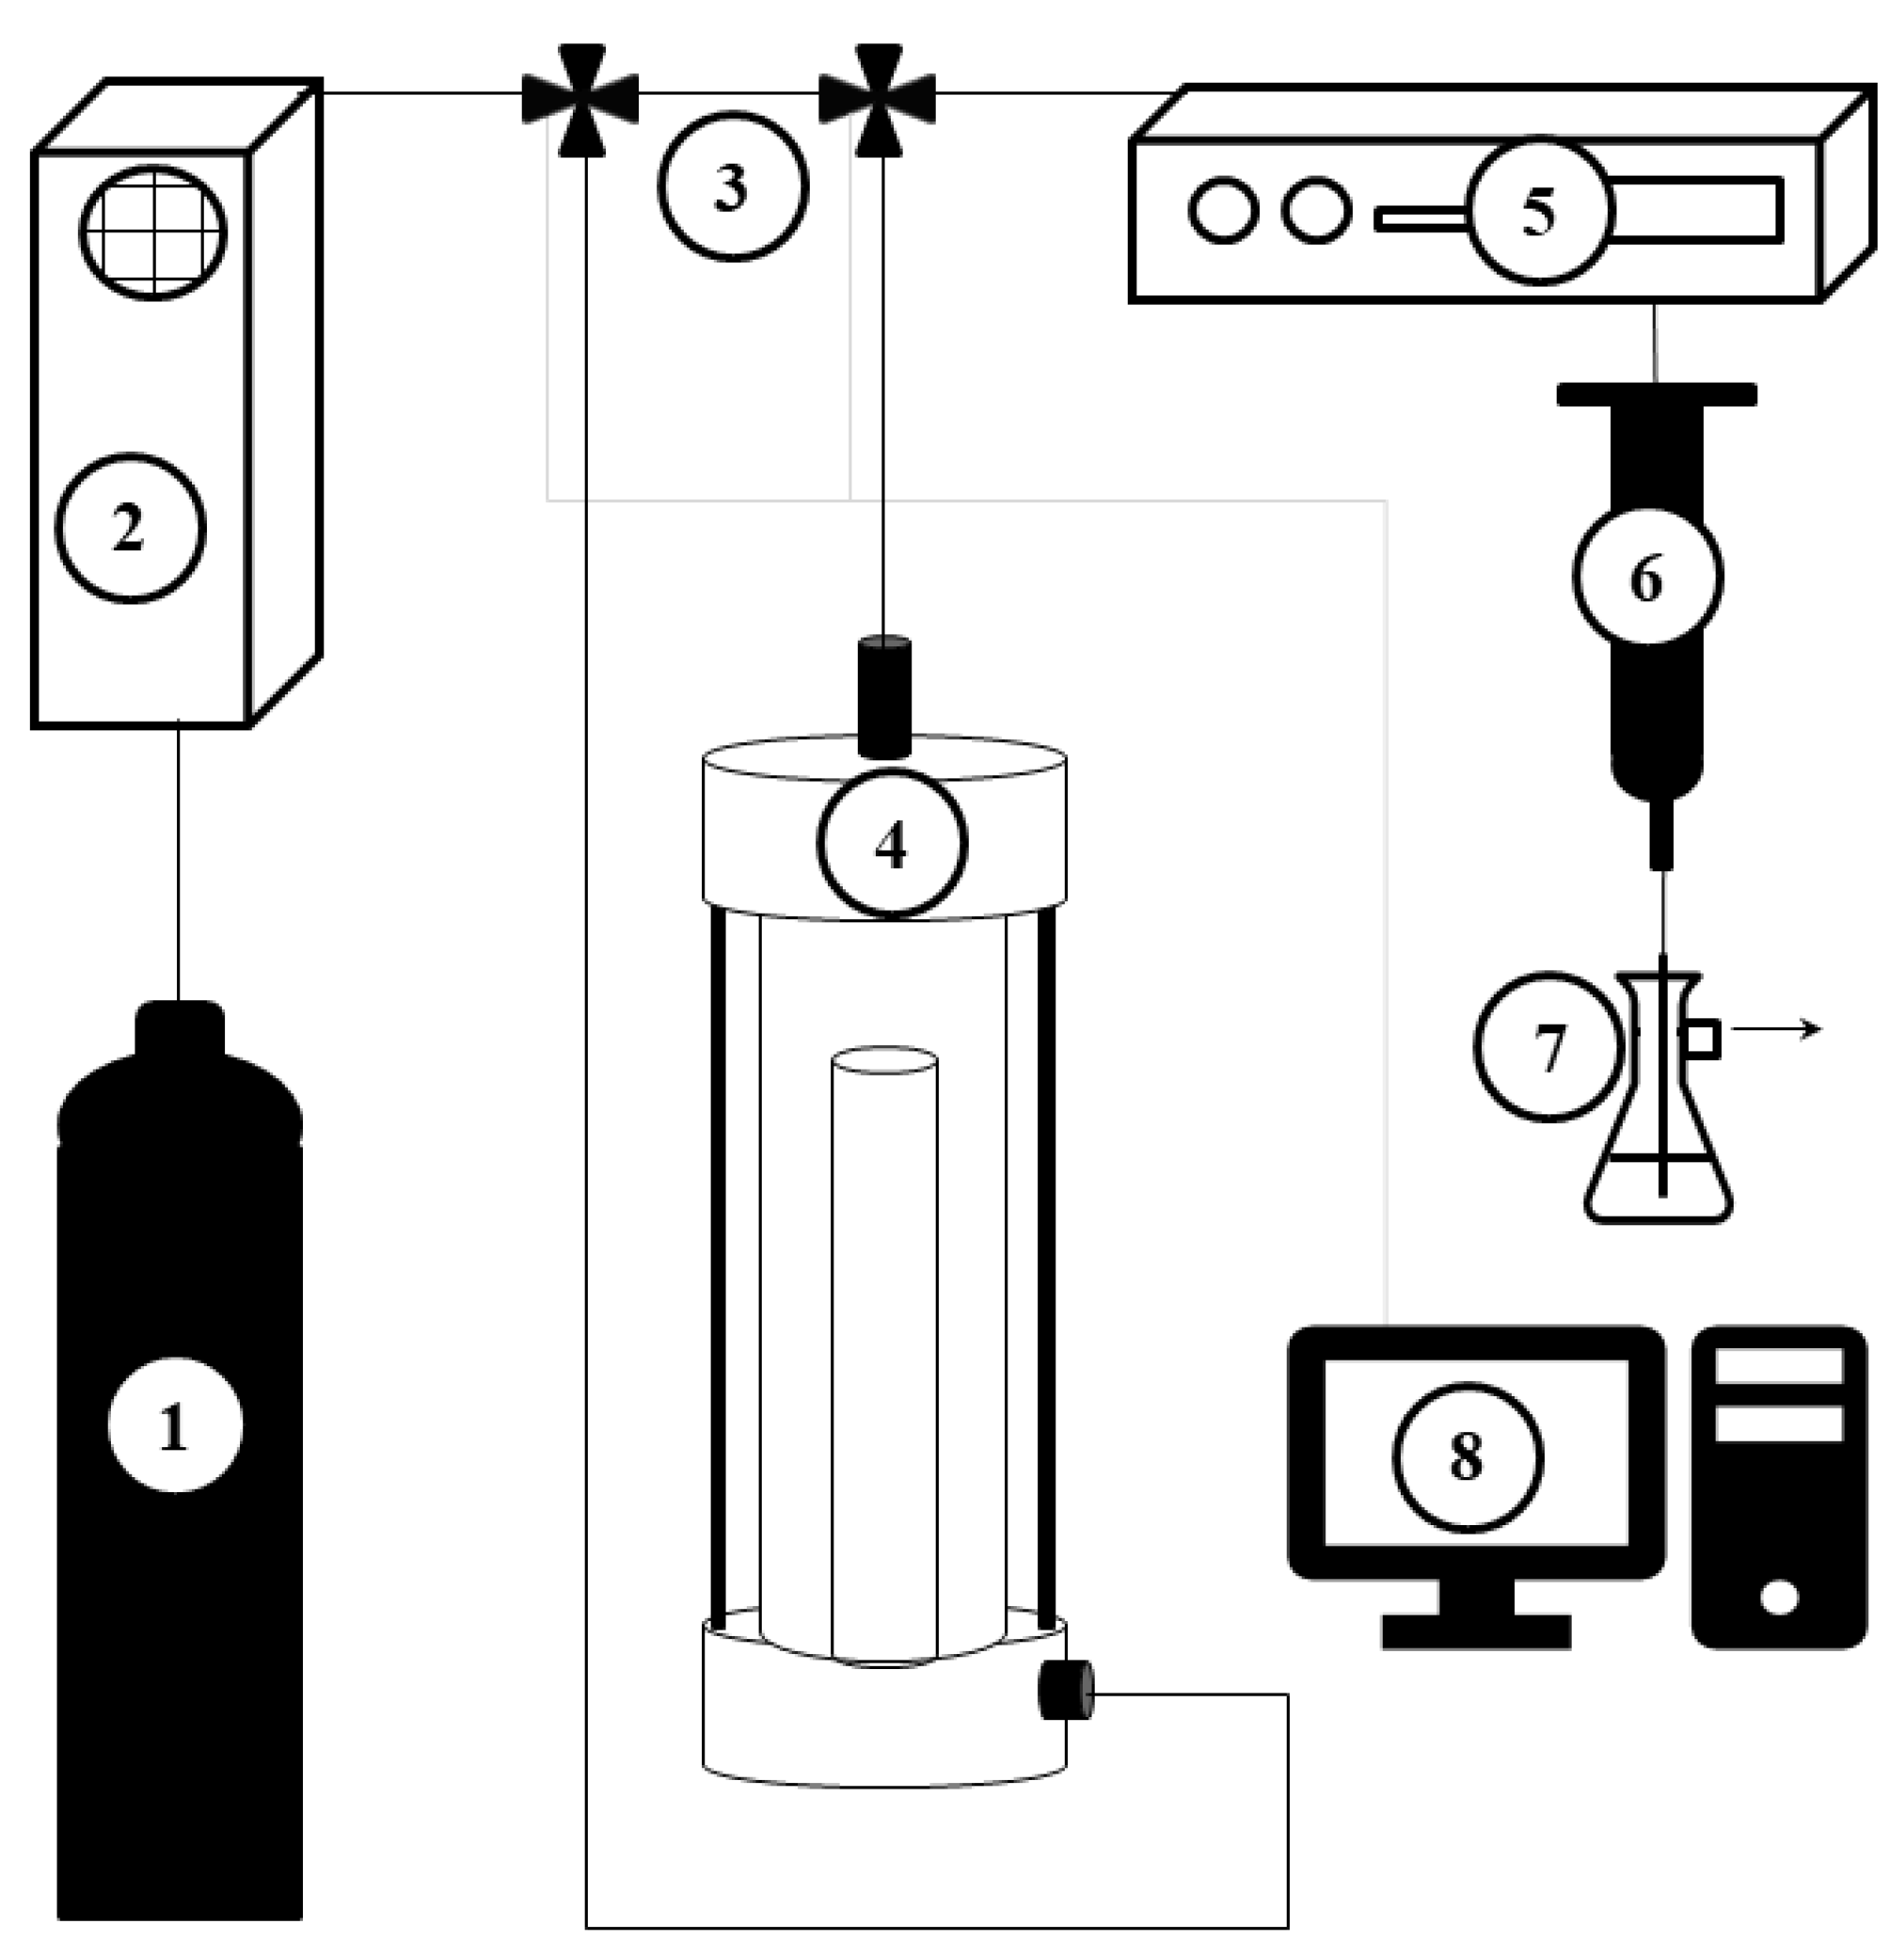
2.2. Ozonation: Experimental Set-Up and Operating Conditions
2.3. Enzymatic Hydrolysis
2.4. Analytical Methods
2.5. Data Analysis
3. Results and Discussion
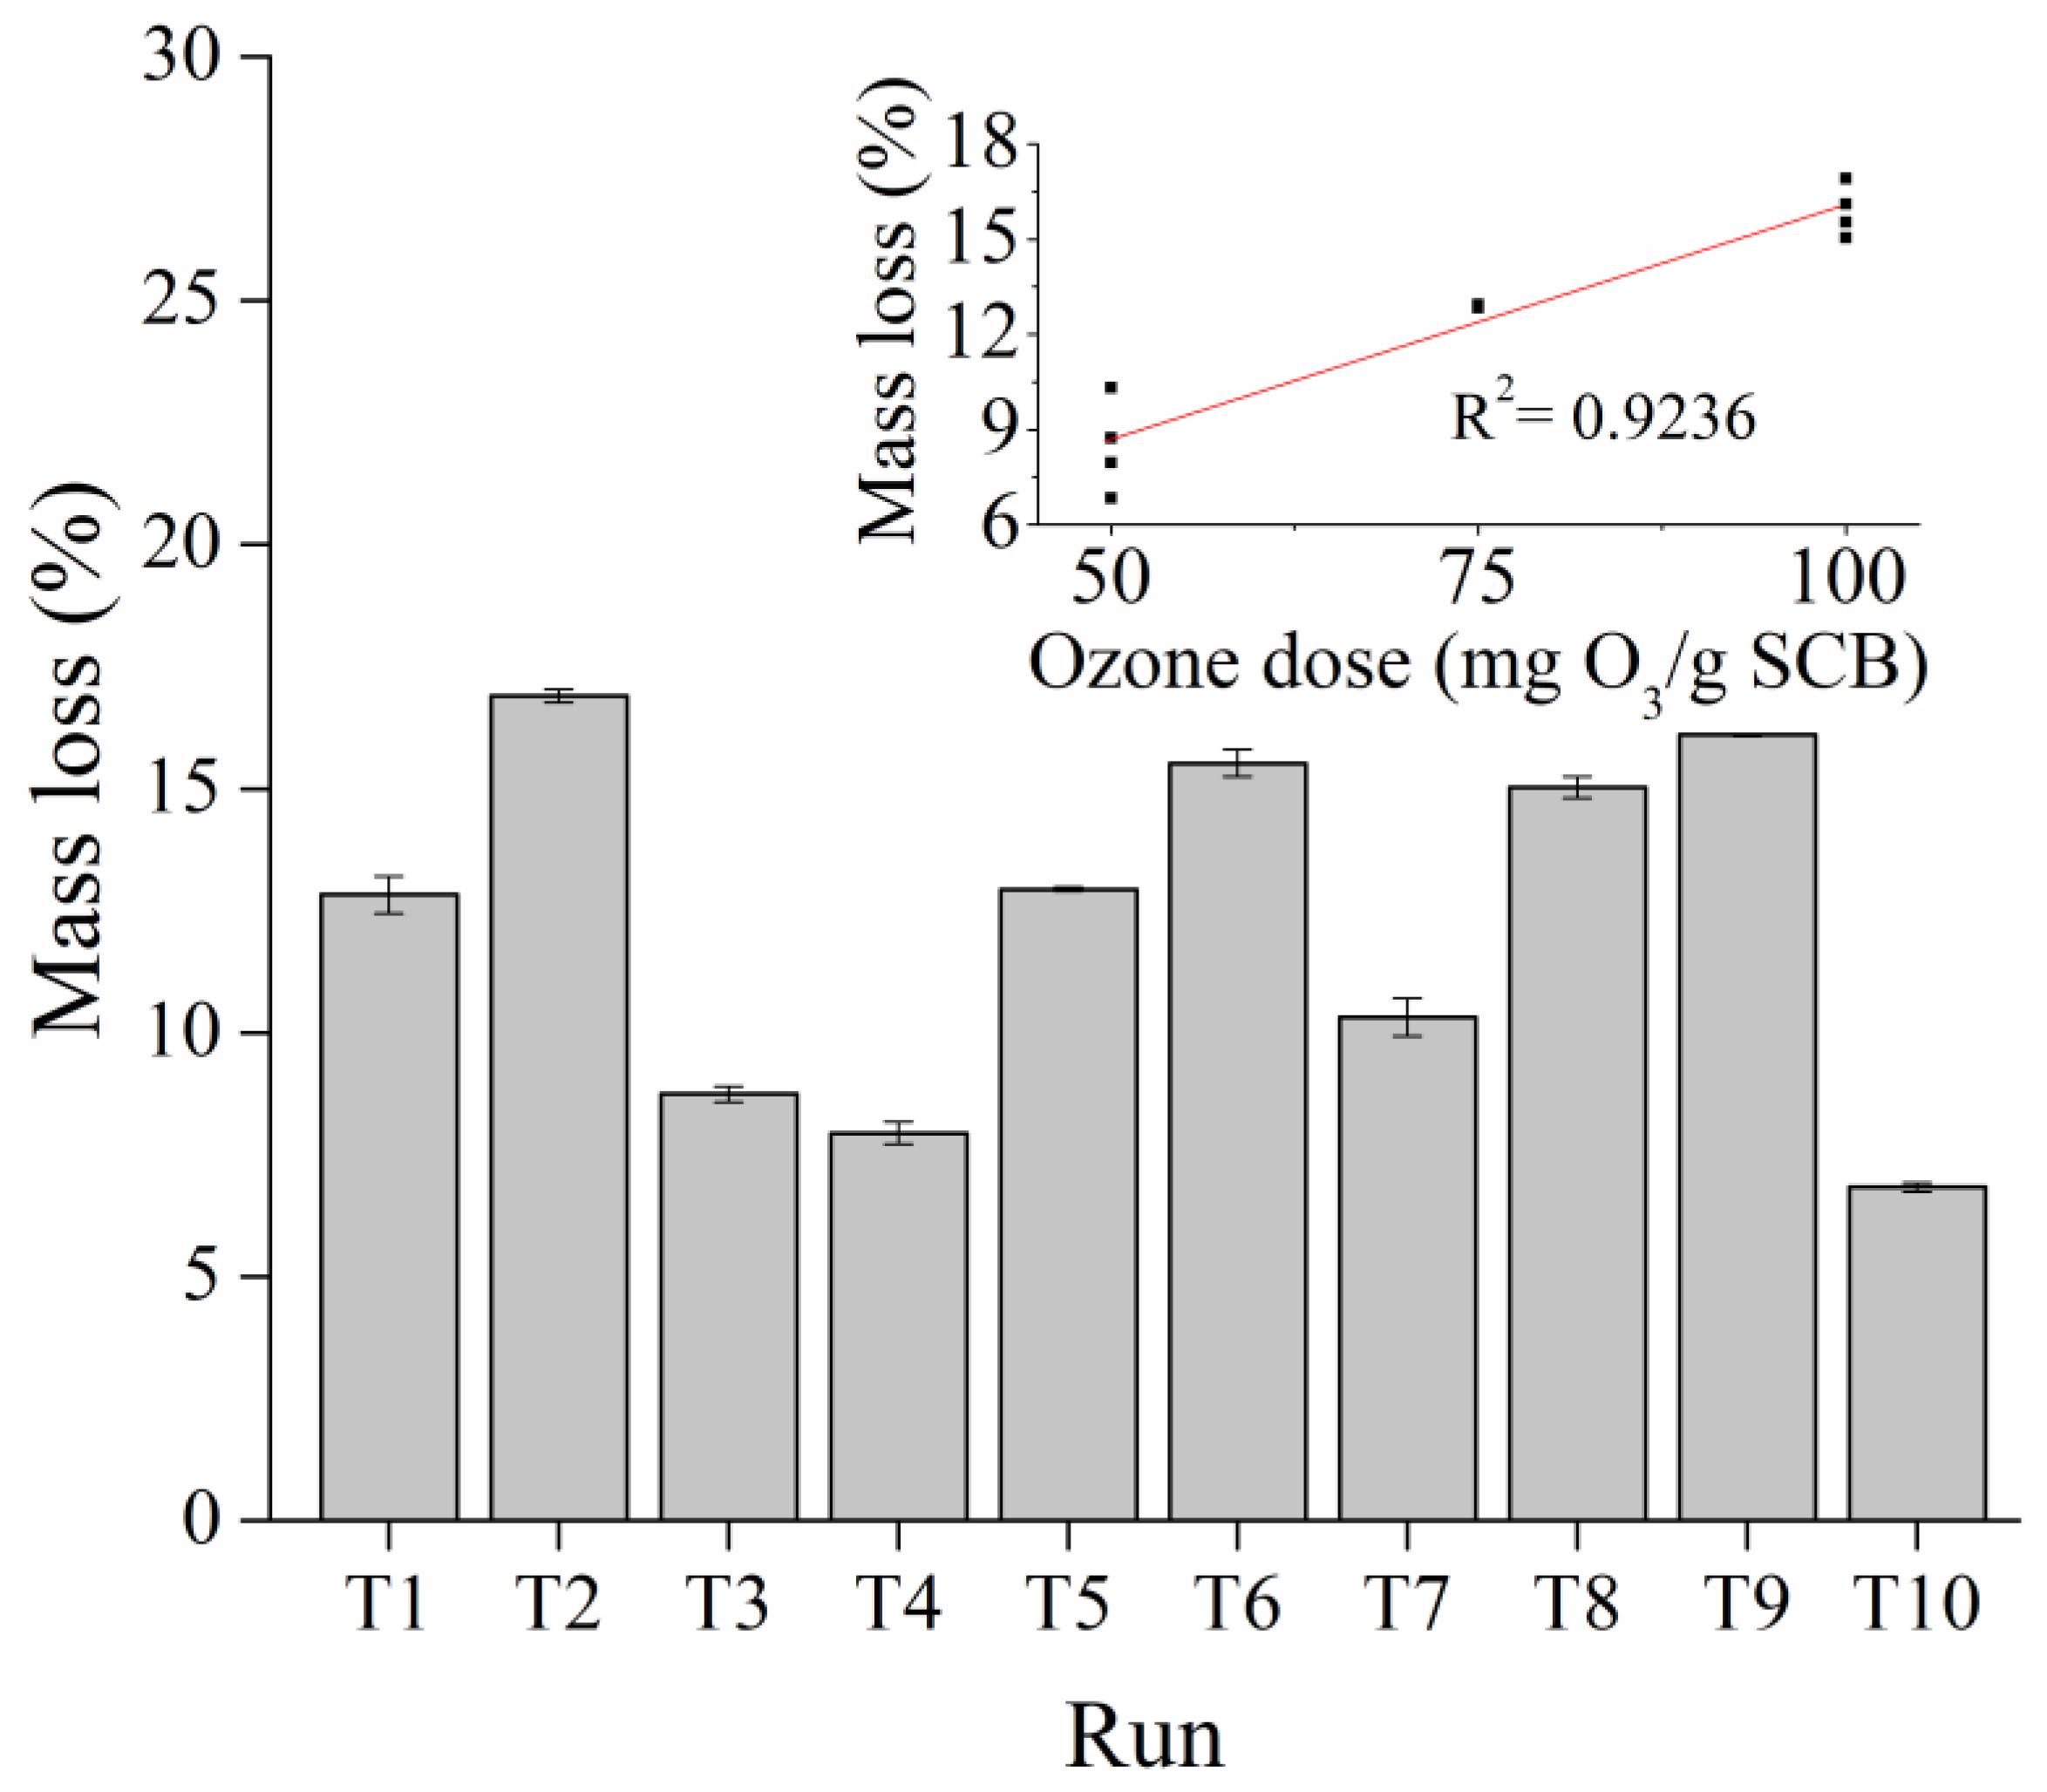
3.1. Effects of Ozonation on the Composition of Sugarcane Bagasse
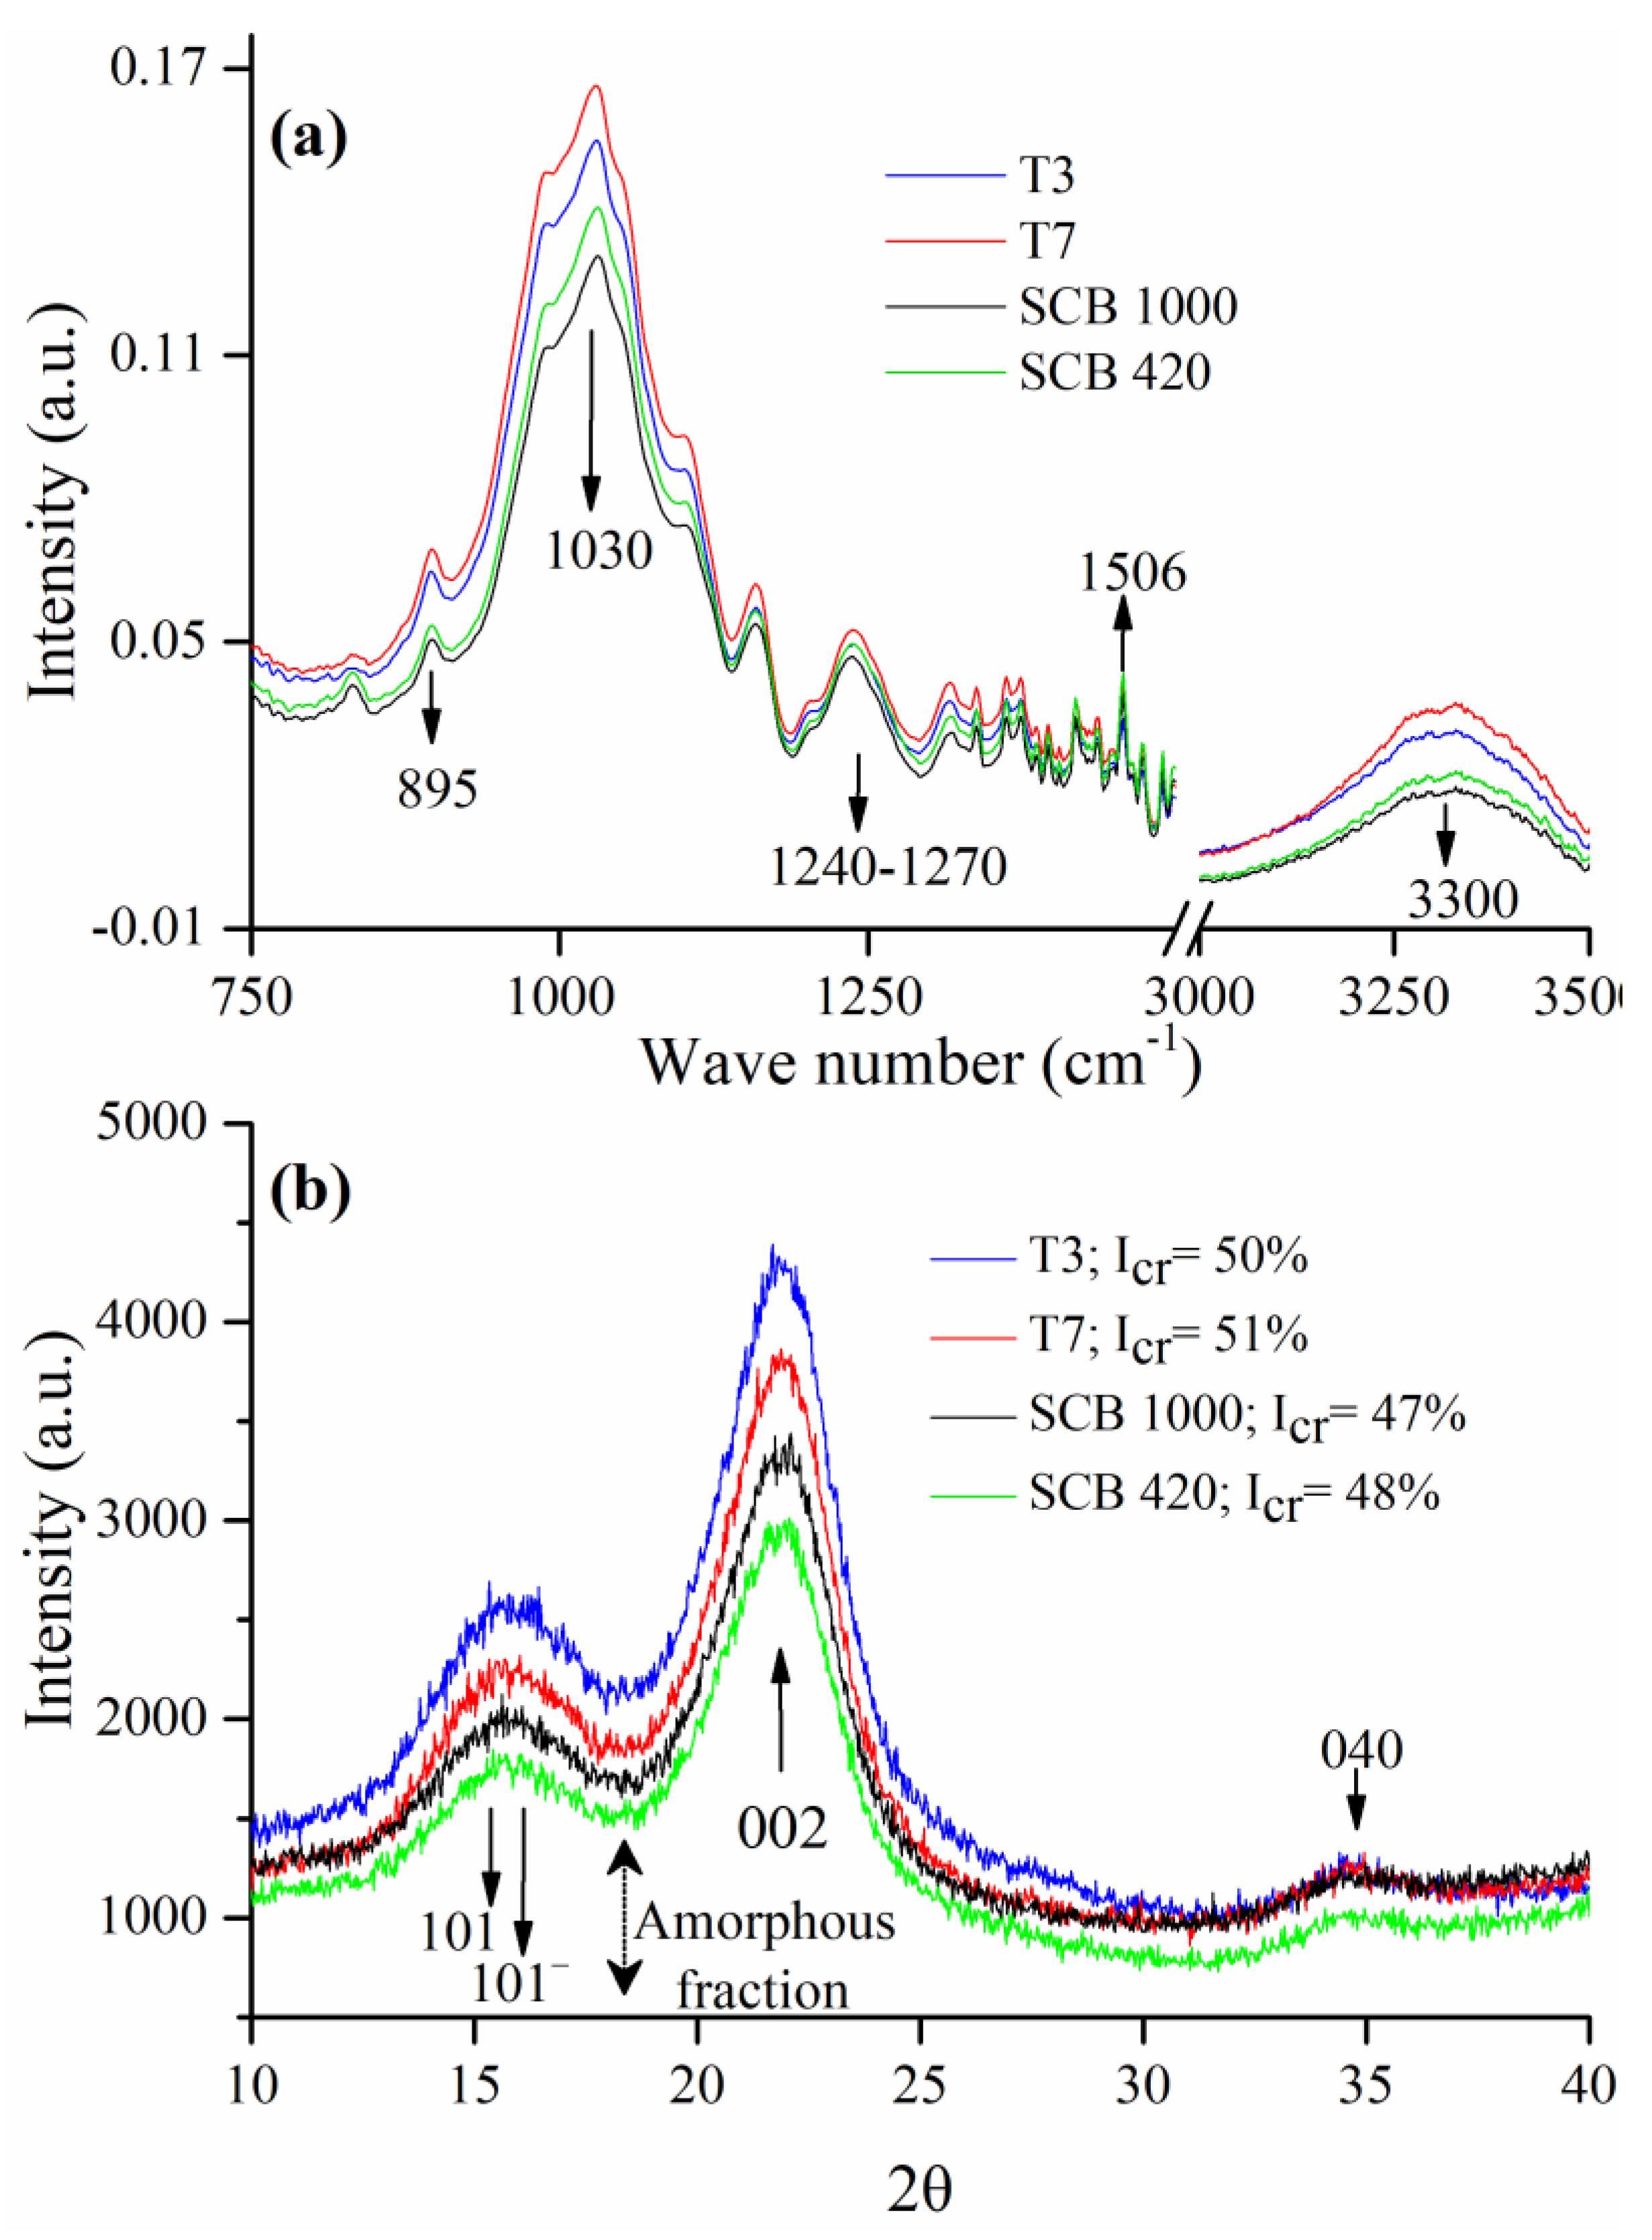
3.2. FTIR Analysis
3.3. XRD Analysis
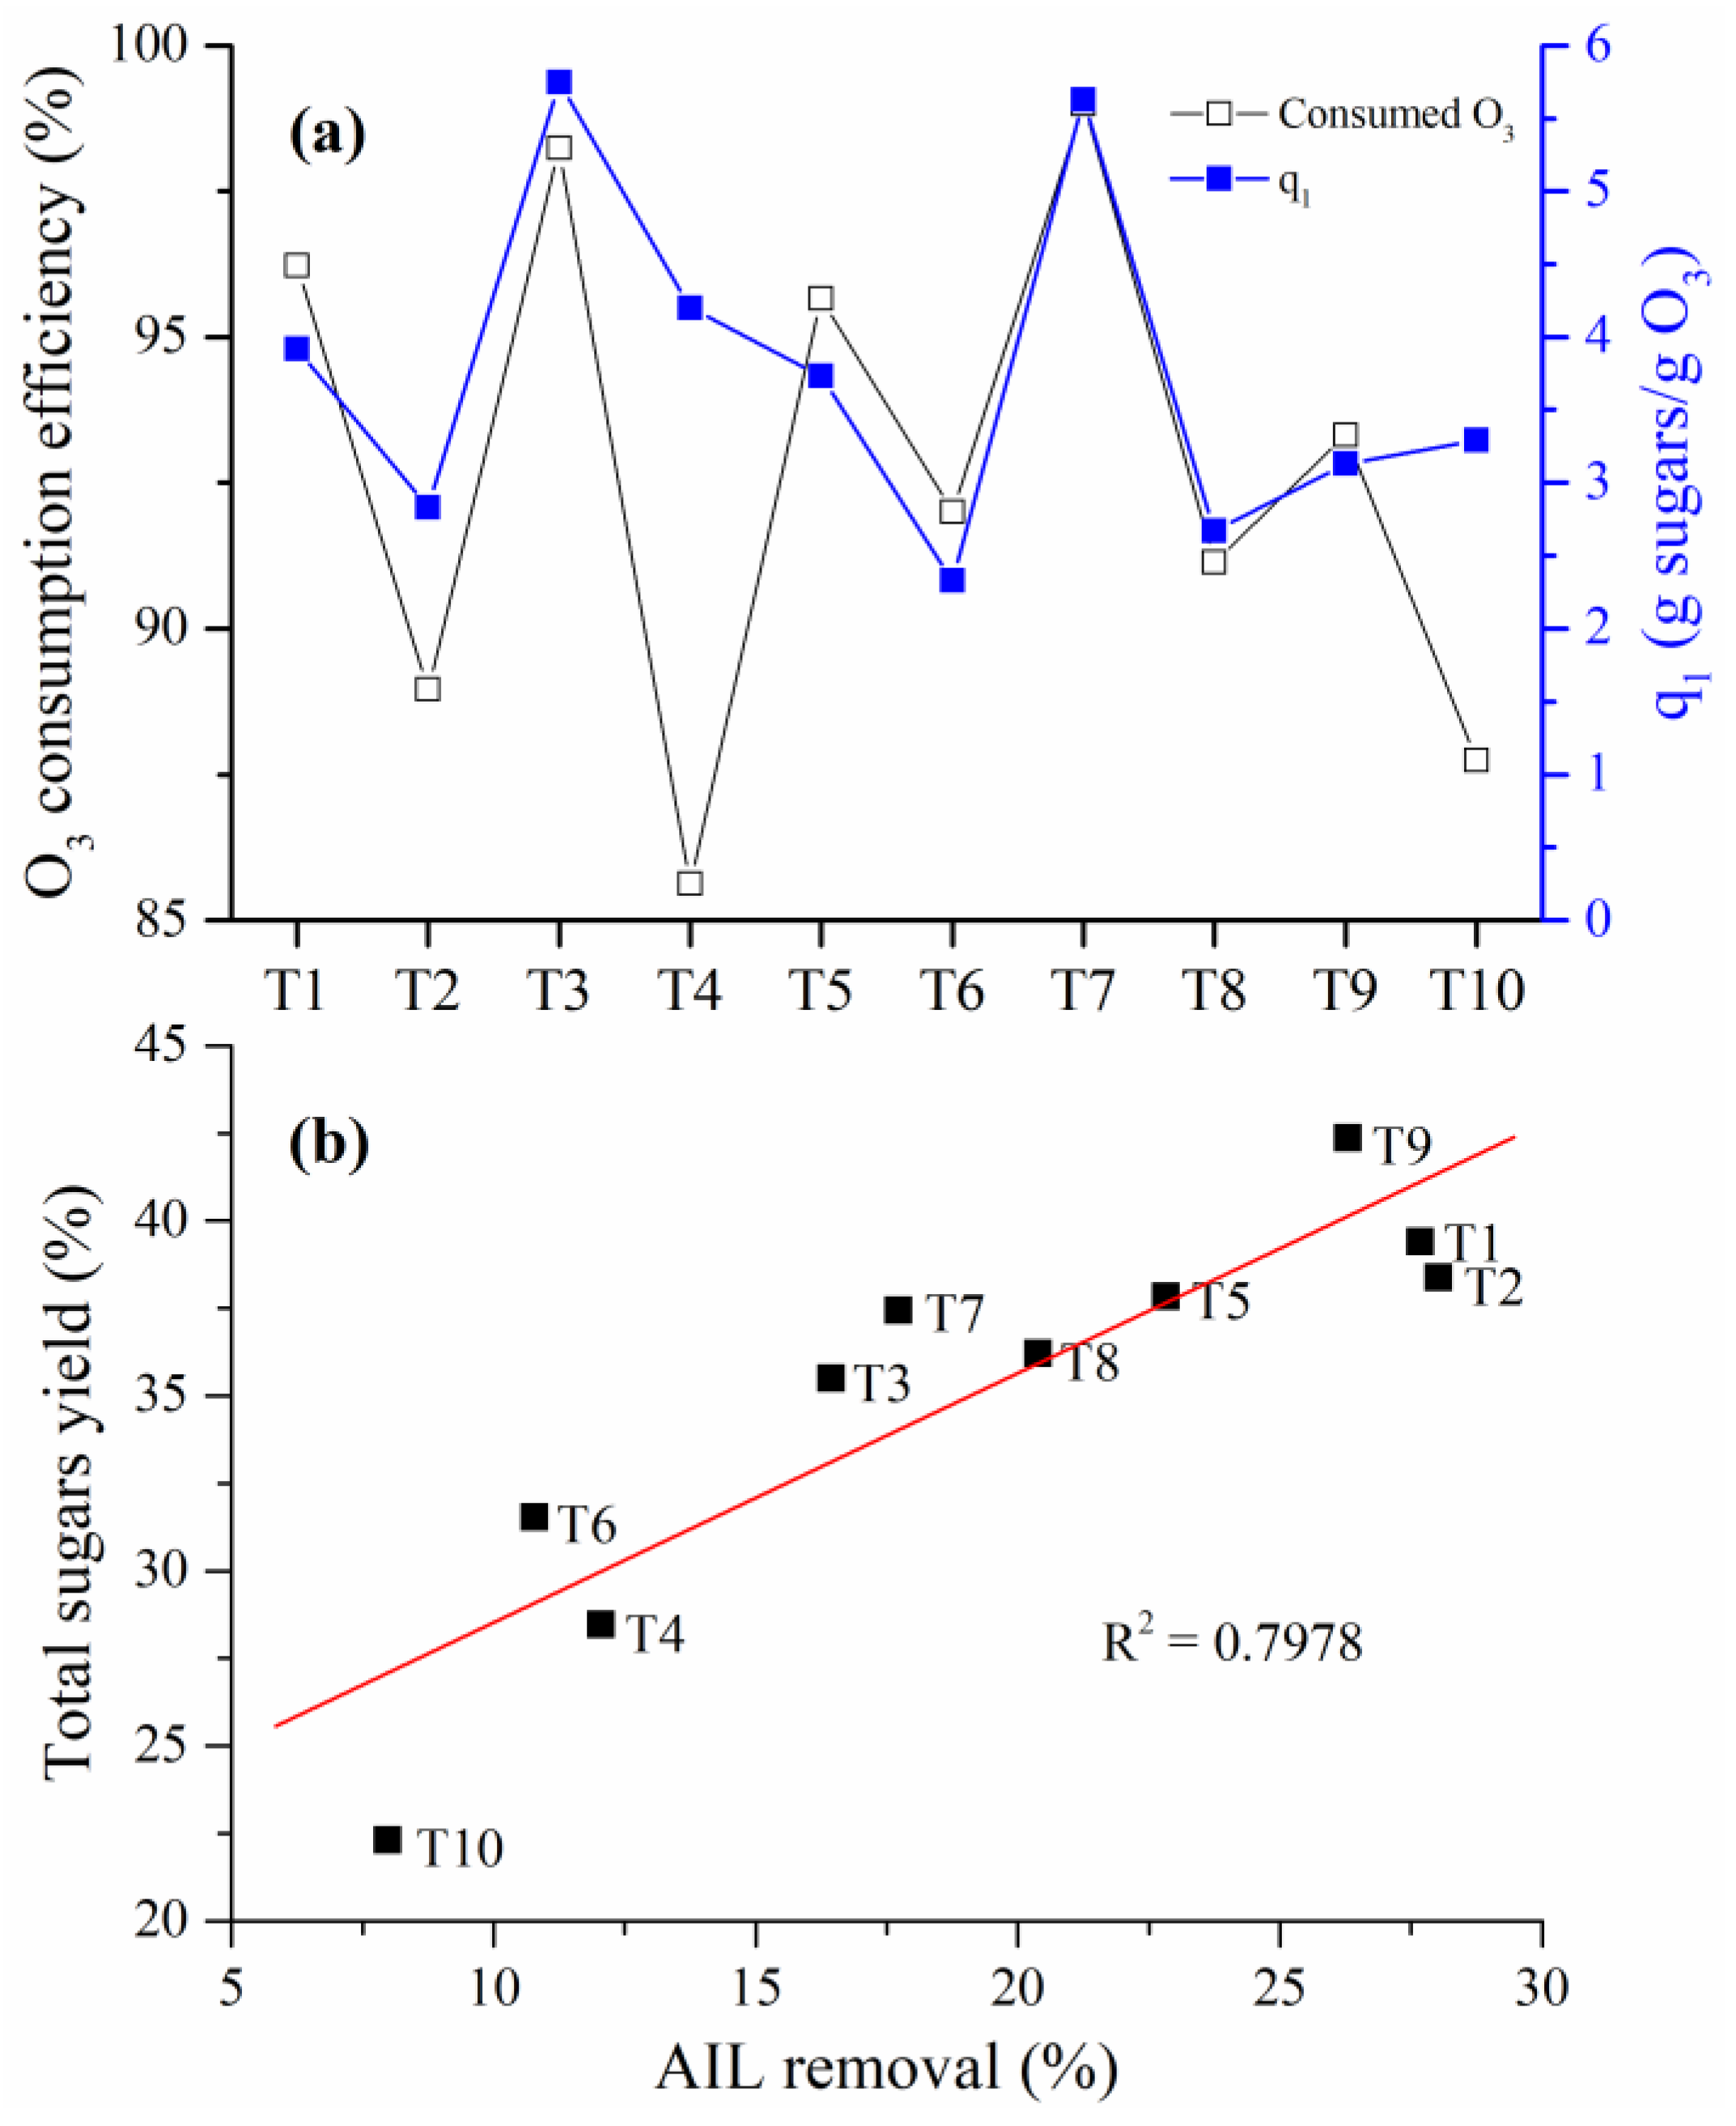
3.4. Effect of Ozonation Conditions on Consumed Ozone
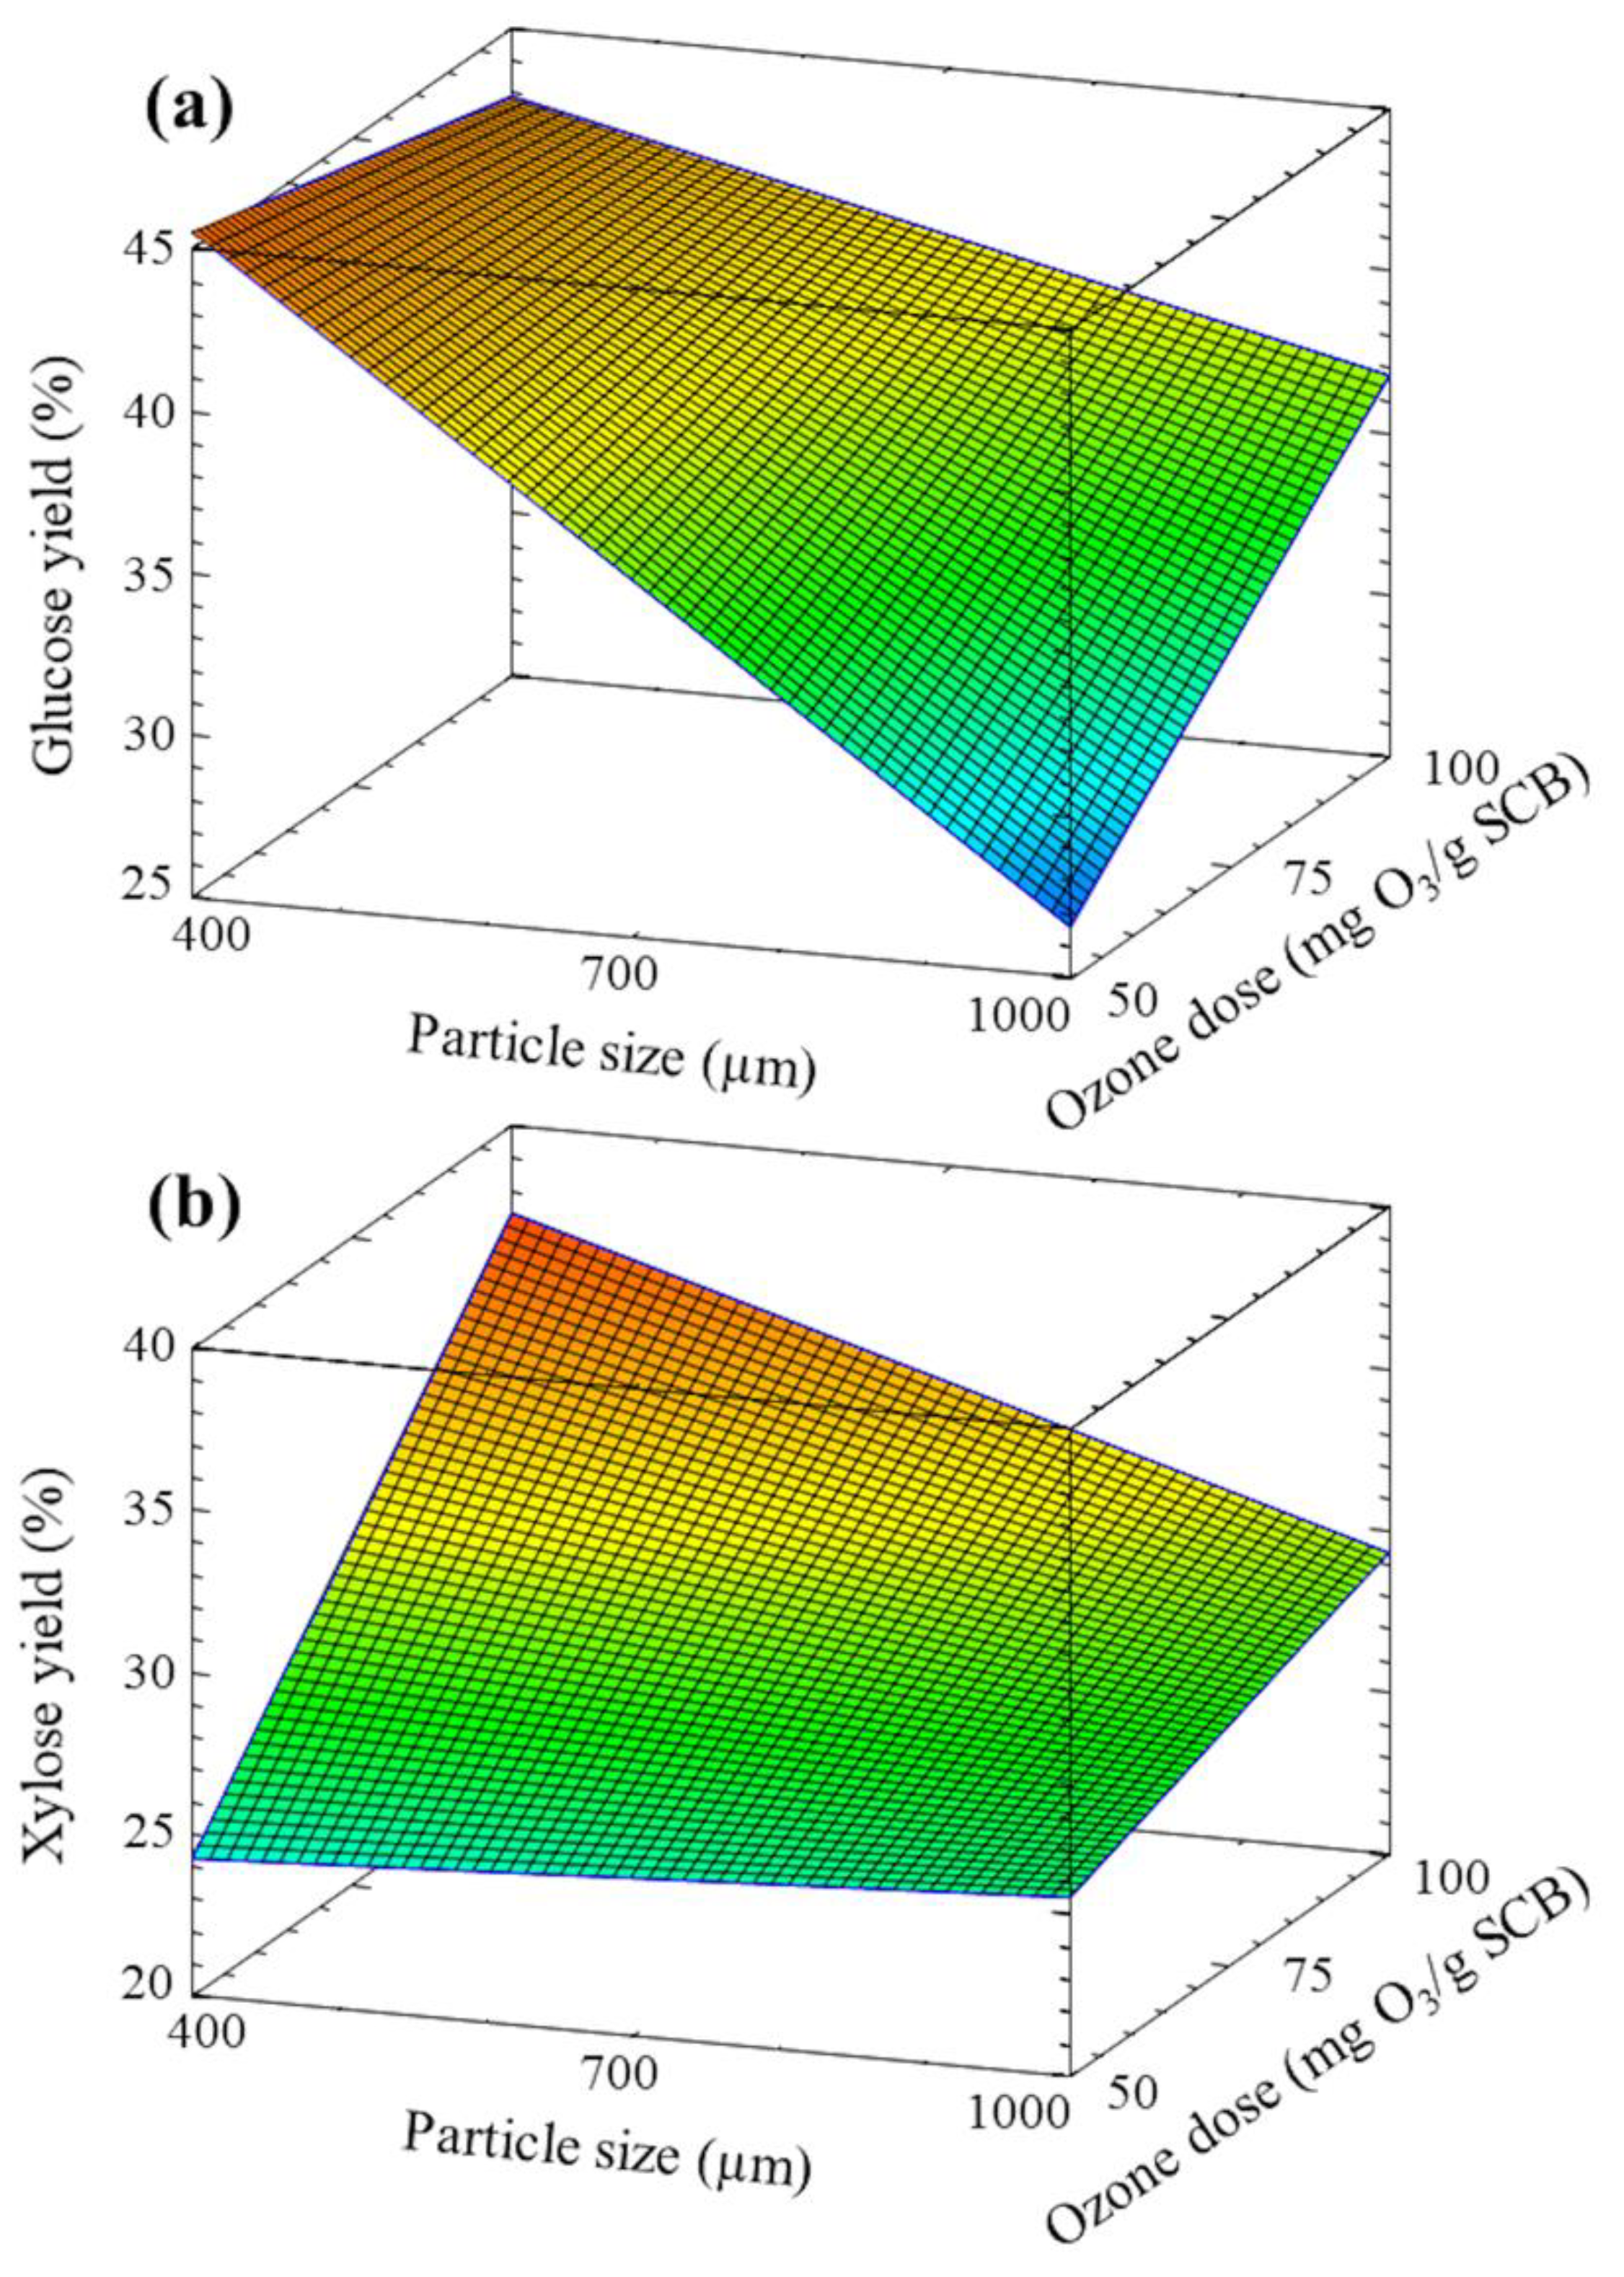
3.5. Effect of Ozone Pretreatment on Sugars Release Yields
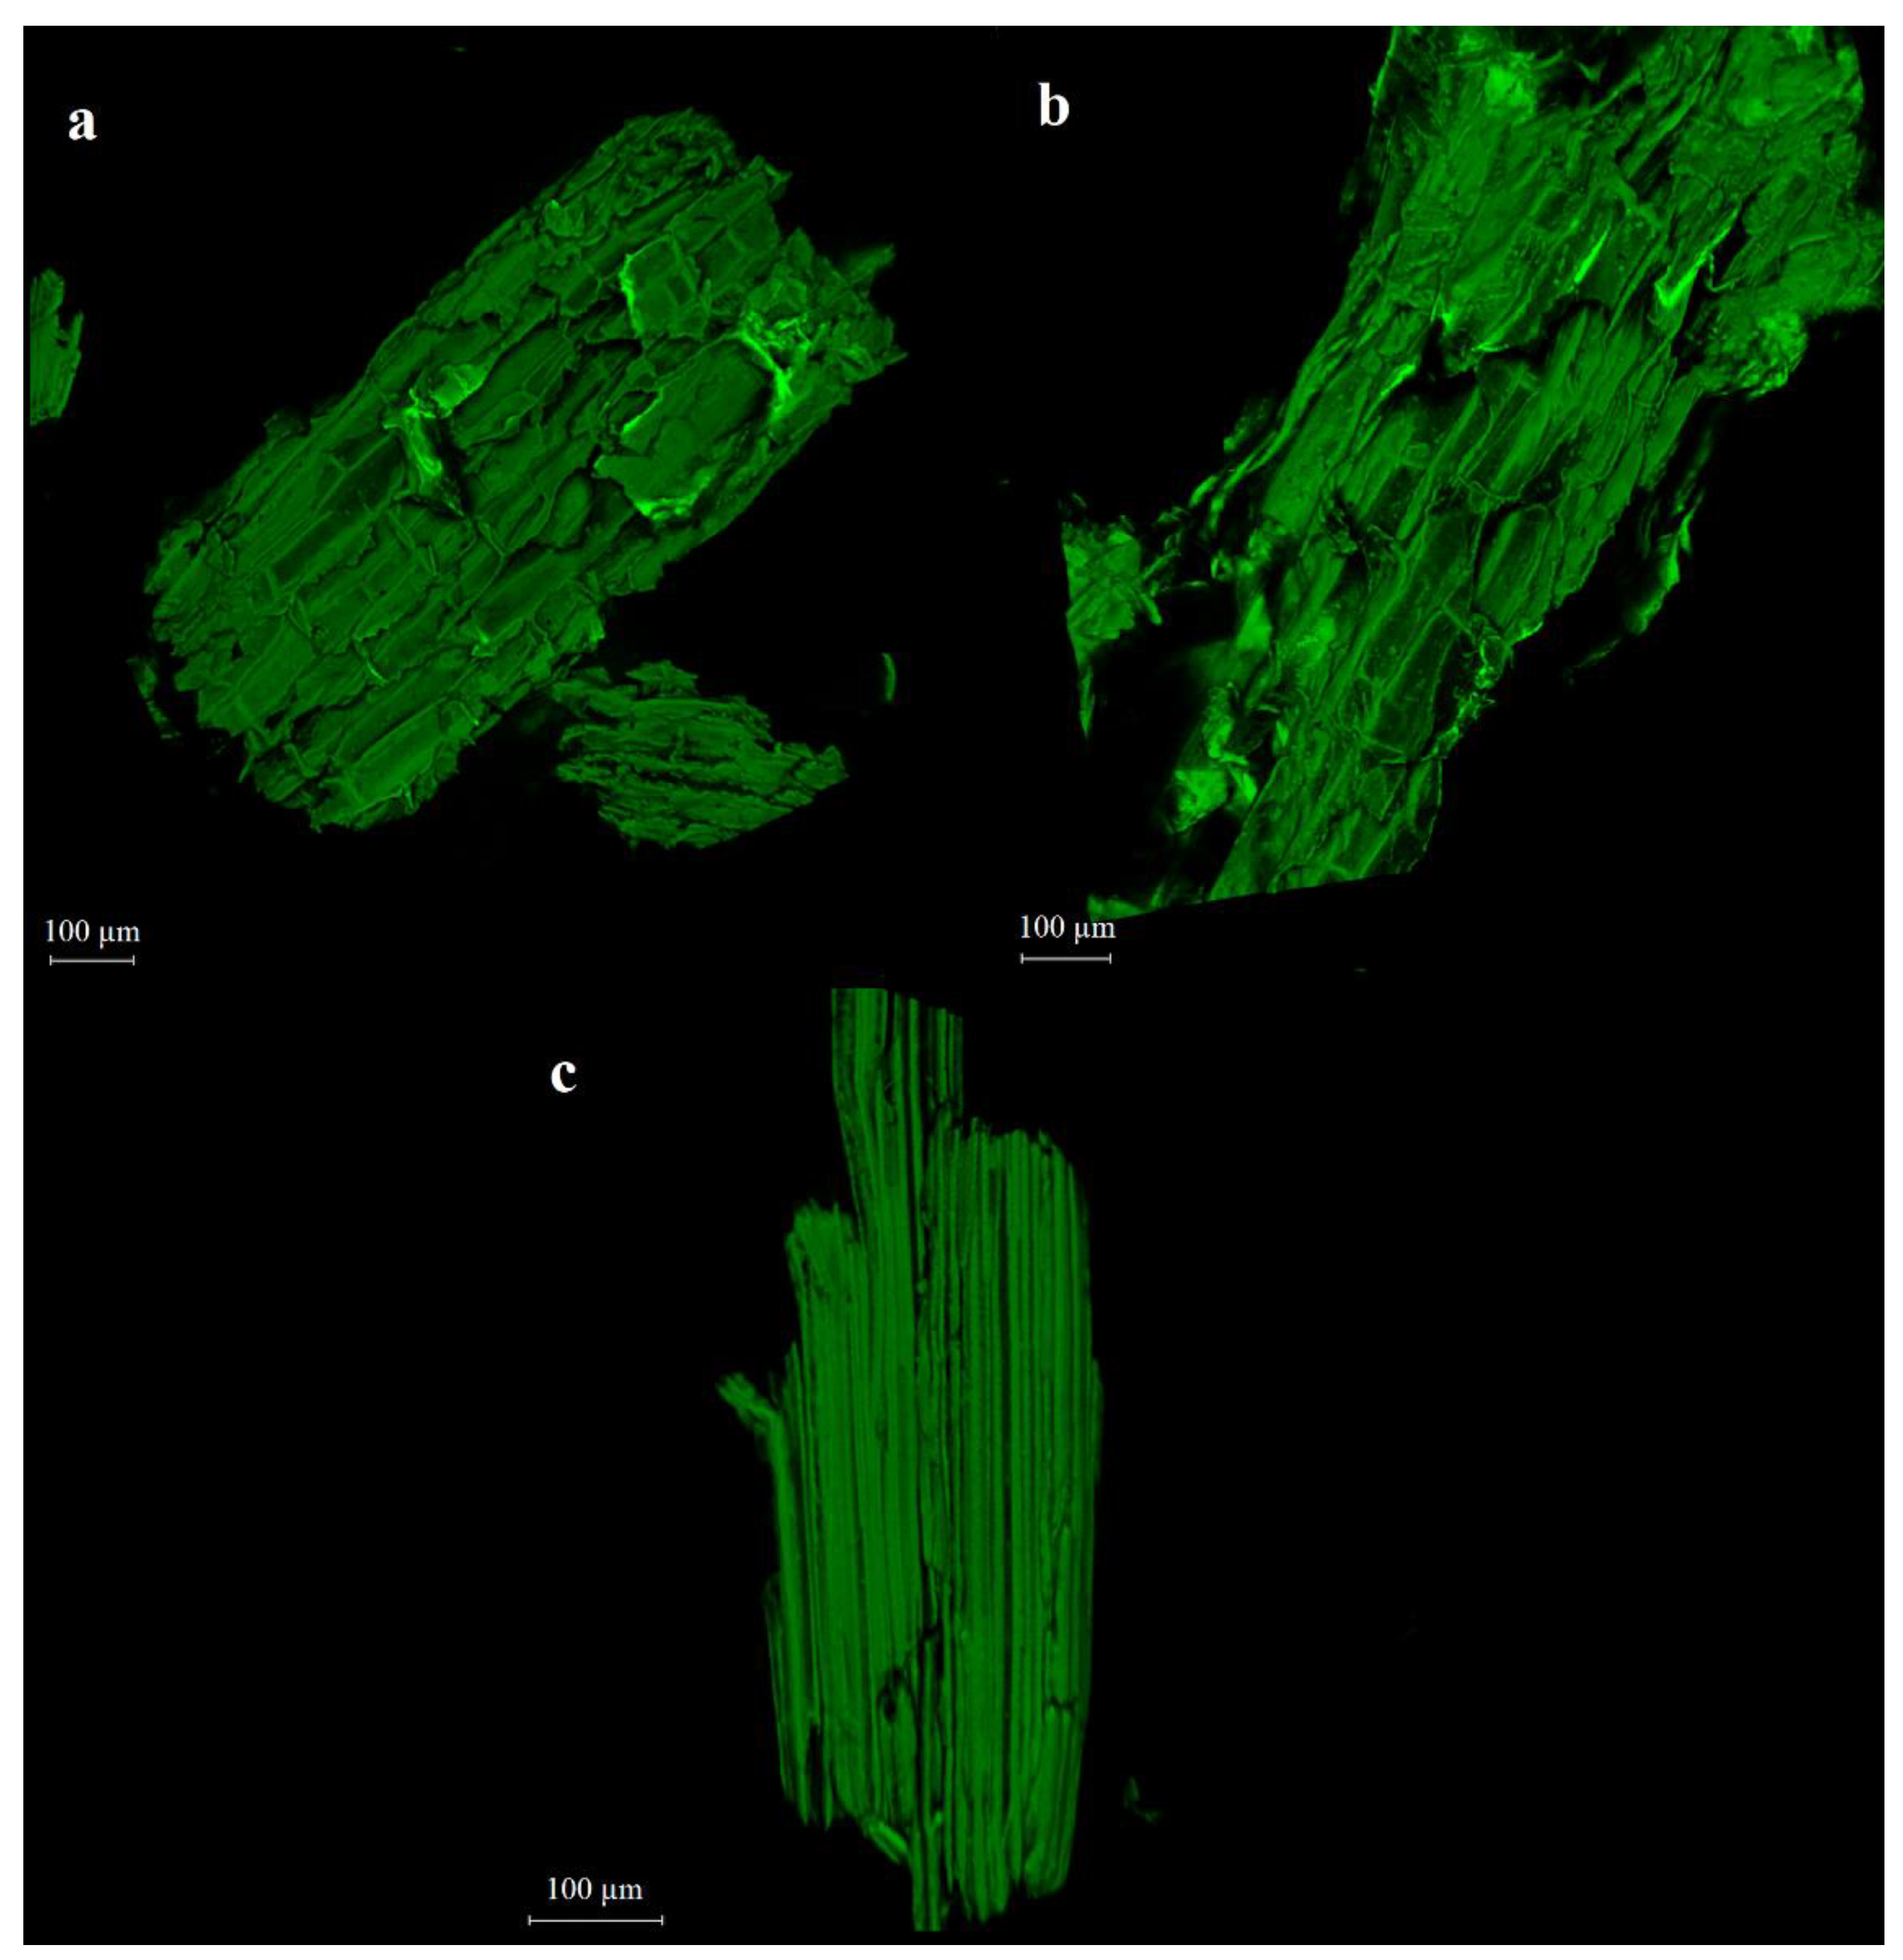
3.6. CLSM
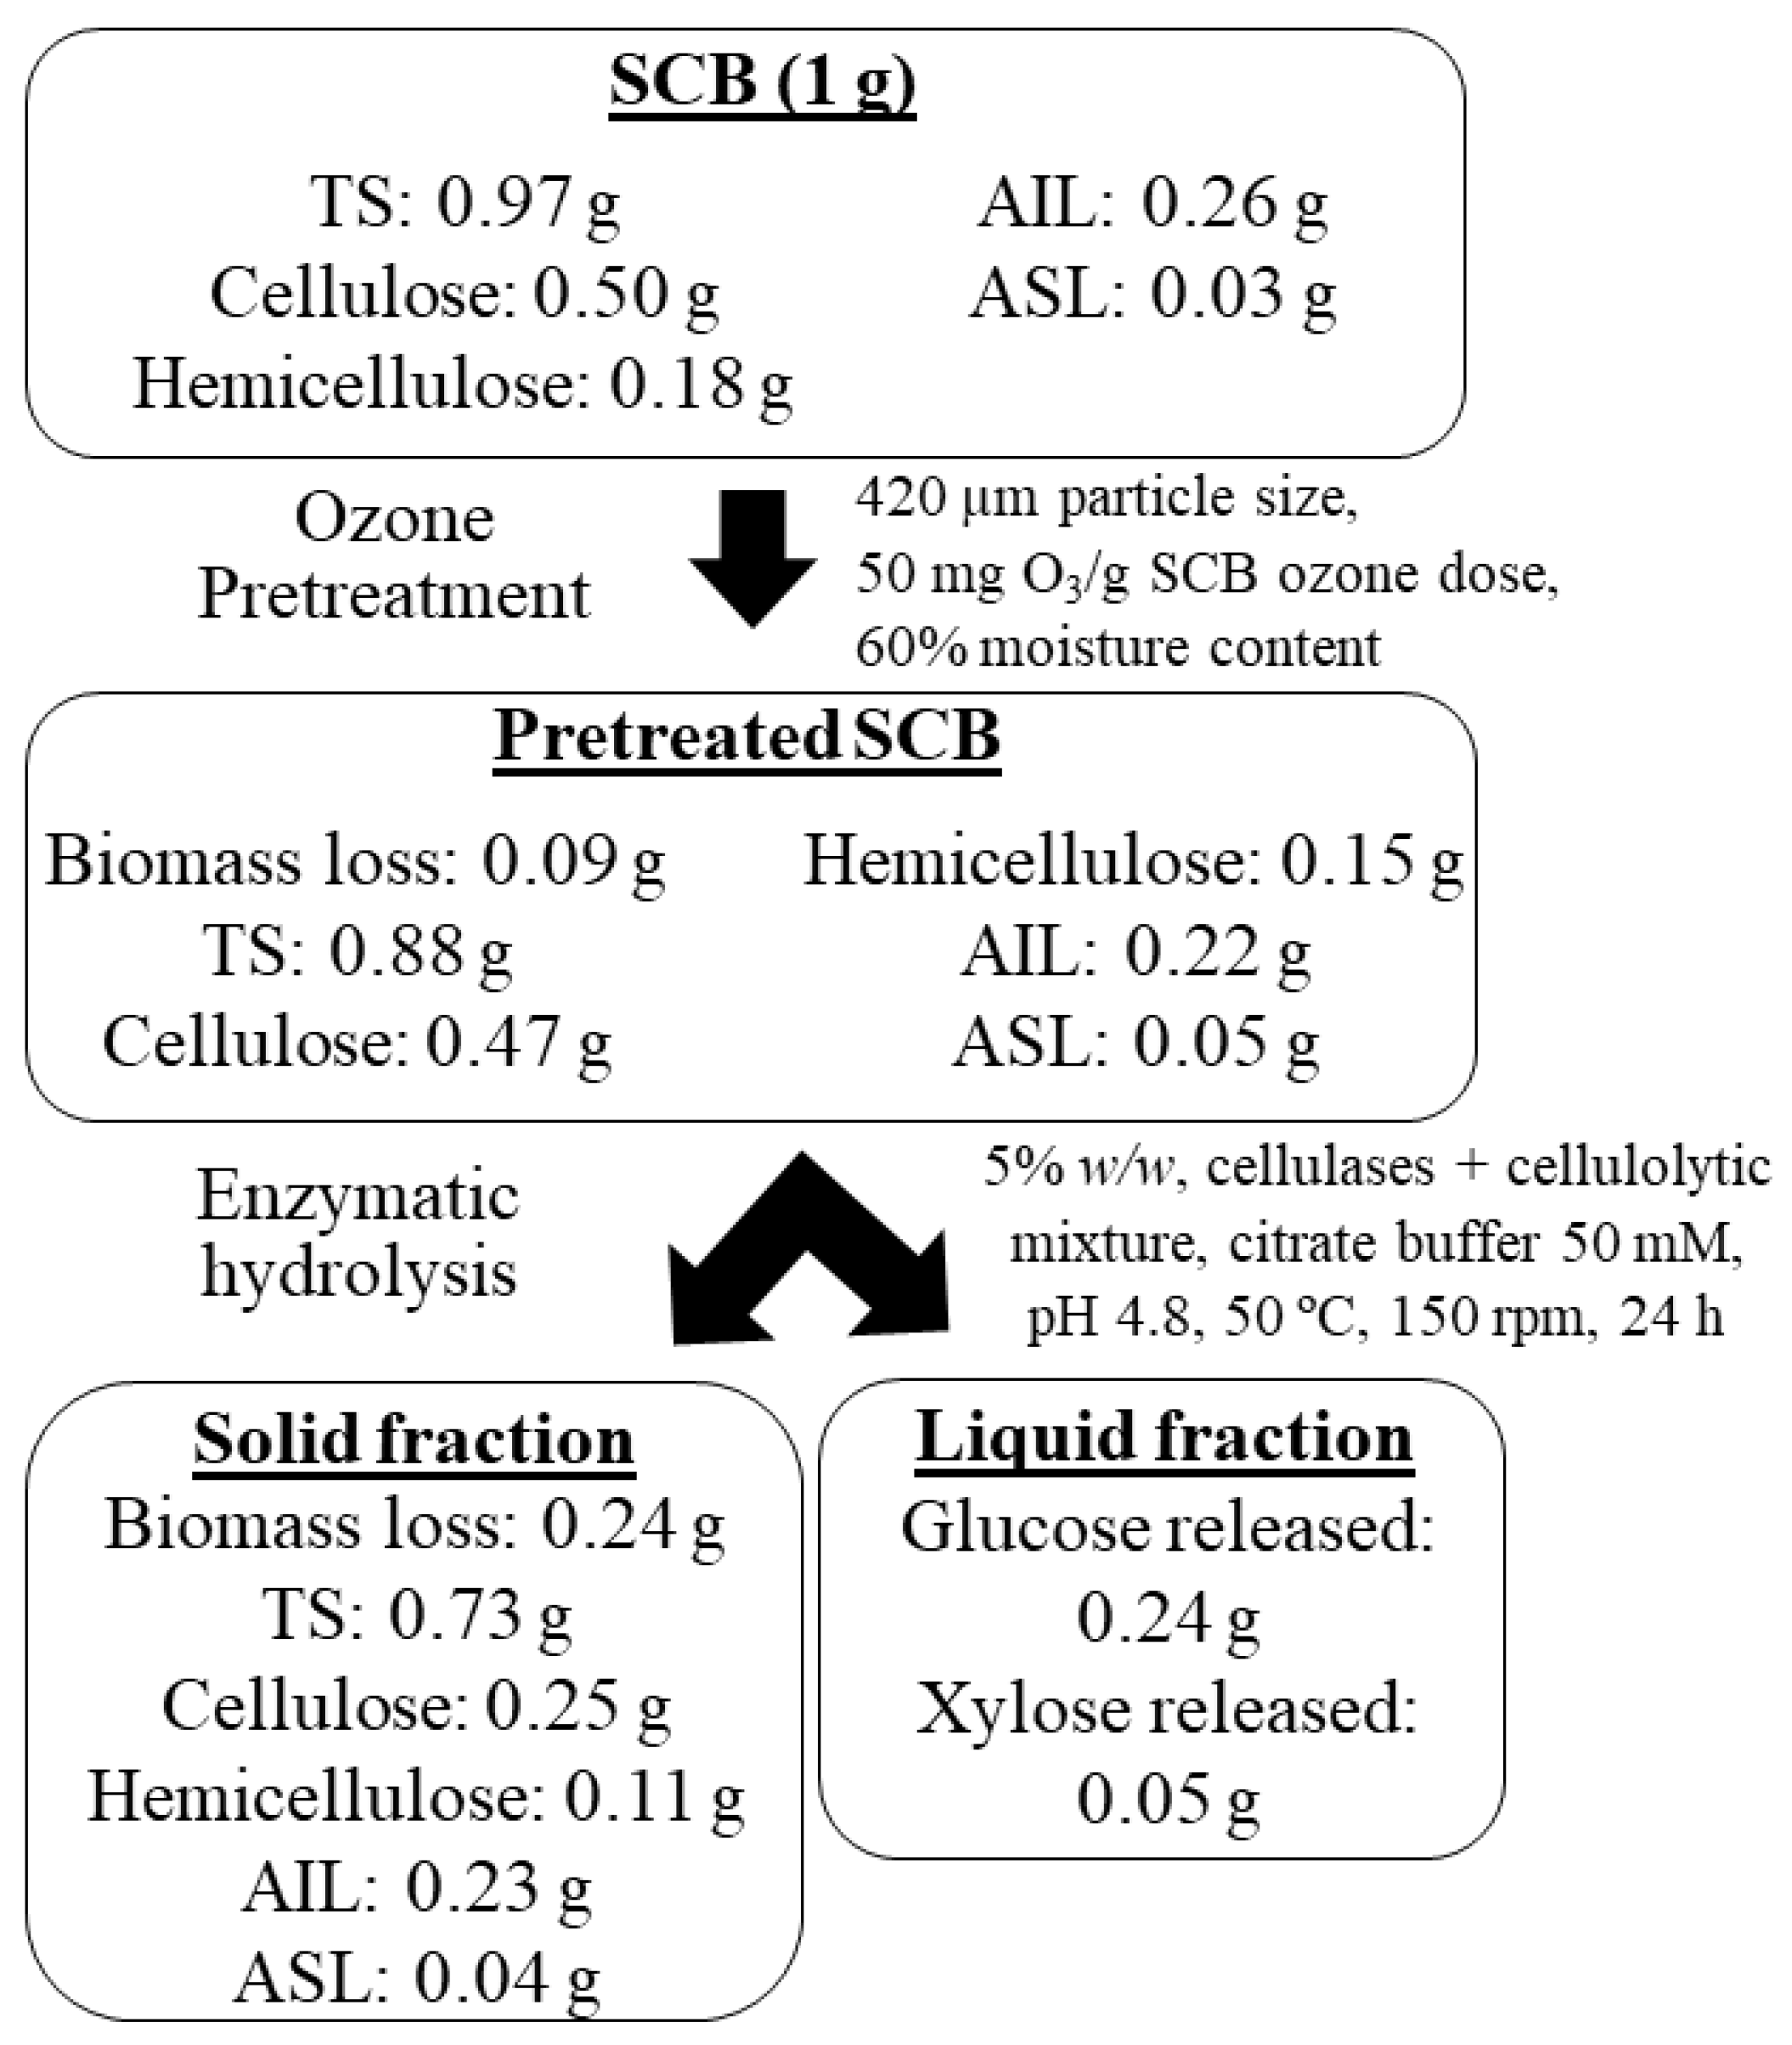
3.7. Mass Balance
4. Conclusions
Author Contributions
Funding
Acknowledgments
Conflicts of Interest
References
- Vu, H.P.; Nguyen, L.N.; Vu, M.T.; Johir, M.A.H.; McLaughlan, R.; Nghiem, L.D. A comprehensive review on the framework to valorise lignocellulosic biomass as biorefinery feedstocks. Sci. Total Environ. 2020, 743, 140630. [Google Scholar] [CrossRef] [PubMed]
- FAOSTAT. UN Food and Agriculture Organization, Corporate Statistical Database. Available online: http://www.fao.org/faostat/en/#data/QC (accessed on 8 October 2020).
- Milão, R.F.D.; Araújo, O.Q.F.; de Medeiros, J.L. Second Law analysis of large-scale sugarcane-ethanol biorefineries with alternative distillation schemes: Bioenergy carbon capture scenario. Renew. Sustain. Energy Rev. 2021, 135. [Google Scholar] [CrossRef]
- Travaini, R.; Barrado, E.; Bolado-Rodríguez, S. Effect of ozonation pretreatment parameters on the sugar release, ozone consumption and ethanol production from sugarcane bagasse. Bioresour. Technol. 2016, 214, 150–158. [Google Scholar] [CrossRef] [PubMed]
- Baêta, B.E.L.; Lima, D.R.S.; Adarme, O.F.H.; Gurgel, L.V.A.; Aquino, S.F.D. Optimization of sugarcane bagasse autohydrolysis for methane production from hemicellulose hydrolyzates in a biorefinery concept. Bioresour. Technol. 2016, 200, 137–146. [Google Scholar] [CrossRef] [PubMed]
- Barrera-Martínez, I.; Guzmán, N.; Peña, E.; Vázquez, T.; Cerón-Camacho, R.; Folch, J.; Honorato Salazar, J.A.; Aburto, J. Ozonation of alkaline lignin and sugarcane bagasse: Structural changes and their effect on saccharification. Biomass Bioenergy 2016, 94, 167–172. [Google Scholar] [CrossRef]
- Travaini, R.; Martín-Juárez, J.; Lorenzo-Hernando, A.; Bolado-Rodríguez, S. Ozonation: An advantageous pretreatment for lignocellulosic biomass revisited. Bioresour. Technol. 2016, 199, 2–12. [Google Scholar] [CrossRef] [Green Version]
- Arenas-Cárdenas, P.; López-López, A.; Moeller-Chávez, G.E.; León-Becerril, E. Current pretreatments of lignocellulosic residues in the production of bioethanol. Waste Biomass Valorization 2017, 8, 161–181. [Google Scholar] [CrossRef]
- Neely, W.C. Factors affecting the pretreatment of biomass with gaseous ozone. Biotechnol. Bioeng. 1984, 26, 59–65. [Google Scholar] [CrossRef]
- García-Cubero, M.T.; González-Benito, G.; Indacoechea, I.; Coca, M.; Bolado, S. Effect of ozonation pretreatment on enzymatic digestibility of wheat and rye straw. Bioresour. Technol. 2009, 100, 1608–1613. [Google Scholar] [CrossRef]
- Perrone, O.M.; Colombari, F.M.; Rossi, J.S.; Moretti, M.M.S.; Bordignon, S.E.; Nunes, C.C.C.; Gomes, E.; Boscolo, M.; Da-Silva, R. Ozonation combined with ultrasound as a pretreatment of sugarcane bagasse: Effect on the enzymatic saccharification and the physical and chemical characteristics of the substrate. Bioresour. Technol. 2016, 218, 69–76. [Google Scholar] [CrossRef]
- Barros, R.D.R.O.D.; Paredes, R.D.S.; Endo, T.; Da Silva Bon, E.P.; Lee, S.-H. Association of wet disk milling and ozonation as pretreatment for enzymatic saccharification of sugarcane bagasse and straw. Bioresour. Technol. 2013, 136, 288–294. [Google Scholar] [CrossRef]
- Souza-Corrêa, J.A.; Ridenti, M.A.; Oliveira, C.; Araújo, S.R.; Amorim, J. Decomposition of lignin from sugar cane bagasse during ozonation process monitored by optical and mass spectrometries. J. Phys. Chem. B 2013, 117, 3110–3119. [Google Scholar] [CrossRef]
- Travaini, R.; Otero, M.D.M.; Coca, M.; Da-Silva, R.; Bolado, S. Sugarcane bagasse ozonation pretreatment: Effect on enzymatic digestibility and inhibitory compound formation. Bioresour. Technol. 2013, 133, 332–339. [Google Scholar] [CrossRef]
- Eqra, N.; Ajabshirchi, Y.; Sarshar, M. Effect of ozonation pretreatment on enzymatic digestibility of sugarcane bagasse. Agric. Eng. Int. CIGR J. 2014, 16, 151–156. Available online: https://cigrjournal.org/index.php/Ejounral/article/viewFile/2427/1850 (accessed on 6 October 2020).
- Adarme, O.F.H.; Baêta, B.E.L.; Lima, D.R.S.; Gurgel, L.V.A.; de Aquino, S.F. Methane and hydrogen production from anaerobic digestion of soluble fraction obtained by sugarcane bagasse ozonation. Ind. Crops Prod. 2017, 109, 288–299. [Google Scholar] [CrossRef]
- Bhattarai, S.; Bottenus, D.; Ivory, C.F.; Gao, A.H.; Bule, M.; Garcia-Perez, M.; Chen, S. Simulation of the ozone pretreatment of wheat straw. Bioresour. Technol. 2015, 196, 78–87. [Google Scholar] [CrossRef] [Green Version]
- Coca, M.; González-Benito, G.; García-Cubero, M.T. Chemical oxidation with ozone as an efficient pretreatment of lignocellulosic materials. In Biomass Fractionation Technologies for a Lignocellulosic Feedsotck Based Biorefinery; Mussatto, S.I., Ed.; Elsevier: Amsterdam, The Netherlands, 2016; Volume 1, pp. 409–429. [Google Scholar] [CrossRef]
- Chacón, S.J.; Matias, G.; Vieira, C.F.D.S.; Ezeji, T.C.; Maciel Filho, R.; Mariano, A.P. Enabling butanol production from crude sugarcane bagasse hemicellulose hydrolysate by batch-feeding it into molasses fermentation. Ind. Crops Prod. 2020, 155, 112837. [Google Scholar] [CrossRef]
- Rosen, Y.; Mamane, H.; Gerchman, Y. Short Ozonation of Lignocellulosic Waste as Energetically Favorable Pretreatment. Bioenergy Res. 2019, 12, 292–301. [Google Scholar] [CrossRef]
- Perrone, O.M.; Rossi, J.S.; Moretti, M.M.S.; Nunes, C.C.C.; Bordignon, S.E.; Gomes, E.; Da-Silva, R.; Boscolo, M. Influence of ozonation time during sugarcane pretreatment: Effects on the fiber and enzymatic saccharification. Bioresour. Technol. 2017, 224, 733–737. [Google Scholar] [CrossRef]
- Wu, J.; Upreti, S.; Ein-Mozaffari, F. Ozone pretreatment of wheat straw for enhanced biohydrogen production. Int. J. Hydrogen Energy 2013, 38, 10270–10276. [Google Scholar] [CrossRef]
- Peretz, R.; Gerchman, Y.; Mamane, H. Ozonation of tannic acid to model biomass pretreatment for bioethanol production. Bioresour. Technol. 2017, 241, 1060–1066. [Google Scholar] [CrossRef]
- Orduña Ortega, J.; Mora Vargas, J.A.; Perrone, O.M.; Metzker, G.; Gomes, E.; da Silva, R.; Boscolo, M. Soaking and ozonation pretreatment of sugarcane straw for the production of fermentable sugars. Ind. Crops Prod. 2020, 145, 111959. [Google Scholar] [CrossRef]
- Rios-González, L.J.; Morales-Martínez, T.K.; Rodríguez-Flores, M.F.; Rodríguez-De la Garza, J.A.; Castillo-Quiroz, D.; Castro-Montoya, A.J.; Martinez, A. Autohydrolysis pretreatment assessment in ethanol production from agave bagasse. Bioresour. Technol. 2017, 242, 184–190. [Google Scholar] [CrossRef]
- Travaini, R.; Marangon-Jardim, C.; Colodette, J.L.; Morales-Otero, M.; Bolado-Rodríguez, S. Ozonation. In Pretreatment of Biomass; Pandey, A., Negi, S., Binod, P., Larroche, C., Eds.; Elsevier: Amsterdam, The Netherlands, 2015; Volume 1, pp. 105–135. [Google Scholar] [CrossRef]
- Rasid, N.S.A.; Zainol, M.M.; Amin, N.A.S. Pretreatment of agroindustry waste by ozonation for synthesis of biorefinery products. In Refining Biomass Residues for Sustainable Energy and Bioproducts; Kumar, R.P., Gnansounou, E., Raman, J.K., Baskar, G., Eds.; Academic Press: London, UK, 2020; Volume 1, pp. 303–336. [Google Scholar] [CrossRef]
- Mulakhudair, A.R.; Hanotu, J.; Zimmerman, W. Exploiting ozonolysis-microbe synergy for biomass processing: Application in lignocellulosic biomass pretreatment. Biomass Bioenergy 2017, 105, 147–154. [Google Scholar] [CrossRef]
- Sluiter, J.B.; Ruiz, R.O.; Scarlata, C.J.; Sluiter, A.D.; Templeton, D.W. Compositional analysis of lignocellulosic feedstocks. 1. Review and description of methods. J. Agric. Food Chem. 2010, 58, 9043–9053. [Google Scholar] [CrossRef]
- Sluiter, A.; Hames, B.; Ruiz, R.; Scarlata, C.; Sluiter, J.; Templeton, D.; Crocker, D. Determination of structural carbohydrates and lignin in biomass. NREL/TP-510-42618. Lab. Anal. Proced. 2012, 1–17. [Google Scholar]
- Xu, F.; Yu, J.; Tesso, T.; Dowell, F.; Wang, D. Qualitative and quantitative analysis of lignocellulosic biomass using infrared techniques: A mini-review. Appl. Energy 2013, 104, 801–809. [Google Scholar] [CrossRef] [Green Version]
- Schultz-Jensen, N.; Leipold, F.; Bindslev, H.; Thomsen, A.B. Plasma-assisted pretreatment of wheat straw. Appl. Biochem. Biotechnol. 2011, 163, 558–572. [Google Scholar] [CrossRef]
- Razak, O.A.; Masaaki, H.; Yimamu, A.; Meiji, O. Potential water retention capacity as a factor in silage effluent control: Experiments with high moisture by-product feedstuffs. Asian Australas. J. Anim. Sci. 2012, 25, 471–478. [Google Scholar] [CrossRef] [Green Version]
- Segal, L.; Creely, J.J.; Martin, A.E.; Conrad, C.M. An empirical method for estimating the degree of crystallinity of native cellulose using the X-ray diffractometer. Text. Res. J. 1959, 29, 786–794. [Google Scholar] [CrossRef]
- Subhedar, P.B.; Gogate, P.R. Alkaline and ultrasound assisted alkaline pretreatment for intensification of delignification process from sustainable raw-material. Ultrason. Sonochem. 2014, 21, 216–225. [Google Scholar] [CrossRef]
- Binder, A.; Pelloni, L.; Fiechter, A. Delignification of straw with ozone to enhance biodegradability. Eur. J. Appl. Microbiol. Biotechnol. 1980, 11, 1–5. [Google Scholar] [CrossRef]
- Ben’Ko, E.M.; Manisova, O.R.; Lunin, V.V. Effect of ozonation on the reactivity of lignocellulose substrates in enzymatic hydrolyses to sugars. Russ. J. Phys. Chem. A 2013, 87, 1108–1113. [Google Scholar] [CrossRef]
- Shi, F.; Xiang, H.; Li, Y. Combined pretreatment using ozonolysis and ball milling to improve enzymatic saccharification of corn straw. Bioresour. Technol. 2015, 179, 444–451. [Google Scholar] [CrossRef]
- Ben’Ko, E.M.; Manisova, O.R.; Murav’eva, G.P.; Lunin, V.V. Structural changes in wood during ozonation. Russ. J. Phys. Chem. A 2013, 87, 1097–1101. [Google Scholar] [CrossRef]
- Harrison, M.D.; Zhang, Z.; Shand, K.; O´Hara, I.M.; Doherty, W.O.S.; Dale, J.L. Effect of pretreatment on saccharification of sugar cane bagasse by complex and simple enzyme mixtures. Bioresour. Technol. 2013, 148, 105–113. [Google Scholar] [CrossRef] [Green Version]
- Ciolacu, D.; Ciolacu, F.; Popa, V.I. Amorphous cellulose—Structure and characterization. Cell. Chem. Tech. 2011, 45, 13–21. [Google Scholar]
- Bian, J.; Peng, F.; Peng, X.P.; Xu, F.; Sun, R.C.; Kennedy, J.F. Isolation of hemicelluloses from sugarcane bagasse at different temperatures: Structure and properties. Carbohydr. Polym. 2012, 88, 638–645. [Google Scholar] [CrossRef]
- Fan, M.; Dai, D.; Huang, B. Fourier transform infrared spectroscopy for natural fibers. In Fourier Transform; Salih, S.M., Ed.; IntechOpen: London, UK, 2012; Volume 1, pp. 45–68. [Google Scholar] [CrossRef] [Green Version]
- Kljun, A.; Benians, T.A.S.; Goubet, F.; Meulewaeter, F.; Knox, J.P.; Blackburn, R.S. Comparative analysis of crystallinity changes in cellulose I polymers using ATR-FTIR, X-ray diffraction, and carbohydrate-binding module probes. Biomacromolecules 2011, 12, 4121–4126. [Google Scholar] [CrossRef]
- Rezende, C.A.; de Lima, M.A.; Maziero, P.; DeAzevedo, E.; Garcia, W.; Polikarpov, I. Chemical and morphological characterization of sugarcane bagasse submitted to delignification process for enhanced enzymatic digestibility. Biotechnol. Biofuels 2011, 4, 54. [Google Scholar] [CrossRef] [Green Version]
- de Souza Moretti, M.M.; Perrone, O.M.; Nunes, C.C.C.; Taboga, S.; Boscolo, M.; da Silva, R.; Gomes, E. Effect of pretreatment and enzymatic hydrolysis on the physical-chemical composition and morphologic structure of sugarcane bagasse and sugarcane straw. Bioresour. Technol. 2016, 219, 773–777. [Google Scholar] [CrossRef]
- Monlau, F.; Barakat, A.; Trably, E.; Dumas, C.; Steyer, J.P.; Carrère, H. Lignocellulosic Materials Into Biohydrogen and Biomethane: Impact of Structural Features and Pretreatment. Crit. Rev. Environ. Sci. Technol. 2013, 43, 260–322. [Google Scholar] [CrossRef]
- Benko, E.M.; Chuhchin, D.G.; Malkov, A.V.; Vydrina, I.V.; Novozhilov, E.V.; Lunin, V.V. Change in the crystallinity of wheat straw during ozone treatment. Russ. J. Phys. Chem. 2020, 94, 1149–1152. [Google Scholar] [CrossRef]
- Li, C.; Wang, L.; Chen, Z.; Li, Y.; Wang, R.; Lou, X.; Cai, G.; Li, Y.; Yu, Q.; Lu, J. Ozonolysis pretreatment of maize stover: The interactive effect of sample particle size and moisture on ozonolysis process. Bioresour. Technol. 2015, 183, 240–247. [Google Scholar] [CrossRef]
- Energy Information Administration (EIA). Average Price of Electricity to Ultimate Customers by End-Use Sector. Available online: https://www.eia.gov/electricity/monthly/epm_table_grapher.php?t=epmt_5_6_a (accessed on 4 September 2020).


| Run | Coded Levels | Values | ||||
|---|---|---|---|---|---|---|
| Particle Size | Ozone Dose | Moisture Content | Particle Size (µm) | Ozone Dose (mg O3/g SCB) | Moisture Content (% w/w) | |
| T1 | 0 | 0 | 0 | 710 | 75 | 45 |
| T2 | −1 | 1 | −1 | 420 | 100 | 30 |
| T3 | −1 | −1 | 1 | 420 | 50 | 60 |
| T4 | 1 | −1 | −1 | 1000 | 50 | 30 |
| T5 | 0 | 0 | 0 | 710 | 75 | 45 |
| T6 | 1 | 1 | 1 | 1000 | 100 | 60 |
| T7 | −1 | −1 | −1 | 420 | 50 | 30 |
| T8 | 1 | 1 | −1 | 1000 | 100 | 30 |
| T9 | −1 | 1 | 1 | 420 | 100 | 60 |
| T10 | 1 | −1 | 1 | 1000 | 50 | 60 |
| Run | Structural Composition (% w/w) a | Enzymatic Hydrolysis | |||||
|---|---|---|---|---|---|---|---|
| ASL | AIL | Cellulose | Hemicellulose | AIL Removed (%) b | Glucose Yield (%) | Xylose Yield (%) | |
| SCB c | 3.07 ± 0.22 | 26.60 ± 1.01 | 50.59 ± 0.68 | 18.71 ± 0.99 | - | 2.12 ± 0.44 | 0.00 |
| T1 | 5.91 ± 0.13 | 19.24 ± 0.79 | 47.85 ± 0.69 | 15.63 ± 1.42 | 27.68 ± 2.98 | 42.29 ± 0.65 | 31.91 ± 0.34 |
| T2 | 5.57 ± 0.36 | 19.15 ± 0.68 | 51.43 ± 0.04 | 14.52 ± 0.07 | 28.02 ± 2.57 | 38.41 ± 0.72 | 37.88 ± 0.68 |
| T3 | 5.73 ± 0.04 | 22.23 ± 0.27 | 47.50 ± 1.37 | 15.62 ± 0.27 | 16.44 ± 1.00 | 44.50 ± 0.90 | 23.40 ± 0.16 |
| T4 | 6.03 ± 0.18 | 23.40 ± 0.84 | 45.78 ± 0.17 | 14.47 ± 0.22 | 12.05 ± 3.15 | 28.49 ± 0.31 | 29.07 ± 0.12 |
| T5 | 6.18 ± 0.18 | 20.53 ± 0.29 | 47.24 ± 0.76 | 13.60 ± 0.62 | 22.82 ± 1.08 | 40.57 ± 0.94 | 30.63 ± 0.22 |
| T6 | 5.87 ± 0.39 | 23.73 ± 0.80 | 46.21 ± 2.22 | 14.17 ± 2.61 | 10.78 ± 3.01 | 33.43 ± 0.21 | 26.49 ± 0.30 |
| T7 | 5.59 ± 0.49 | 21.89 ± 0.21 | 48.08 ± 0.27 | 14.74 ± 0.45 | 17.72 ± 0.77 | 43.39 ± 0.14 | 23.96 ± 0.17 |
| T8 | 5.51 ± 0.41 | 21.18 ± 1.93 | 49.22 ± 2.18 | 15.61 ± 1.61 | 20.38 ± 2.27 | 38.18 ± 1.23 | 30.96 ± 0.55 |
| T9 | 5.53 ± 0.25 | 19.50 ± 0.73 | 50.11 ± 1.03 | 15.07 ± 0.73 | 26.29 ± 2.72 | 45.09 ± 0.31 | 35.10 ± 0.88 |
| T10 | 5.91 ± 0.33 | 24.48 ± 0.50 | 45.49 ± 2.69 | 15.25 ± 2.30 | 7.98 ± 1.89 | 22.81 ± 1.03 | 20.81 ± 0.32 |
| Ozonation Parameters | Best Result Parameters | Sugars Yields (%) | q1 (g sugars/g O3) | g sugars/g SCB | Relative Cost for Ton of SCB | Reference |
|---|---|---|---|---|---|---|
| 0.5–1.5 L/min, 42–222 mg O3/g SCB, <1250–<4760 µm, 30–70% moisture, 38–180 min, 24 g SCB | <1.25 µm, 50% moisture, 222 mg O3/g SCB, 150 min | 77.55 GY | 2.28 sugars | 0.24 | USD 153.48 (150 min) | [4] |
| 0.2–0.4 L/min, 4.3–54 mg O3/g SCB, 250–420 µm, 50% moisture, 15–120 min, 1 g SCB | 120 min | 13.43 SY | 1.26 sugars a | - | USD 37.53 (120 min) | [6] |
| 32 mg O3/min, 96 mg O3/g SCB a, <3000 µm, 33% moisture, 60 min, 20 g SCB | – | 16 GY | 0.69 glucose a 0.93 sugars a | 0.089 | USD 66.72 (60 min) | [11] |
| 204 mg O3/L, 0.5 L/min, ~153–612 mg O3/g SCB a, ~20–40 µm, 60% moisture, 30–120 min, 20 g SCB | 120 min | 63.22 GY | 0.5 glucosea 0.55 sugars a | 0.335 | USD 425.34 (120 min) | [12] |
| 10 g O3/L, <1000–5000 µm, 40–60% moisture content, 90–270 min | 1000 µm, 50% moisture, 210 min | 67 SY | - | - | - | [15] |
| 31–62 mg O3/L, 1.5 L/min, 50–100 mg O3/g SCB, 420–1000 µm, 30–60% moisture, 30 min, 28 g SCB | 420 µm, 100 mg O3/g SCB, 60% moisture | 44.5 GY 35.5 SY | 4.74 glucose, 5.75 sugars | 0.29 | USD 34.75 (30 min) | Present work |
© 2020 by the authors. Licensee MDPI, Basel, Switzerland. This article is an open access article distributed under the terms and conditions of the Creative Commons Attribution (CC BY) license (http://creativecommons.org/licenses/by/4.0/).
Share and Cite
Osuna-Laveaga, D.R.; García-Depraect, O.; Vallejo-Rodríguez, R.; López-López, A.; León-Becerril, E. Integrated Ozonation-Enzymatic Hydrolysis Pretreatment of Sugarcane Bagasse: Enhancement of Sugars Released to Expended Ozone Ratio. Processes 2020, 8, 1274. https://doi.org/10.3390/pr8101274
Osuna-Laveaga DR, García-Depraect O, Vallejo-Rodríguez R, López-López A, León-Becerril E. Integrated Ozonation-Enzymatic Hydrolysis Pretreatment of Sugarcane Bagasse: Enhancement of Sugars Released to Expended Ozone Ratio. Processes. 2020; 8(10):1274. https://doi.org/10.3390/pr8101274
Chicago/Turabian StyleOsuna-Laveaga, Daryl Rafael, Octavio García-Depraect, Ramiro Vallejo-Rodríguez, Alberto López-López, and Elizabeth León-Becerril. 2020. "Integrated Ozonation-Enzymatic Hydrolysis Pretreatment of Sugarcane Bagasse: Enhancement of Sugars Released to Expended Ozone Ratio" Processes 8, no. 10: 1274. https://doi.org/10.3390/pr8101274