Molybdenite Flotation in the Presence of a Polyacrylamide of Low Anionicity Subjected to Different Conditions of Mechanical Shearing


Abstract
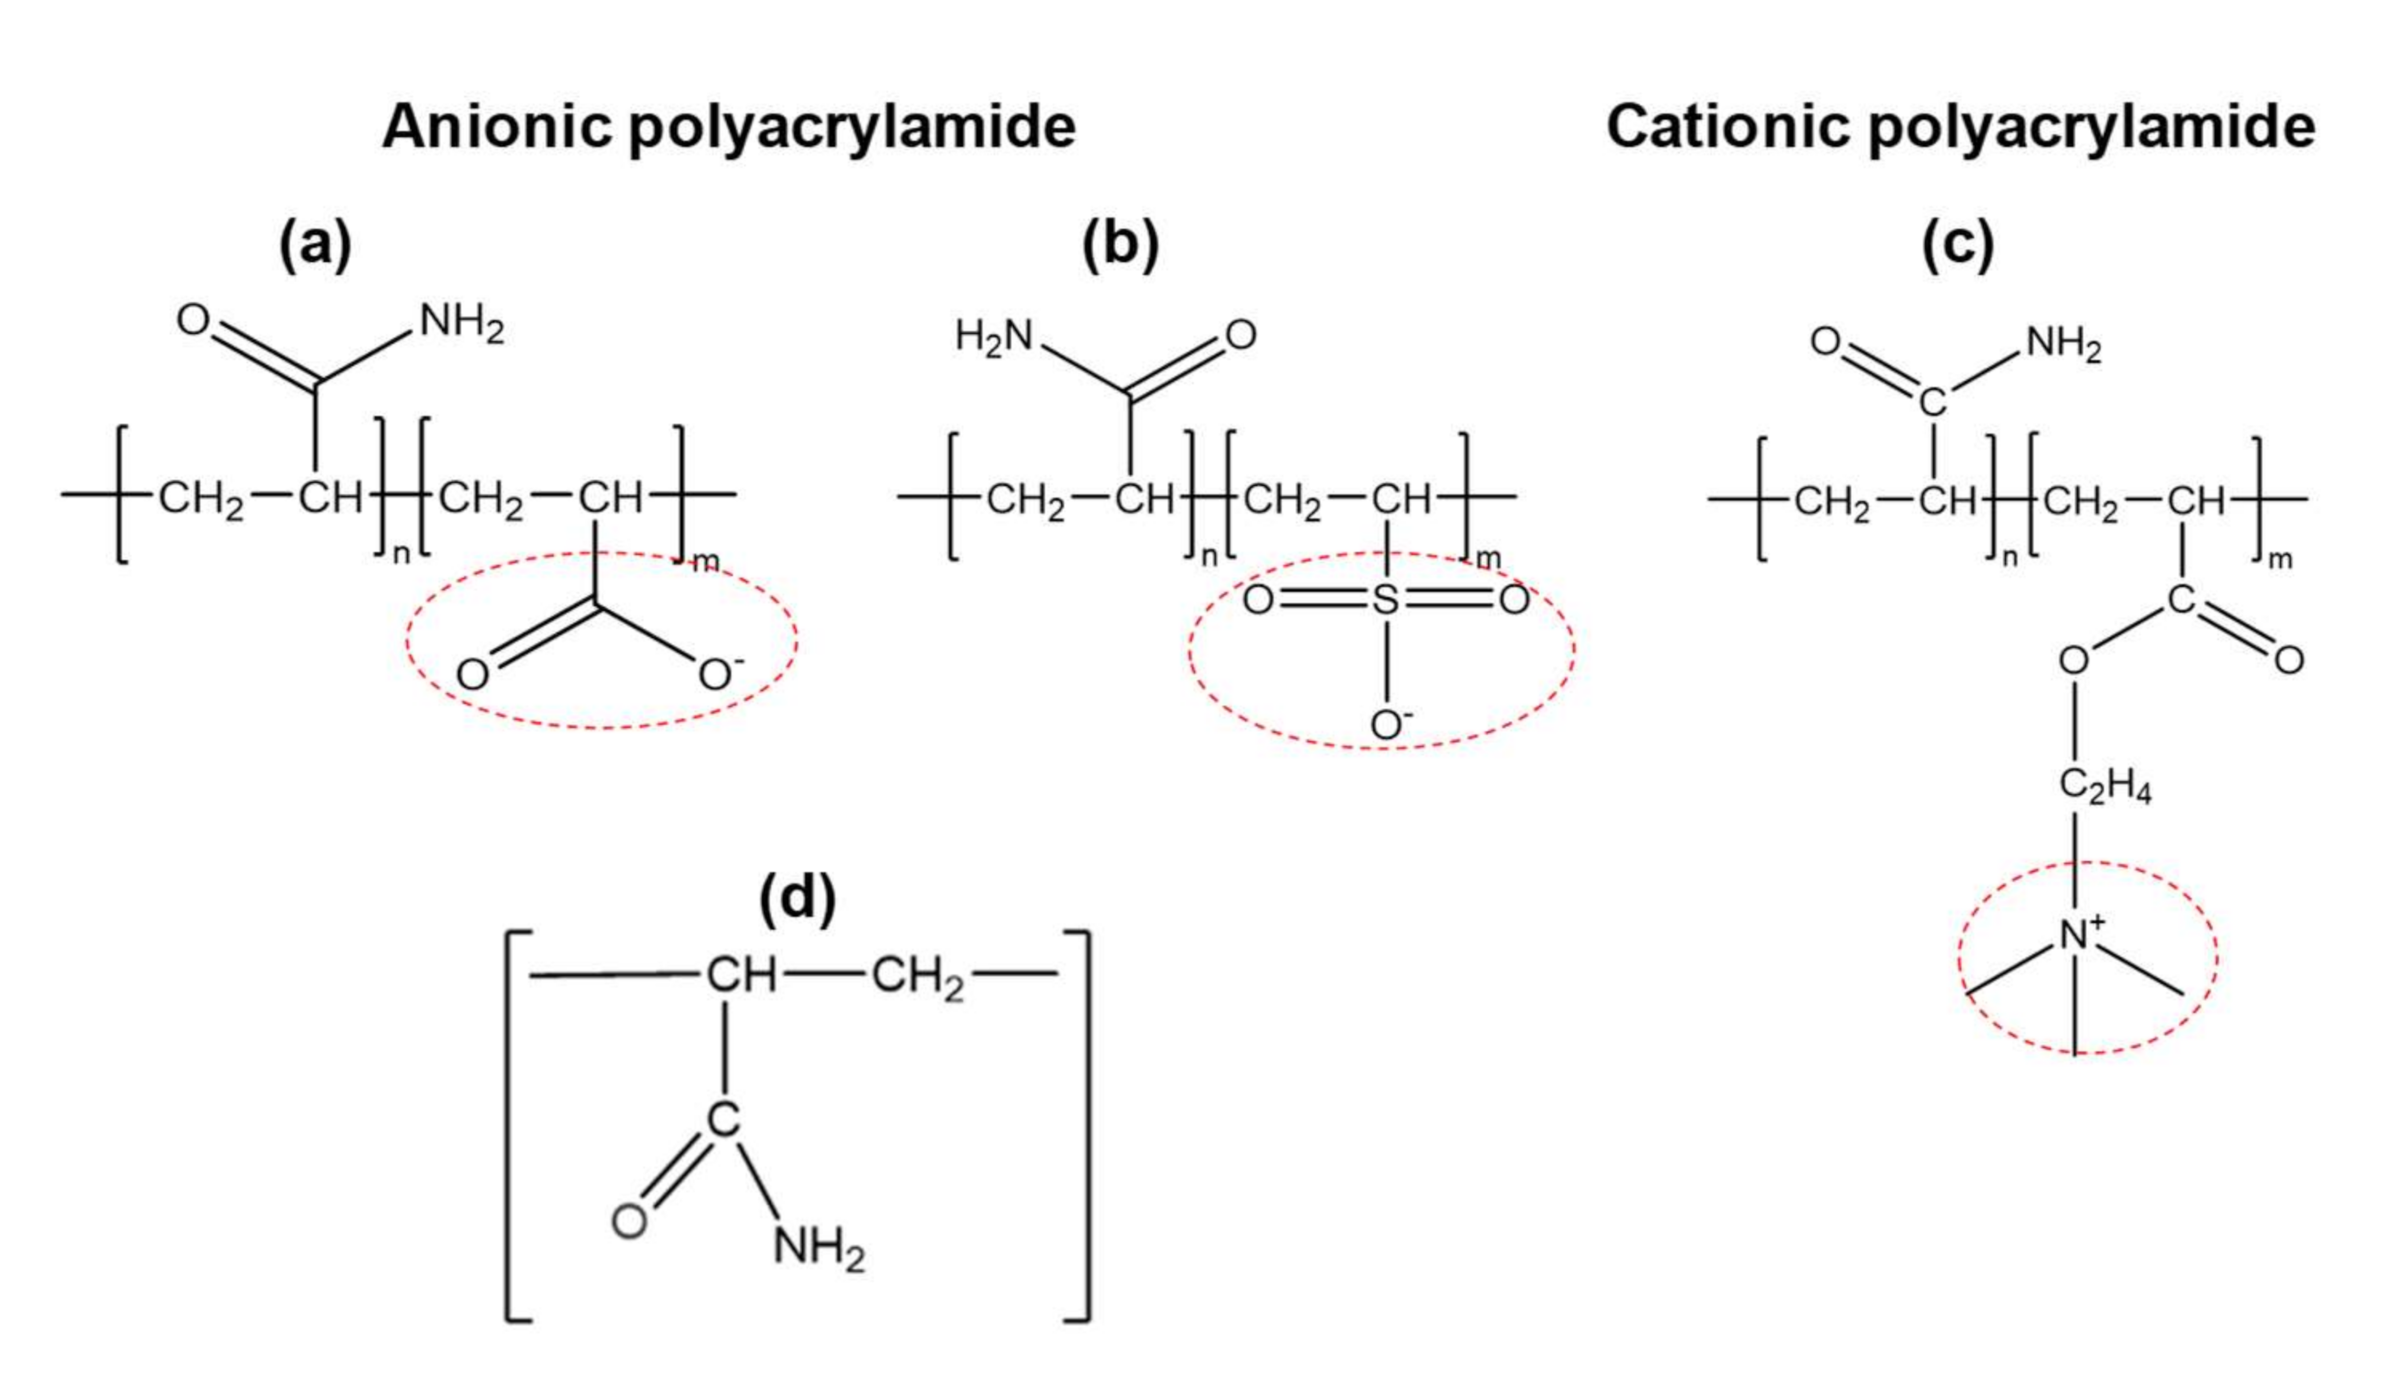
:1. Introduction
2. Materials and Methods
2.1. Samples and Reagents
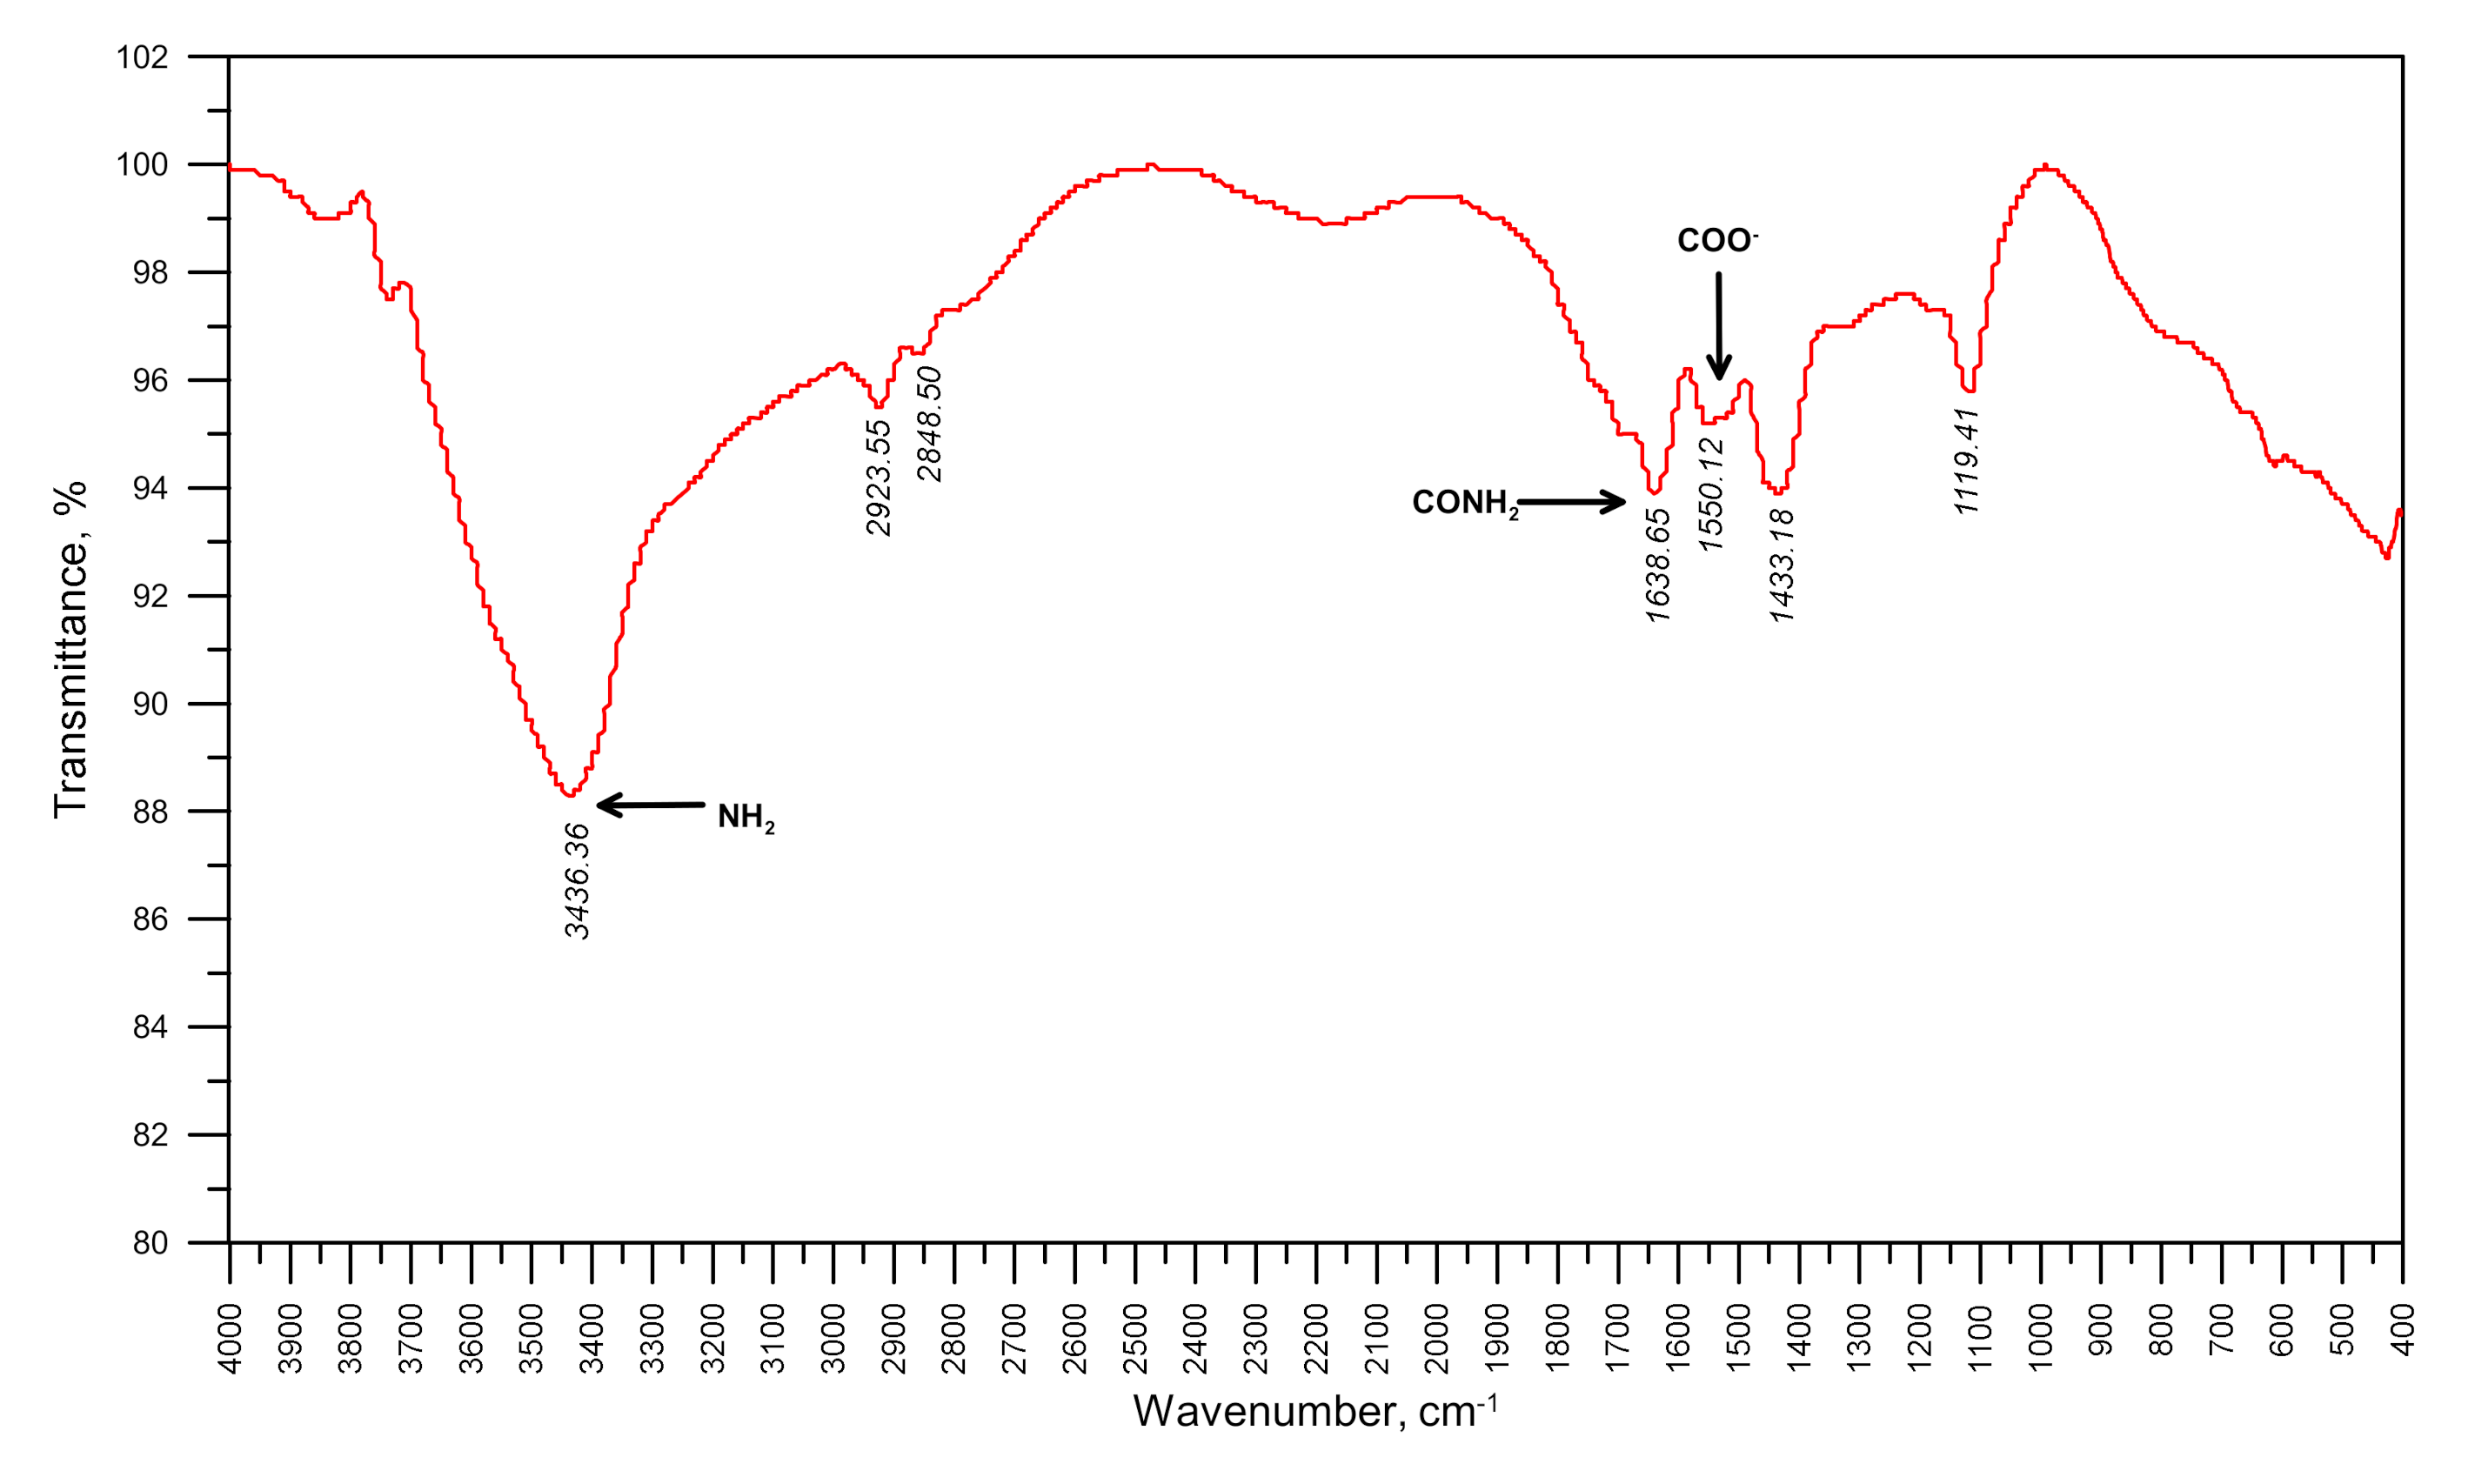
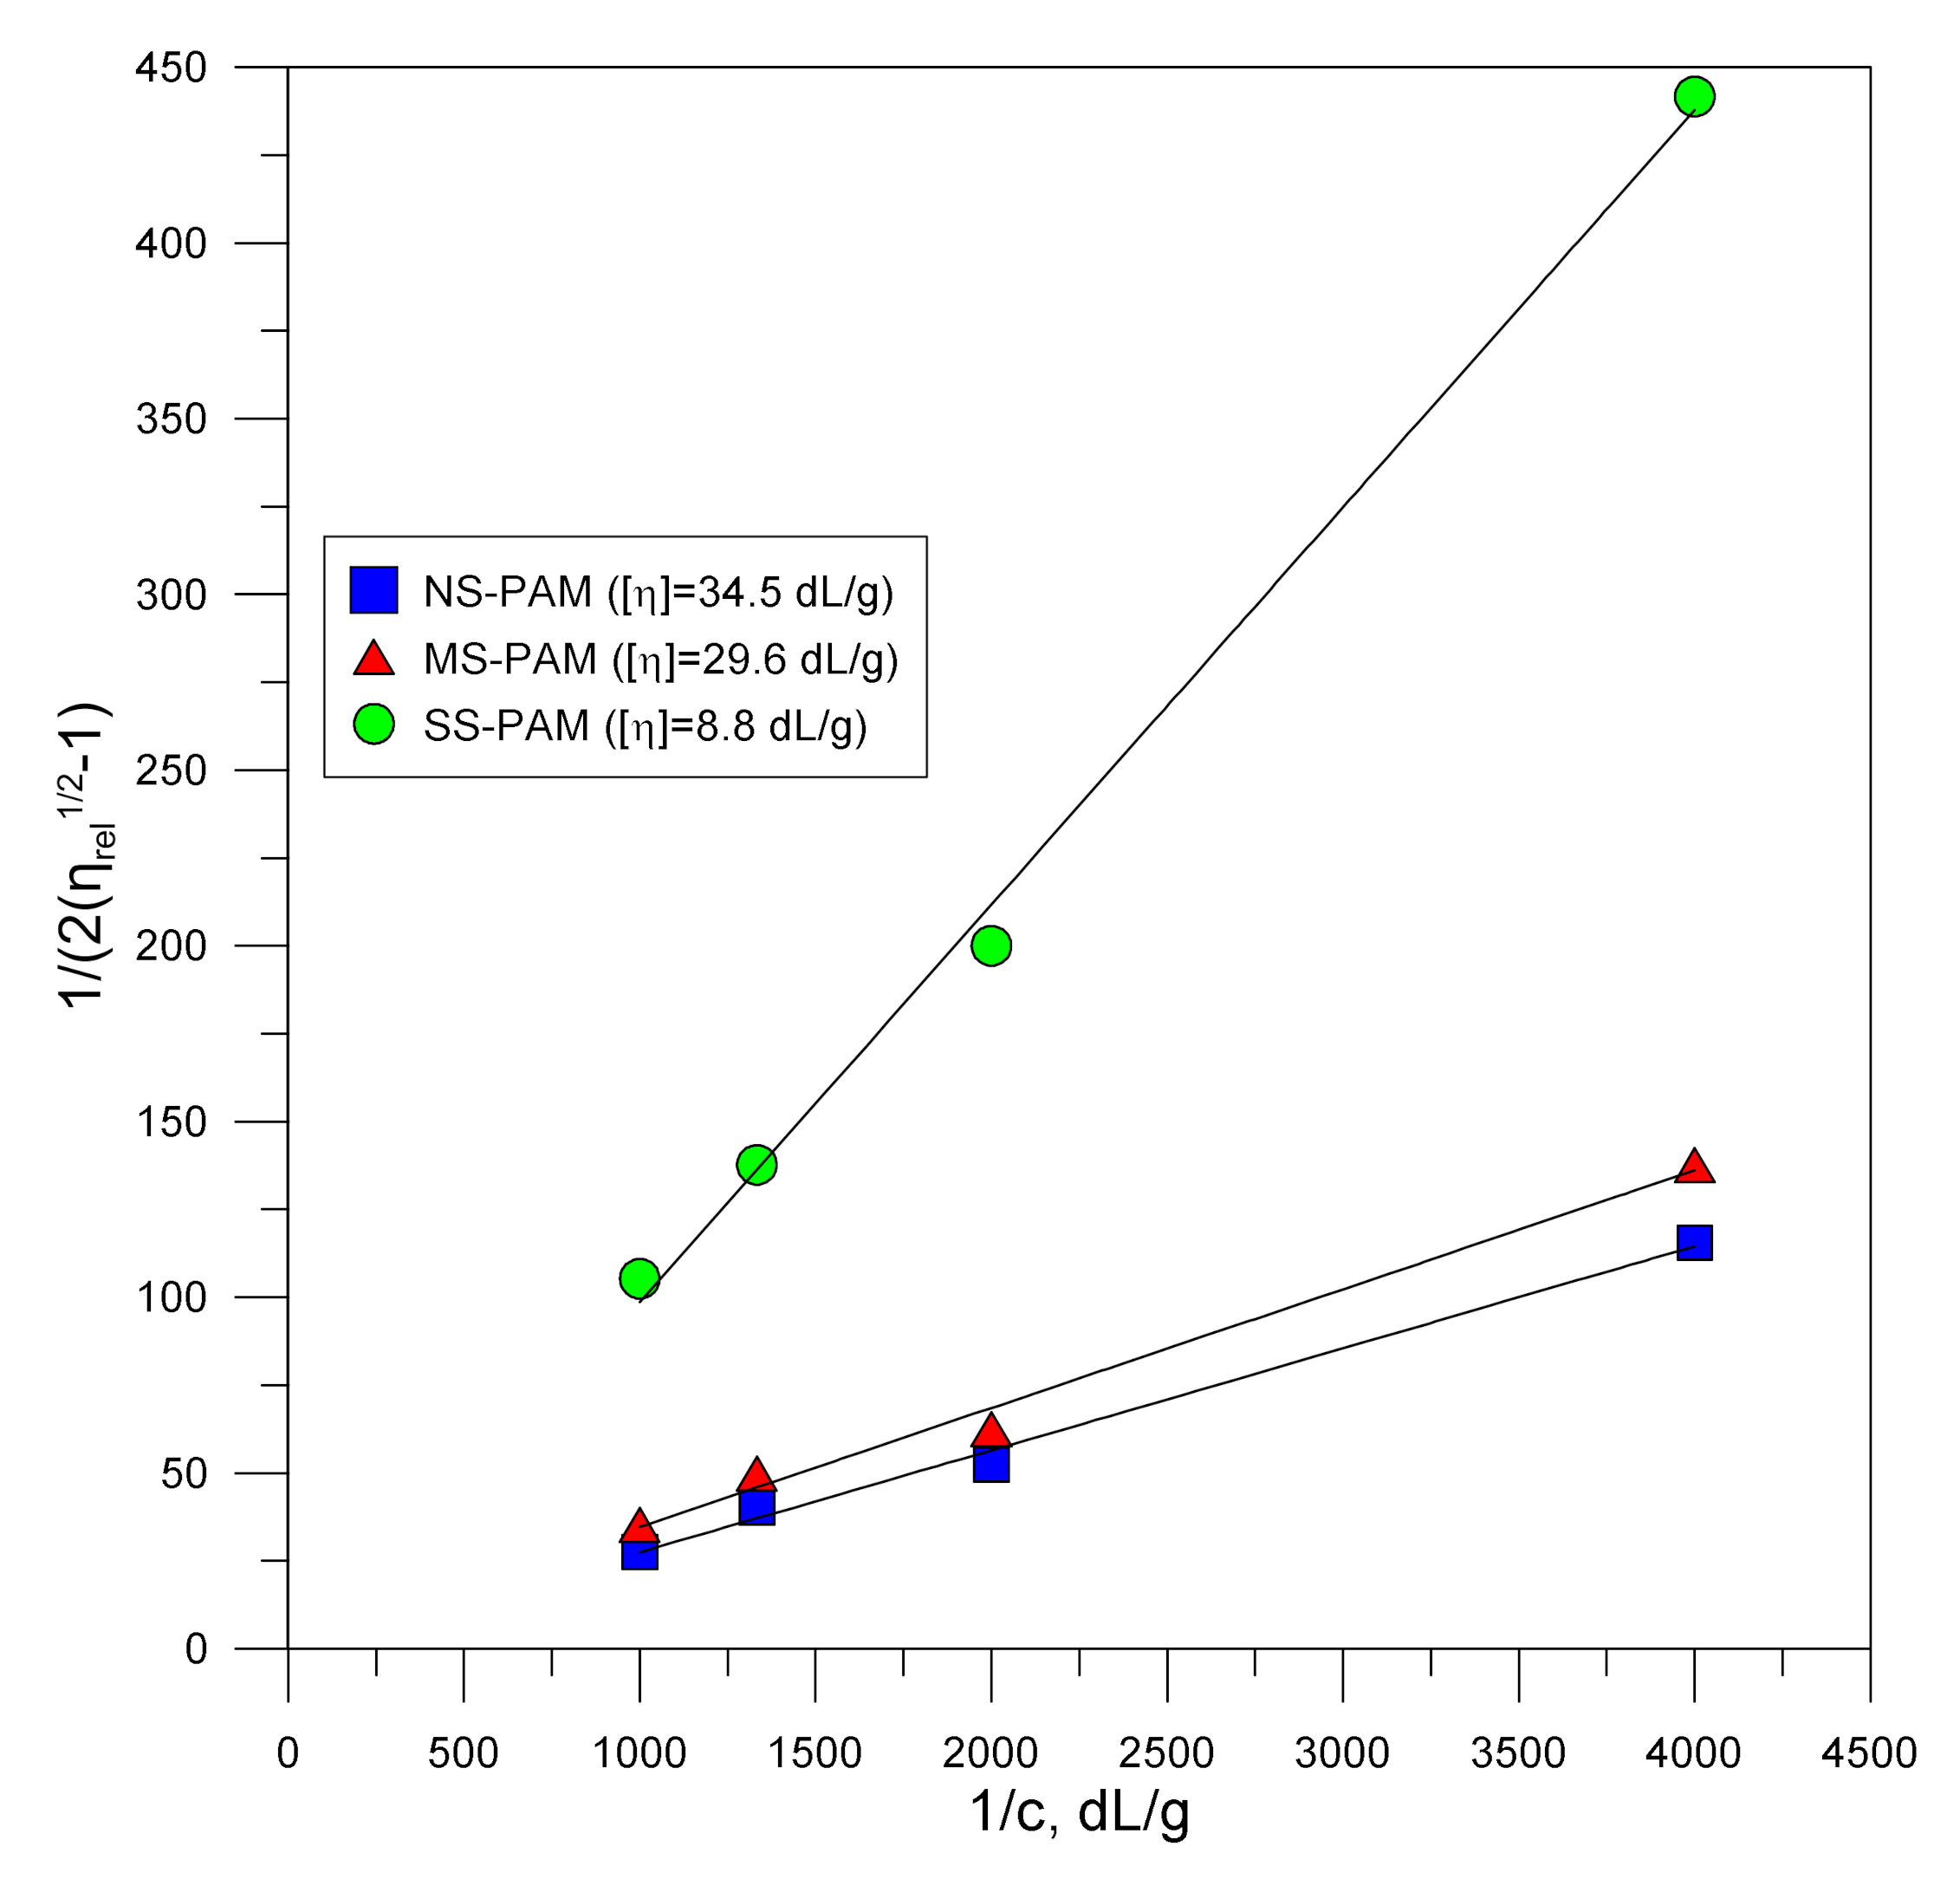
2.2. PAM Preparation, Caracterization and Degradation
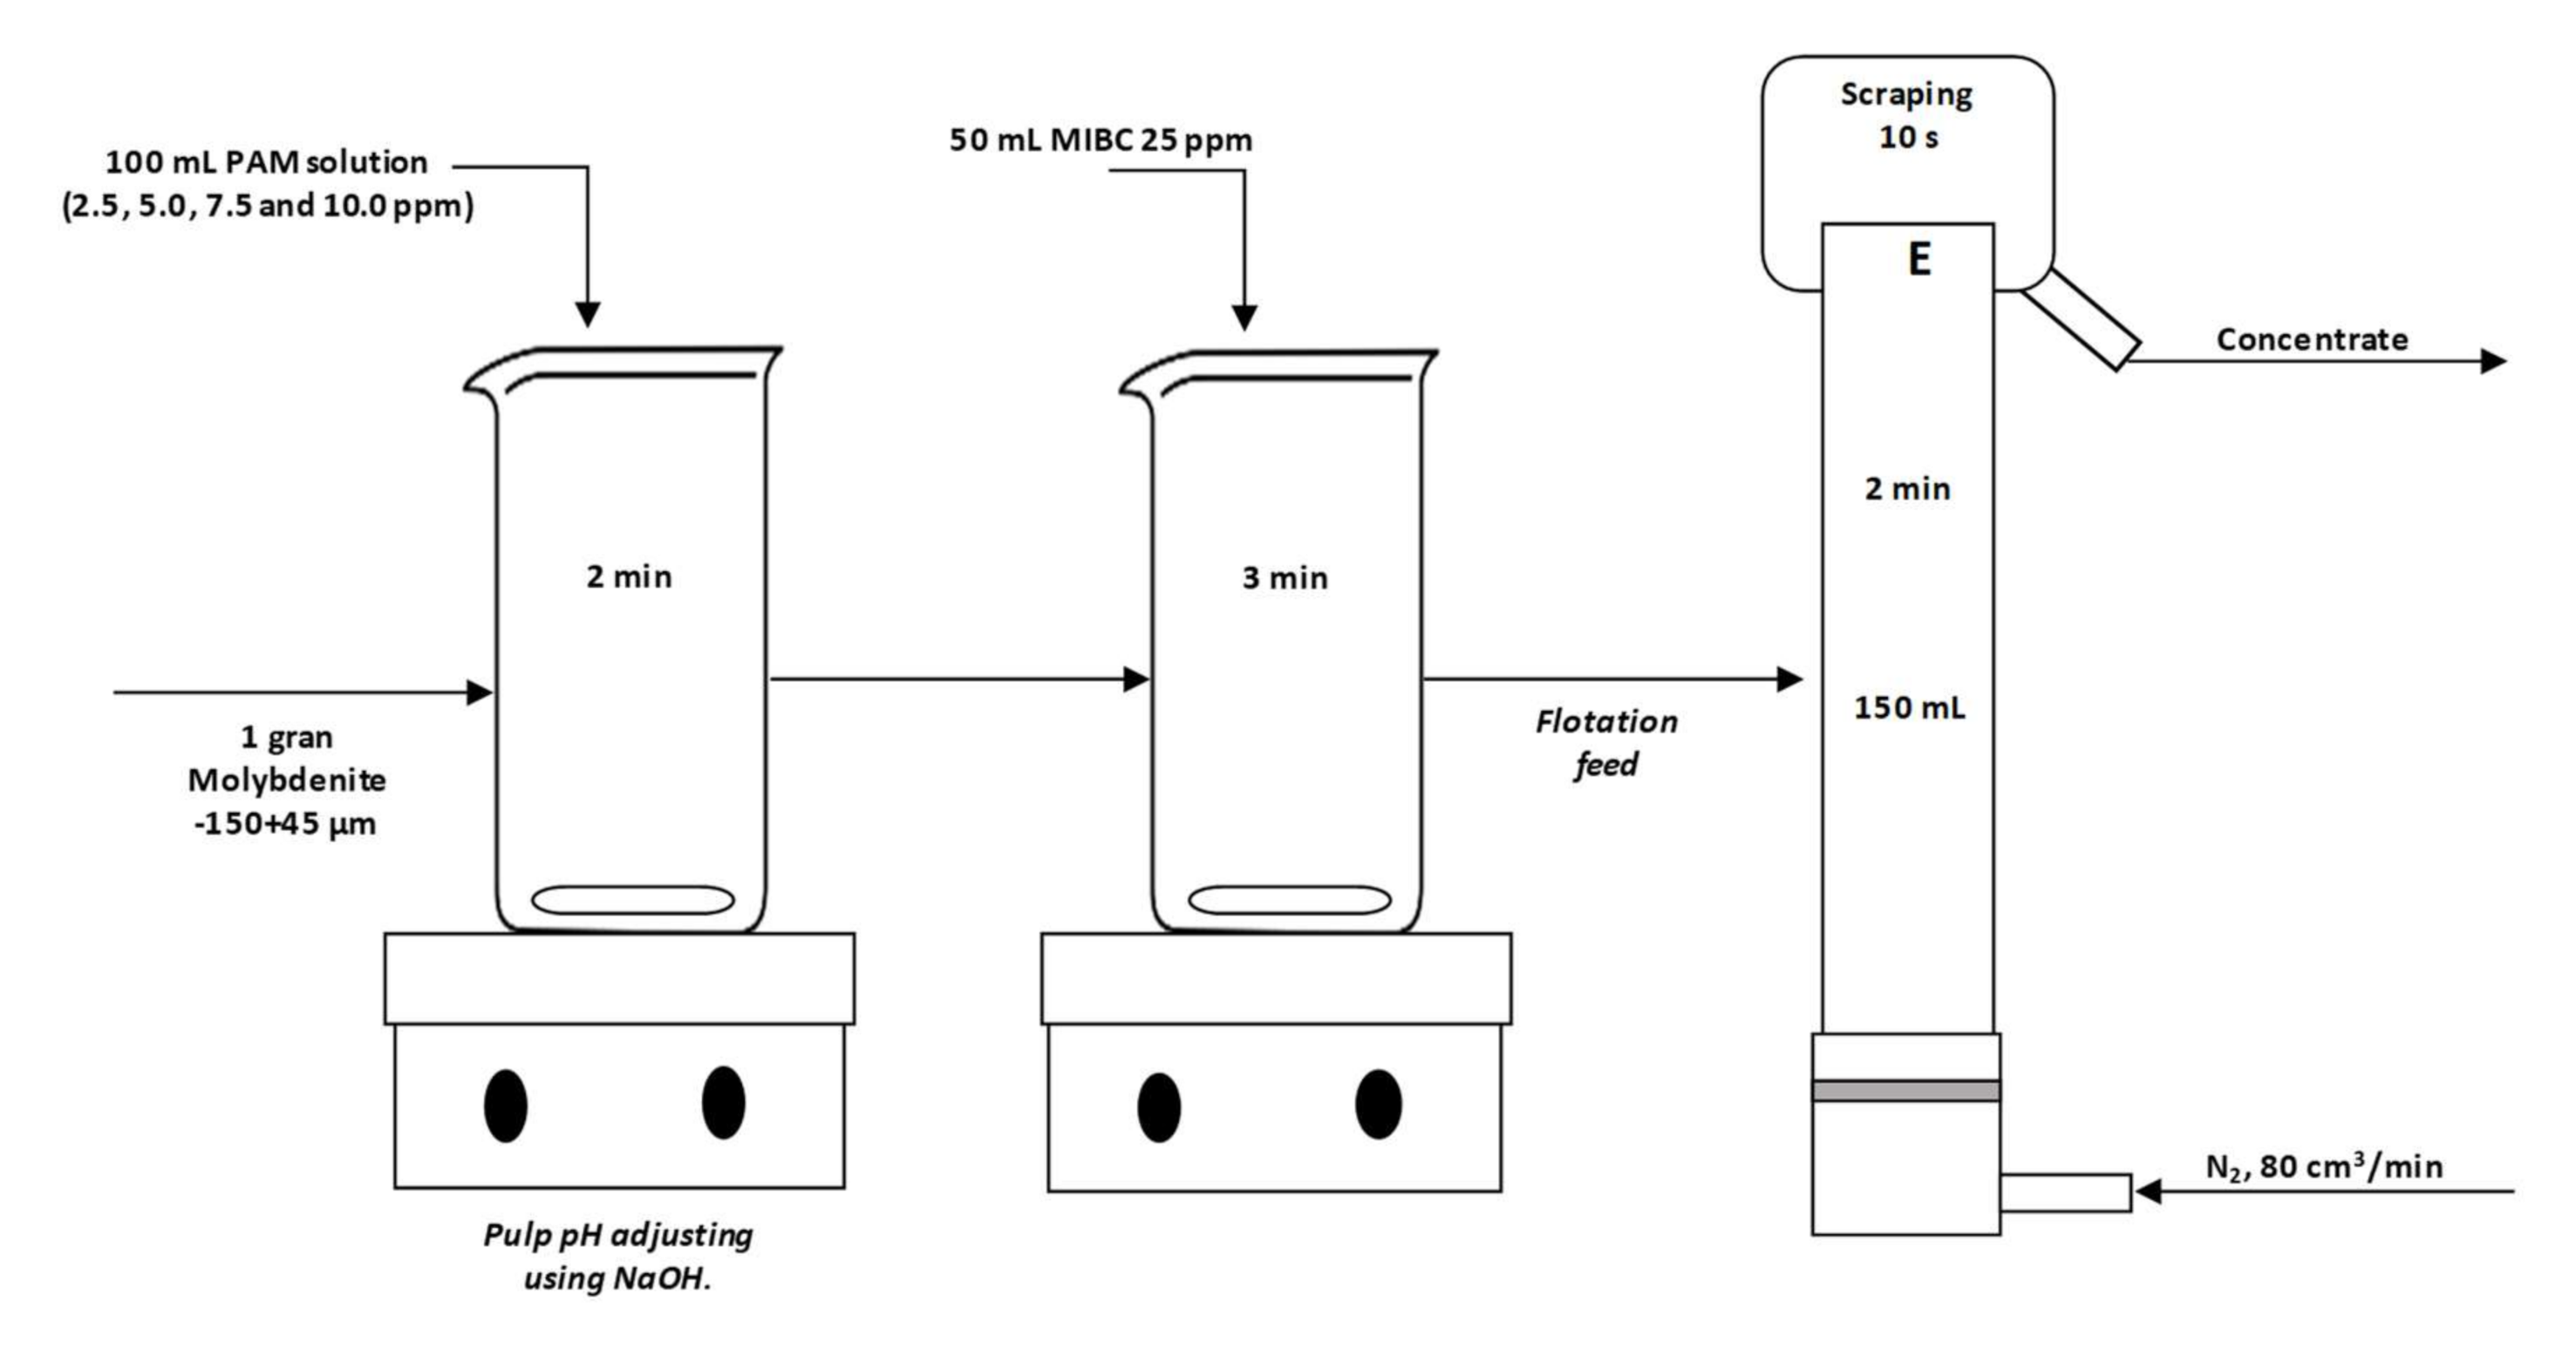
2.3. Microflotation Tests
2.4. Induction Time Measurements
2.5. Adsorption Tests
2.6. Electrophoretic Mobility Measurements
3. Results
3.1. PAM Caracterization
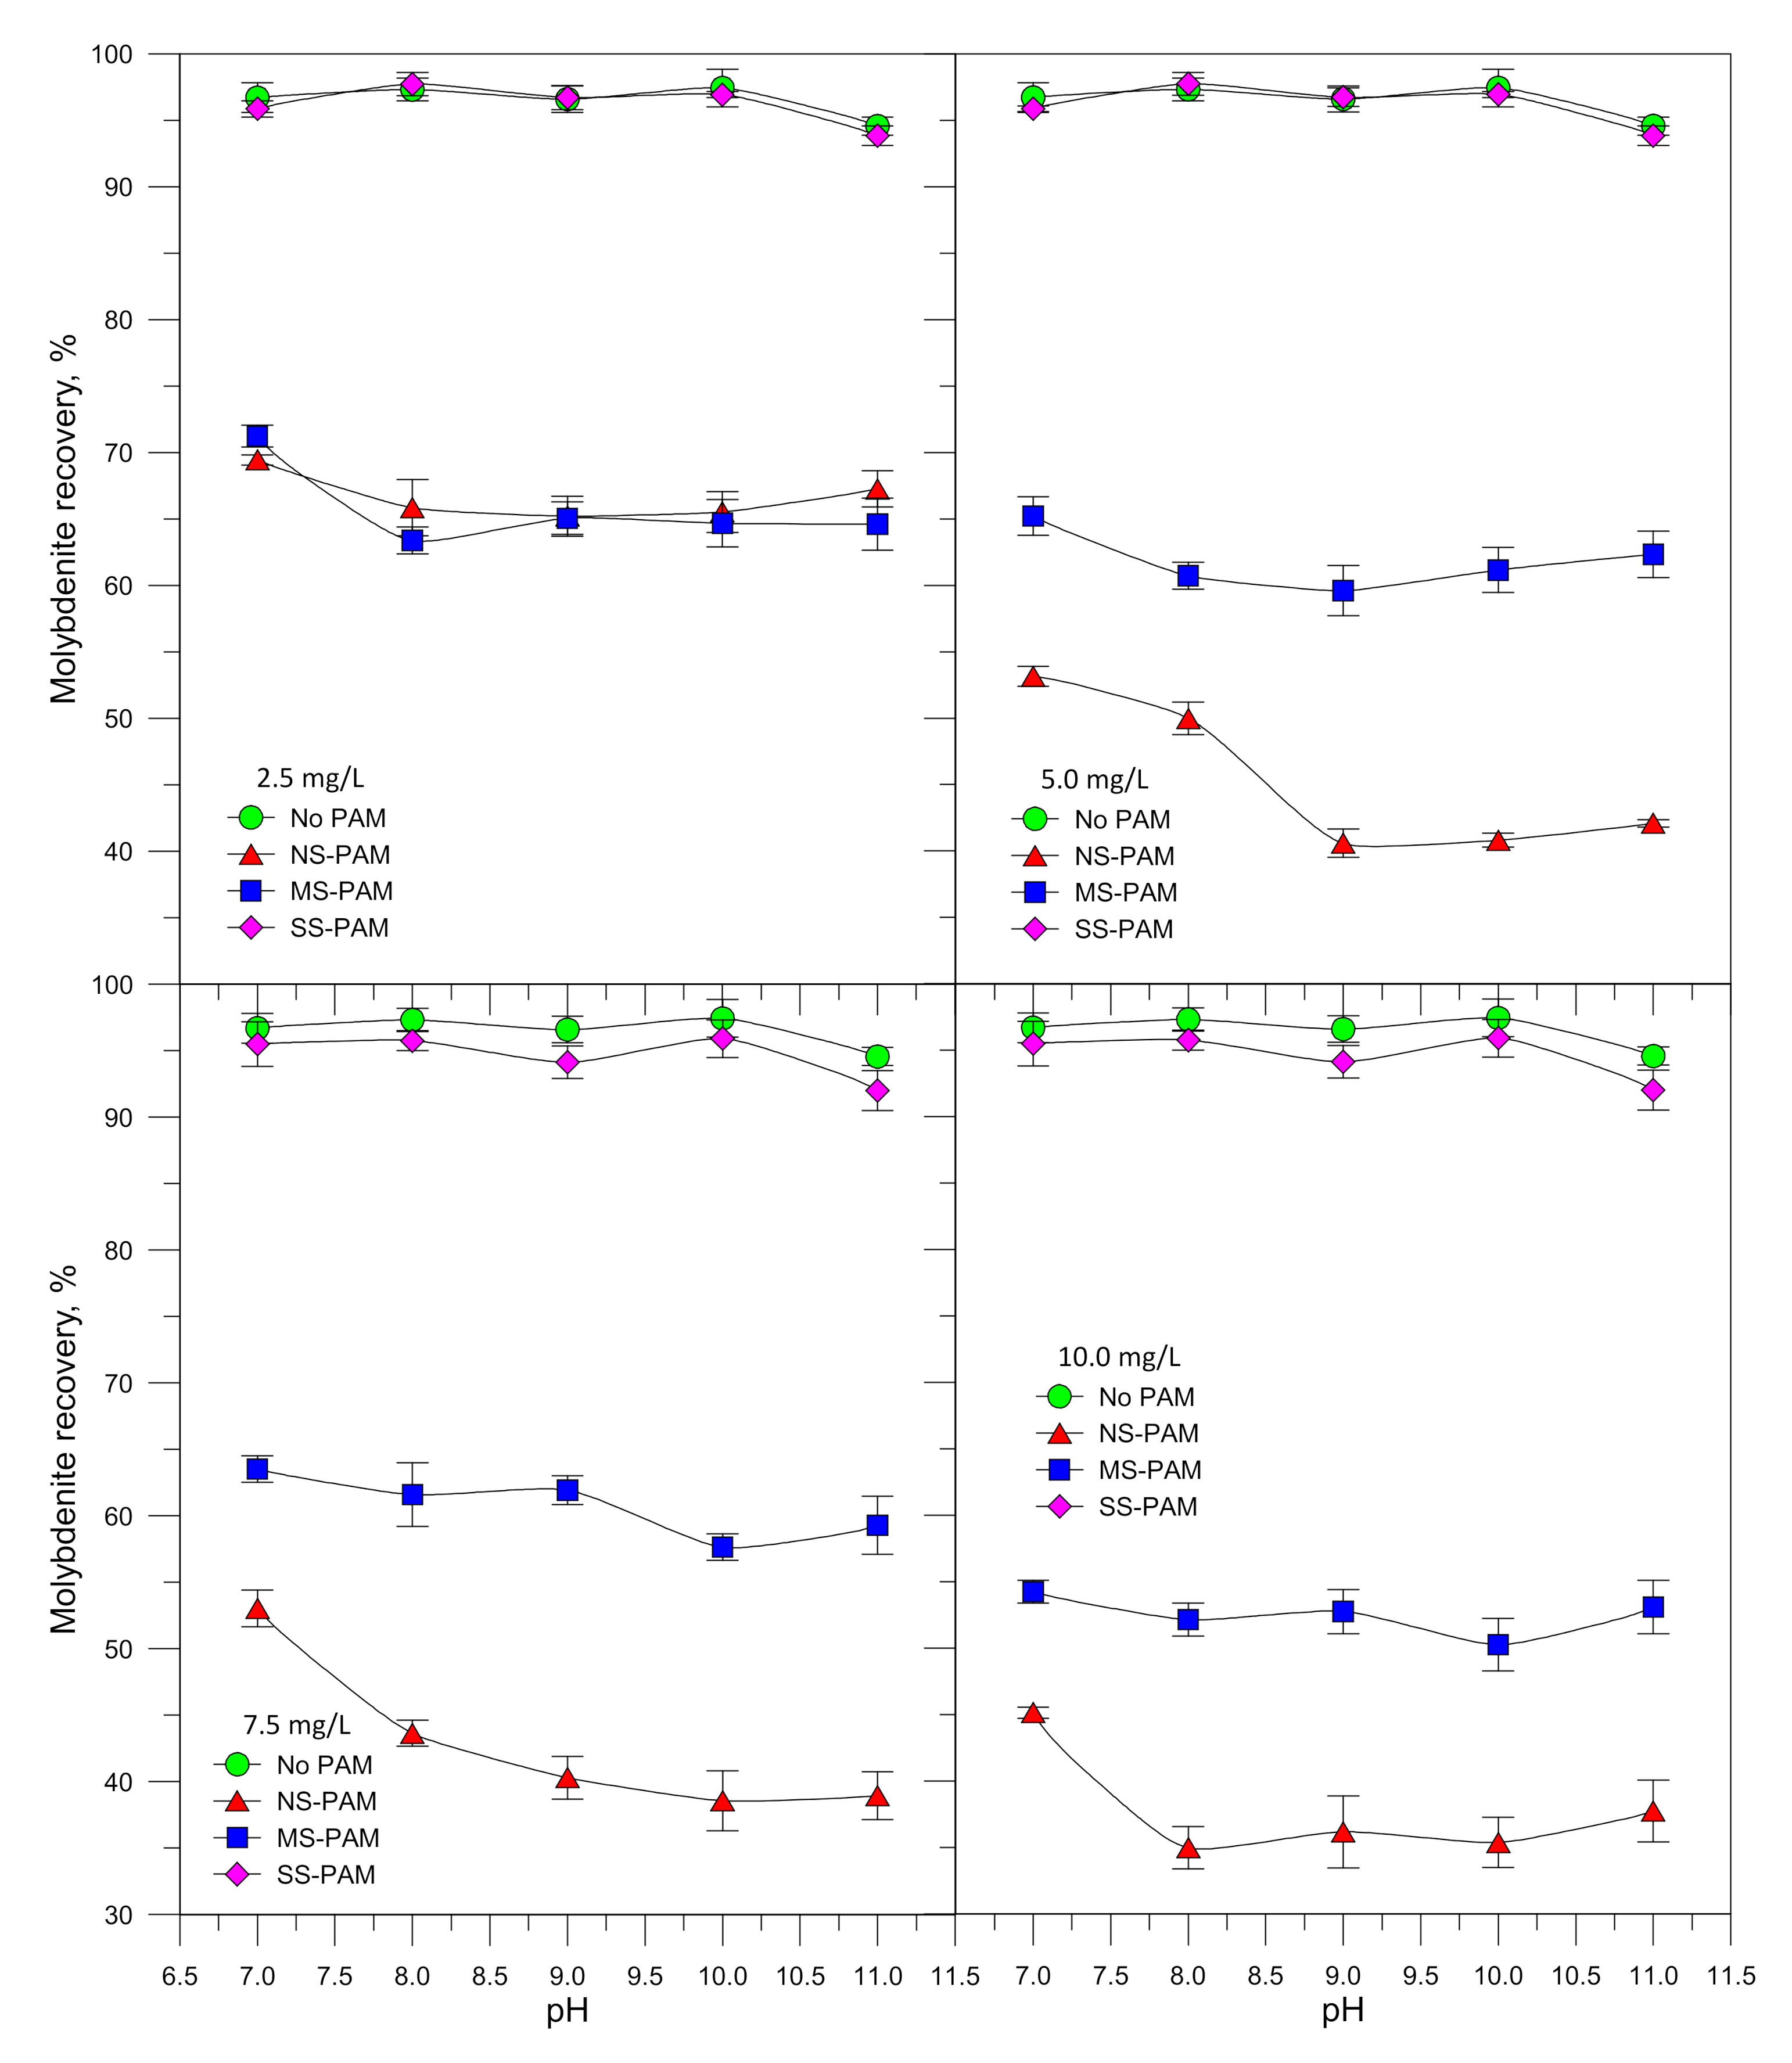
3.2. Microflotation
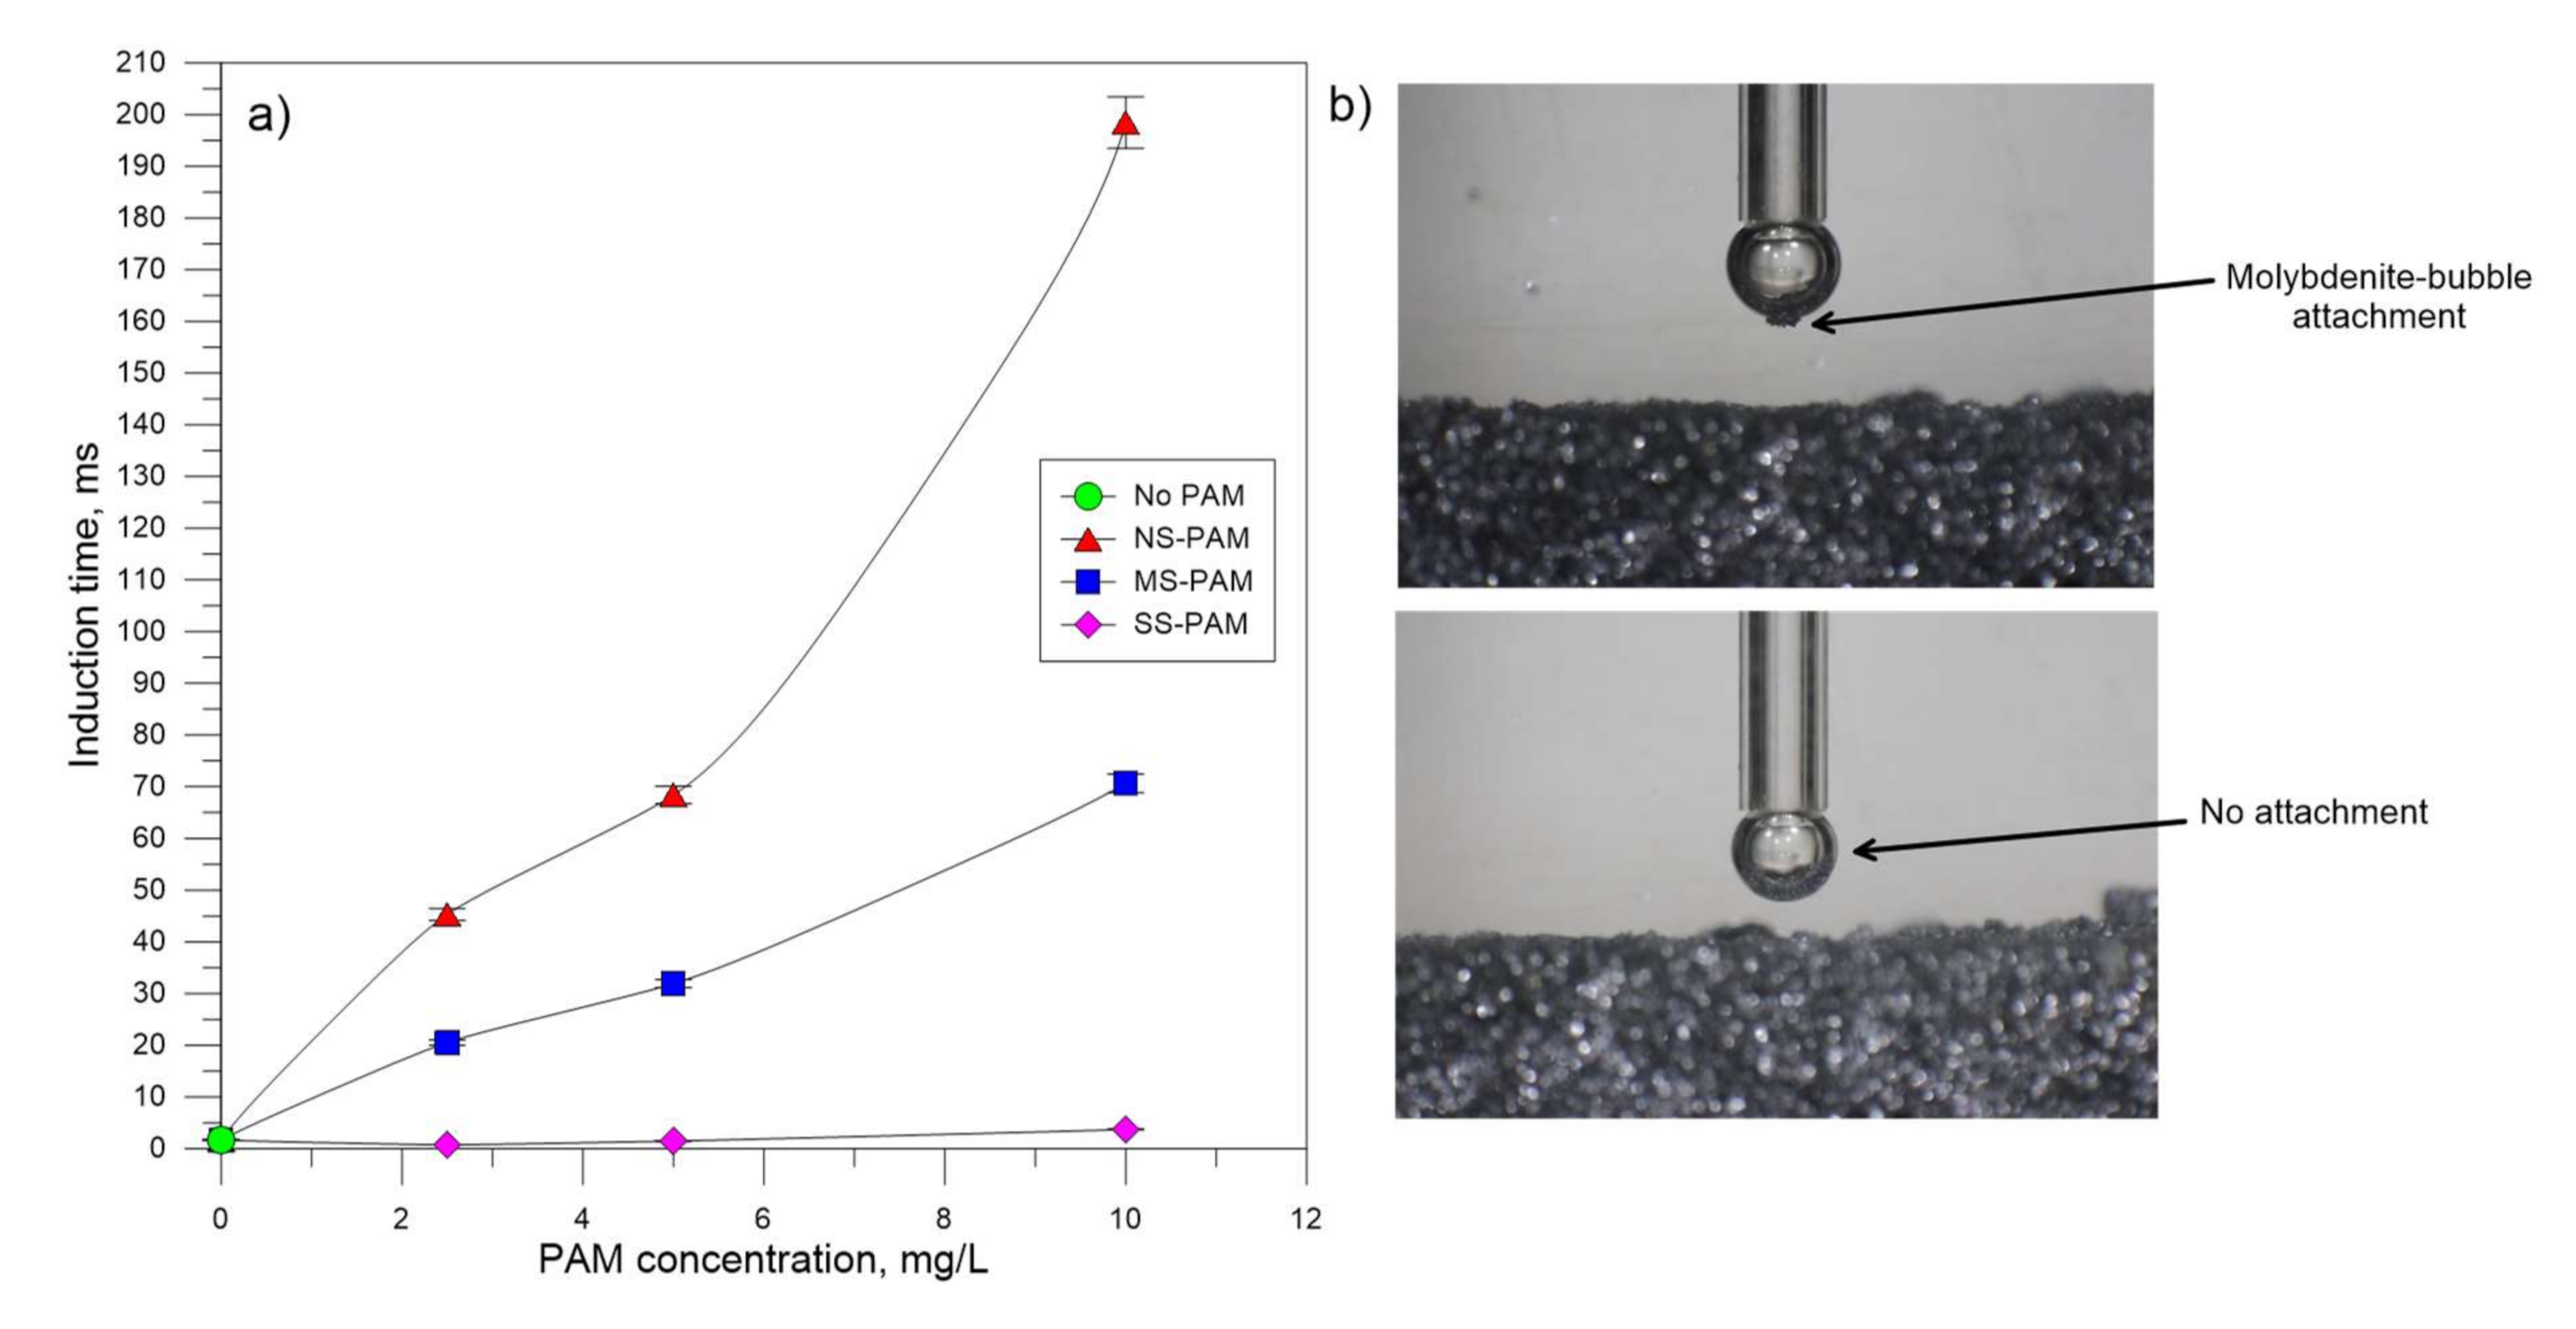
3.3. Induction Time
3.4. Adsorption
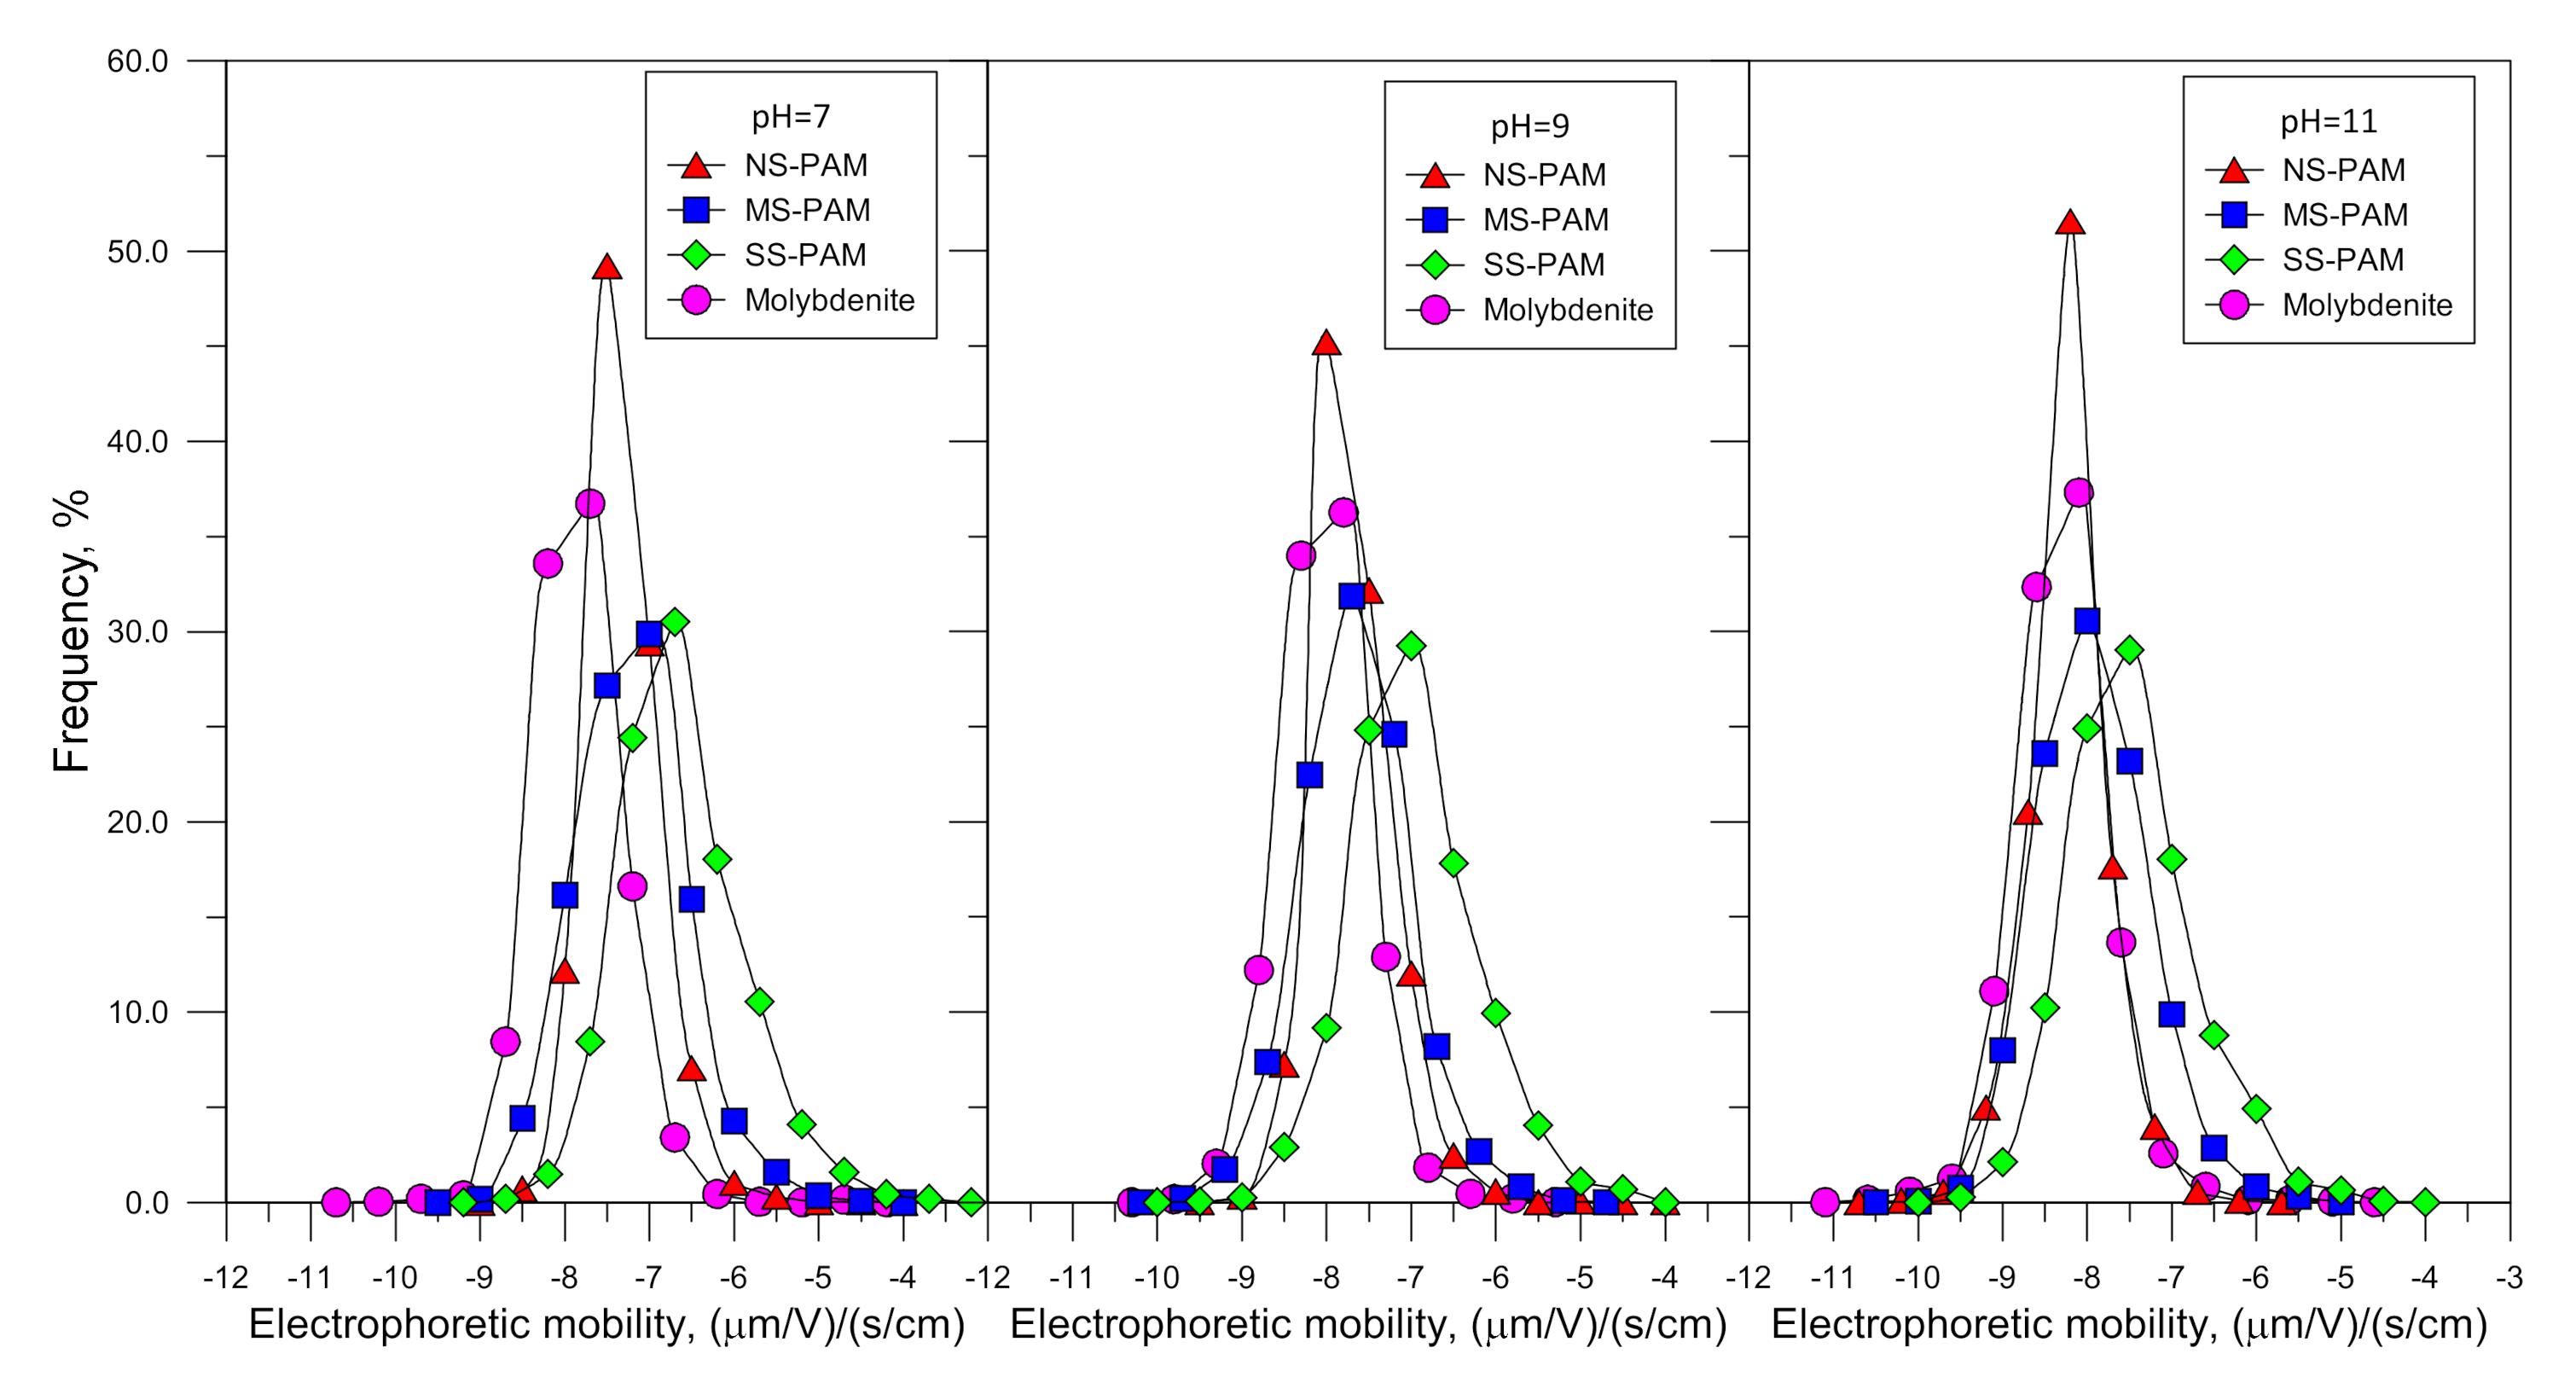
3.5. Electrophoretic and Aggregation
4. Discussion
5. Conclusions
Author Contributions
Funding
Acknowledgments
Conflicts of Interest
References
- Castro, S.; Laskowski, J. Depressing effect of flocculants on molybdenite flotation. Miner. Eng. 2015, 74, 13–19. [Google Scholar] [CrossRef]
- Ramirez, A.; Gutierrez, L.; Vega-Garcia, D.; Reyes-Bozo, L. The depressing effect of kaolinite on molybdenite flotation in seawater. Minerals 2020, 10, 578. [Google Scholar] [CrossRef]
- Arinaitwe, E.; Pawlik, M. A method for measuring the degree of anionicity of polyacrylamide-based flocculants. Int. J. Miner. Process. 2009, 91, 50–54. [Google Scholar] [CrossRef]
- Seybold, C.A. Polyacrylamide review: Soil conditioning and environmental fate. Soil Sci. Plant Anal. 1994, 25, 2171–2185. [Google Scholar] [CrossRef]
- Moody, G. The use of polyacrylamides in mineral processing. Miner. Eng. 1992, 5, 479–492. [Google Scholar] [CrossRef]
- Moudgil, B.M. Effect of polyacrylamide and polyethylene oxide polymers on coal flotation. Colloids Surf. 1983, 2, 225–228. [Google Scholar] [CrossRef]
- Zhang, J.; Hu, Y.; Wang, D.; Xu, J. Depressing effect of hydroxamic polyacrylamide on pyrite. J. Cent. South Univ. Technol. 2004, 11, 380–384. [Google Scholar] [CrossRef]
- Liu, G.; Zhong, H.; Hu, Y.; Zhao, S.; Xia, L. The role of cationic polyacrylamide in the reverse flotation of diasporic bauxite. Miner. Eng. 2007, 20, 1191–1199. [Google Scholar] [CrossRef]
- Boulton, A.; Fornasiero, D.; Ralston, J. Selective depression of pyrite with polyacrylamide polymers. Int. J. Miner. Process. 2001, 61, 13–22. [Google Scholar] [CrossRef]
- Wang, K.; Wang, L.; Cao, M.; Liu, Q. Xanthation-modified polyacrylamide and spectroscopic investigation of its adsorption onto mineral surfaces. Miner. Eng. 2012, 39, 1–8. [Google Scholar] [CrossRef]
- Yi, L.; Li, K.; Liu, D. Degradation of polyacrylamide: A review. Adv. Mater. Res. 2013, 800, 411–416. [Google Scholar] [CrossRef]
- Ramirez, A.; Gutierrez, L.; Laskowski, J.S. Use of “oily bubbles” and dispersants in flotation of molybdenite in fresh and seawater. Miner. Eng. 2020, 148, 578. [Google Scholar] [CrossRef]
- Arinaitwe, E. Characterization of Industrial Flocculants through Intrinsic Viscosity Measurements. Master’s Thesis, University of British Columbia, Vancouver, BC, Canada, August 2008. [Google Scholar]
- Fedors, R.F. An equation for describing the viscosity of dilute to moderately concentrated polymer solutions. Polymer 1979, 20, 225–228. [Google Scholar] [CrossRef]
- Rao, M.V.S. Viscosity of dilute to moderately concentrated polymer solutions. Polymer 1988, 34, 592–596. [Google Scholar] [CrossRef]
- Ghimici, L.; Popescu, F. Determination of intrinsic viscosity for some cationic polyelectrolytes using Fedors equation. Eur. Polym. J. 1998, 34, 13–16. [Google Scholar] [CrossRef]
- Conrad, K.D.; Klein, J. Molecular weight determination of polyacrylamide and polyacrylamide-co-sodium acrylate. Makromol. Chem. 1978, 179, 1635–1638. [Google Scholar]
- Castillo, I.; Gutierrez, L.; Hernandez, V.; Díaz, E.; Ramirez, A. Hemicelluloses monosaccharides and their effect on molybdenite flotation. Powder Technol. 2020, 373, 758–764. [Google Scholar] [CrossRef]
- Laskowski, J.S.; Liu, Q.; O’Connor, C.T. Current understanding of the mechanism of polysaccharide adsorption at the mineral/aqueous solution interface. Int. J. Miner. Process. 2007, 84, 59–68. [Google Scholar] [CrossRef]
- Chander, S.; Fuerstenau, D.W. On the natural floatability of molybdenite. Trans. Soc. Min. Eng. AIME 1972, 252, 62–68. [Google Scholar]
- Yuan, D.; Cadien, K.; Liu, Q.; Zeng, H. Separation of talc and molybdenite: Challenges and opportunities. Miner. Eng. 2019, 143, 105923. [Google Scholar] [CrossRef]
- López-Valdivieso, A.; Madrid-Ortega, I.; Valdez-Pérez, D.; Yang, B.; Song, S. The heterogeneity of the basal plane of molybdenite: Its effect on molybdenite floatability and calcium ion adsorption. In Proceedings of the 9th International Mineral Processing Conference, Santiago, Chile, 20–23 November 2012; pp. 20–23. [Google Scholar]
- Gutierrez, L.; Uribe, L.; Hernandez, V.; Vidal, C.; Texeira-Mendonca, R. Assessment of the use of lignosulfonates to separate chalcopyrite and molybdenite by flotation. Powder Technol. 2019, 359, 216–225. [Google Scholar] [CrossRef]
- Hernandez, V.; Ulloa, A.; Gutierrez, L. Use of wood hemicelluloses to improve copper recovery from high clay Cu-Mo ores. Miner. Eng. 2017, 111, 198–200. [Google Scholar] [CrossRef]


| Peak Position (cm−1) | Assignation |
|---|---|
| 3436 | N–H asymmetric vibration of NH2 |
| 2923 | C–H asymmetric vibration of CH2 |
| 2848 | C–H asymmetric vibration of CH2 |
| 1638 | C=O vibration of CONH2, amide band |
| 1550 | C–O asymmetric vibration of COO– |
| 1433 | C–O asymmetric vibration of COO–y C–N (overlapping) |
| 1119 | N–H torsión de NH2 |
| Average Electrophoretic Mobility, (μm/V)/(s/cm) (10 mg/L flocculant) | |||
|---|---|---|---|
| PAM condition | pH = 7 | pH = 9 | pH = 11 |
| NO–PAM | −7.8 | −8.0 | −8.3 |
| NS–PAM | −7.3 | −7.7 | −8.2 |
| MS–PAM | −7.2 | −7.7 | −7.9 |
| SS–PAM | −6.6 | −7.0 | −7.5 |
© 2020 by the authors. Licensee MDPI, Basel, Switzerland. This article is an open access article distributed under the terms and conditions of the Creative Commons Attribution (CC BY) license (http://creativecommons.org/licenses/by/4.0/).
Share and Cite
Estrada, D.; Echeverry, L.; Ramirez, A.; Gutierrez, L. Molybdenite Flotation in the Presence of a Polyacrylamide of Low Anionicity Subjected to Different Conditions of Mechanical Shearing. Minerals 2020, 10, 895. https://doi.org/10.3390/min10100895
Estrada D, Echeverry L, Ramirez A, Gutierrez L. Molybdenite Flotation in the Presence of a Polyacrylamide of Low Anionicity Subjected to Different Conditions of Mechanical Shearing. Minerals. 2020; 10(10):895. https://doi.org/10.3390/min10100895
Chicago/Turabian StyleEstrada, Darwin, Luver Echeverry, Andres Ramirez, and Leopoldo Gutierrez. 2020. "Molybdenite Flotation in the Presence of a Polyacrylamide of Low Anionicity Subjected to Different Conditions of Mechanical Shearing" Minerals 10, no. 10: 895. https://doi.org/10.3390/min10100895