Copper Precipitation Behavior during Continuous Cooling and Subsequent Aging of Powder-Forged Fe-2.5Cu-C Alloy

State Key Laboratory for Mechanical Behaviour of Materials, Xi’an Jiaotong University, Xi’an 710049, China
*
Author to whom correspondence should be addressed.
Metals 2020, 10(10), 1350; https://doi.org/10.3390/met10101350
Submission received: 18 August 2020
/
Revised: 28 September 2020
/
Accepted: 7 October 2020
/
Published: 9 October 2020
(This article belongs to the Section Powder Metallurgy)
Abstract
:Microstructure and property evolution of a powder-forged Fe-2.5Cu-C alloy during continuous cooling and subsequent aging were investigated to improve its mechanical properties. During continuous cooling, copper precipitates formed were consistent with the interphase mechanism when the cooling rate was less than 7 °C/s; however, the hardness of the specimen was always higher at faster cooling rates because finer grains and harder phases formed. During subsequent aging, copper precipitates formed and/or coarsened continuously while the hardness of the alloys was greatly influenced by the combined effects of the primary and secondary precipitates, as revealed by the theoretical calculations. In addition, the forming and evolving mechanisms of the copper precipitates at different stages were also discussed based on the experimental results. This study will provide guidance to the industry for achieving high performance in the powder-forged products by treatment manipulation.
1. Introduction
Powder forging is a near net shape technique which combines the advantages of both powder metallurgy and precision forging [1,2,3,4]. Sintering preforms are hot forged into their final shape and porous products are fully densified in a single stroke which not only improves efficiency but also reduces cost [2,3,5].
We have investigated the effect of copper content on mechanical properties and hot deformation behavior of powder-forged Fe-Cu-C connecting rods [6]. In this alloy, part of the copper would precipitate during the air cooling process and the rest of copper was dissolved in the matrix [6]. As the major strengthening element, copper could strengthen the alloy by solid solution strengthening, grain refinement, and precipitation strengthening. Although specimens with higher copper content would have higher strength, they would also have more solute copper atoms in the matrix, which might lead to an initiation of micro cracks during treatments. Such as the specimens with 3 wt.% and 3.25 wt.% copper, micro cracks have been observed and the fatigue test proved the micro cracks would be detrimental to fatigue strength and reliability of the connecting rods [6]. Therefore, the alloy with 2.5 wt.% copper has been recommended as the material for the connecting rods [6]. To further improve the mechanical properties of the Fe-2.5Cu-C alloy and avoid the micro crack, altering the size and density of copper precipitates is a potential method. Therefore, it is necessary to understand the transformation process of copper precipitates and its effect on mechanical properties during the continuous cooling process and subsequent aging.
Copper could precipitate by two mechanisms: interphase mechanism [7,8,9,10,11,12,13] and aging [14,15,16,17,18,19,20,21,22]. Copper precipitates could form by the interphase mechanism when the specimen cooled slower than at a critical rate. Increasing the cooling rate would lead to a faster movement of the austenite/ferrite interface and shorter periods for atoms diffusion; therefore, copper precipitates were difficult to form and grow at a high cooling rate [8,9,13,23]. A certain element, such as nickel, would improve the nuclei rate for the copper precipitates which could increase the critical cooling rate [8,9,13,23]. In addition, copper could precipitate by aging which has a complicated transformation process. Researchers now generally accept the following precipitation sequence. Copper atoms form FeCu nano-ordered cluster at the beginning stage when the Fe/Cu atomic ratio is almost 1:1. With the aging proceeds, Cu atoms increase in the nano-ordered cluster and the ordering gradually decreases. Further aging leads metastable body-centered cubic (BCC) precipitates to transform in a martensitic manner into an internally twinned 9R structure. With sequential aging, the 9R structure transforms into a more stable 3R structure. Finally, the 3R structure transforms into a stable face-centered cubic (FCC) structure. During the transformation process, copper precipitates gradually divorce from the matrix and become larger. Several researchers declare the strength of the alloy gradually decreases with the transformation of the copper precipitates [19,20,21,24,25,26,27,28,29,30].
From the previous study, it has been found that copper could precipitate in the air-cooled powder-forged connecting rod [6]. Therefore, the copper precipitate might be controlled by proper heat treatment, such as continuous cooling and aging. In the present study, specimens were hot compressed and then cooled at different rates. Then, these specimens were aged at 400 °C for 2 h. The microstructure and property evolution after different processes were investigated and theoretical calculations were also conducted to elucidate the influence of the copper precipitates on the properties of the alloys.
2. Materials and Methods
As-received powder-forged Fe-2.5Cu-C samples with a ferrite–pearlite microstructure were supplied by Shandong Xinyi, Co., in a connecting rod-shaped block. The chemical composition of the as-received material is listed in Table 1.
Cylinder specimens of 10 mm in height and 7 mm in diameter were cut from the as-received material for the dilatometry tests. Both ends and surfaces of the specimens were polished. The Ac1, Ac3, and Ms temperatures of the material were measured using a Gleeble 3800 thermal simulator (DSI, Nashville, MN, USA). The cylinder specimen was heated up to 1000 °C at a rate of 0.1 °C/s from room temperature under a vacuum of 3 × 10⁻³ mbar. The Ac1 and Ac3 temperatures were measured from the dilatometric curve. The specimen was then quenched and the Ms temperature was obtained from the dilatometric curve.
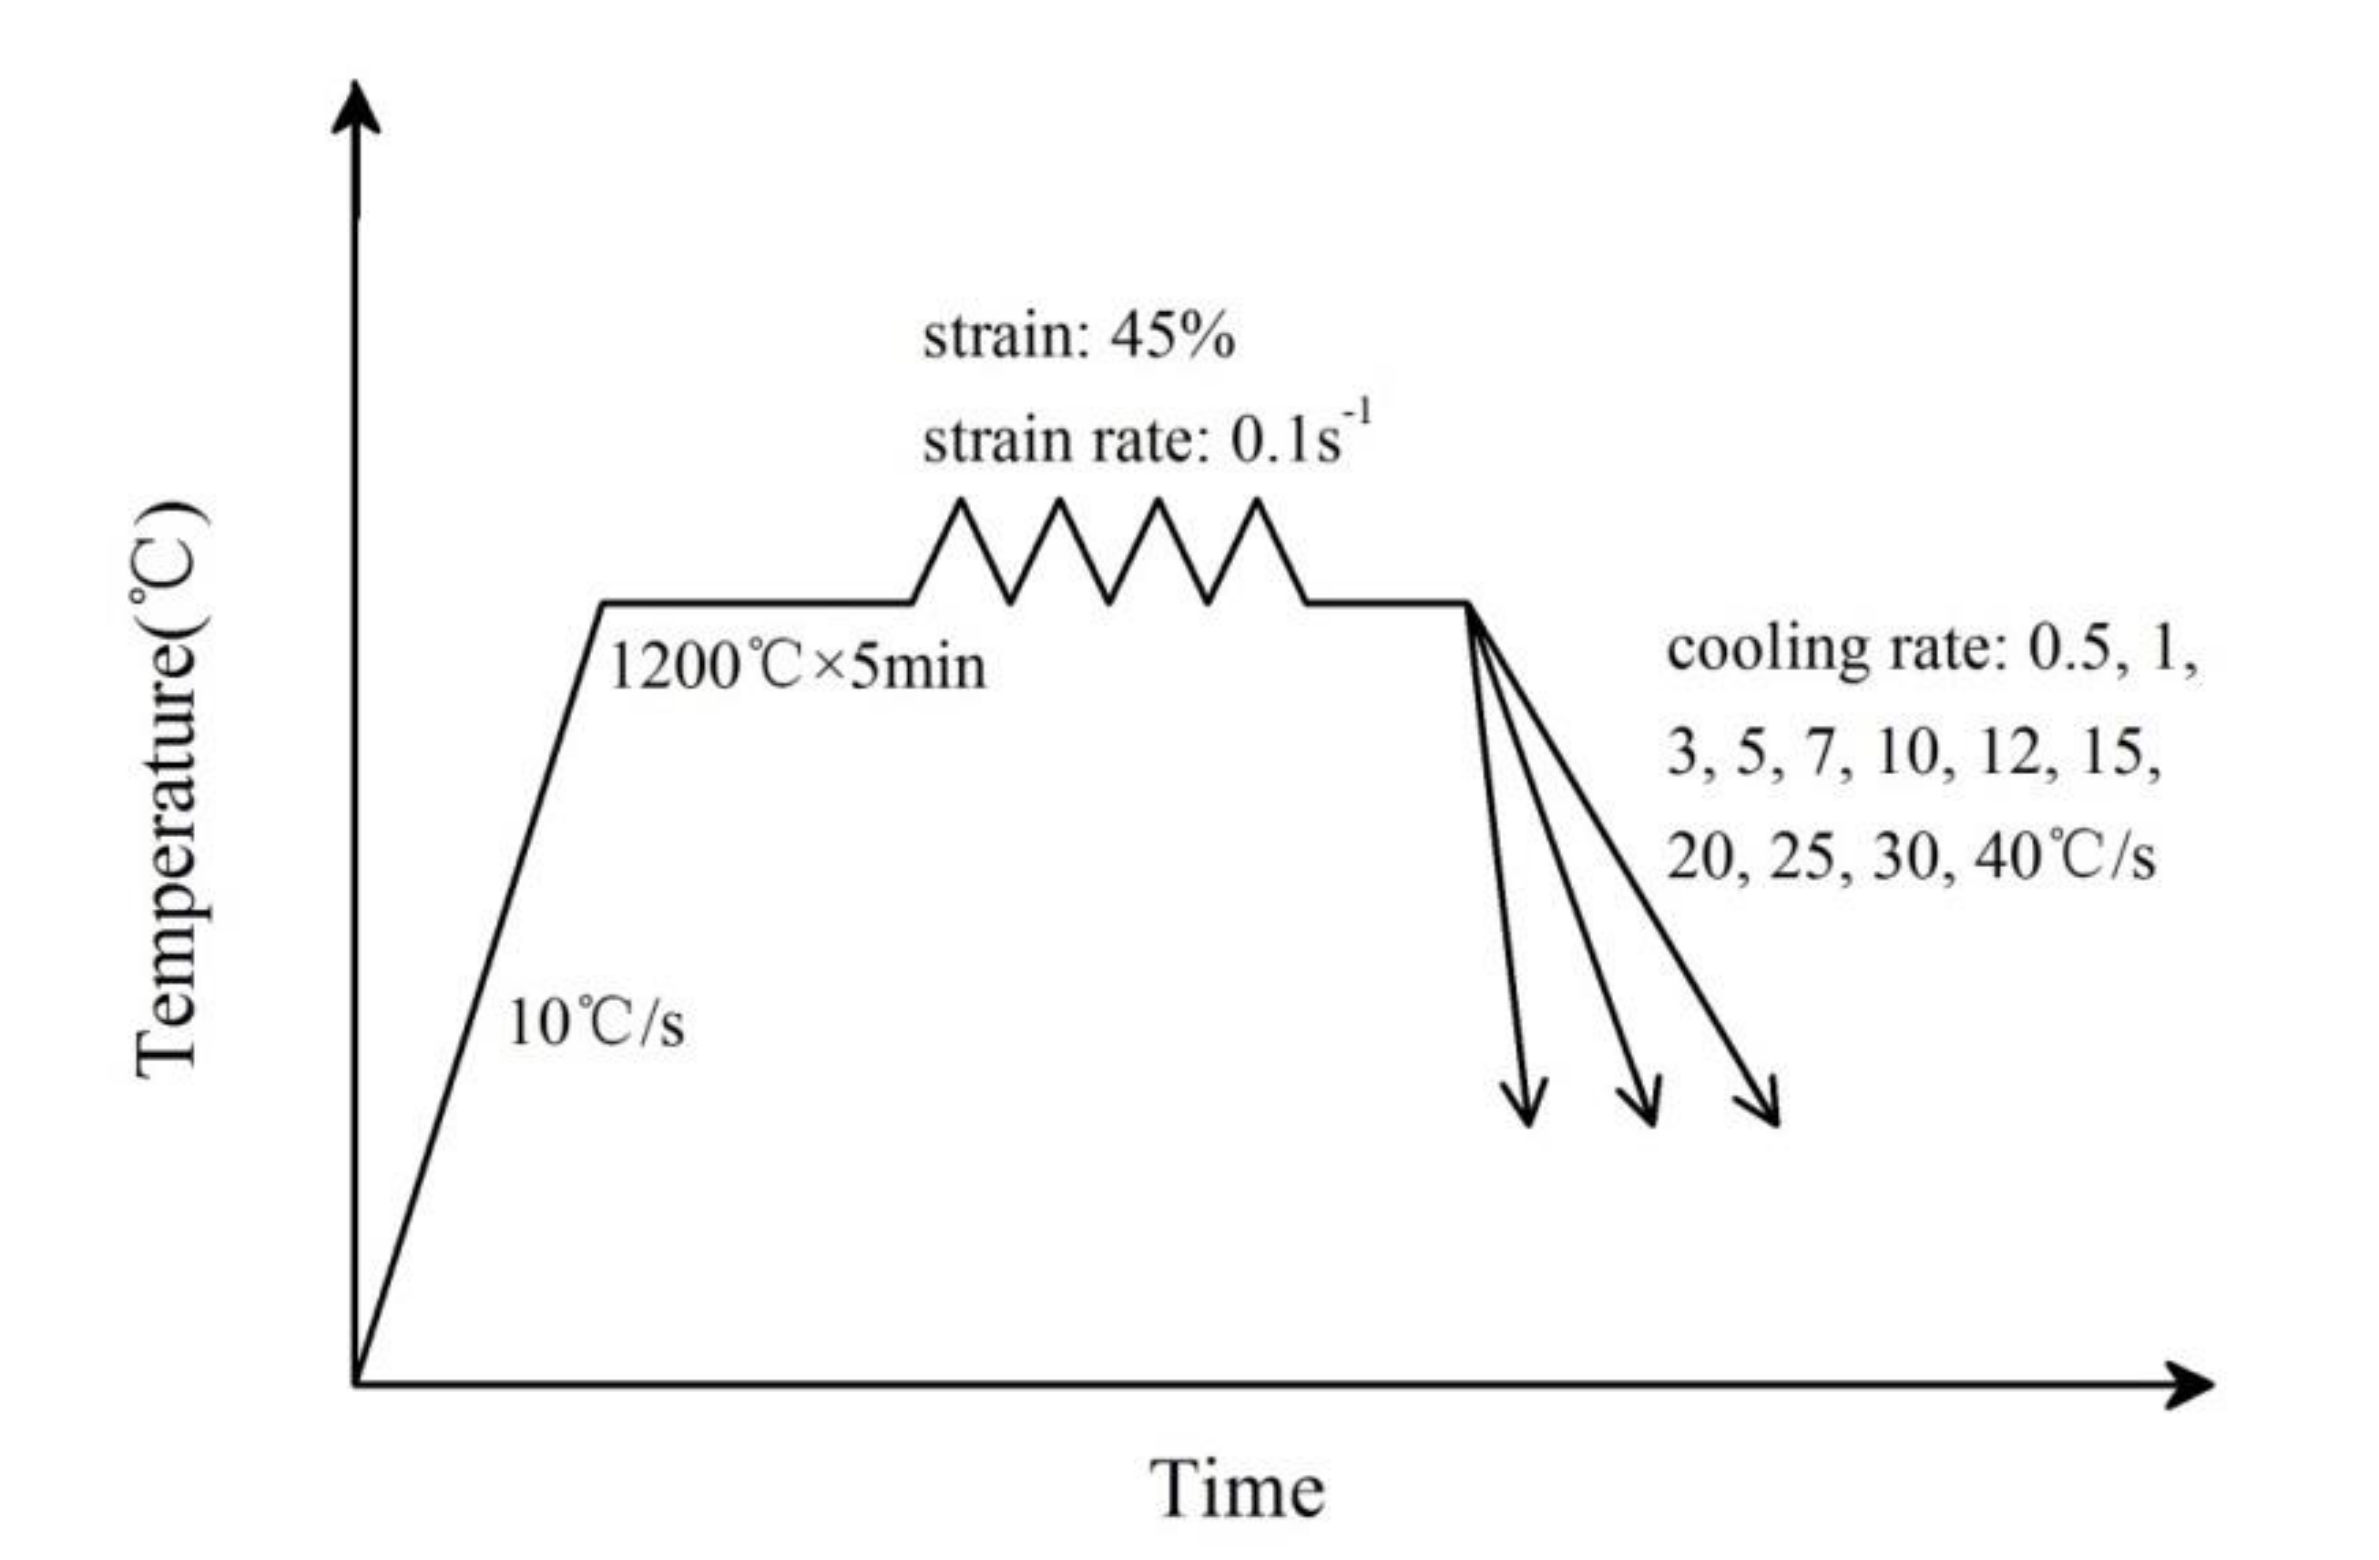
For the continuous cooling test, the procedure was as follows: Two tantalum sheets were used to cover the upper and lower ends of the cylinder specimens to lubricate and avoid carburization during the hot compression. Two thermocouples were embedded at the mid-height of the specimens to monitor their actual temperature. The maximum temperature variation was controlled within 2 °C of the set temperature during the entire test. After the preparation, specimens were heated up to 1200 °C at a rate of 10 °C/s with a vacuum of 3 × 10⁻³ mbar. The specimens were held for 5 min at 1200 °C to achieve full austenization, followed by 0.45 strain compression at a rate of 0.1 s−1. After the compression, the deformed specimens were cooled at different rates of 0.5–40 °C/s. The schematic presentation of the continuous cooling tests is presented in Figure 1.
The specimens cooled at 0.5–7 °C/s were then subjected to aging. The objective was to determine the copper precipitation behavior and its effect on the mechanical properties of the specimens cooled at different rates after aging. As reported in the literature, copper precipitates reach a peak stage during a short time [17,31,32], and thus the specimens were aged at 400 °C for 2 h.
The phase transformation temperatures were determined according to the dilatometric curves with the assistance of microstructure observations and hardness measurements. The specimens cooled at different rates were cut along the longitudinal axis, then polished and etched using 4% nital for 5 s to reveal the microstructure based on optical microscopy (Nikon MA-200, Tokyo, Japan). The micro-hardness tests of the specimens were conducted in a HVS-50Z/LCD durometer (SCTMC, Shanghai, China) with a 100 g load held for 15 s. Different phase was distinguished by contrast and their volume fraction was calculated by ImageJ (National Institutes of Health, Bethesda, Rockville, MD, USA). Average grain size and pearlite lamella space were measured based on optical and SEM pictures using ImageJ.
Copper precipitates were formed after continuous cooling and subsequent aging, as observed using a Zeiss Gemini 500 field emission scanning electron microscope (SEM, ZEISS, Heidenheim, Germany) and a JEM 2000 transmission electron microscope (TEM, JEOL, Tokyo, Japan). The specimens were ground to a 50 µm thickness and then thinned using a twin-jet electro-polisher (MTP-1, Yulong, Shanghai, China) with 9% perchloric acid.
3. Results
3.1. Dilatometric Curves and Microstructure of Specimens Cooled at Different Rates
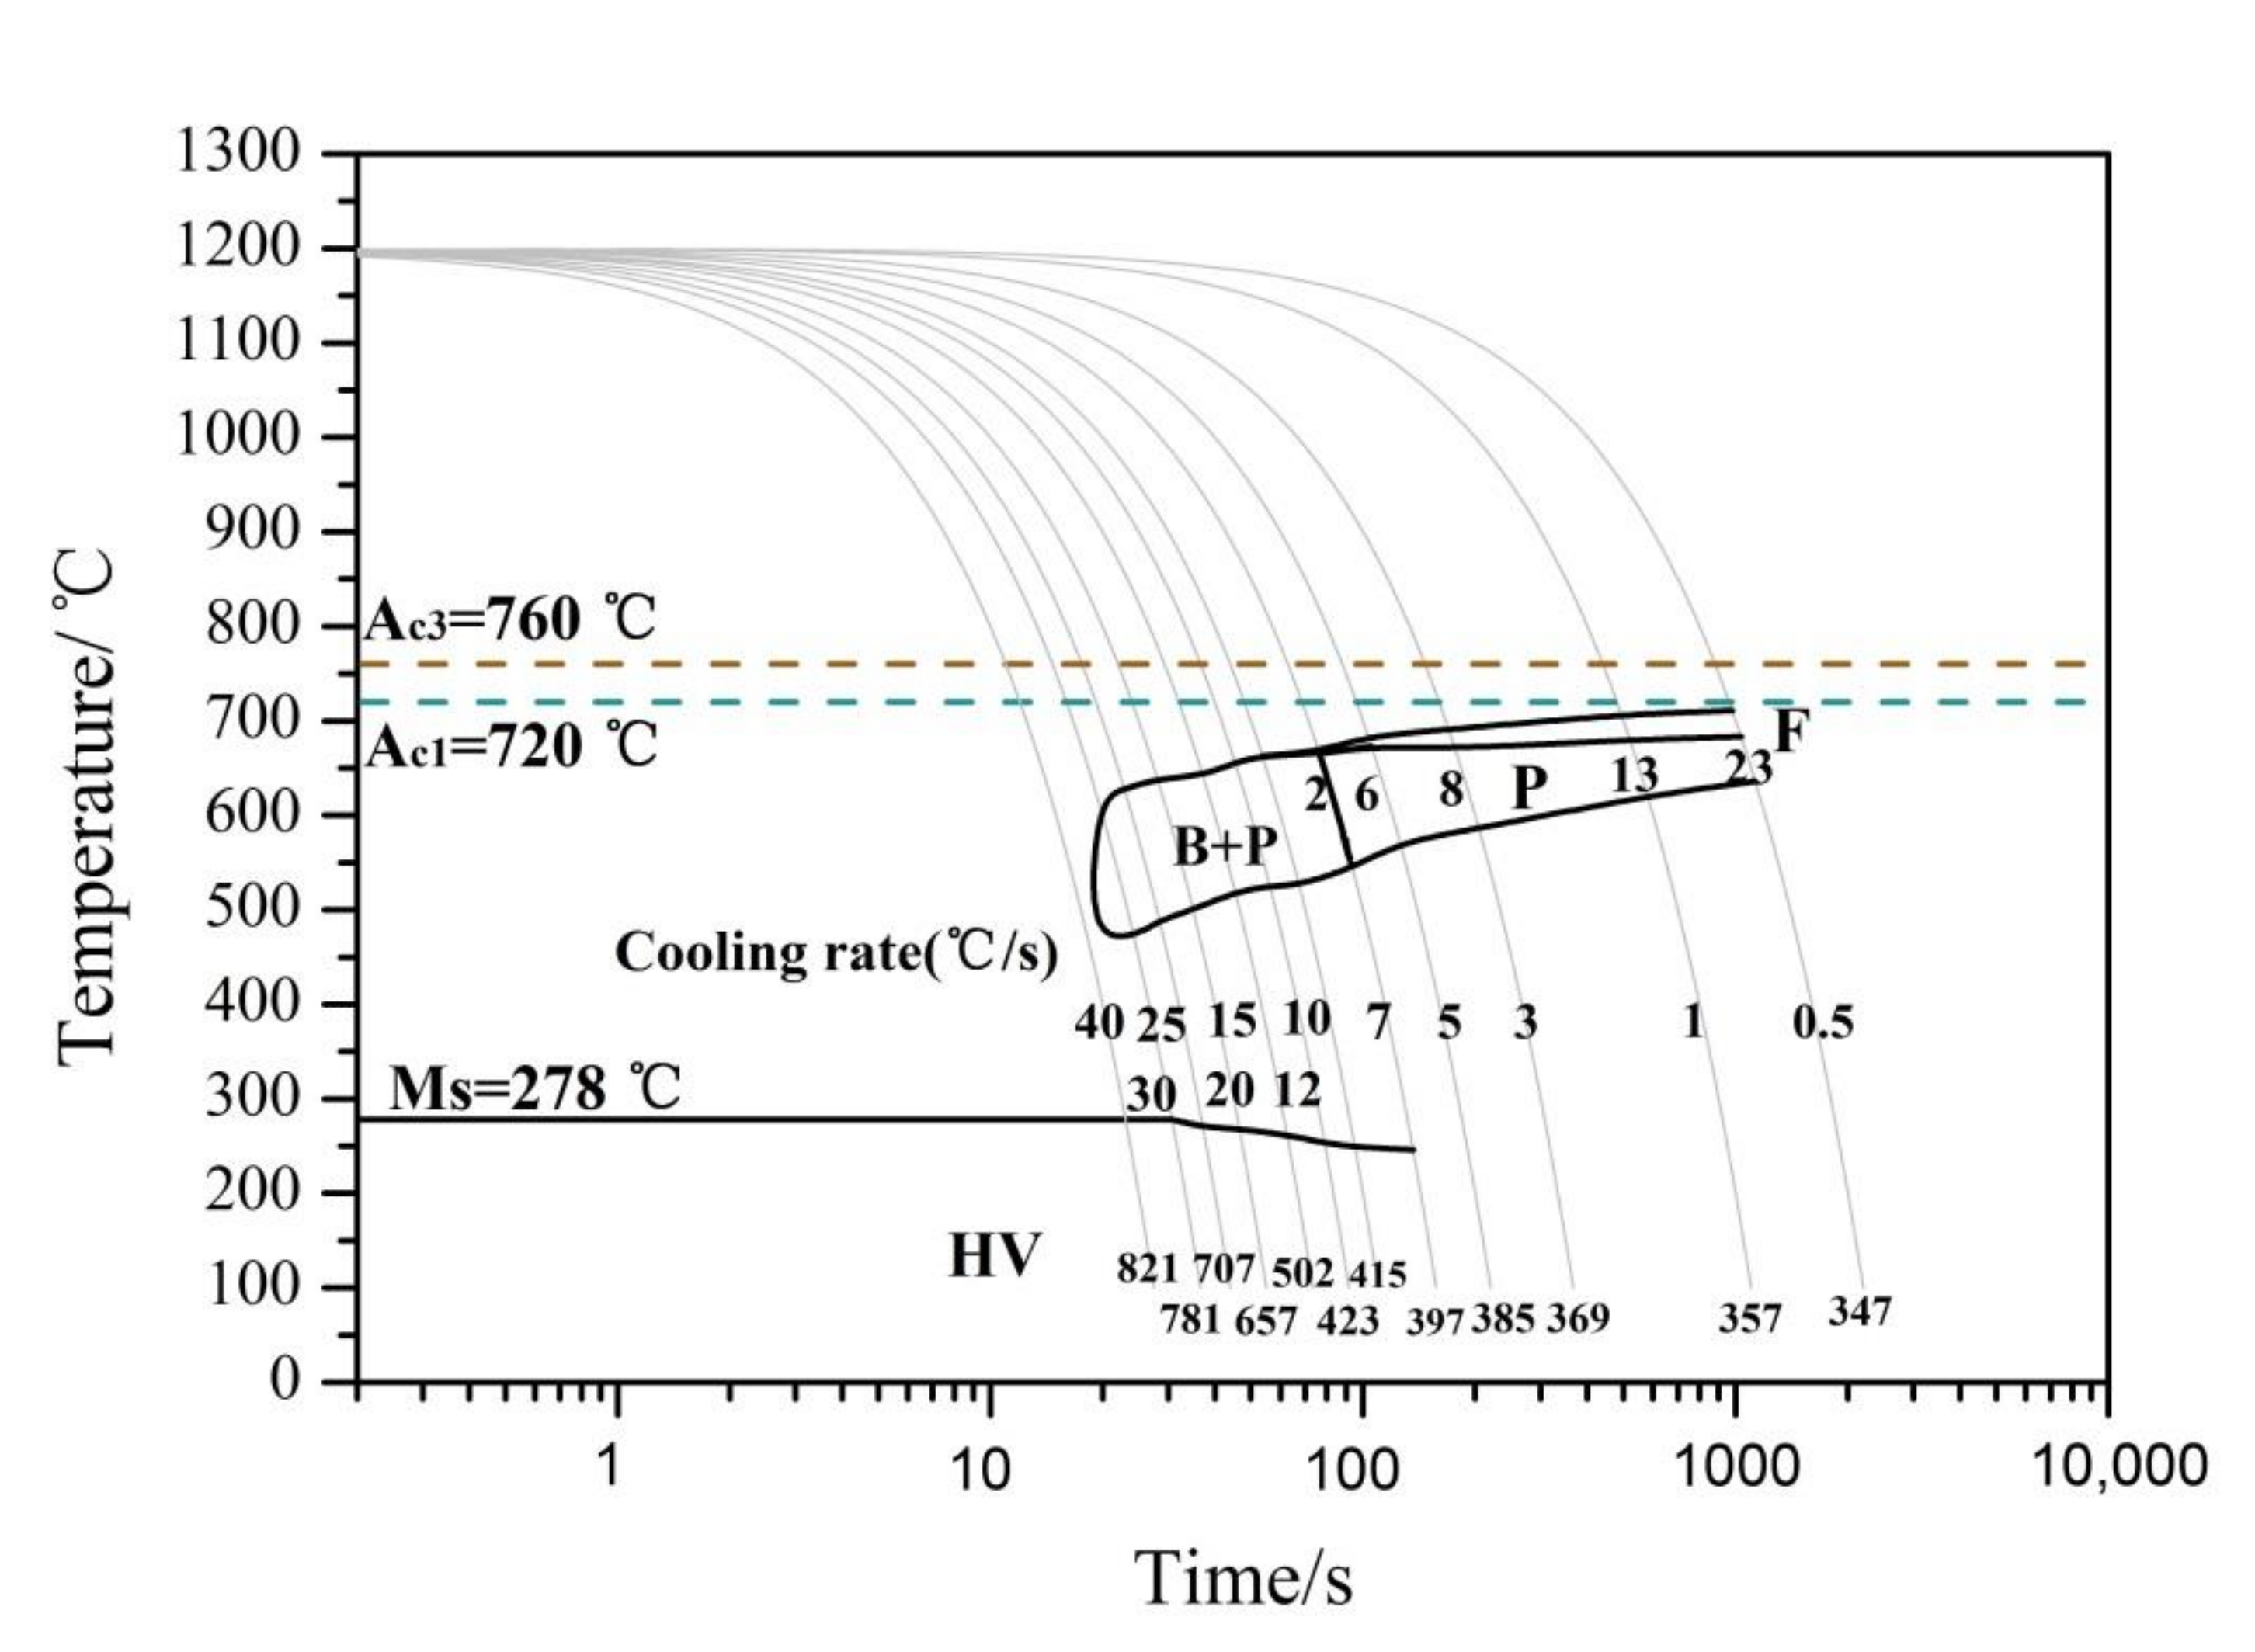
For powder-forged connecting rods, considered about fracture splitting [33] and fatigue strength [1,6], a pearlite structure was preferred because of its optimal combination of high strength and good toughness. Hence, a continuous cooling transformation (CCT) diagram of the alloy was constructed to ensure the pearlite structure was obtained [1,5,9,11,34].
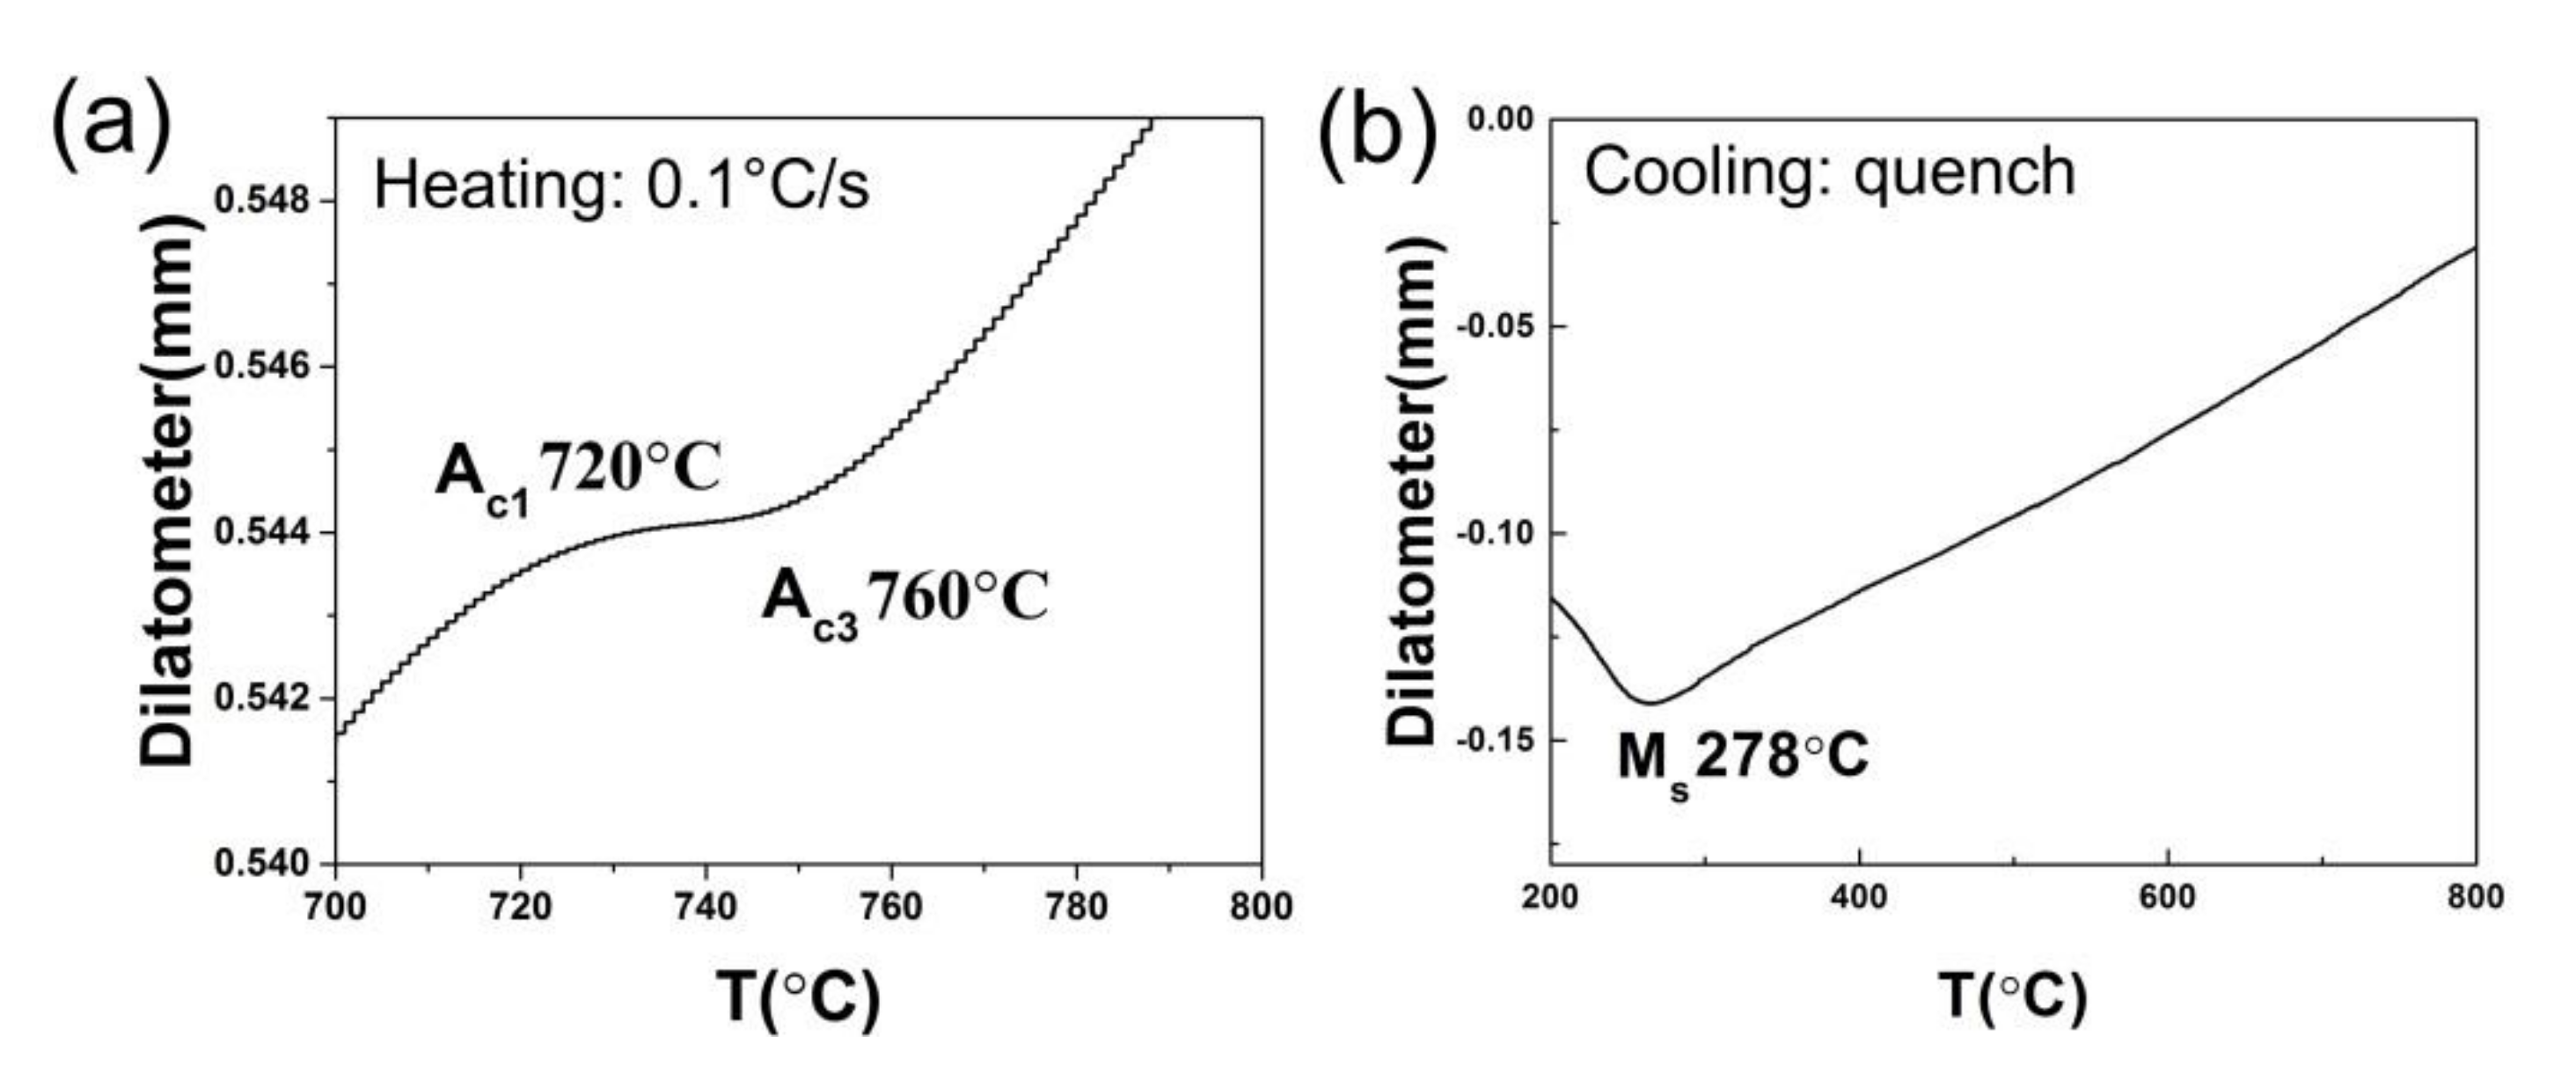
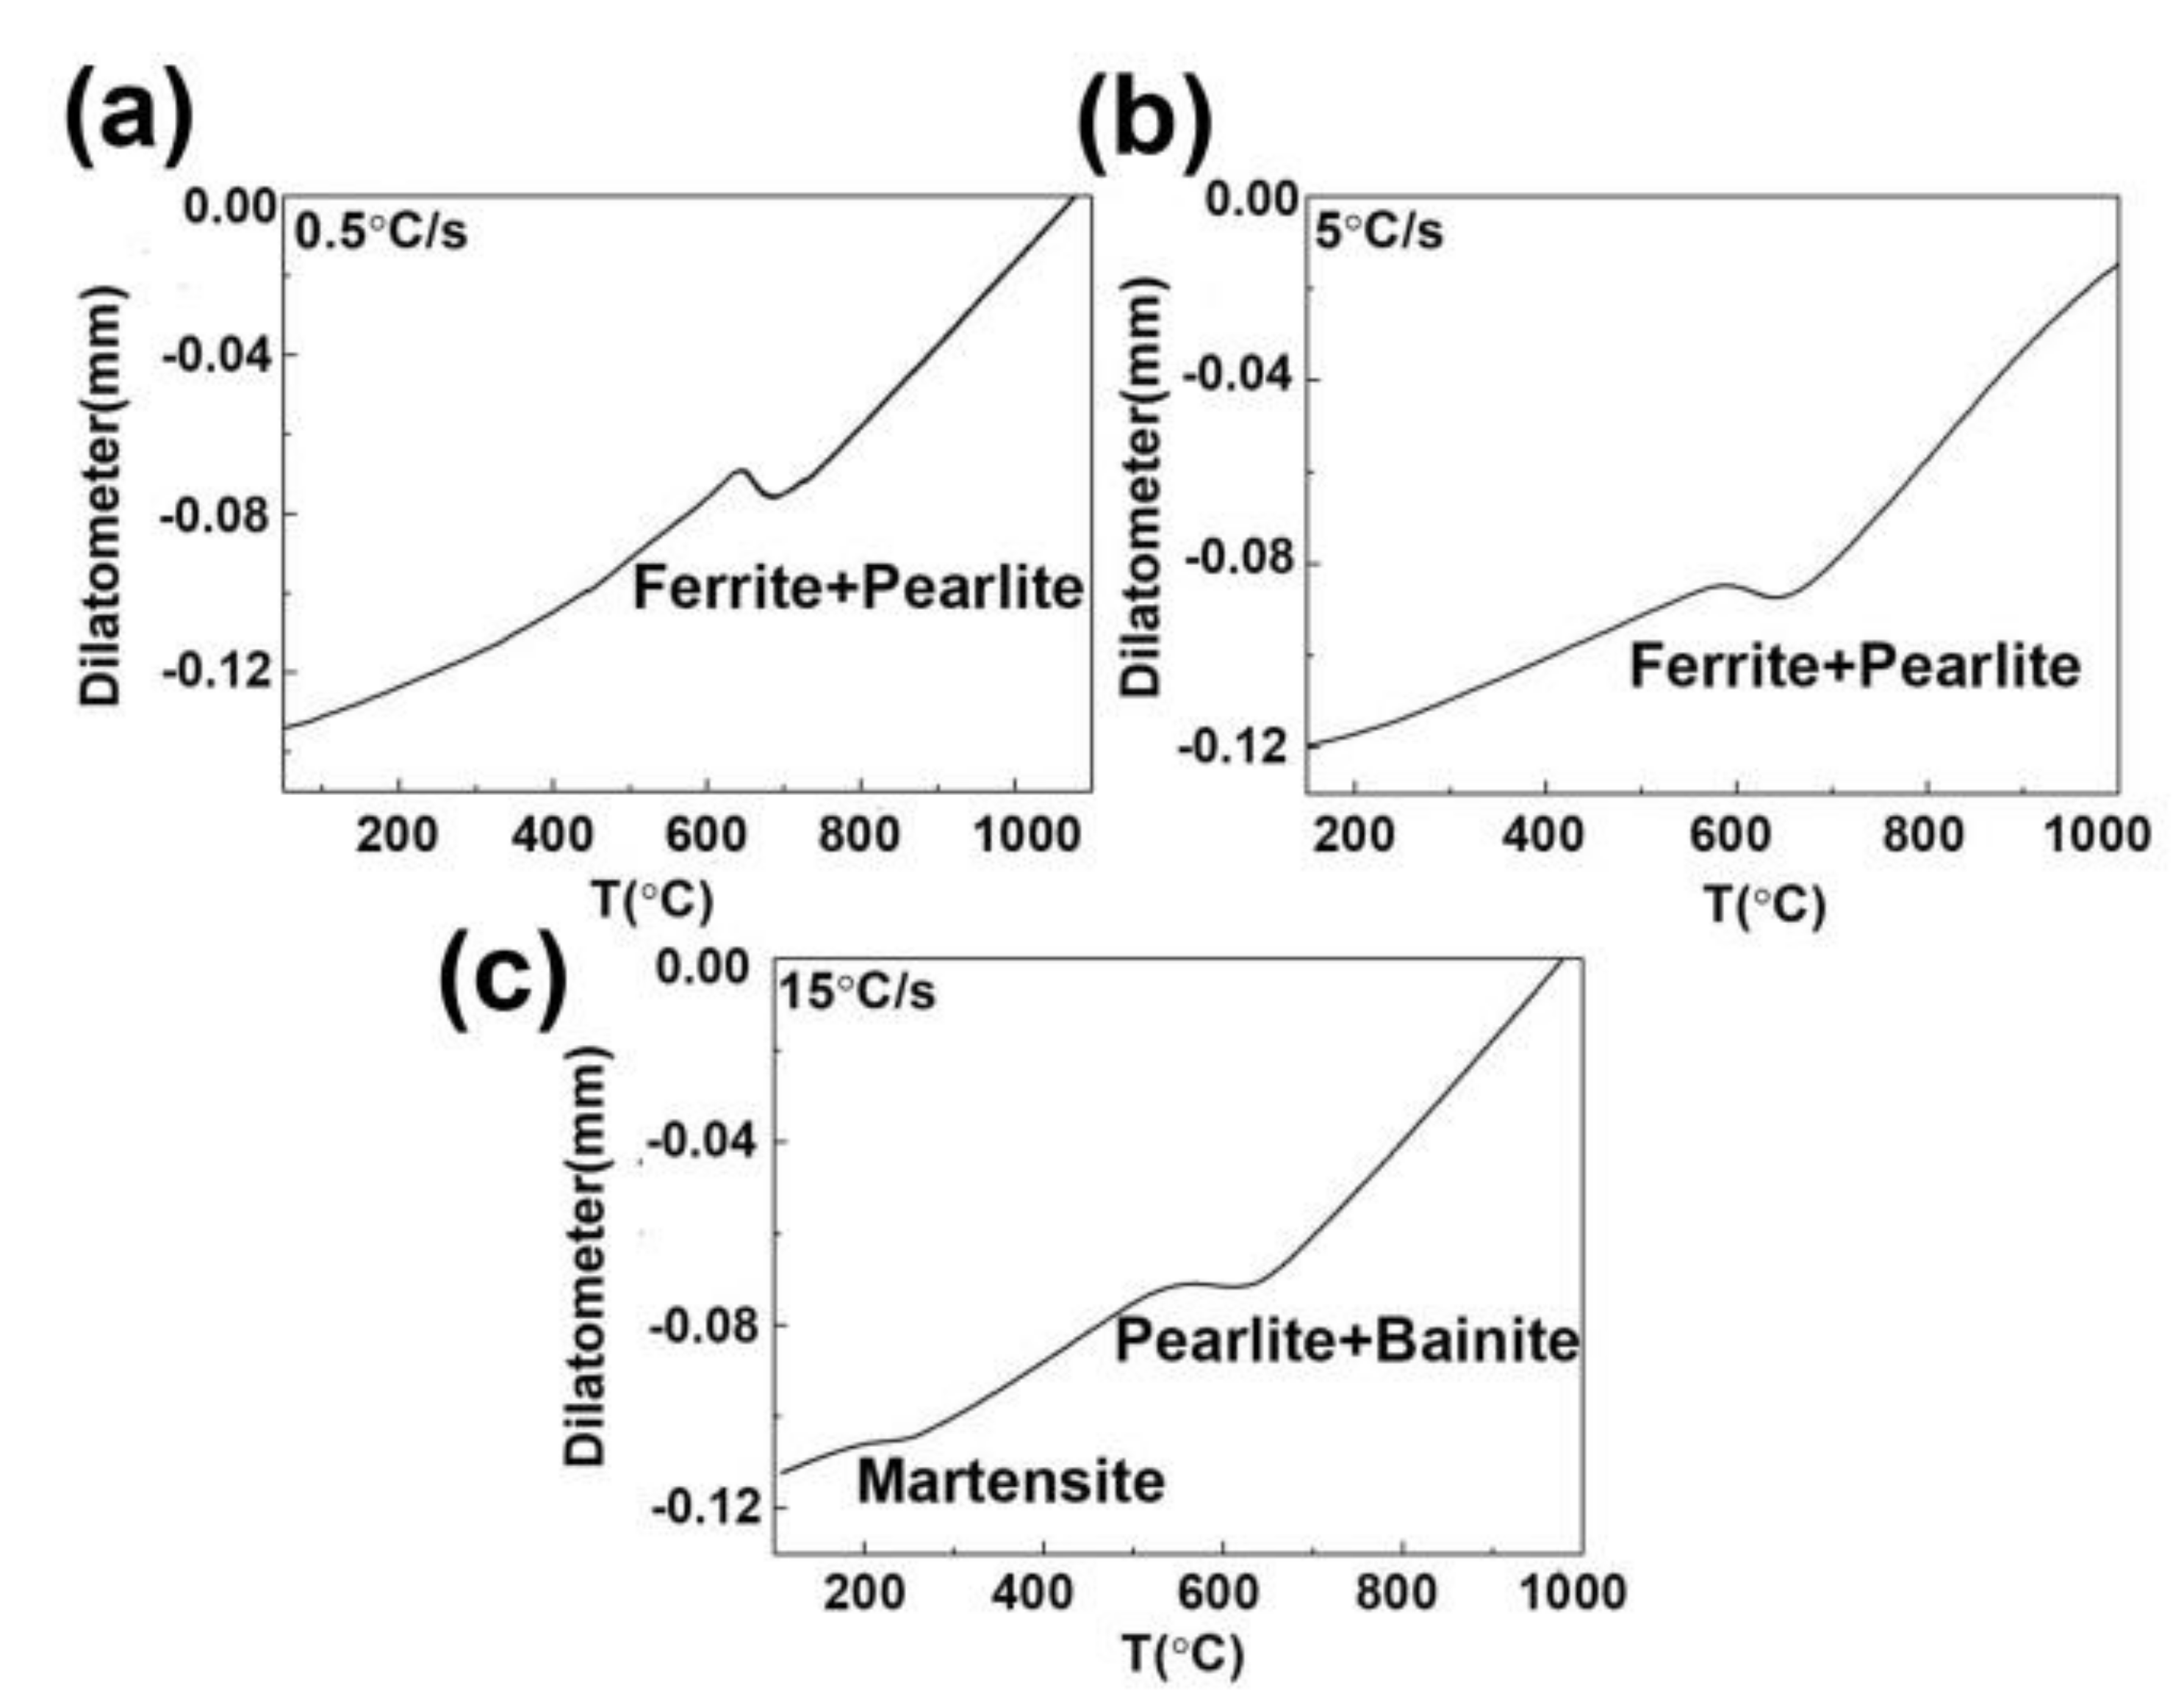
The austenization temperature, including Ac1 and Ac3, and the start temperature of the martensite transformation, Ms, of the Fe-2.5Cu-C alloy were identified according to the dilatometric curves. The specimen was slowly heated up and then quenched, as shown in Figure 2. According to the variation of the dilatometer, it can be found that the alloy began to transform to austenite at 720 °C and became fully austenite at 760 °C. During the quench process, martensite started to occur at 278 °C.
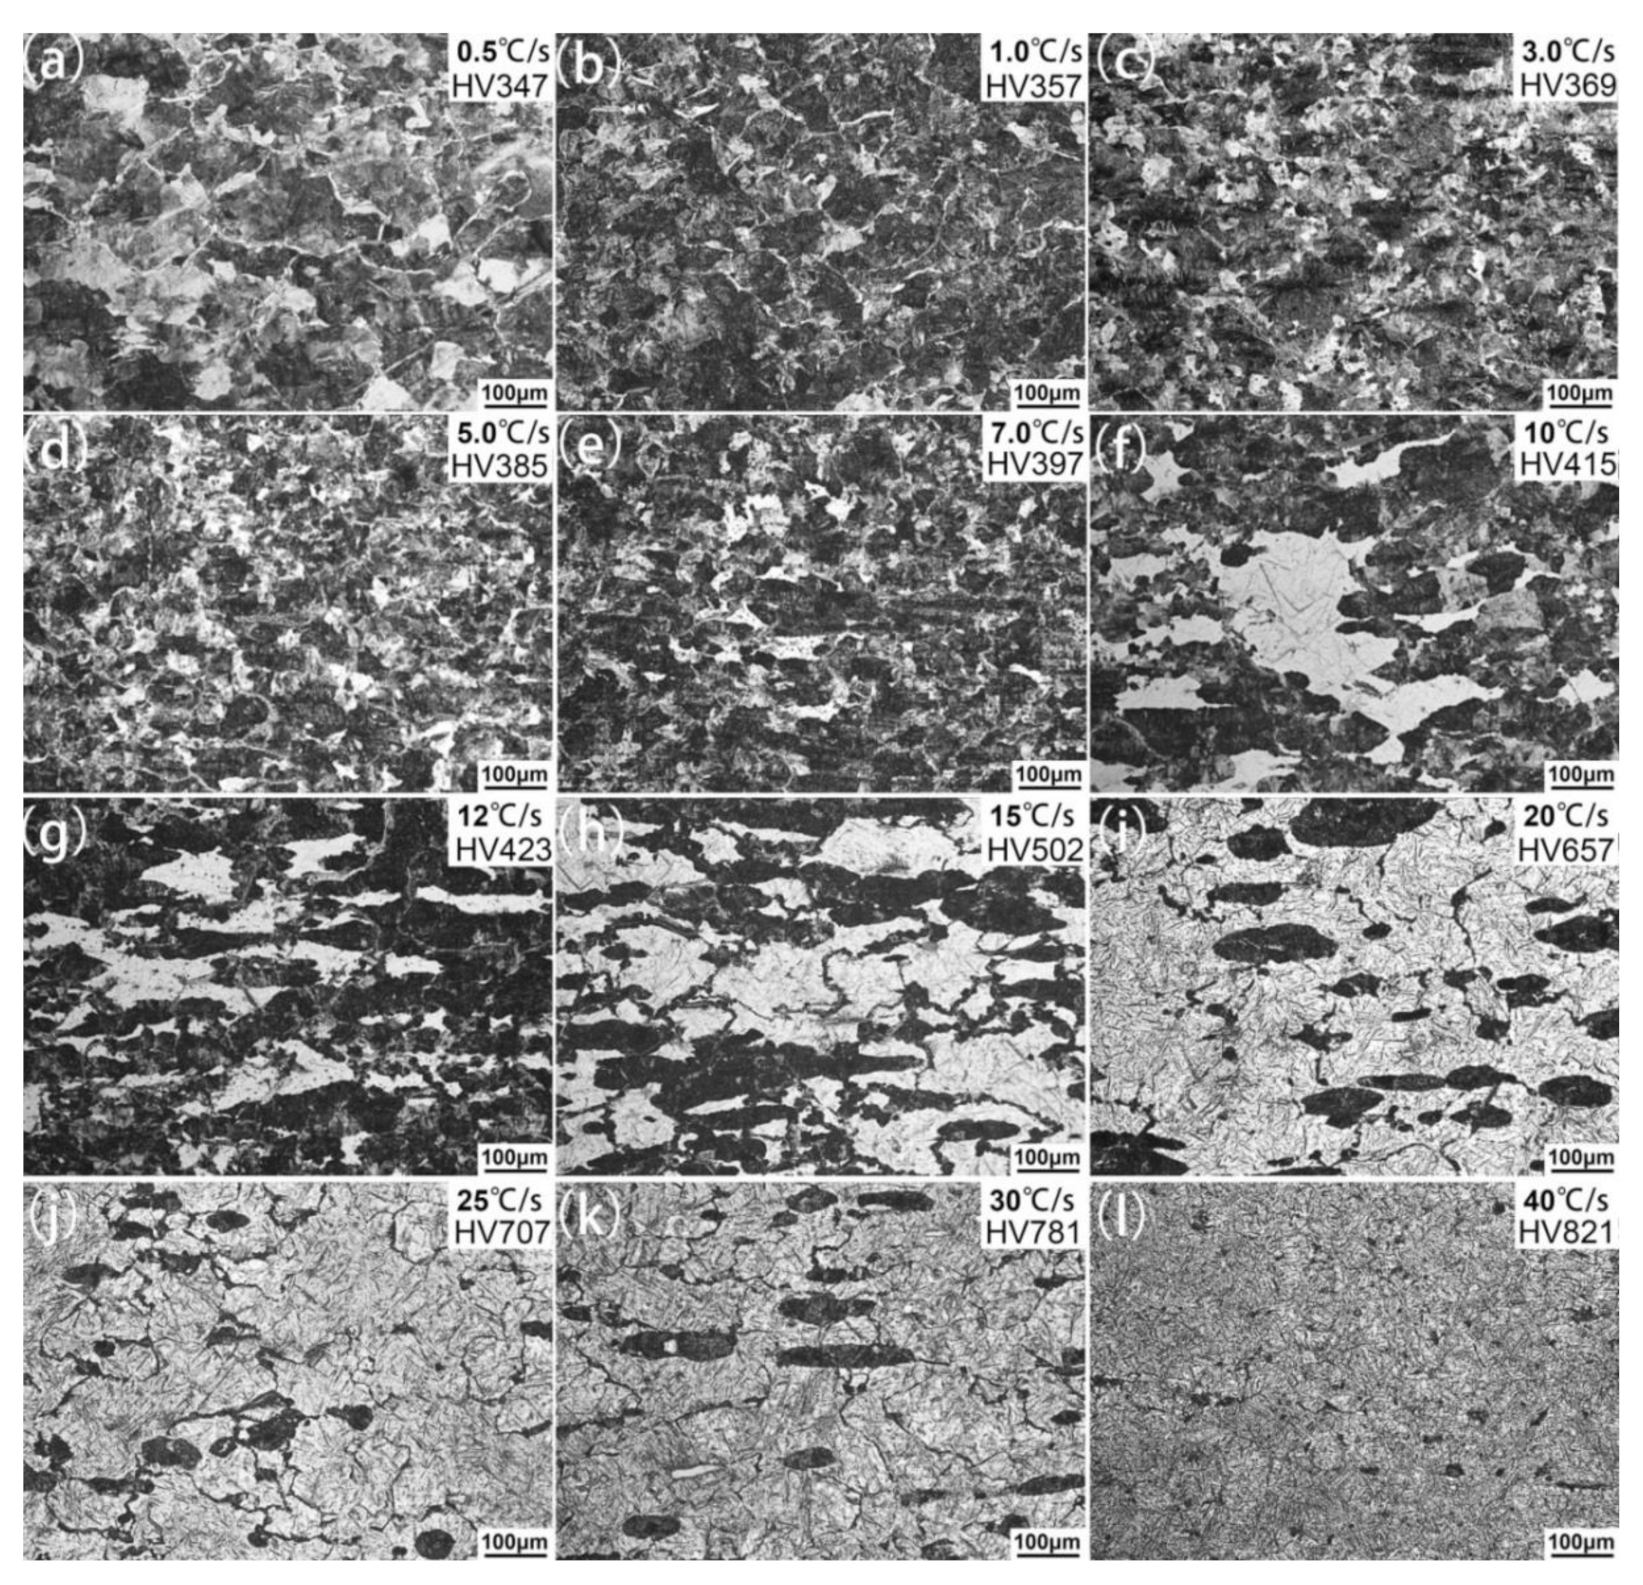
As shown in Figure 3, the hardness of specimens increased when cooled at higher rates because finer grains and a harder phase formed.
When the cooling rate was less than 7 °C/s, a mixed microstructure of proeutectoid ferrite and pearlite was obtained. The volume fraction of the proeutectoid ferrite decreased and the pearlite grain size became finer at higher cooling rates. When the cooling rate was higher than 10 °C/s, bainite and martensite gradually formed and the hardness increased to over than HV400. Martensite formed and the hardness increased significantly to HV700 when the cooling rate was higher than 25 °C/s.
The dilatometric curves of specimens cooled at different rates are presented in Figure 4. Combined with the microstructure, the phase transformation temperature could be determined.
Based on the above results, the phases and their formation temperatures at different cooling rates were characterized. A CCT diagram of the powder-forged Fe-2.5Cu-C alloy was constructed, as shown in Figure 5.
The relationship among the cooling rates, phase formation, and hardness was labeled in the CCT diagram; therefore, for powder-forged connecting rods, it would be better if the cooling rate is controlled to be less than 7 °C/s in order to obtain pearlite structure.
3.2. Microstructures of the Specimens Cooled at Different Rates
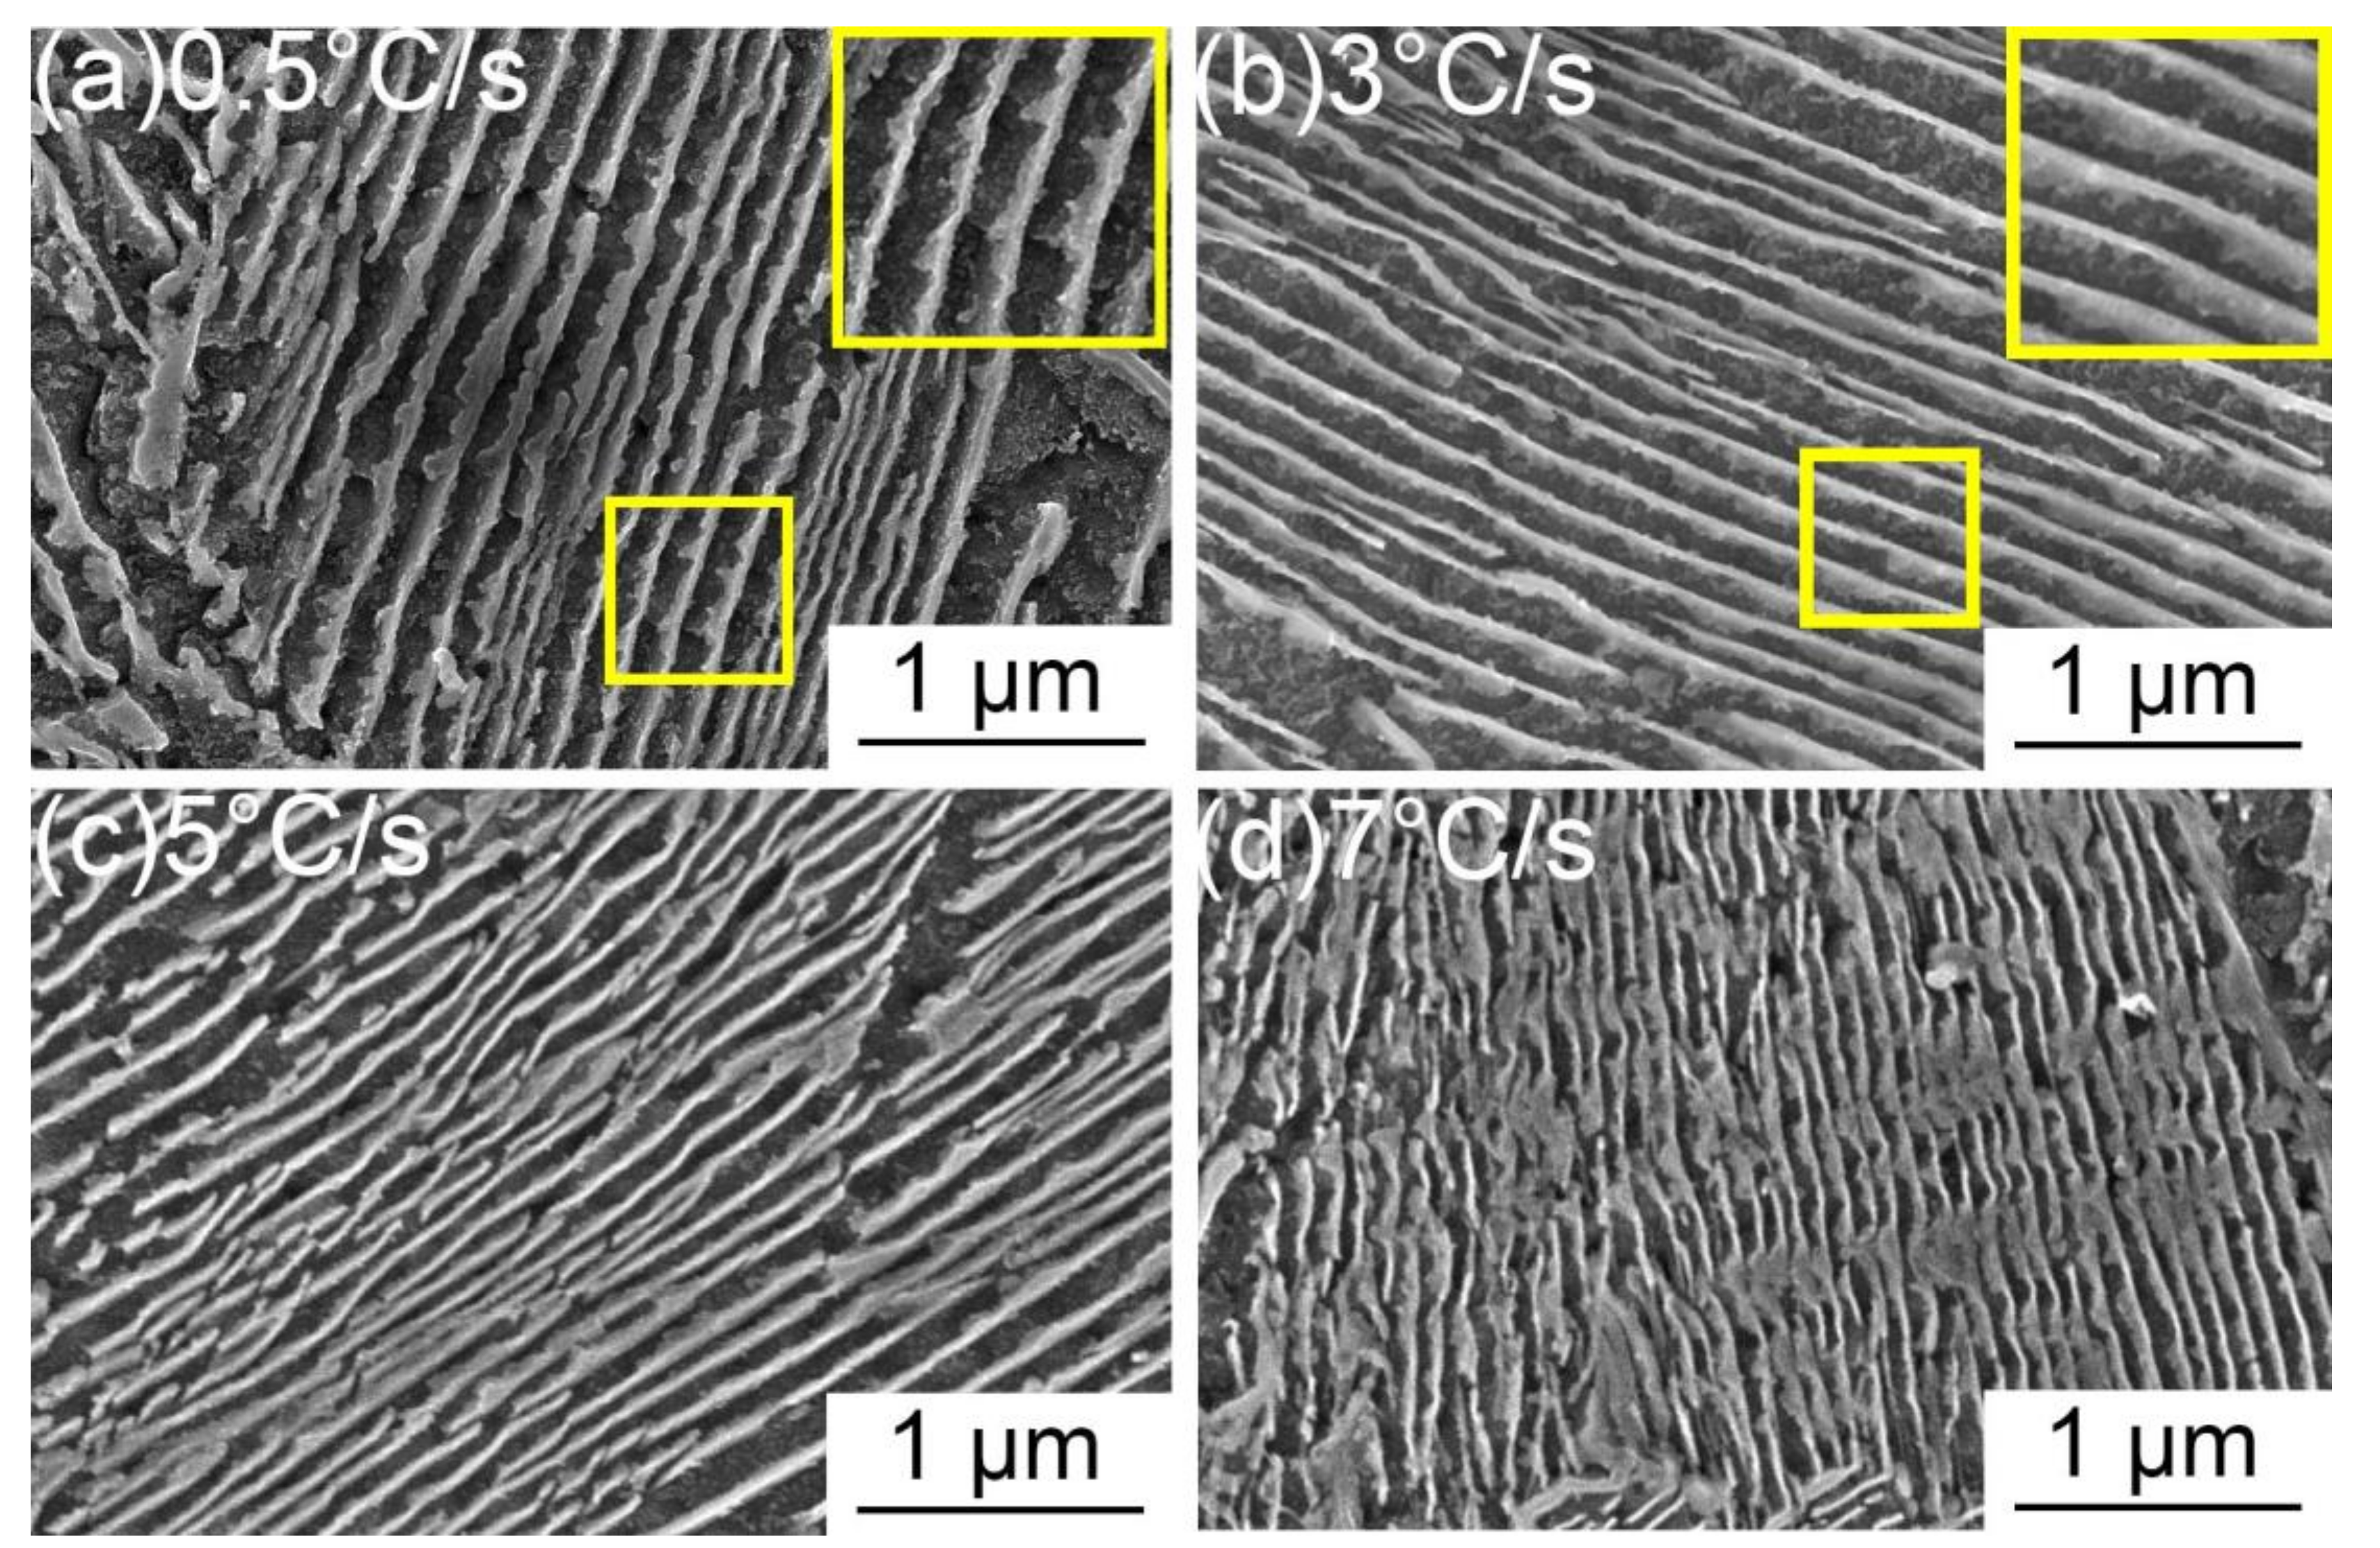
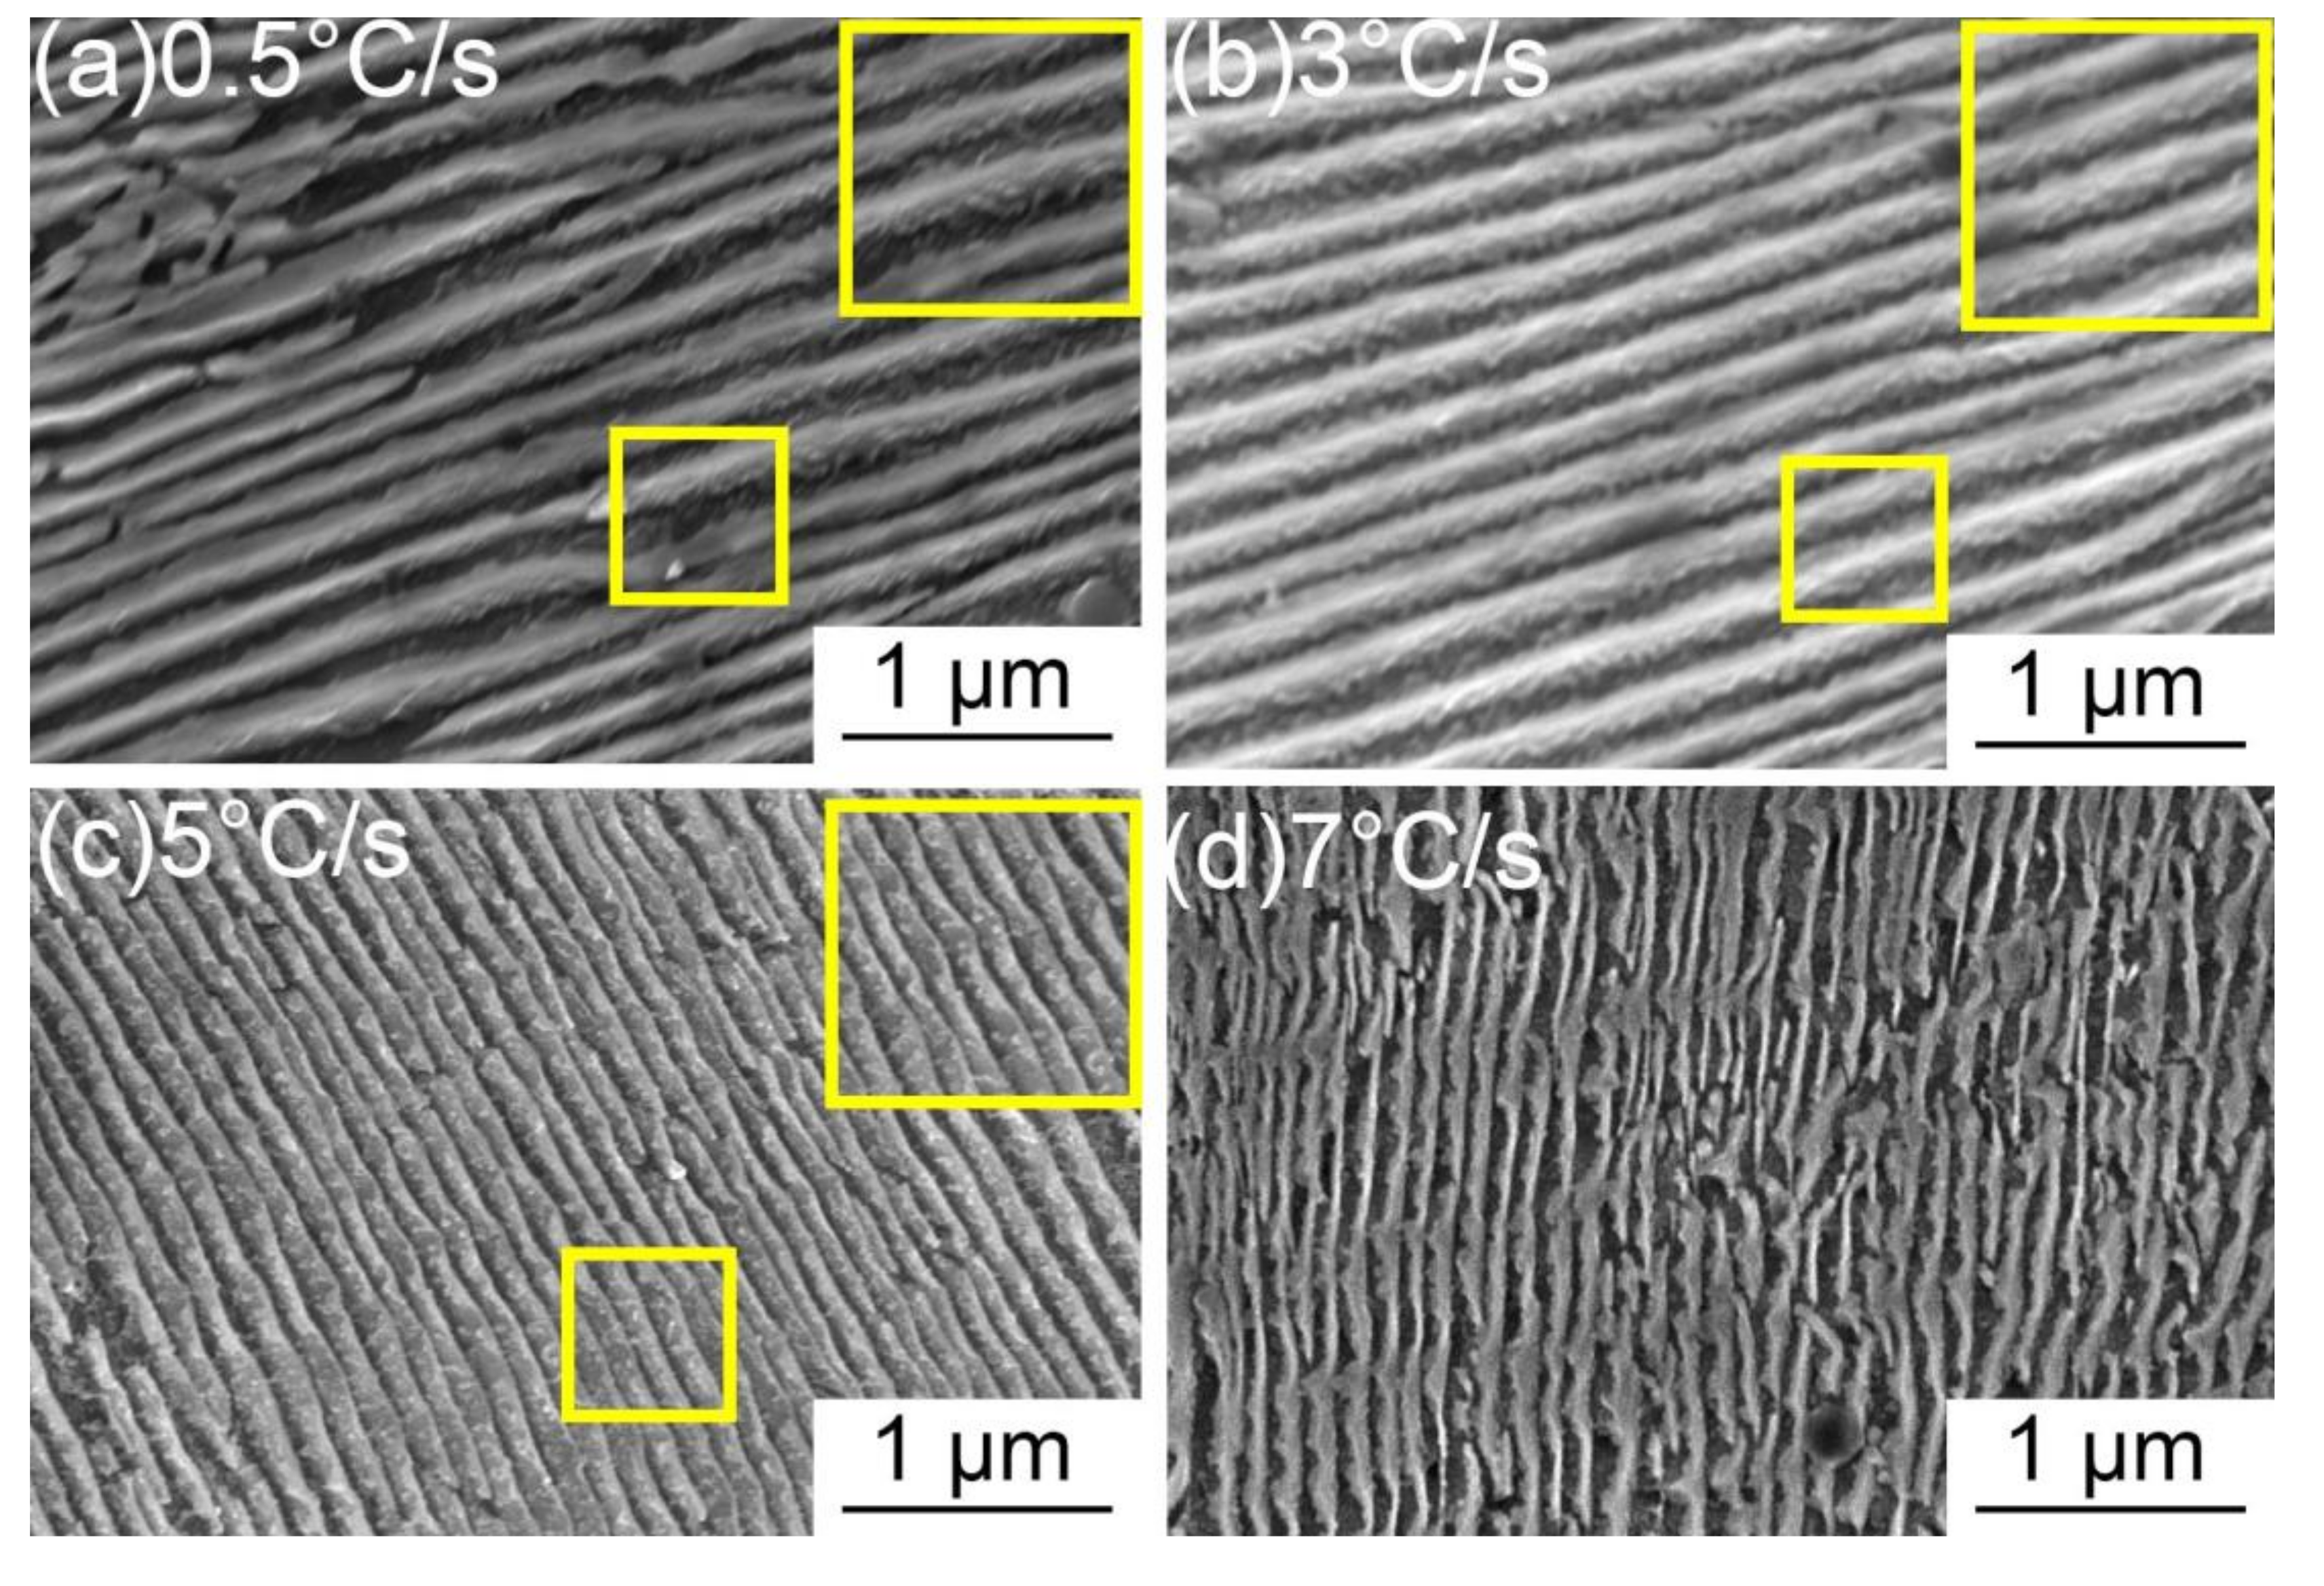
To distinguish the effect of the cooling rate on the microstructure and mechanical properties of specimens, specimens cooled from 0.5 °C/s to 7 °C/s were characterized by SEM and TEM. As presented in Figure 6, SEM pictures indicated that pearlite lamella space was finer when the specimen was cooled at a higher rate. In addition, copper precipitates observed in the specimens cooled at 0.5 °C/s to 3 °C/s. Based on the optical and SEM pictures of the specimens cooled at 0.5 °C/s, 3 °C/s, 5 °C/s, and 7 °C/s, the volume fraction of the ferrite, pearlite grain size (dp), and space lamella (Sp) was calculated using Photoshop as shown in Table 2.
Less proeutectoid ferrite and finer pearlite, including smaller nodules and narrower lamellar space, were observed when specimens were cooled at higher rates. On the one hand, higher cooling rates lead to shorter periods for atoms diffusion. On the other hand, copper atoms played a solute drag-like role and therefore inhibited the movement of the ferrite/cementite interface.
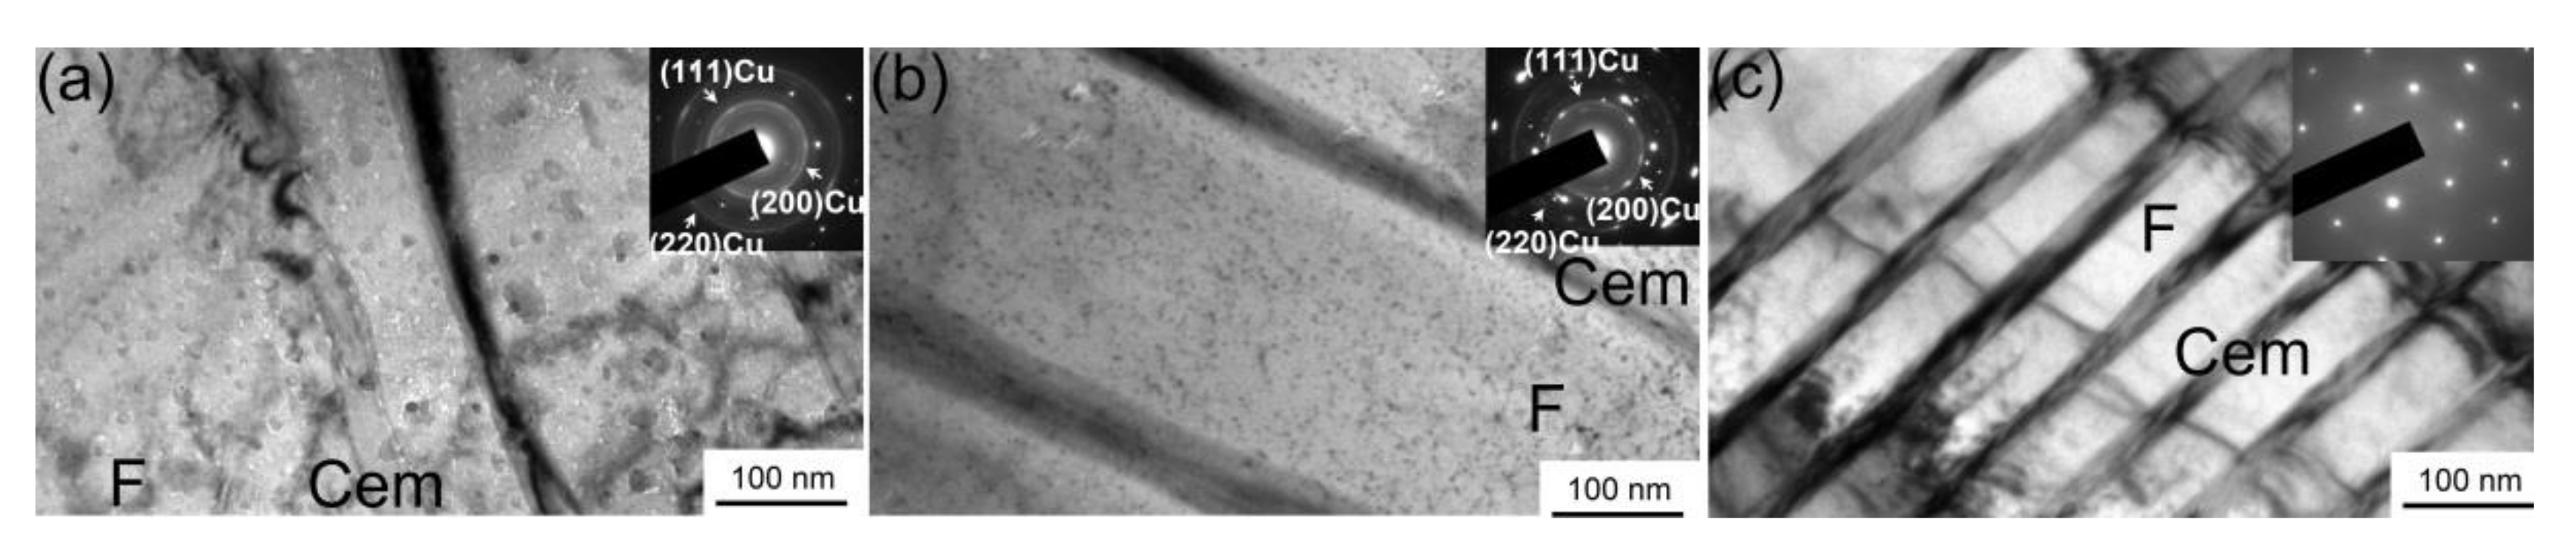
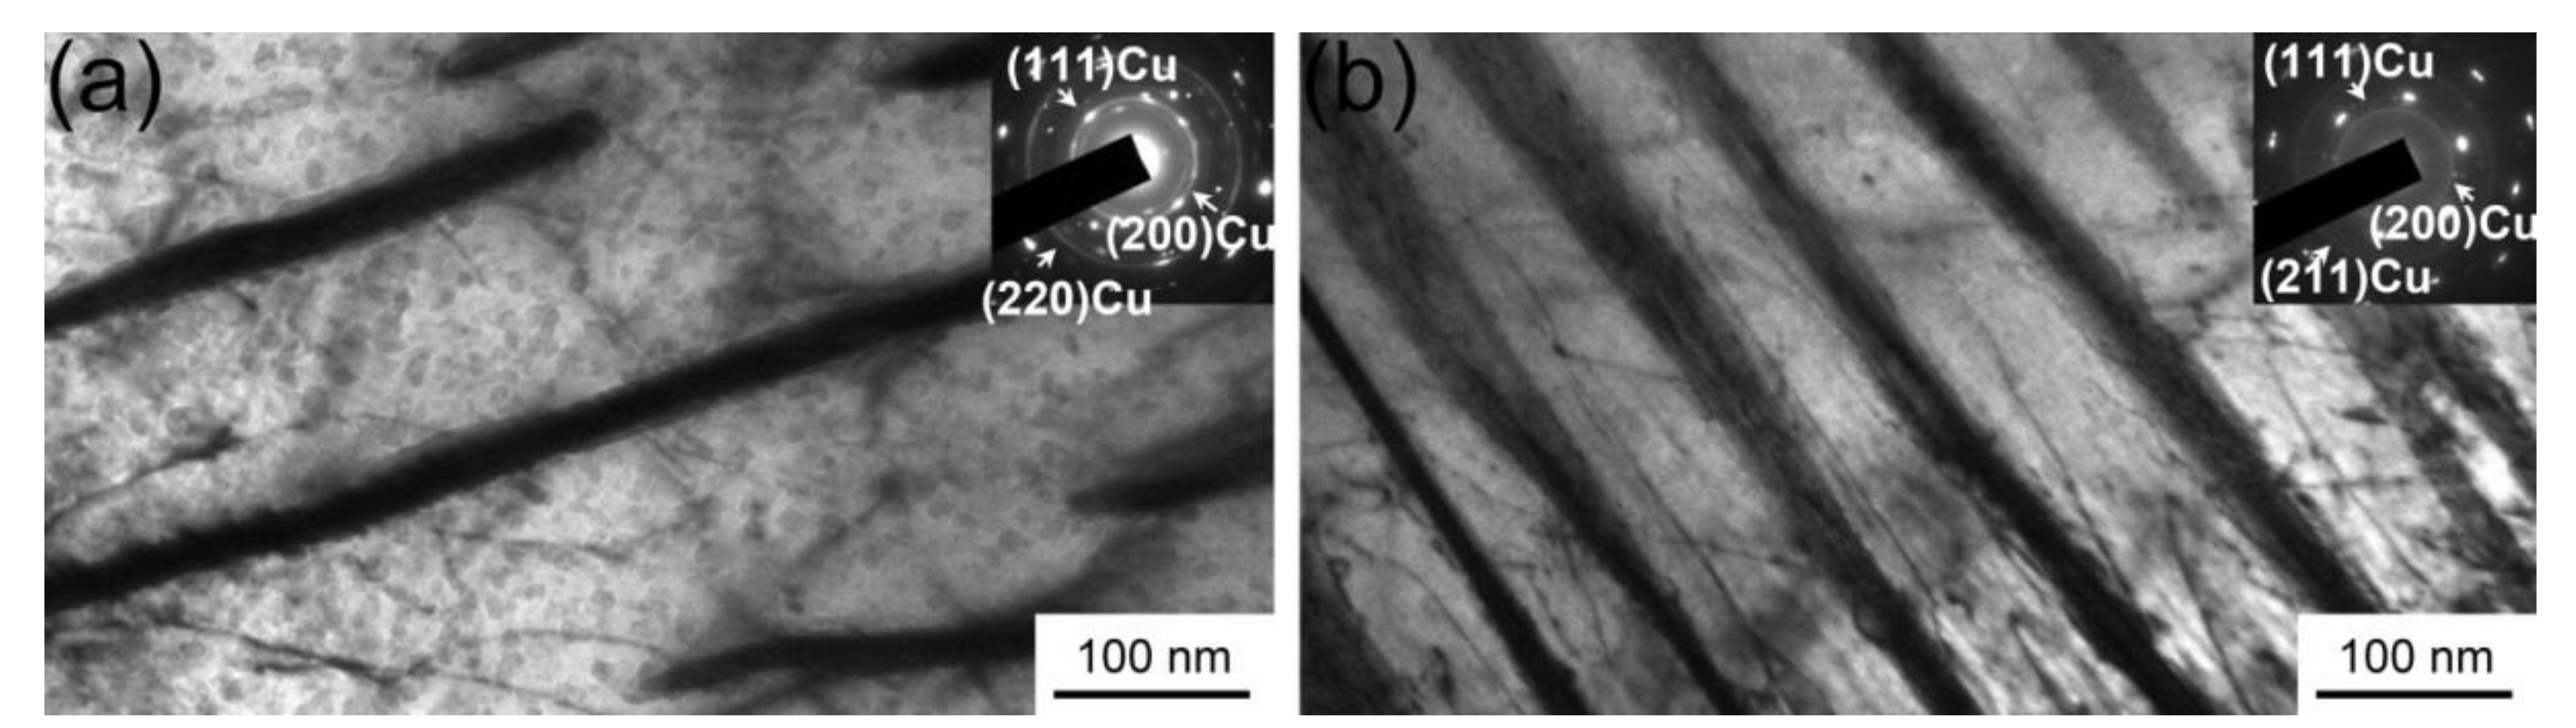
To characterize the details of copper precipitates, specimens cooled at 0.5 °C/s, 3 °C/s, and 7 °C/s were observed by TEM as presented in Figure 7. In the specimen cooled at 0.5 °C/s and 3 °C/s, copper precipitates were observed in the ferrite, cementite, and ferrite/cementite boundary. Diffraction patterns proved the precipitates were of FCC structure in both specimens. The size of precipitates was nonuniform in the specimen cooled at 0.5 °C/s. In ferrite, larger precipitates could be 15 nm while the smallest one was only a few nanometers. In cementite, precipitates along the ferrite/cementite interface were larger than those in the center spine. While in the specimen cooled at 3 °C/s, the size of the precipitates was almost the same and was smaller than those in the specimen cooled at 0.5 °C/s.
From the results, it can be concluded that the copper precipitates formed were consistent with the interphase mechanism when the cooling rate was less than 7 °C/s for the powder-forged Fe-2.5Cu-C alloy and the size of the precipitate was depended on the cooling rate.
3.3. Microstructures of the Specimens after Subsequent Aging
The strength of the copper precipitate was heavily related to its structure, size, and density. The copper precipitation behavior during different cooling rates was presented in the last section. To further investigate the copper precipitation behavior in the specimens cooled at different rates, the specimens were aged at 400 °C for 2 h.
As presented in Figure 8, SEM pictures proved that the pearlite structure, including grain size and lamella space, did not change after aging. Moreover, the density of copper precipitates in the specimens cooled at 0.5 °C/s and 3 °C/s was much higher than that before aging. New precipitates were also observed in the specimen cooled at 5 °C/s after aging.
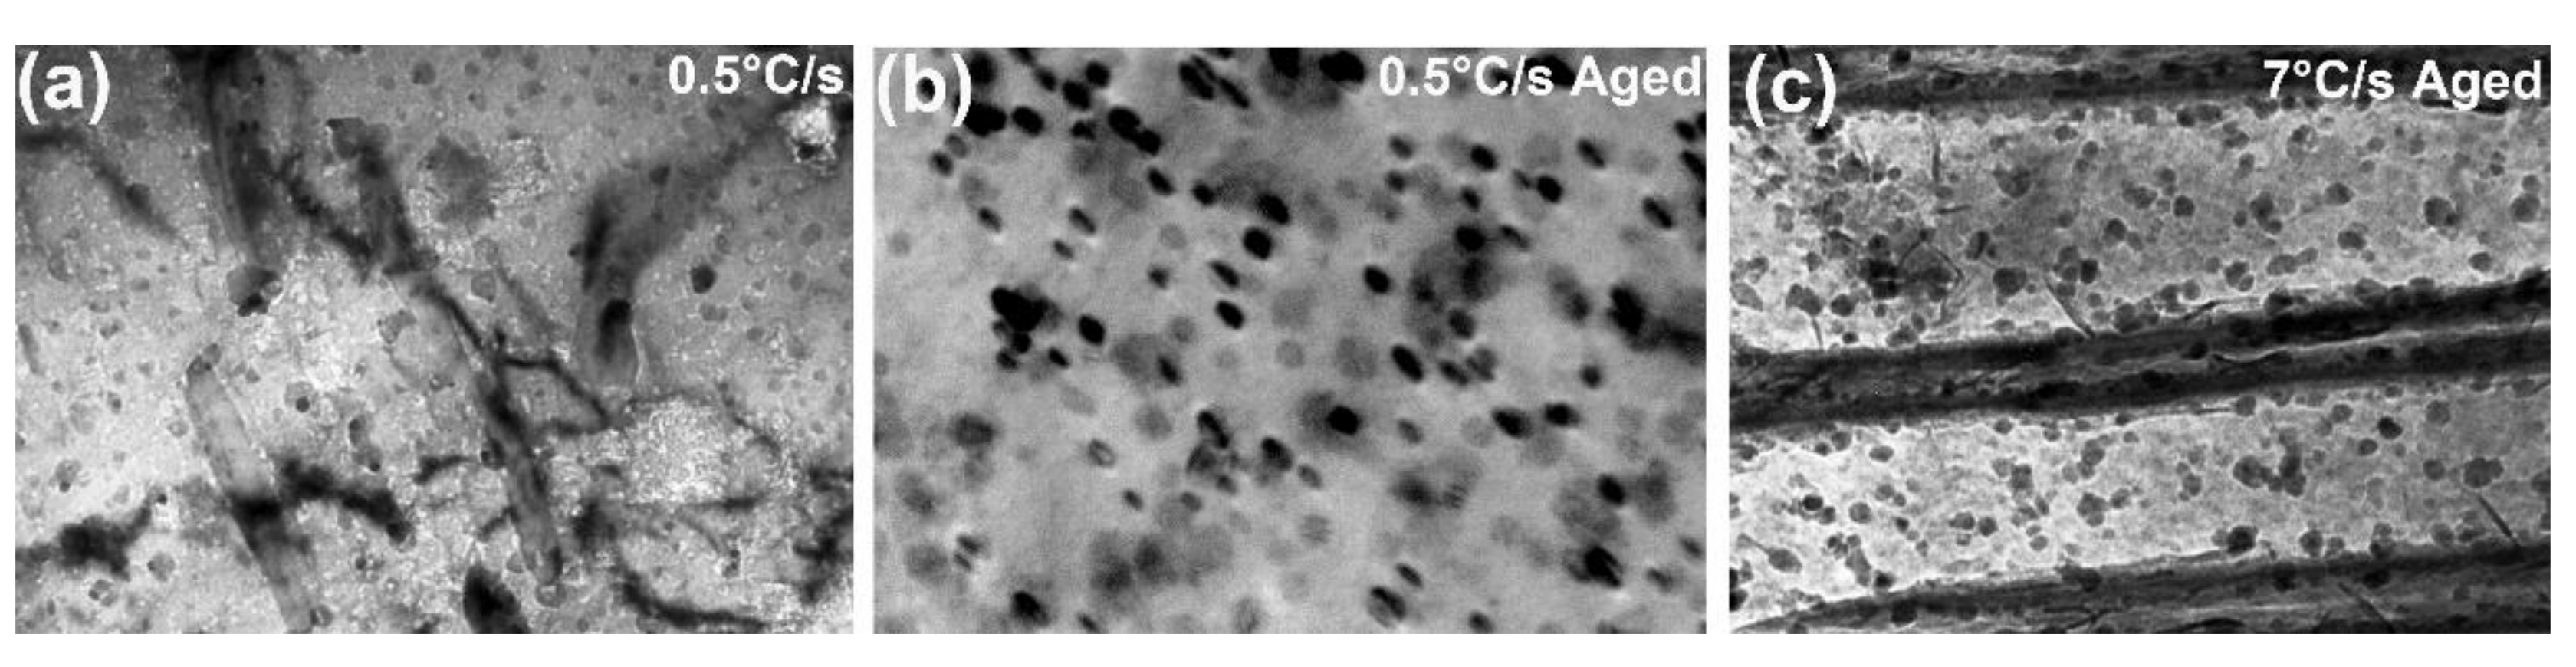
The specimens cooled at 0.5 °C/s and 7 °C/s after aging were characterized by TEM, as presented in Figure 9. The TEM picture clearly revealed the growth of the precipitates in the specimen cooled at 0.5 °C/s and new precipitates formed in the specimen cooled at 7 °C/s after aging.
In the specimen cooled at 0.5 °C/s, the growth of copper precipitates in ferrite was more intensive than those in cementite. It should be noted that precipitates located in dislocations were observed after aging. The size of the precipitates in the dislocation was smaller than those distributed in ferrite. In the specimen cooled at 7 °C/s, precipitates, approximately 3 nm, were much smaller than in the other specimens. The diffraction pattern showed that the precipitates were of BCC structure. Both the structure and size proved that it was in the initial aging stage which was different for the precipitates in the other specimens. The precipitates were distributed in ferrite, cementite, and their boundaries. In addition, similar with the other aging specimen, precipitates located in dislocations were observed after aging.
The size and volume fraction of copper precipitates in the continuously cooled and aged specimens are presented in Figure 10 for calculation. For each specimen, the diameter was measured from at least 200 precipitates, and the volume fraction of the precipitate was calculated from at least 20 pictures. The average size and volume fraction of the copper precipitates in the specimens cooled at 0.5 °C/s and 7 °C/s before and after aging are listed in Table 3.
From the results, it can be found that the pearlite structure did not change much after aging. The copper precipitates grew from 12 nm to 21 nm and the volume fraction increased from 1.2% to 2.15% after aging in the specimen cooled at 0.5 °C/s. In the specimen cooled at 7 °C/s, the average size of the precipitate was 10 nm and its volume fraction was 1%.
3.4. Hardness of the Specimens during Continuous Cooling and Subsequent Aging
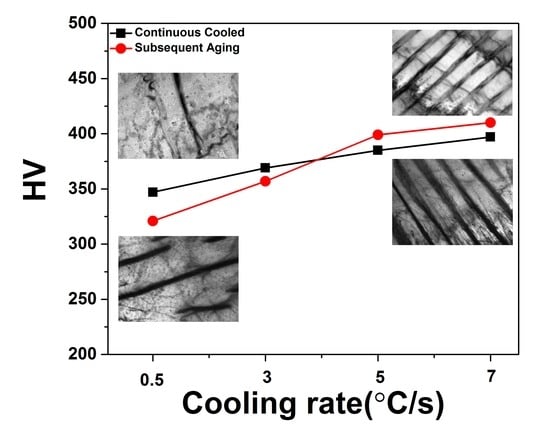
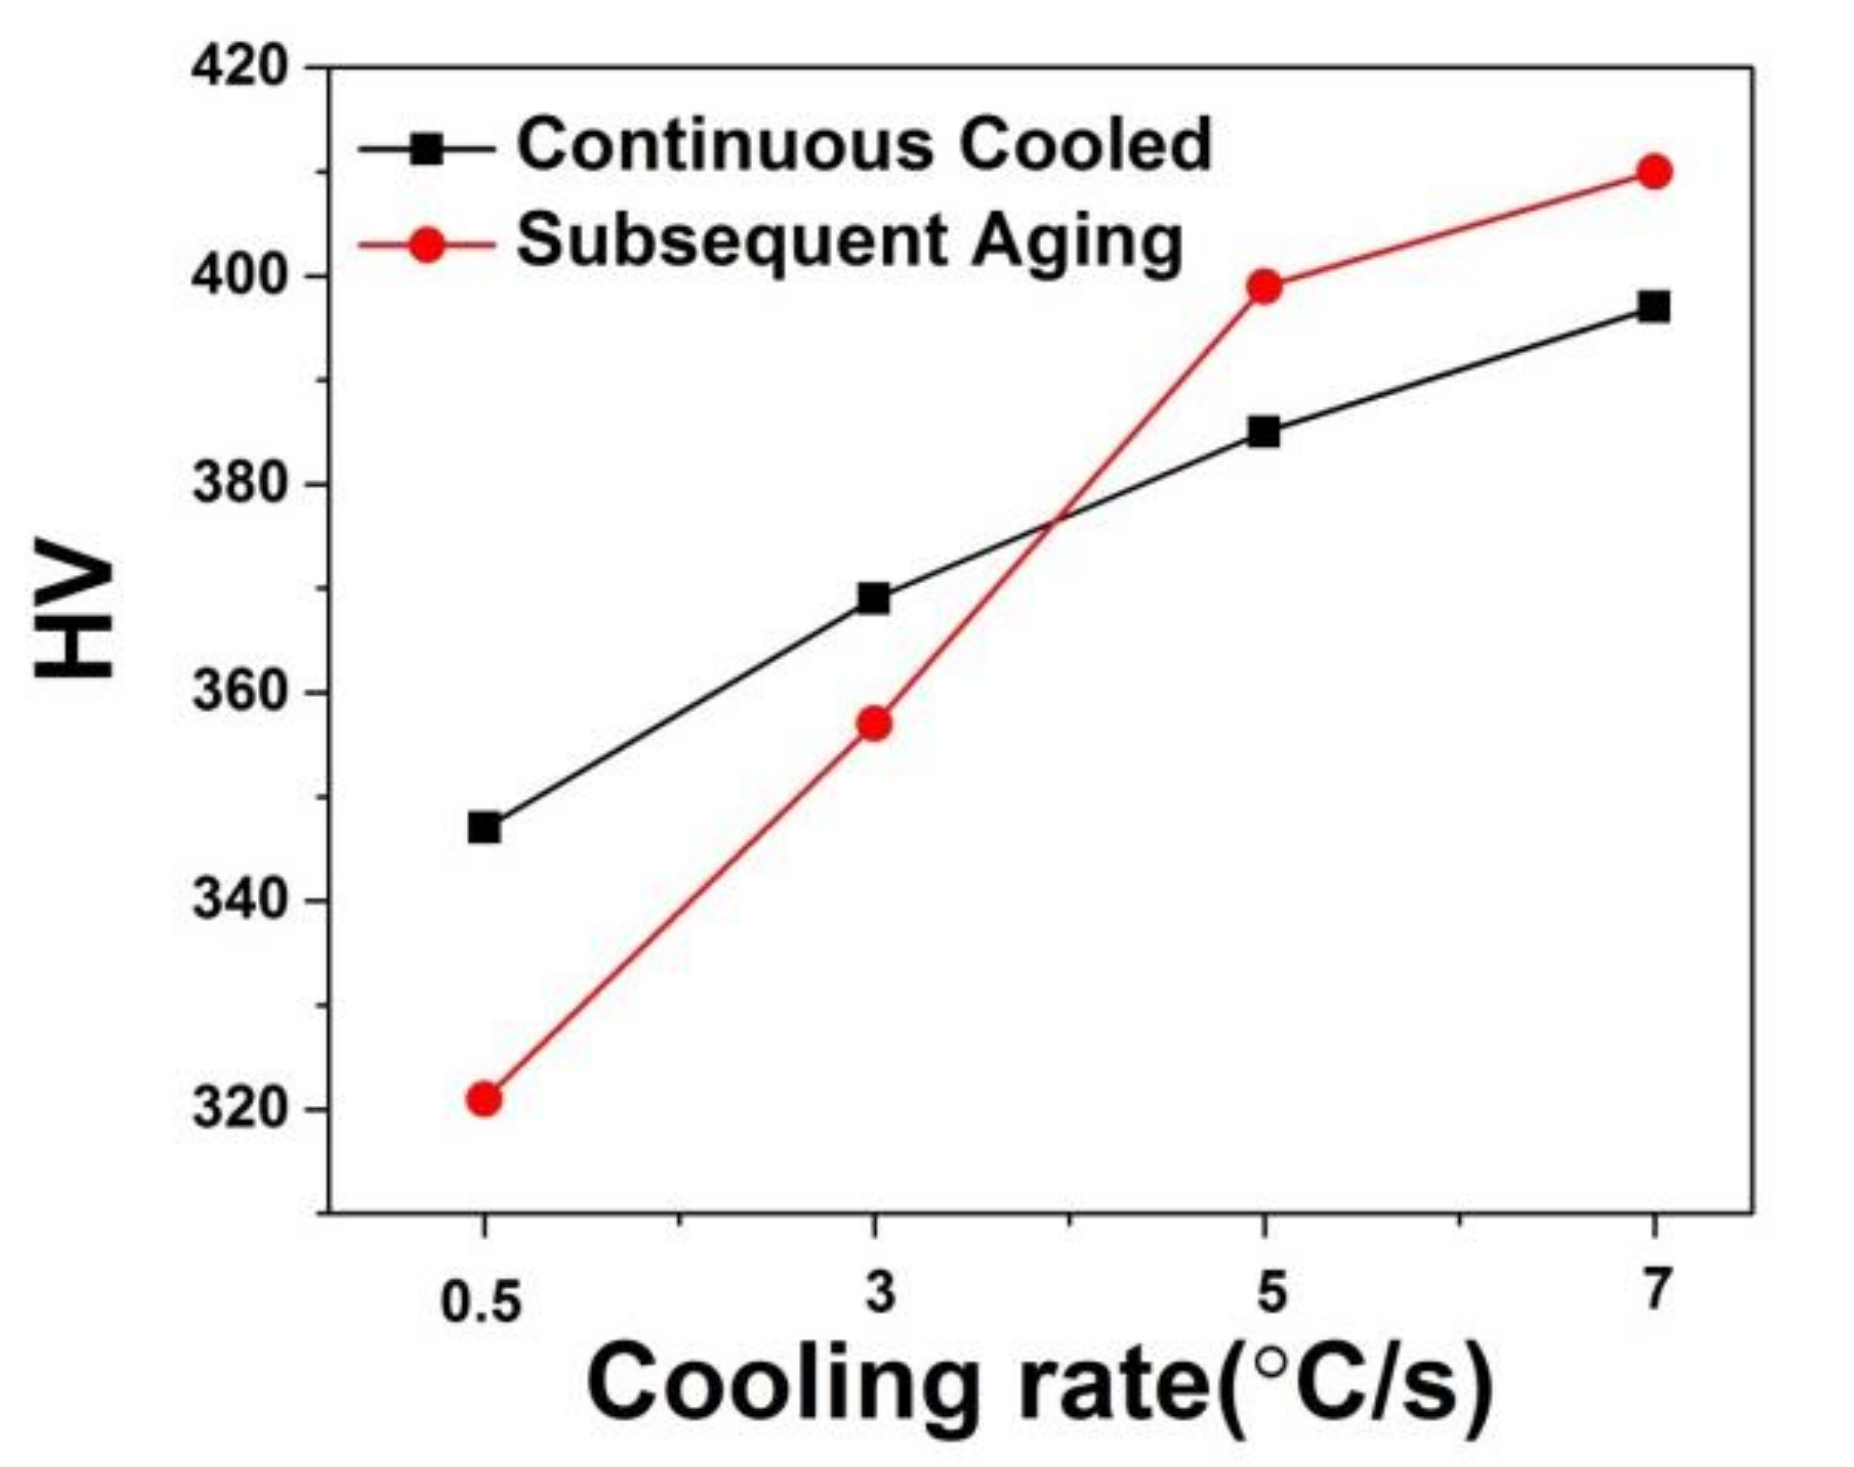
The hardness of specimens after continuous cooling and subsequent aging is presented in Figure 11. After aging, the hardness of the specimens cooled at 0.5 °C/s and 3 °C/s decreased while it increased in the specimens cooled at 5 °C/s and 7 °C/s. Because the pearlite structure, including grain size and lamella space, did not change, the variation of the hardness was attributed to the evolution of the copper precipitates. The coarsening of the copper precipitates would decrease the hardness while the newly formed precipitates would increase the hardness of the specimens.
4. Discussion
4.1. Evolution of Copper Precipitates during Different Cooling Rates and Subsequent Aging
As presented in the Results section, for powder-forged Fe-2.5Cu-C products, copper formed were consistent with the interphase mechanism when cooled to less than 7 °C/s. This phenomenon was also referred to as autoaging by Thompson and Krauss [7,8,9]. The amount of copper in solid solution in iron was over 4% when the temperature was higher than 1000 °C but it decreased sharply to nearly zero at room temperature [2]. Therefore, during the cooling process, when the concentration of copper atoms was higher than the critical concentration, copper nuclei would form and gradually grow. This cooling rate was referred to as a critical rate for the interphase mechanism precipitation which was related to the copper content and other elements [8,9,12,13,23]. Alloys with higher copper content were easier to form copper precipitates during the cooling process even at higher rates. In addition, a certain element, such as nickel, could reduce the copper nucleation energy and promote its precipitation. For example, an A710 [8] steel and a high-strength low-alloy steel [12], athough they contained only 1.5 wt.% copper, precipitates could form when cooled at 10 °C/s because they contained 1 wt.% Ni. Therefore, even though the copper content was lower in those alloys than in the Fe-2.5Cu-C alloy, copper precipitates could form at higher cooling rates.
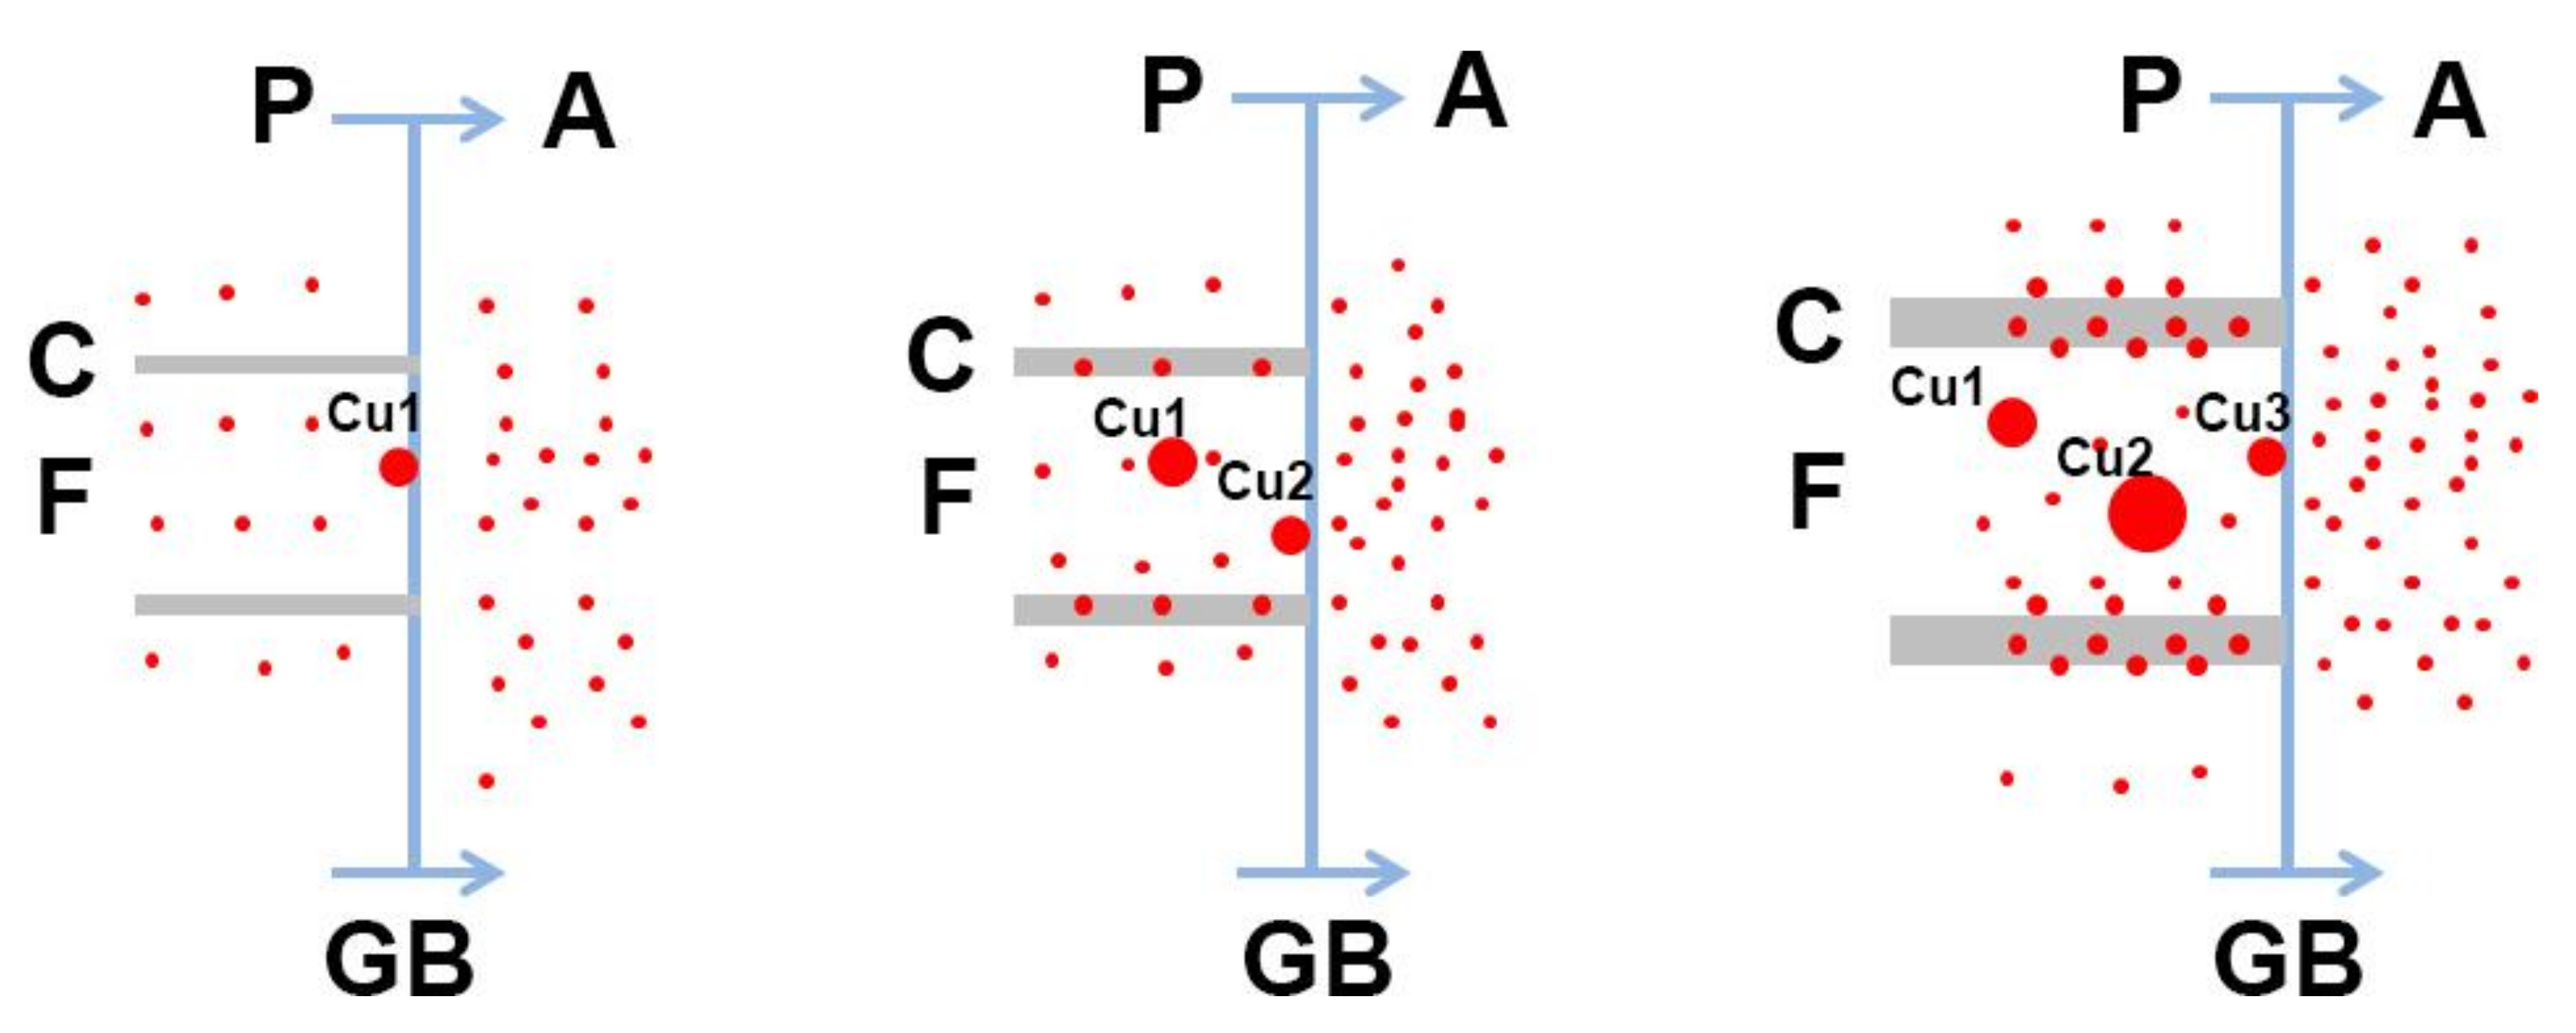
The phase transformation and copper precipitation sequence in the Fe-2.5Cu-C alloy was discussed as following. At high temperature when the cooling process just began, the austenite decomposed and transferred to ferrite [7,13,23,27]. With the movement of the interface, at one moment, the localized copper concentration was higher than the critical concentration and precipitates nucleated through the interphase mechanism. This precipitate was referred to as Cu1 in Figure 11 [8,23]. As the ferrite/austenite boundary migrated, copper atoms were enriched in the untransformed austenite boundary and therefore the growth of those copper nuclei was constrained in the copper-depleted zone. With the further cooling process, temperature decreased and new precipitates formed which was referred to as Cu2 in Figure 12. For these precipitates, although the temperature decreased, the copper concentration around the untransformed austenite was higher which could provide more free atoms for the growth of the precipitates than those precipitates formed earlier. Therefore, as presented in Figure 12, the size of the precipitate Cu2 was larger than Cu1. Another type of the precipitate was nucleated at the immobile ferrite/austenite boundary after the transformation finished, also referred to as Cu3 in Figure 12. At this stage, low temperature suppressed the diffusion of copper atoms and therefore limited the growth of copper precipitates [23,35].
These three types of precipitates were observed in the specimen cooled at 0.5 °C/s. Precipitates in the ferrite had a different size: larger ones were in the copper-rich zone while the smaller ones were in the copper-depleted zone or nucleated in the immobile boundaries after the transformation was finished. While in the specimen cooled at 3 °C/s, precipitates distributed in the ferrite had similar size. This phenomenon indicated high nucleation rates and sluggish diffusion of copper precipitates when cooled at comparatively fast rates.
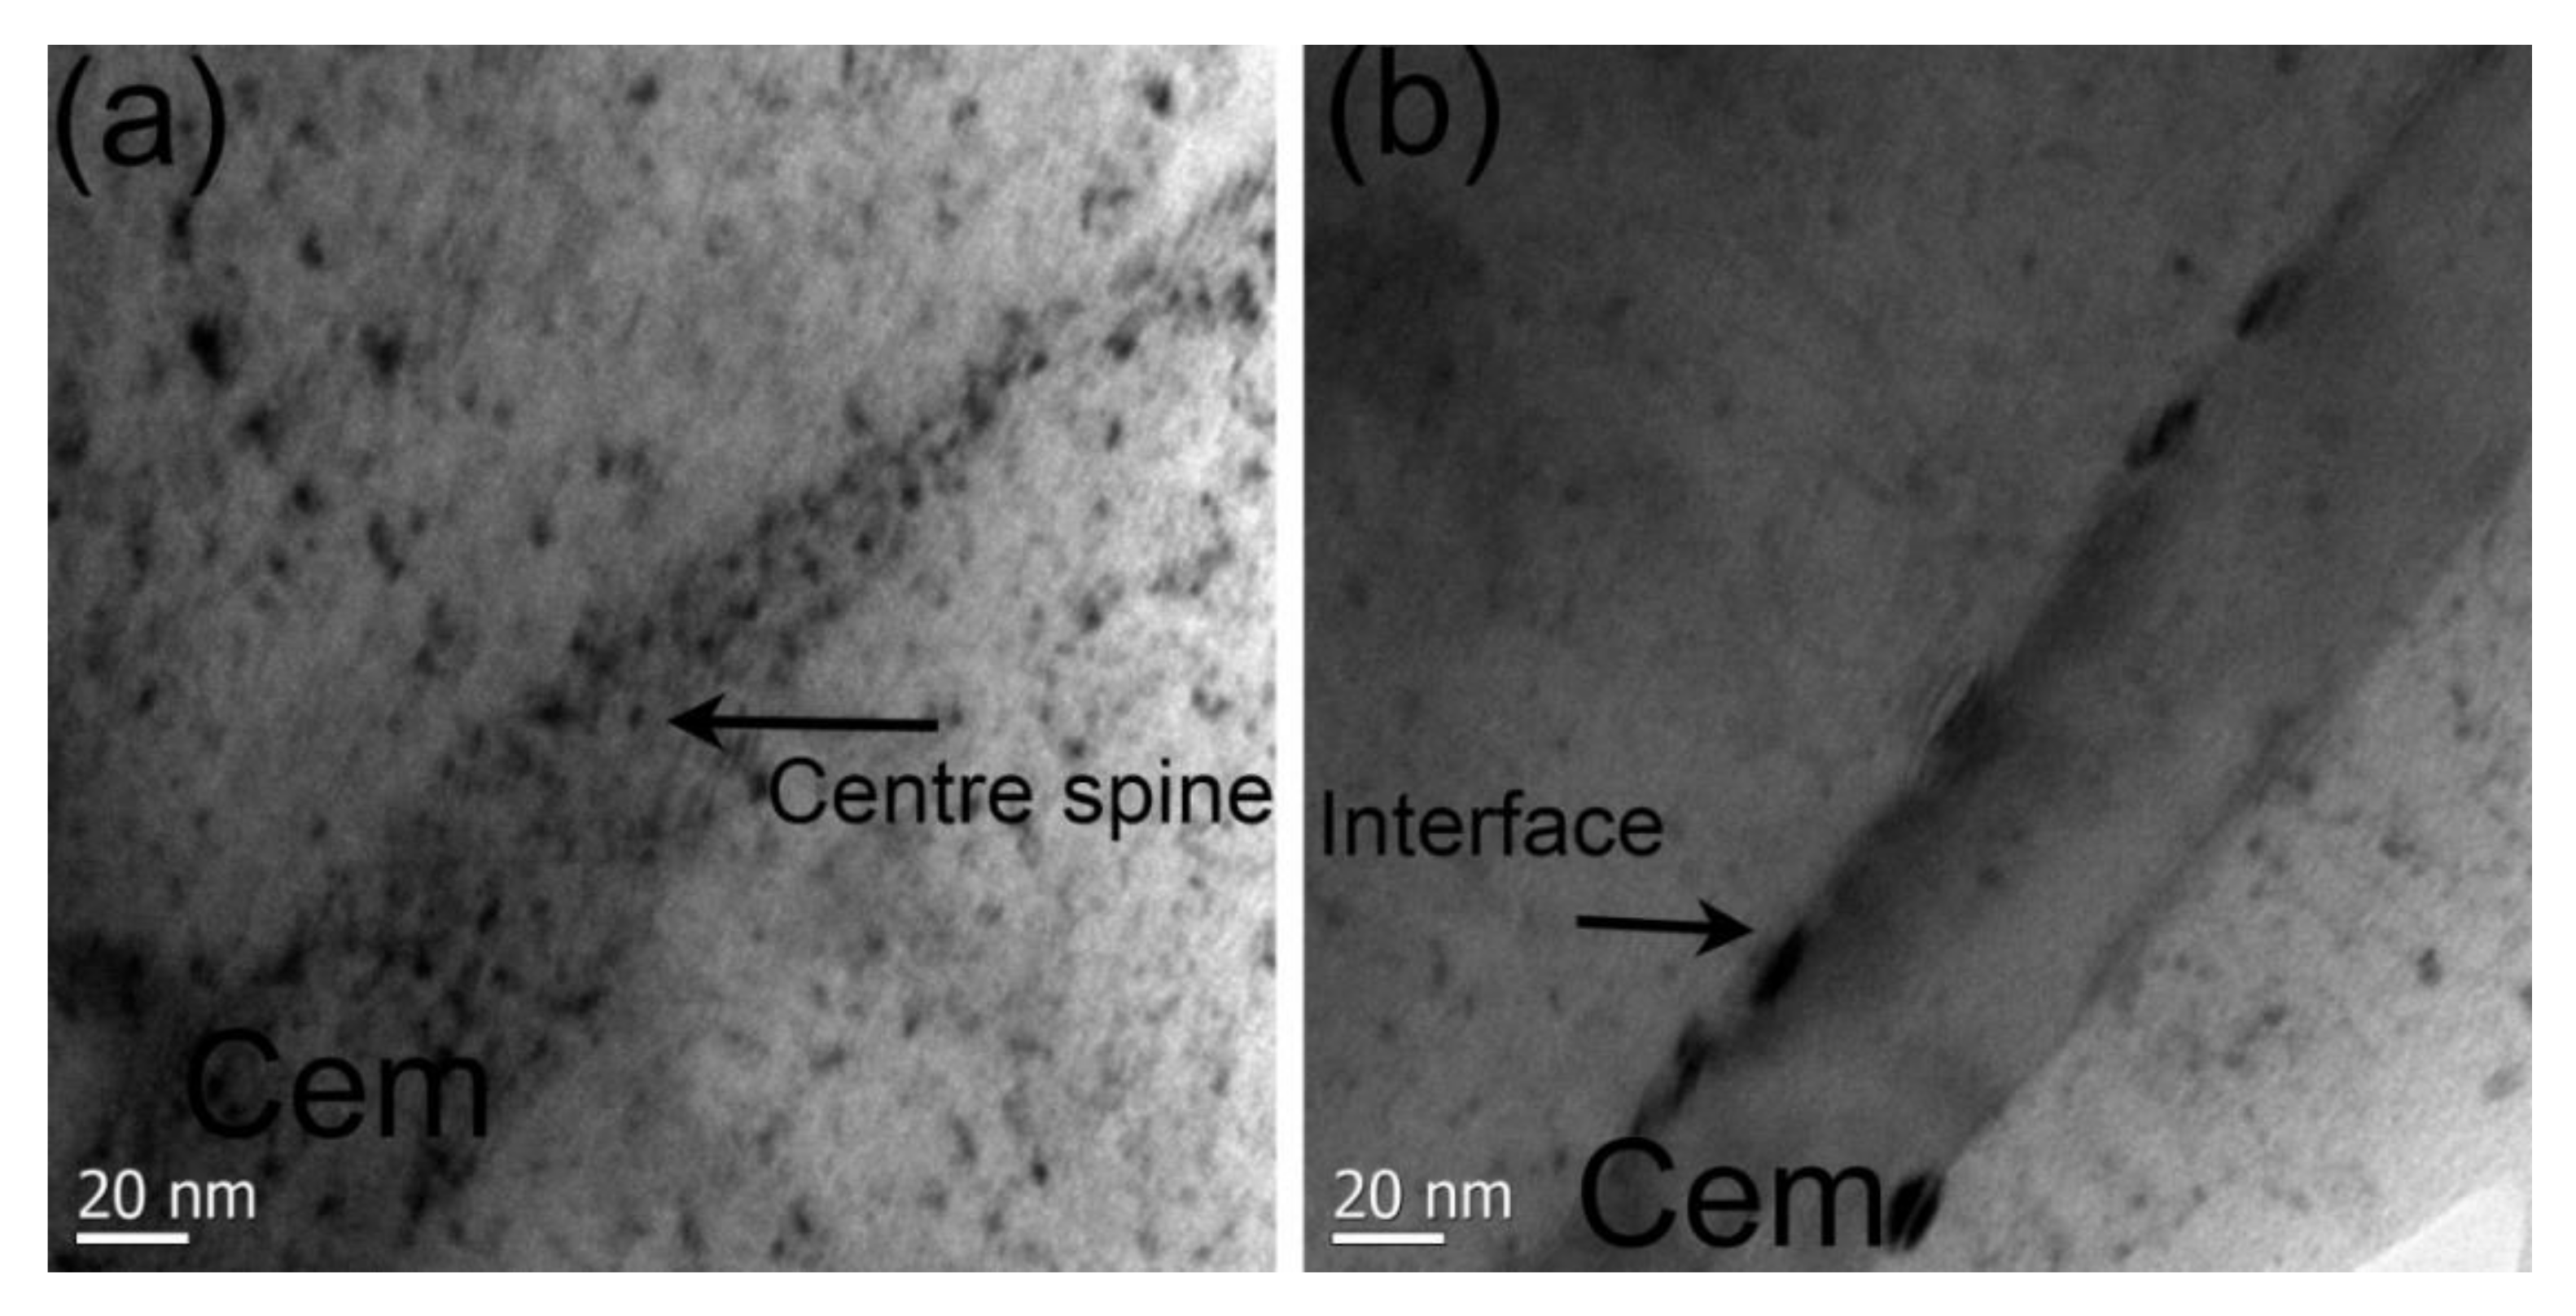
Except nucleation in the ferrite, copper precipitates were also nucleation in the cementite, including the center spine of the cementite and the boundary of the ferrite/cementite. During the phase transformation process, carbon atoms diffused a long distance to form cementite [16,18,36]. Because the solvability of copper in the cementite was much lower than that in the ferrite, the supersaturated copper was easier nucleated when it reached a critical concentration [23]. With the growth of the cementite, the copper nuclei was encapsulated in the center spine of the cementite. When the cementite finished its growth, copper precipitates could nuclei and grow in the ferrite/cementite boundary [16,18,36].
Copper precipitates formed in different locations of cementites in the specimen cooled at 0.5 °C/s are presented in Figure 13. As presented in Figure 13a, copper precipitates formed in the center spine were similar with those in the interface. While in Figure 13b, copper precipitates in the interface were much larger than those in the center spine. It was attributed to separate solubilities and diffusivities for copper in ferrite and cementite phases and the enhanced diffusivity expected at the ferrite/cementite interface [36].
To further increase the cooling rate to 7 °C/s, the austenite/ferrite interface moved too fast to allow precipitates nucleation. When the interface moved a distance faster than the critical nucleus size within the nucleation incubation time, no precipitates could nucleate. Therefore, copper precipitates were supersaturated in the matrix [23].
It should be noted that all of the precipitates observed were of FCC structure which was different from the precipitates formed during the aging process. The structure of the copper precipitates formed by the interphase mechanism was influenced by the rate of the boundaries migrating [12,23]. Because the BCC nuclei growth rate was comparatively high, BCC copper precipitates tend to grow before embedding into the matrix. Therefore, BCC copper precipitates were not detected in the continuous cooling specimens [8,9,12,13,23].
Different from the continuous cooling process, copper atoms could diffuse for a sufficient period during aging. The growth of precipitates mainly occurred in ferrite than cementite because copper atoms have higher diffusivity in ferrite than cementite [16,18,36]. After aging, the size of precipitates in the ferrite matrix was almost identical except some copper precipitates were located in dislocations. It should be noted that the copper precipitates formed during the continuous cooling showed no strong correlation with the dislocation even though the specimens were compressed [21]. This phenomenon proved that the interfaces were more favorable to copper nucleation because the interfaces were more effective than the dislocations at reducing the free energy for the precipitate nucleation during continuous cooling [7,12,18]. During the aging process, because the pearlite grains did not change, new precipitates tended to nucleate at the dislocation cores to release the strain energy [21]. The size of precipitates in the dislocation was smaller than those in the matrix and also proved that they were formed during the aging process. In the specimen cooled at 7 °C/s, BCC copper precipitates formed after aging. Similar with the copper precipitation behavior reported in literature, copper atoms gradually lost coherency from the matrix and formed a metastable BCC structure. The fine BCC copper precipitates were the major reason for the improvement of the strength as discussed below.
4.2. Contribution of the Copper Precipitates to the Strength of the Alloys
Many researchers have reported that BCC copper precipitates have a greater strengthening effect than FCC precipitates [22,28,29,37,38,39,40], which means the copper precipitates might already be overage during the continuous cooling period. This phenomenon is crucial for the industry in terms of guiding the heat treatment.
In the specimen cooled at a low rate, such as 0.5 °C/s, FCC copper precipitates formed by the interphase mechanism have already loose coherency from the matrix. The primary precipitates coarsened during the subsequent aging and led to a decrease of hardness.
In the specimen cooled at a high rate, such as 7 °C/s, no copper precipitates formed during the continuous cooling process, but fine precipitates occurred after the aging. The formation of BCC copper precipitates increased the hardness of the alloy. At this stage, the precipitates have the strongest strengthening effect. With further aging, precipitates would divorce from the matrix and finally transformed to a stable FCC structure. Because the FCC precipitate lost its coherence with the matrix and was bigger than the BCC precipitates, its strengthening effect was weaker.
Therefore, in the continuous cooled specimen, the coarsening of precipitates would decrease the hardness while newly formed precipitates would increase the hardness. When the cooling rate was about 4 °C/s, the subsequent aging process would not change the hardness of the specimen. It means in this specimen, the strengthening effect contributed by the newly formed precipitates reached a balance with the weakening effect contributed by the coarsening of the precipitates. From the results, it can be concluded that the precipitates formed during the continuous cooling process would deteriorate the strength of the alloy after aging. Aging will improve the strength of the alloy when it was cooled at higher than 4 °C/s.
Herein, the precipitation strengthening model provided by Russell and Brown was employed to quantify the contribution of copper precipitates to the strength of the specimens [6,39].
where G is a shear modulus of 83 GPa and b is a Burgers vector of iron at 0.248 nm. In addition, L is the obstacle space in the slip plane. When dislocations shear the copper precipitates, E1 is the amount of energy per unit length on one side whereas E2 is the amount on the other side [6]. According to Russell and Brown [40], the maximum strength occurs at a value of 0.6. The value of L was calculated according to the following equation:
where f is the volume fraction of the precipitates and r is their average radius.
The average diameter of the copper precipitates was 12 nm and the volume fraction was 1.2% in the specimen cooled at 0.5 °C/s. After aging, the average diameter of the copper precipitates increased to 21 nm and the volume fraction was 2.15%. For the specimen cooled at 7 °C/s, the average diameter of the copper precipitates was only 10 nm and the fraction was 1% after aging. Because the shear modulus and Burgers vector of the BCC copper was unclear, we assumed the BCC copper has the same data as FCC copper precipitates. According to the equations, the contribution of the copper precipitates to the strength decreased from 99 to 78 MPa after aging in the specimen cooled at 0.5 °C/s. However, for the specimen cooled at 7 °C/s, the contribution of the copper precipitation strengthening was 110 MPa after aging. Therefore, for a product cooled at slow rates, no aging process is necessary and would be detrimental to the strength of the alloy. To improve the mechanical properties of the Fe-2.5Cu-C alloy, it is suggested that the products be cooled at higher than 4 °C/s and subjected to aging. Considering efficacy, the specimens might be aged at higher temperature and shorter periods which could be investigated in future work.
5. Conclusions
By simulating the cooling process of powder-forged Fe-2.5Cu-C alloy, the CCT diagram of the alloy was constructed. To ensure that a pearlite structure was obtained, the cooling rate was suggested to be not higher than 7 °C/s. When specimens were cooled to less than 7 °C/s, the copper precipitation behavior during the continuous cooling and subsequent aging and its effect on mechanical properties was investigated. The following conclusions were drawn:
- (1)
- For the Fe-2.5Cu-C alloy, the powder-forged connecting rods should be cooled not higher than 7 °C/s to obtain a pearlite structure. When the cooling rate was less than 7 °C/s, copper precipitates were consistent with the interphase mechanism, while when the cooling rate was higher than 7 °C/s, copper was supersaturated in the matrix;
- (2)
- During the subsequent aging process, precipitates would grow especially for those located in the ferrite matrix. In the specimen cooled at 7 °C/s, BCC copper precipitates formed after aging;
- (3)
- The growth of copper precipitates would decrease the hardness of specimens cooled less than 4 °C/s. Aging would further improve the hardness of the specimens cooled at rates faster than 4 °C/s because the precipitate strengthening is stronger than the precipitate coarsening effect.
Author Contributions
Conceptualization, S.W.; methodology, S.W.; validation, Y.W. and F.J.; formal analysis, S.W.; investigation, T.Z.; resources, F.J.; data curation, S.W.; writing—original draft preparation, S.W.; writing—review & editing, Y.W. and F.J. All authors have read and agreed to the published version of the manuscript.
Funding
This work was supported by the National Natural Science Foundation of China (grant Nos. 51871178 and 51621063). The authors are sincerely thankful to Shandong Xinyi Co. for providing the powder-forged Fe-2.5Cu-C alloy.
Conflicts of Interest
The authors declare that they have no conflict of interest.
References
- Ilia, E.; Plamondon, P.; Masse, J.P.; L’Espérance, G. Copper precipitation at engine operating temperatures in powder-forged connecting rods manufactured with Fe-Cu-C alloys. Mater. Sci. Eng. A 2019, 767, 138383. [Google Scholar] [CrossRef]
- Ilia, E.; O’Neill, M.; Tutton, K.; Lanni, G.; Letourneau, S.; Haehnel, M. Benchmarking the industry: Powder forging makes a better connecting rod. In SAE Tranactions; SAE International: Warrendale, PA, USA, 2005; pp. 340–352. [Google Scholar]
- Suzuki, H.; Sawayama, T.; Ilia, E.; Tutton, K. New material with improved machinability and strength for powder forged connecting rods. In SAE Tranactions; SAE International: Warrendale, PA, USA, 2006; pp. 556–562. [Google Scholar]
- Brown, G. Development of alloy systems for powder forging. Met. Technol. 1976, 3, 229–236. [Google Scholar] [CrossRef]
- Dorofeyev, Y.; Dorofeyev, V. Powder forging in PSRSPU. Met. Powder Rep. 2018, 73, 87–93. [Google Scholar] [CrossRef]
- Wang, S.; Wang, Q.; Wang, H.L.; Liu, F.P.; Yao, W.J.; Jiang, F.; Sun, J.; Wang, F.Y. Effects of copper content on microstructure and mechanical properties of powder-forged rod Fe-C-Cu alloys manufactured at elevated temperature. Mater. Sci. Eng. A 2019, 743, 197–206. [Google Scholar] [CrossRef]
- Thompson, S.; Krauss, G.; Tseng, C.-C. A new model of interphase precipitation in copper-containing steels. J. Mater. Sci. Lett. 1998, 17, 2075–2078. [Google Scholar] [CrossRef]
- Thompson, S.; Krauss, G. Copper precipitation during continuous cooling and isothermal aging of A710-type steels. Metall. Mater. Trans. A 1996, 27, 1573–1588. [Google Scholar] [CrossRef]
- Thompson, S.; Colvin, D.; Krauss, G. Austenite decomposition during continuous cooling of an HSLA-80 plate steel. Metall. Mater. Trans. A 1996, 27, 1557–1571. [Google Scholar] [CrossRef]
- Kimura, Y.; Takaki, S. Phase transformation mechanism of Fe-Cu alloys. ISIJ Int. 1997, 37, 290–295. [Google Scholar] [CrossRef]
- Shi, X.; Yan, W.; Wang, W.; Yang, Z.; Shan, Y.; Yang, K. Dynamic continuous cooling transformation behavior of a novel Cu-bearing pipeline steel. ISIJ Int. 2016, 56, 2284–2289. [Google Scholar] [CrossRef] [Green Version]
- Liu, Q.; Li, C.; Gu, J.; Liu, W. Direct observation of Cu interphase precipitation in continuous cooling transformation by atom probe tomography. Philos. Mag. 2014, 94, 306–315. [Google Scholar] [CrossRef]
- Liu, Q.; Liu, W.; Xiong, X. Correlation of Cu precipitation with austenite—Ferrite transformation in a continuously cooled multicomponent steel: An atom probe tomography study. J. Mater. Res. 2012, 27, 1060–1067. [Google Scholar] [CrossRef]
- Monzen, R.; Jenkins, M.; Sutton, A. The bcc-to-9R martensitic transformation of Cu precipitates and the relaxation process of elastic strains in an Fe-Cu alloy. Philos. Mag. A 2000, 80, 711–723. [Google Scholar] [CrossRef]
- Monzen, R.; Iguchi, M.; Jenkins, M. Structural changes of 9R copper precipitates in an aged Fe-Cu alloy. Philos. Mag. Lett. 2000, 80, 137–148. [Google Scholar] [CrossRef]
- Chairuangsri, T.; Edmonds, D. The precipitation of copper in abnormal ferrite and pearlite in hyper-eutectoid steels. Acta Mater. 2000, 48, 3931–3949. [Google Scholar] [CrossRef]
- Maruyama, N.; Sugiyama, M.; Hara, T.; Tamehiro, H. Precipitation and phase transformation of copper particles in low alloy ferritic and martensitic steels. Mater. Trans. JIM 1999, 40, 268–277. [Google Scholar] [CrossRef] [Green Version]
- Fourlaris, G.; Baker, A.; Papadimitriou, G. Microscopic characterisation of ε-Cu interphase precipitation in hypereutectoid Fe-C-Cu alloys. Acta Metall. Et Mater. 1995, 43, 2589–2604. [Google Scholar] [CrossRef]
- Heo, Y.-U.; Kim, Y.K.; Kim, J.S.; Kim, J.K. Phase transformation of Cu precipitates from bcc to fcc in Fe-3Si-2Cu alloy. Acta Mater. 2013, 61, 519–528. [Google Scholar] [CrossRef]
- Lozano-Perez, S.; Sha, G.; Titchmarsh, J.M.; Jenkins, M.L.; Hirosawa, S.; Cerezo, A.; Smith, G.D.W. Comparison of the number densities of nanosized Cu-rich precipitates in ferritic alloys measured using EELS and EDX mapping, HREM and 3DAP. J. Mater. Sci. 2006, 41, 2559–2565. [Google Scholar] [CrossRef]
- Lozano-Perez, S.; Jenkins, M.; Titchmarsh, J. Evidence for deformation-induced transformations of Cu-rich precipitates in an aged FeCu alloy. Philos. Mag. Lett. 2006, 86, 367–374. [Google Scholar] [CrossRef]
- Isheim, D.; Gagliano, M.S.; Fine, M.E.; Seidman, D.N. Interfacial segregation at Cu-rich precipitates in a high-strength low-carbon steel studied on a sub-nanometer scale. Acta Mater. 2006, 54, 841–849. [Google Scholar] [CrossRef]
- Liu, Q.-D.; Zhao, S.-J. Comparative study on austenite decomposition and Cu precipitation during continuous cooling transformation. Metall. Mater. Trans. A 2013, 44, 163–171. [Google Scholar] [CrossRef]
- Jung, J.G.; Jung, M.; Lee, S.M.; Shin, E.; Shin, H.C.; Lee, Y.K. Cu precipitation kinetics during martensite tempering in a medium C steel. J. Alloy. Compd. 2013, 553, 299–307. [Google Scholar] [CrossRef]
- Yang, J.B.; Yamashita, T.; Sano, N.; Enomoto, M. Simulation of competitive Cu precipitation in steel during non-isothermal aging. Mater. Ence Eng. A 2008, 487, 128–136. [Google Scholar] [CrossRef]
- Han, G.; Xie, Z.J.; Li, Z.Y.; Lei, B.; Shang, C.J.; Misra, R.D.K. Evolution of crystal structure of Cu precipitates in a low carbon steel. Mater. Des. 2017, 135, 92–101. [Google Scholar] [CrossRef]
- Xi, T.; Shahzad, M.B.; Xu, D.; Zhao, J.; Yang, C.; Qi, M.; Yang, K. Copper precipitation behavior and mechanical properties of Cu-bearing 316L austenitic stainless steel: A comprehensive cross-correlation study. Mater. Sci. Eng. A 2016, 675, 243–252. [Google Scholar] [CrossRef]
- Takahashi, J.; Kawakami, K.; Kobayashi, Y. Consideration of particle-strengthening mechanism of copper-precipitation-strengthened steels by atom probe tomography analysis. Mater. Sci. Eng. A 2012, 535, 144–152. [Google Scholar] [CrossRef]
- Chen, Z.; Kioussis, N.; Ghoniem, N. Influence of nanoscale Cu precipitates in α-Fe on dislocation core structure and strengthening. Phys. Rev. B 2009, 80, 184104. [Google Scholar] [CrossRef] [Green Version]
- Kolli, R.P.; Seidman, D.N. The temporal evolution of the decomposition of a concentrated multicomponent Fe–Cu-based steel. Acta Mater. 2008, 56, 2073–2088. [Google Scholar] [CrossRef]
- Charleux, M.; Livet, F.; Bley, F.; Louchet, F.; Bréchet, Y. Thermal ageing of an Fe-Cu alloy: Microstructural evolution and precipitation hardening. Philos. Mag. A 1996, 73, 883–897. [Google Scholar] [CrossRef]
- Youle, A.; Ralph, B. A Study of the precipitation of copper from α-iron in the pre-peak to peak hardness range of ageing. Met. Sci. J. 1972, 6, 149–152. [Google Scholar] [CrossRef]
- Eto, F.H. Development of fracture splitting connecting rod. JSAE Rev. 2002, 23, 101–104. [Google Scholar]
- Kondo, Y. Behaviour of copper during high temperature oxidation of steel containing copper. ISIJ Int. 2004, 44, 1576–1580. [Google Scholar] [CrossRef]
- Krielaart, G.P.; Sietsma, J.; van der Zwaag, S. Ferrite formation in Fe-C alloys during austenite decomposition under non-equilibrium interface conditions. Mater. Sci. Eng. A 1997, 237, 216–223. [Google Scholar] [CrossRef] [Green Version]
- Khalid, F.; Edmonds, D. A transmission electron microscopy study of copper precipitation in the cementite phase of hypereutectoid alloy steels. Metall. Trans. A 1993, 24, 781–793. [Google Scholar] [CrossRef]
- Misra, R.; Jia, Z.; O’Malley, R.J.; Jansto, S. Precipitation behavior during thin slab thermomechanical processing and isothermal aging of copper-bearing niobium-microalloyed high strength structural steels: The effect on mechanical properties. Mater. Sci. Eng. A 2011, 528, 8772–8780. [Google Scholar] [CrossRef]
- Fine, M.; Isheim, D. Origin of copper precipitation strengthening in steel revisited. Scr. Mater. 2005, 53, 115–118. [Google Scholar] [CrossRef]
- Deschamps, A.; Militzer, M. Precipitation kinetics and strengthening of a Fe-0.8 wt.% Cu alloy. ISIJ Int. 2001, 41, 196–205. [Google Scholar] [CrossRef]
- Russell, K.C.; Brown, L. A dispersion strengthening model based on differing elastic moduli applied to the iron-copper system. Acta Metall. 1972, 20, 969–974. [Google Scholar] [CrossRef]
Figure 1.
Schematic presentation of continuous cooling test procedure.

Figure 2.
Measurement of Ac1, Ac3, and Ms temperatures based on dilatometric curves, (a) heating curve, (b) cooling curve.
Figure 2.
Measurement of Ac1, Ac3, and Ms temperatures based on dilatometric curves, (a) heating curve, (b) cooling curve.

Figure 3.
Microstructure and hardness of the specimens cooled at different rates: (a) 0.5 °C/s, (b) 1 °C/s, (c) 3 °C/s, (d) 5 °C/s, (e) 7 °C/s, (f) 10 °C/s, (g) 12 °C/s, (h) 15 °C/s, (i) 20 °C/s, (j) 25 °C/s, (k) 30 °C/s, (l) 40 °C/s.
Figure 3.
Microstructure and hardness of the specimens cooled at different rates: (a) 0.5 °C/s, (b) 1 °C/s, (c) 3 °C/s, (d) 5 °C/s, (e) 7 °C/s, (f) 10 °C/s, (g) 12 °C/s, (h) 15 °C/s, (i) 20 °C/s, (j) 25 °C/s, (k) 30 °C/s, (l) 40 °C/s.

Figure 4.
Dilatometric curves of the deformed specimen cooled at (a) 0.5 °C/s, (b) 5 °C/s, and (c) 15 °C/s.
Figure 4.
Dilatometric curves of the deformed specimen cooled at (a) 0.5 °C/s, (b) 5 °C/s, and (c) 15 °C/s.

Figure 5.
Continuous cooling transformation (CCT) diagram of powder-forged Fe-2.5Cu-C alloy.

Figure 6.
Microstructure of specimens cooled at (a) 0.5 °C/s, (b) 3 °C/s, (c) 5 °C/s, and (d) 7 °C/s.
Figure 6.
Microstructure of specimens cooled at (a) 0.5 °C/s, (b) 3 °C/s, (c) 5 °C/s, and (d) 7 °C/s.

Figure 7.
Copper precipitates in the specimens cooled at (a) 0.5 °C/s, (b) 3 °C/s, and (c) 7 °C/s characterized using TEM.
Figure 7.
Copper precipitates in the specimens cooled at (a) 0.5 °C/s, (b) 3 °C/s, and (c) 7 °C/s characterized using TEM.

Figure 8.
Microstructure of the specimens cooled at (a) 0.5 °C/s, (b) 3 °C/s, (c) 5 °C/s, and (d) 7 °C/s after aging.
Figure 8.
Microstructure of the specimens cooled at (a) 0.5 °C/s, (b) 3 °C/s, (c) 5 °C/s, and (d) 7 °C/s after aging.

Figure 9.
Copper precipitates in the specimens cooled at (a) 0.5°C/s and (b) 7°C/s after aging at 400 °C for 2 h.
Figure 9.
Copper precipitates in the specimens cooled at (a) 0.5°C/s and (b) 7°C/s after aging at 400 °C for 2 h.

Figure 10.
Copper precipitates in the specimens cooled at (a) 0.5 °C/s, (b) 0.5 °C/s after aging, and (c) 7 °C/s after aging at 400 °C for 2 h.
Figure 10.
Copper precipitates in the specimens cooled at (a) 0.5 °C/s, (b) 0.5 °C/s after aging, and (c) 7 °C/s after aging at 400 °C for 2 h.

Figure 11.
Vickers hardness of the specimens before and after aging.

Figure 12.
Schematic diagrams of the cooling process showing the copper (red dot), solutes diffusion, and redistribution process companying the austenite–pearlite transformation and the associated copper precipitation. P: pearlite; F: ferrite; C: cementite; A: austenite; PB: pearlite/austenite phase boundary.

Figure 13.
Copper precipitates observed in the cementite of the specimen cooled at 0.5 °C/s. (a) Precipitates located in the center spine, (b) precipitates located in interface.
Figure 13.
Copper precipitates observed in the cementite of the specimen cooled at 0.5 °C/s. (a) Precipitates located in the center spine, (b) precipitates located in interface.


Table 1.
Chemical composition of as-received powder-forged Fe-2.5Cu-C alloy.
| Elements (wt. %) | Cu | C | Mn | S | Fe |
|---|---|---|---|---|---|
| Fe-2.5Cu-C | 2.52 | 0.61 | 0.49 | 0.12 | Bal. |
Table 2.
Quantification of the ferrite and pearlite of specimens cooled at different rates. Vf is the volume fraction of the ferrite, Sp is the lamella space of pearlite colony, and dp is the grain size of pearlite.
Table 2.
Quantification of the ferrite and pearlite of specimens cooled at different rates. Vf is the volume fraction of the ferrite, Sp is the lamella space of pearlite colony, and dp is the grain size of pearlite.
| Cooling rates (°C/s) | Vf (%) | Sp (nm) | dp (μm) | HV |
|---|---|---|---|---|
| 0.5 | 23 | 380 | 139 | 347 |
| 3 | 8 | 263 | 102 | 369 |
| 5 | 6 | 179 | 82 | 385 |
| 7 | 2 | 117 | 61 | 397 |
Table 3.
Size and volume fraction of the copper precipitates in the specimens cooled at 0.5 °C/s and 7 °C/s before and after aging.
Table 3.
Size and volume fraction of the copper precipitates in the specimens cooled at 0.5 °C/s and 7 °C/s before and after aging.
| Cooling Rates (°C/s) | Average Diameter (nm) | Volume Fraction | ||
|---|---|---|---|---|
| Before Aging | After Aging | Before Aging | After Aging | |
| 0.5 | 12 | 21 | 1.2% | 2.15% |
| 7 | 0 | 10 | 0 | 1% |
© 2020 by the authors. Licensee MDPI, Basel, Switzerland. This article is an open access article distributed under the terms and conditions of the Creative Commons Attribution (CC BY) license (http://creativecommons.org/licenses/by/4.0/).
Share and Cite
MDPI and ACS Style
Wang, S.; Wu, Y.; Zhang, T.; Jiang, F. Copper Precipitation Behavior during Continuous Cooling and Subsequent Aging of Powder-Forged Fe-2.5Cu-C Alloy. Metals 2020, 10, 1350. https://doi.org/10.3390/met10101350
AMA Style
Wang S, Wu Y, Zhang T, Jiang F. Copper Precipitation Behavior during Continuous Cooling and Subsequent Aging of Powder-Forged Fe-2.5Cu-C Alloy. Metals. 2020; 10(10):1350. https://doi.org/10.3390/met10101350
Chicago/Turabian StyleWang, Sui, Yake Wu, Tengyu Zhang, and Feng Jiang. 2020. "Copper Precipitation Behavior during Continuous Cooling and Subsequent Aging of Powder-Forged Fe-2.5Cu-C Alloy" Metals 10, no. 10: 1350. https://doi.org/10.3390/met10101350
Note that from the first issue of 2016, this journal uses article numbers instead of page numbers. See further details here.