Spatial Patterns of Childhood Obesity Prevalence in Relation to Socioeconomic Factors across England


1
School of Geography and Planning, Sun Yat-sen University, Guangzhou 510275, China
2
Department of Geography, College of Science, Swansea University, Swansea SA28PP, UK
3
Institute of Data Science, German Aerospace Center (DLR), 07745 Jena, Germany
*
Author to whom correspondence should be addressed.
ISPRS Int. J. Geo-Inf. 2020, 9(10), 599; https://doi.org/10.3390/ijgi9100599
Submission received: 27 August 2020
/
Revised: 5 October 2020
/
Accepted: 9 October 2020
/
Published: 11 October 2020
(This article belongs to the Special Issue Geographical Analysis, Urban Modelling, Spatial Statistics, Econometric and Multidimensional Evaluation in Urban Environment)
Abstract
:To examine to what extent spatial inequalities in childhood obesity are attributable to spatial inequalities in socioeconomic characteristics across a country, we aimed to investigate the spatial associations of socioeconomic characteristics and childhood obesity. We first explored spatial patterns of childhood obesity prevalence, and subsequently investigated the spatial associations of socioeconomic factors and childhood obesity prevalence across England by selecting and estimating appropriate spatial regression models. As the data used are geospatial data, we used two newly developed specifications of spatial regression models to investigate the spatial association of socioeconomic factors and childhood obesity prevalence. As a result, among the two newly developed specifications of spatial regression models, the fast random effects specification of eigenvector spatial filtering (FRES-ESF) model appears to outperform the matrix exponential spatial specification of spatial autoregressive (MESS-SAR) model. Empirical results indicate that positive spatial dependence is found to exist in childhood obesity prevalence across England; and that socioeconomic factors are significantly associated with childhood obesity prevalence across England. In England, children living in areas with lower socioeconomic status are at higher risk of obesity. This study suggests effectively reducing spatial inequalities in socioeconomic status will plays a vital role in mitigating spatial inequalities in childhood obesity prevalence.
1. Introduction
Childhood obesity is a major public health challenge worldwide. In just 40 years, the number of school-age children and adolescents with obesity has risen more than 10-fold, from 11 million to 124 million (2016 estimates) [1]. In 2016, 216 million school-age children and adolescents were classified as overweight but not obese, whilst 38 million children aged under five were estimated to be overweight or obese in 2017 [1]. Although the WHO set up a target of no increase in overweight among children under five, school-age children, or adolescents by 2025 (from 2010 levels), the vast majority of countries or regions are still experiencing an increase in childhood obesity [1]. In particular, the epidemic has been growing most rapidly in low- or middle-income countries like countries in Africa, the Middle East, and the Pacific Islands [1]. Even in developed countries, children from some households are at high risk of becoming obese or overweight. From 2003 to 2007, obesity prevalence increased by 10% for all U.S. children but increased by 23%–33% for children in low-education, low-income, and higher unemployment households [2]. Apart from genetic factors and behavioural factors (e.g., nutrition, dietary patterns, diet quality, fruit and vegetable intake, sugary drink intake, sleep duration, sleep quality), socioeconomic factors are associated with the prevalence of childhood obesity [3,4,5,6]. Unlike genetic factors or behavioural factors, socioeconomic factors are likely to have an indirect impact on the prevalence of childhood obesity through influencing children’s behaviour in relation to health [3,4]. In particular, in developed countries, children of lower socioeconomic status (SES) are more likely to be obese [5,6]. Socioeconomic inequalities are found to contribute to obesity prevalence inequalities [7,8].
Conventionally, non-spatial regression models, like ordinary least squares (OLS) models, were widely used to examine the associations of variables. Ignoring the presence of spatial effects in regression models, most of the previous studies applied non-spatial regression models to geospatial data as well. In a reasonable regression model, residuals should be independent of each other; otherwise, the regression model is thought to be biased. A number of empirical studies reveal that residuals are likely to be spatially autocorrelated when non-spatial regression models are applied to geospatial data [9]. Owing to spatial dependence in the residuals, non-spatial regression models appear to be biased, as one key assumption of regression modelling is that the residuals should be independent of each other [10]. The inappropriate selection of models is likely to produce biased results, leading to potential misinterpretations of the associations of socioeconomic factors and health outcomes (e.g., obesity prevalence). To address spatial effects in regression models, spatial regression models are developed to fit geospatial data [9,10,11]. However, there are a various specifications of spatial regression models, and how to select and estimate appropriate forms is of high importance. Not only spatial regression models (i.e., spatial autoregressive models), but also geographically weighted regression (GWR) models and multiple linear regression (MLR) models have been used to investigate the spatial associations of socioeconomic factors and the prevalence of childhood obesity [12,13,14]. Nevertheless, those models have some disadvantages. Typically, MLR models are not applied to geospatial data collected at the same level, whilst GWR models uncover spatially varying associations which are likely to differ substantially from one place to another. For instance, education level and household income level are found to be positively associated with the prevalence of childhood obesity in some areas of Athens, whilst they are negatively associated with the prevalence of childhood obesity in the remaining areas of Athens [13]. A spatial regression model seems to be applicable to a single-level analysis without the occurrence of spatially varying parameters in opposite directions. Although traditional forms of spatial regression models (e.g., spatial lag or spatial error models) have been applied to spatial analysis of childhood obesity, new forms of spatial regression models, which can potentially improve the estimation, have not [13].
To examine to what extent spatial inequalities in childhood obesity are attributable to spatial inequalities in socioeconomic characteristics across a country, we aimed to investigate the spatial associations of socioeconomic characteristics and childhood obesity. To overcome the limitations of the previous studies on the appropriateness of model selection, we further aimed to select and estimate appropriate regression models. Specifically, we investigated local-scale spatial associations of socioeconomic factors and the prevalence of childhood obesity across England. Accordingly, two newly developed specifications of spatial regression models were selected. Moreover, we will discuss the results and suggest implications for effectively implementing interventions to prevent childhood obesity.
2. Methods
In this study, we first explored spatial patterns of childhood obesity across England, and subsequently investigated the spatial associations of socioeconomic factors and childhood obesity prevalence across England. In this section, the local-scale childhood obesity data and geodemographic data used are introduced. Subsequently, the approach to exploring spatial patterns of childhood obesity is introduced. Finally, how to investigate the spatial associations of childhood obesity prevalence and socioeconomic factors is introduced.
2.1. Research Data
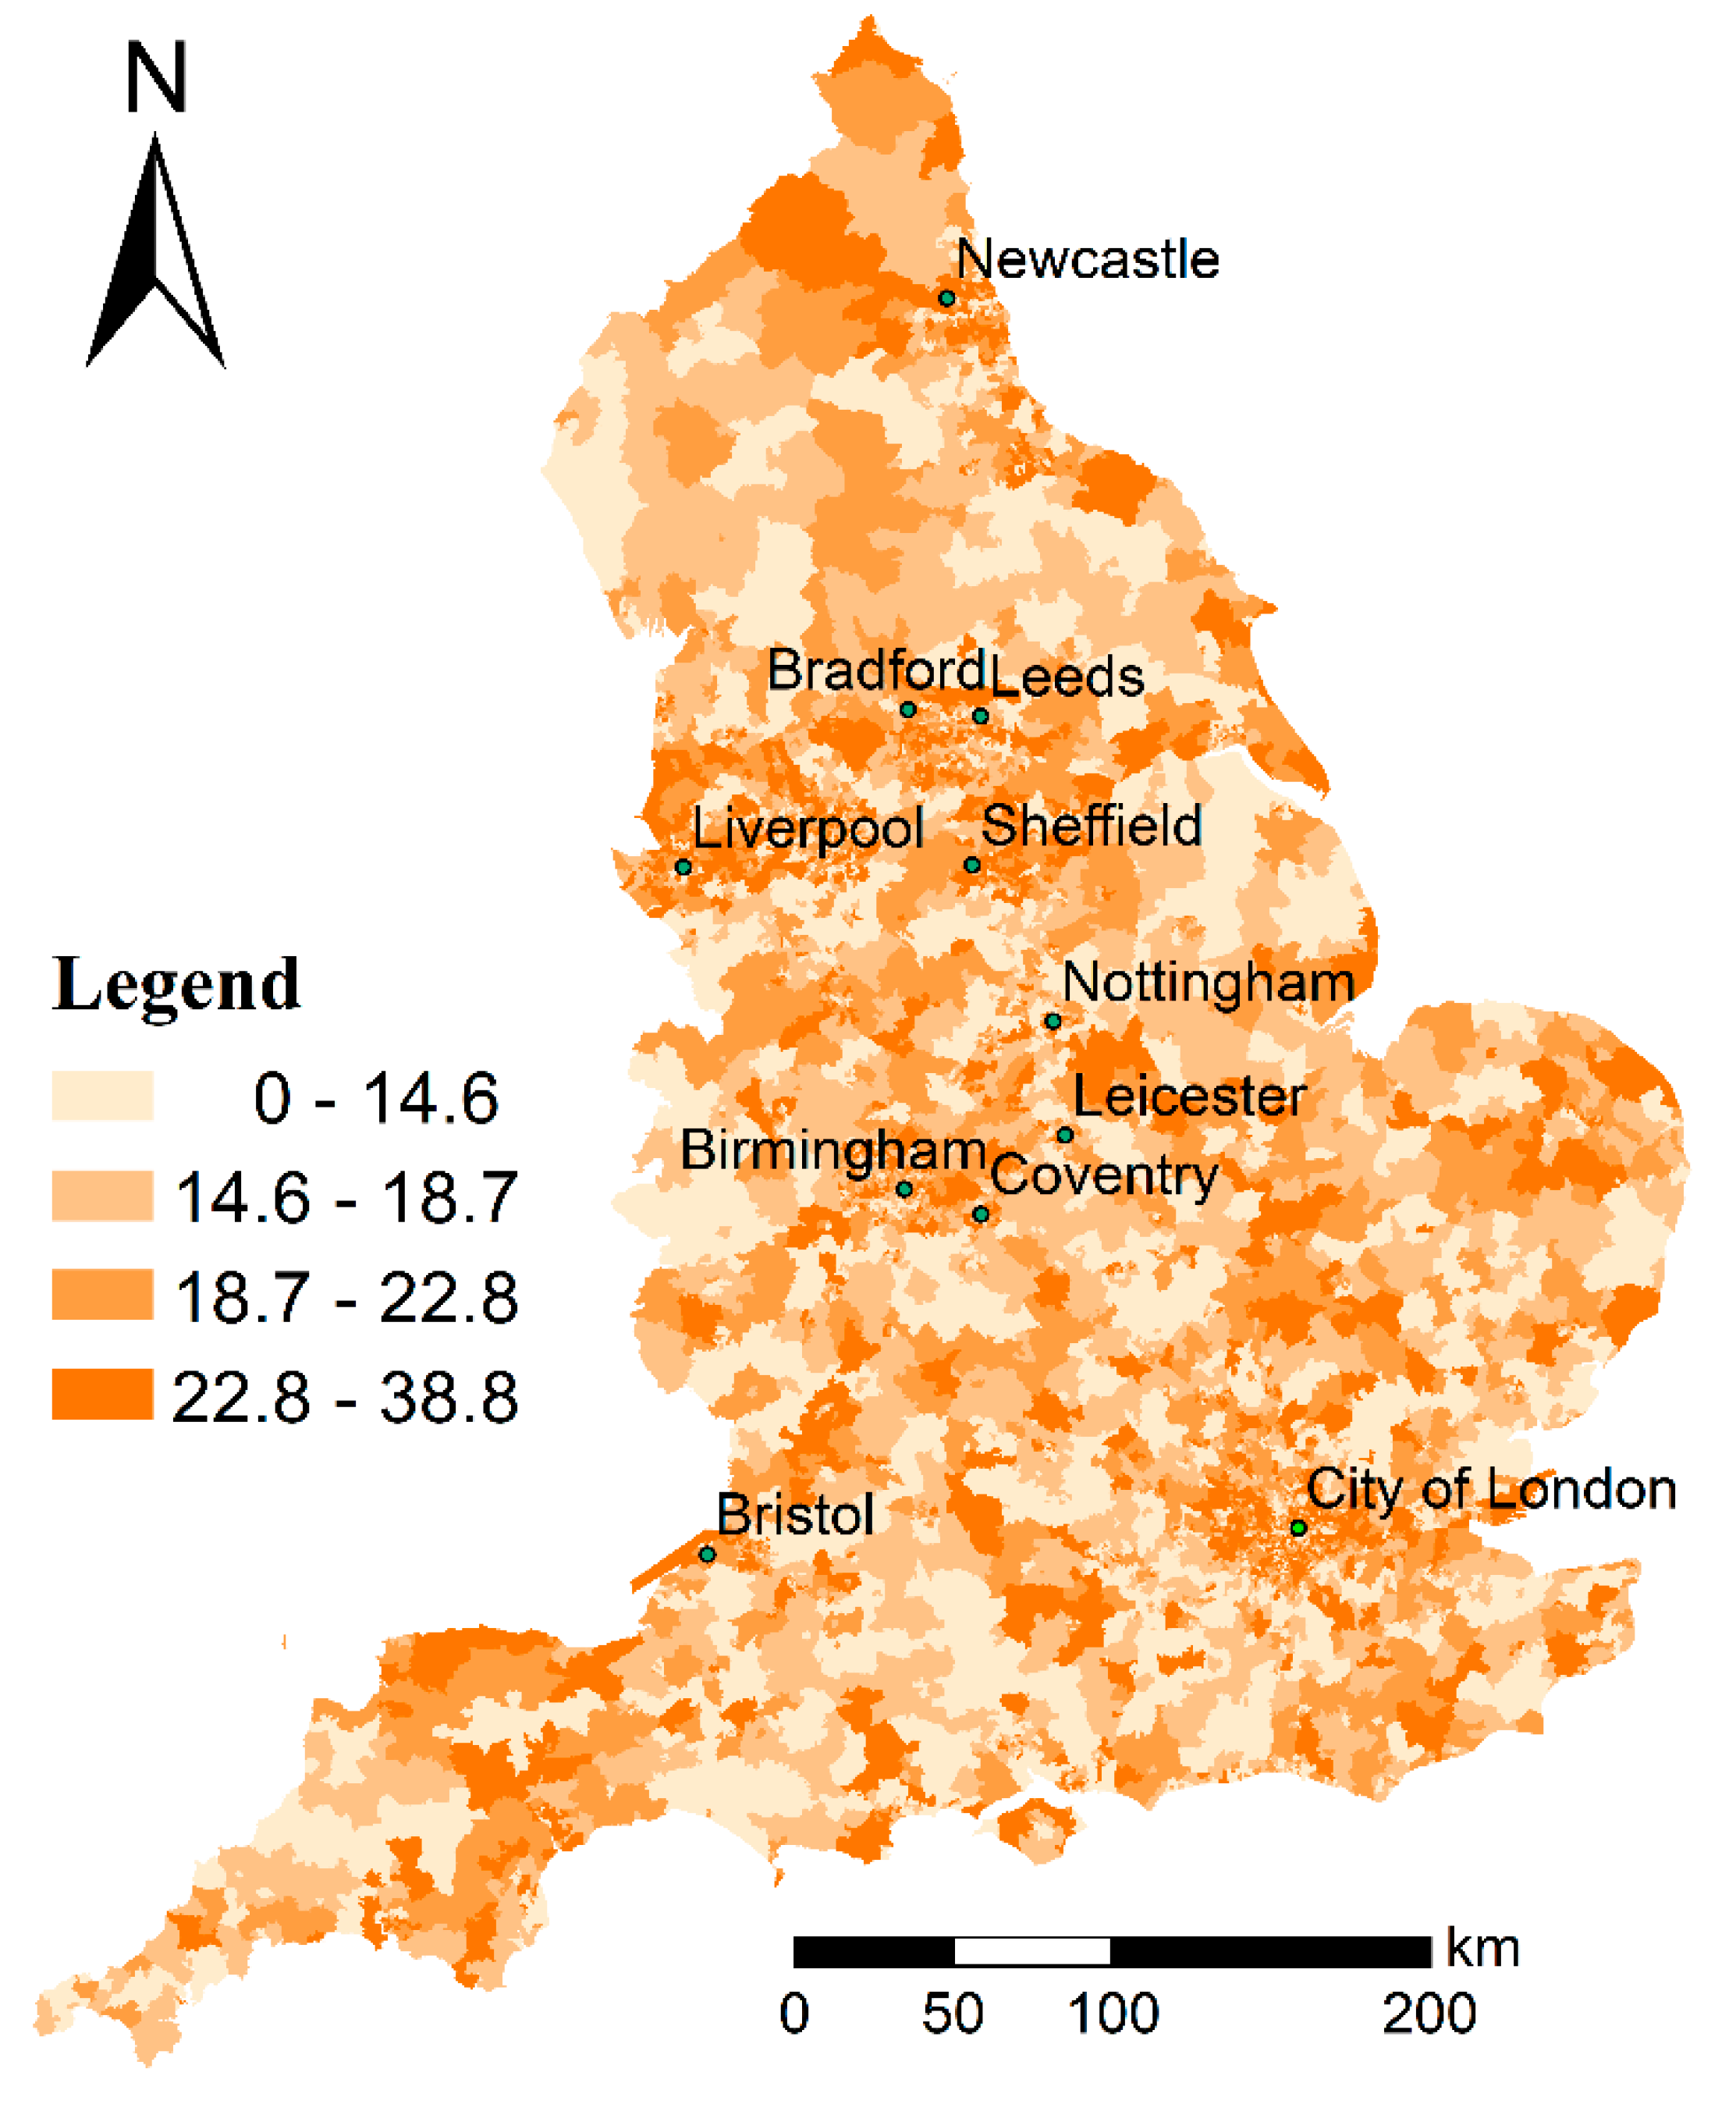
Cross-sectional childhood obesity data were downloaded from GOV.UK (https://www.gov.uk). The National Child Measurement Programme (NCMP) measures the height and weight of over one million children each year in Reception (age 4–5 years) and Year 6 (age 10–11 years) in state-maintained primary schools in England [15]. It provides trend data on the prevalence of excess weight (overweight including obesity) (NCMP 2010/11 to 2016/17) and obesity (NCMP 2008/09 to 2016/17) at the 2011 Middle Super Output Area (MSOA) level [15]. In this study, the percentage of obese children in Year 6 (age 10–11 years) (2013/14 to 2015/16) is used to represent the prevalence of childhood obesity in 2014. The Lower Layer Super Output Area (LSOA) and Middle Layer Super Output Area (MSOA) are two main categories of small area units designed to support UK demographics on the basis of UK Census Output Areas (OAs). An OA is the smallest areal unit used in the UK Census surveys, whilst LSOAs and MSOAs are composed of OAs. Specifically, an LSOA consists of typically four to six OAs and, furthermore, an MSOA consists of typically four to five LSOAs. An LSOA has a population of between 1000 and 3000 persons, whilst an MSOA has an average population of 7200. In the UK demographic statistics, OAs, LSOAs, and MSOAs represent the 1st, 2nd, and 3rd highest geography levels, respectively. There are 171,372 OAs, 32,844 LSOAs, and 6791 MSOAs within England. Figure 1 shows the MSOA-level percentage of obese children in Year 6 (age 10–11 years) across England for 2013/14 to 2015/16.
Demographic data: the Office for National Statistics (ONS) offers mid-2014 population estimates and median age estimates for both LSOAs and MSOAs in England and Wales (https://www.nomisweb.co.uk/). As the ONS has not released the mid-2014 population estimates by gender, age, or ethnicity, as well as household employment data, we use the 2011 UK Census data offered by the ONS to acquire the detailed population and household employment data at the MSOA level (https://www.nomisweb.co.uk/).
Income data: the Office for National Statistics (ONS) offers average weekly household income data in 2013/14 across England and Wales (https://www.ons.gov.uk). The small area model-based income estimates are the official estimates of weekly household income at the Middle Layer Super Output Area (MSOA) level in England and Wales for 2013/14 (the financial year ending in 2014). They are designated national statistics which are calculated using a model-based method to produce four estimates of income [16]: total (gross) weekly household income; net weekly household income; net weekly household income (equivalised) before housing costs; and net weekly household income (equivalised) after housing costs. We use the net weekly household income (equivalised) after housing costs to represent the disposable household income.
2.2. Exploring Spatial Patterns of Childhood Obesity Prevalence
In this study, we aimed to explore spatial patterns of childhood obesity prevalence across England by using Moran’s I statistic, designed to measure spatial dependence, for childhood obesity prevalence. Positive or negative spatial dependence (spatial autocorrelation) indicate that observations at spatially close locations tend to have similar or dissimilar values, respectively. In this study, the spatial matrix used to determine spatial relationships of observations is computed based on the contiguity of areas (polygons). Consequently, global and local forms of Moran’s I statistic were used to measure spatial dependence (spatial autocorrelation) globally and locally. Specifically, a significantly positive Moran’s I statistic value indicates a high value is neighboured by high values or a low value is neighboured by low values, whilst a significantly negative Moran’s I statistic value indicates a high value is neighboured by low values or a low value is neighboured by high values.
2.3. Investigating Spatial Associations of Childhood Obesity Prevalence and Socioeconomic Factors
Firstly, measures of the socioeconomic characteristics are introduced. Then, how to conduct model selection and estimation is introduced.
2.3.1. Socioeconomic Factors
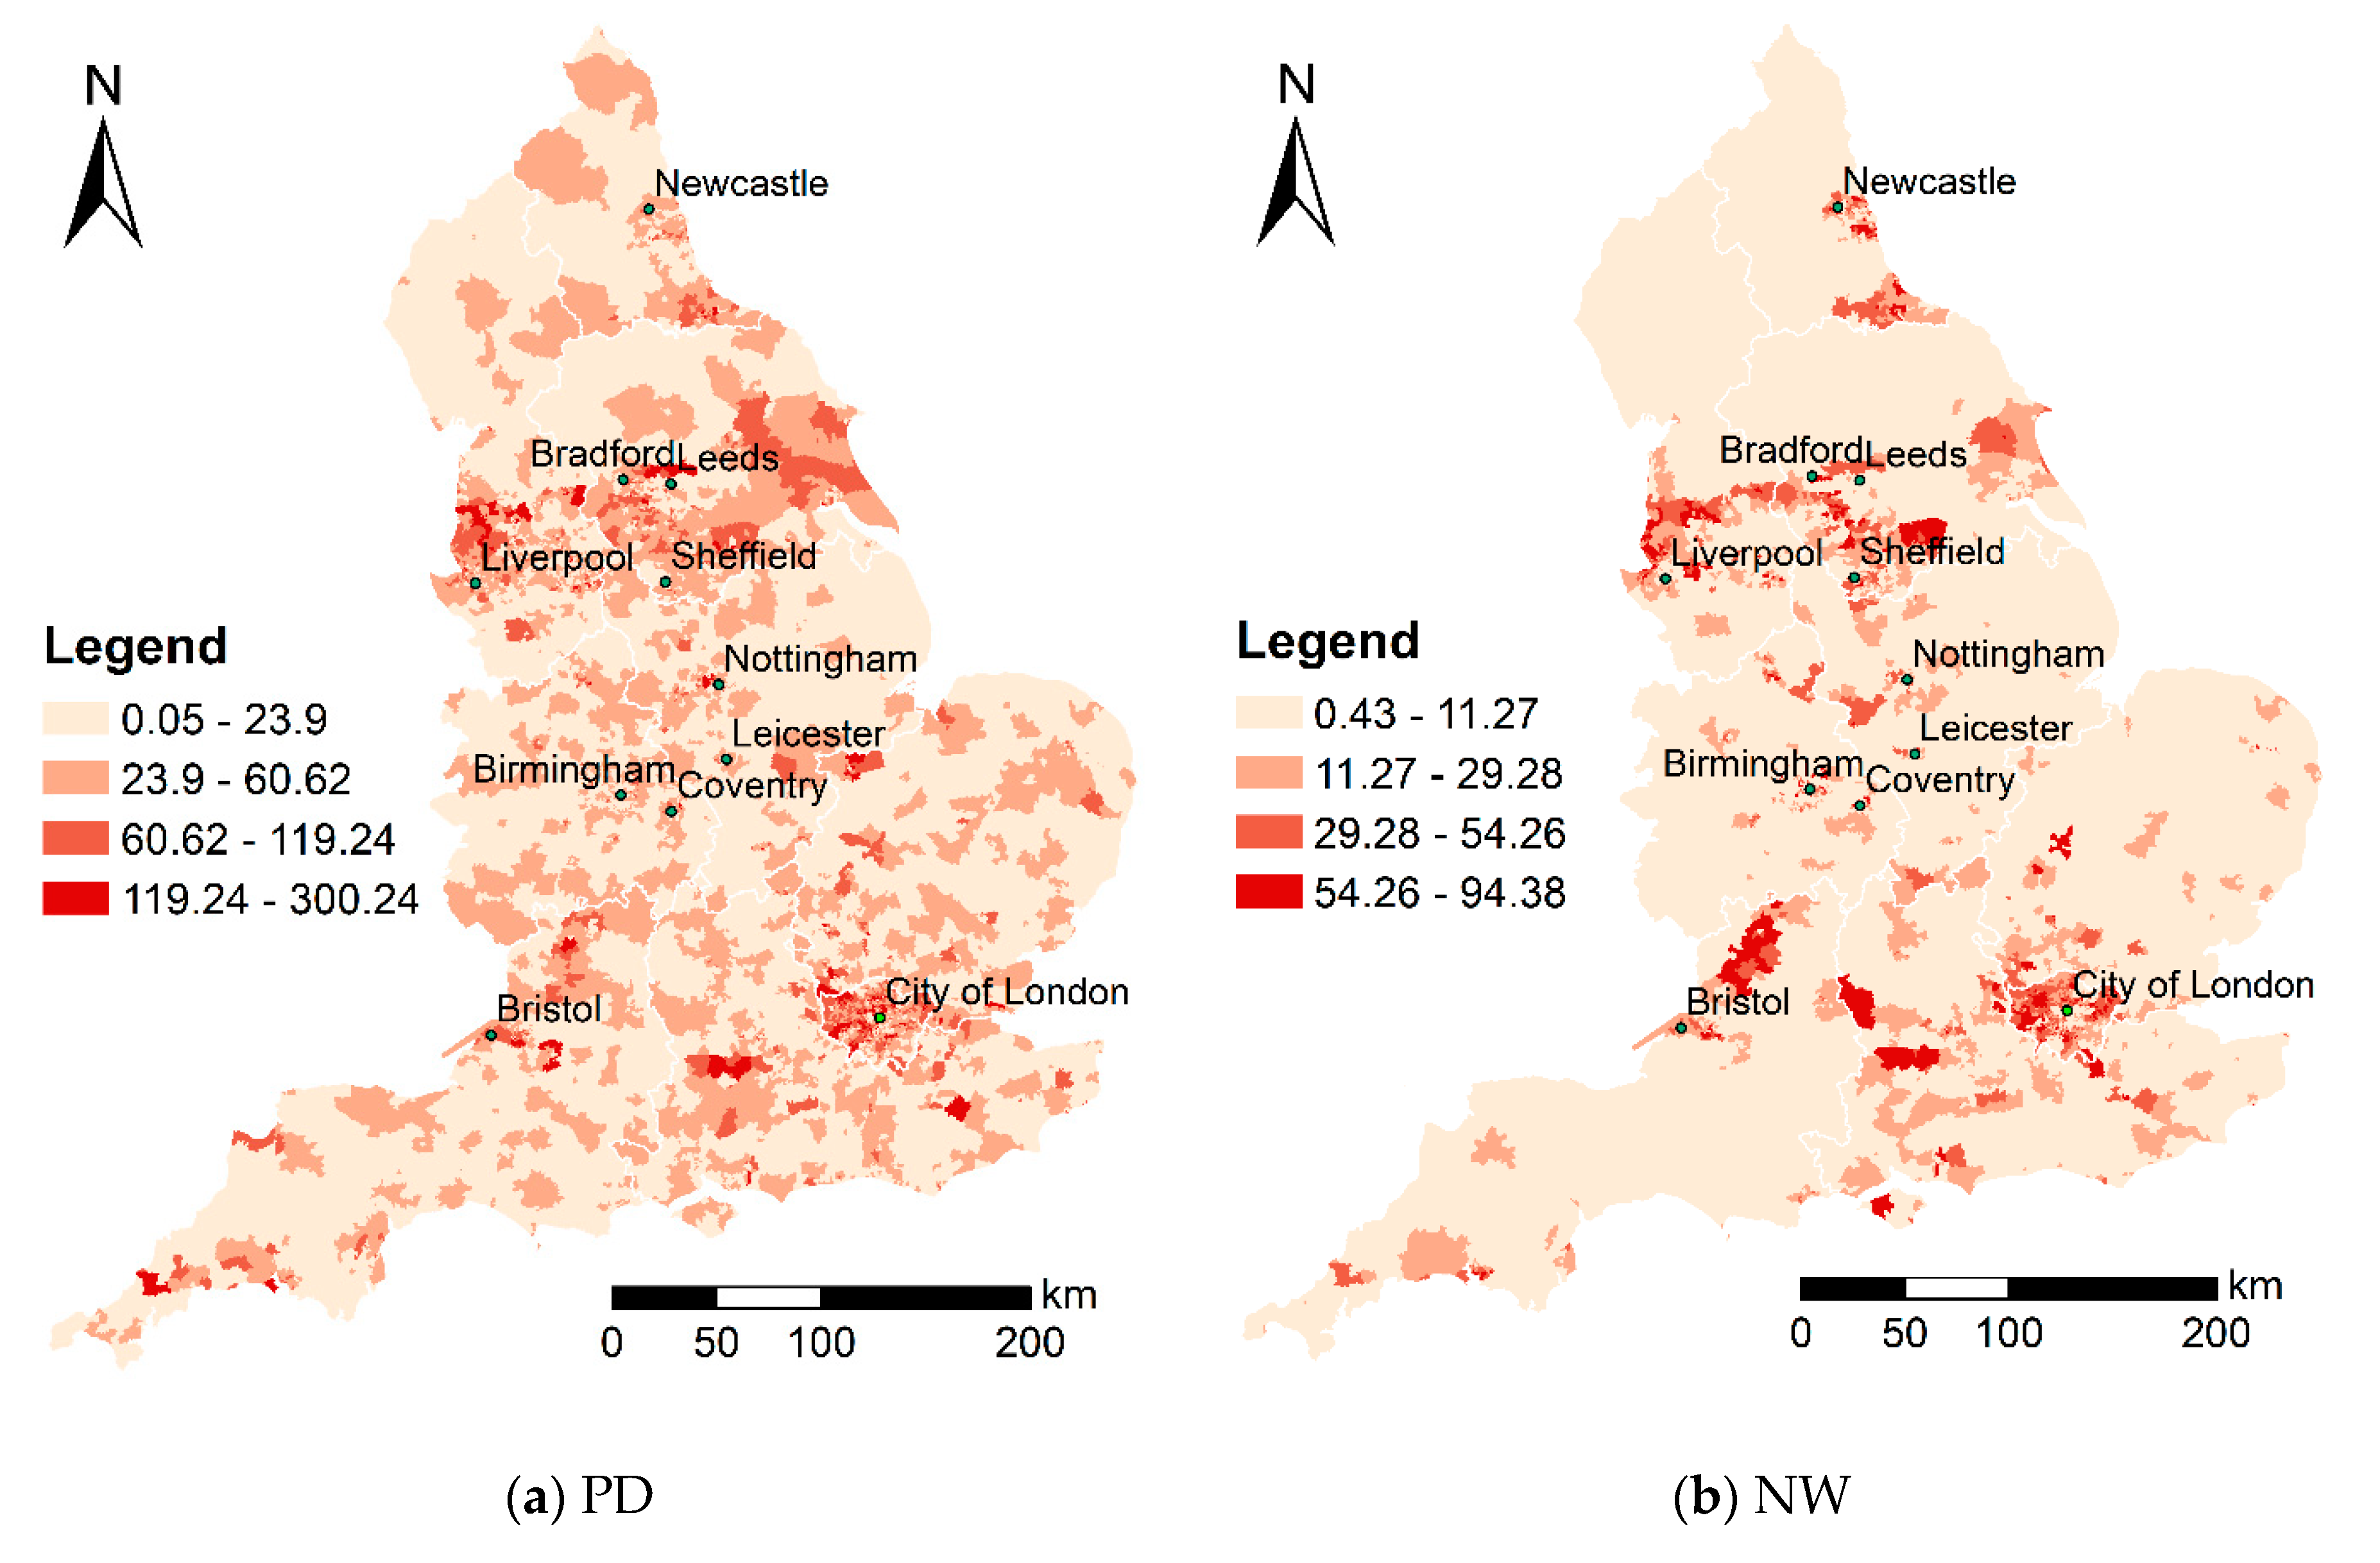
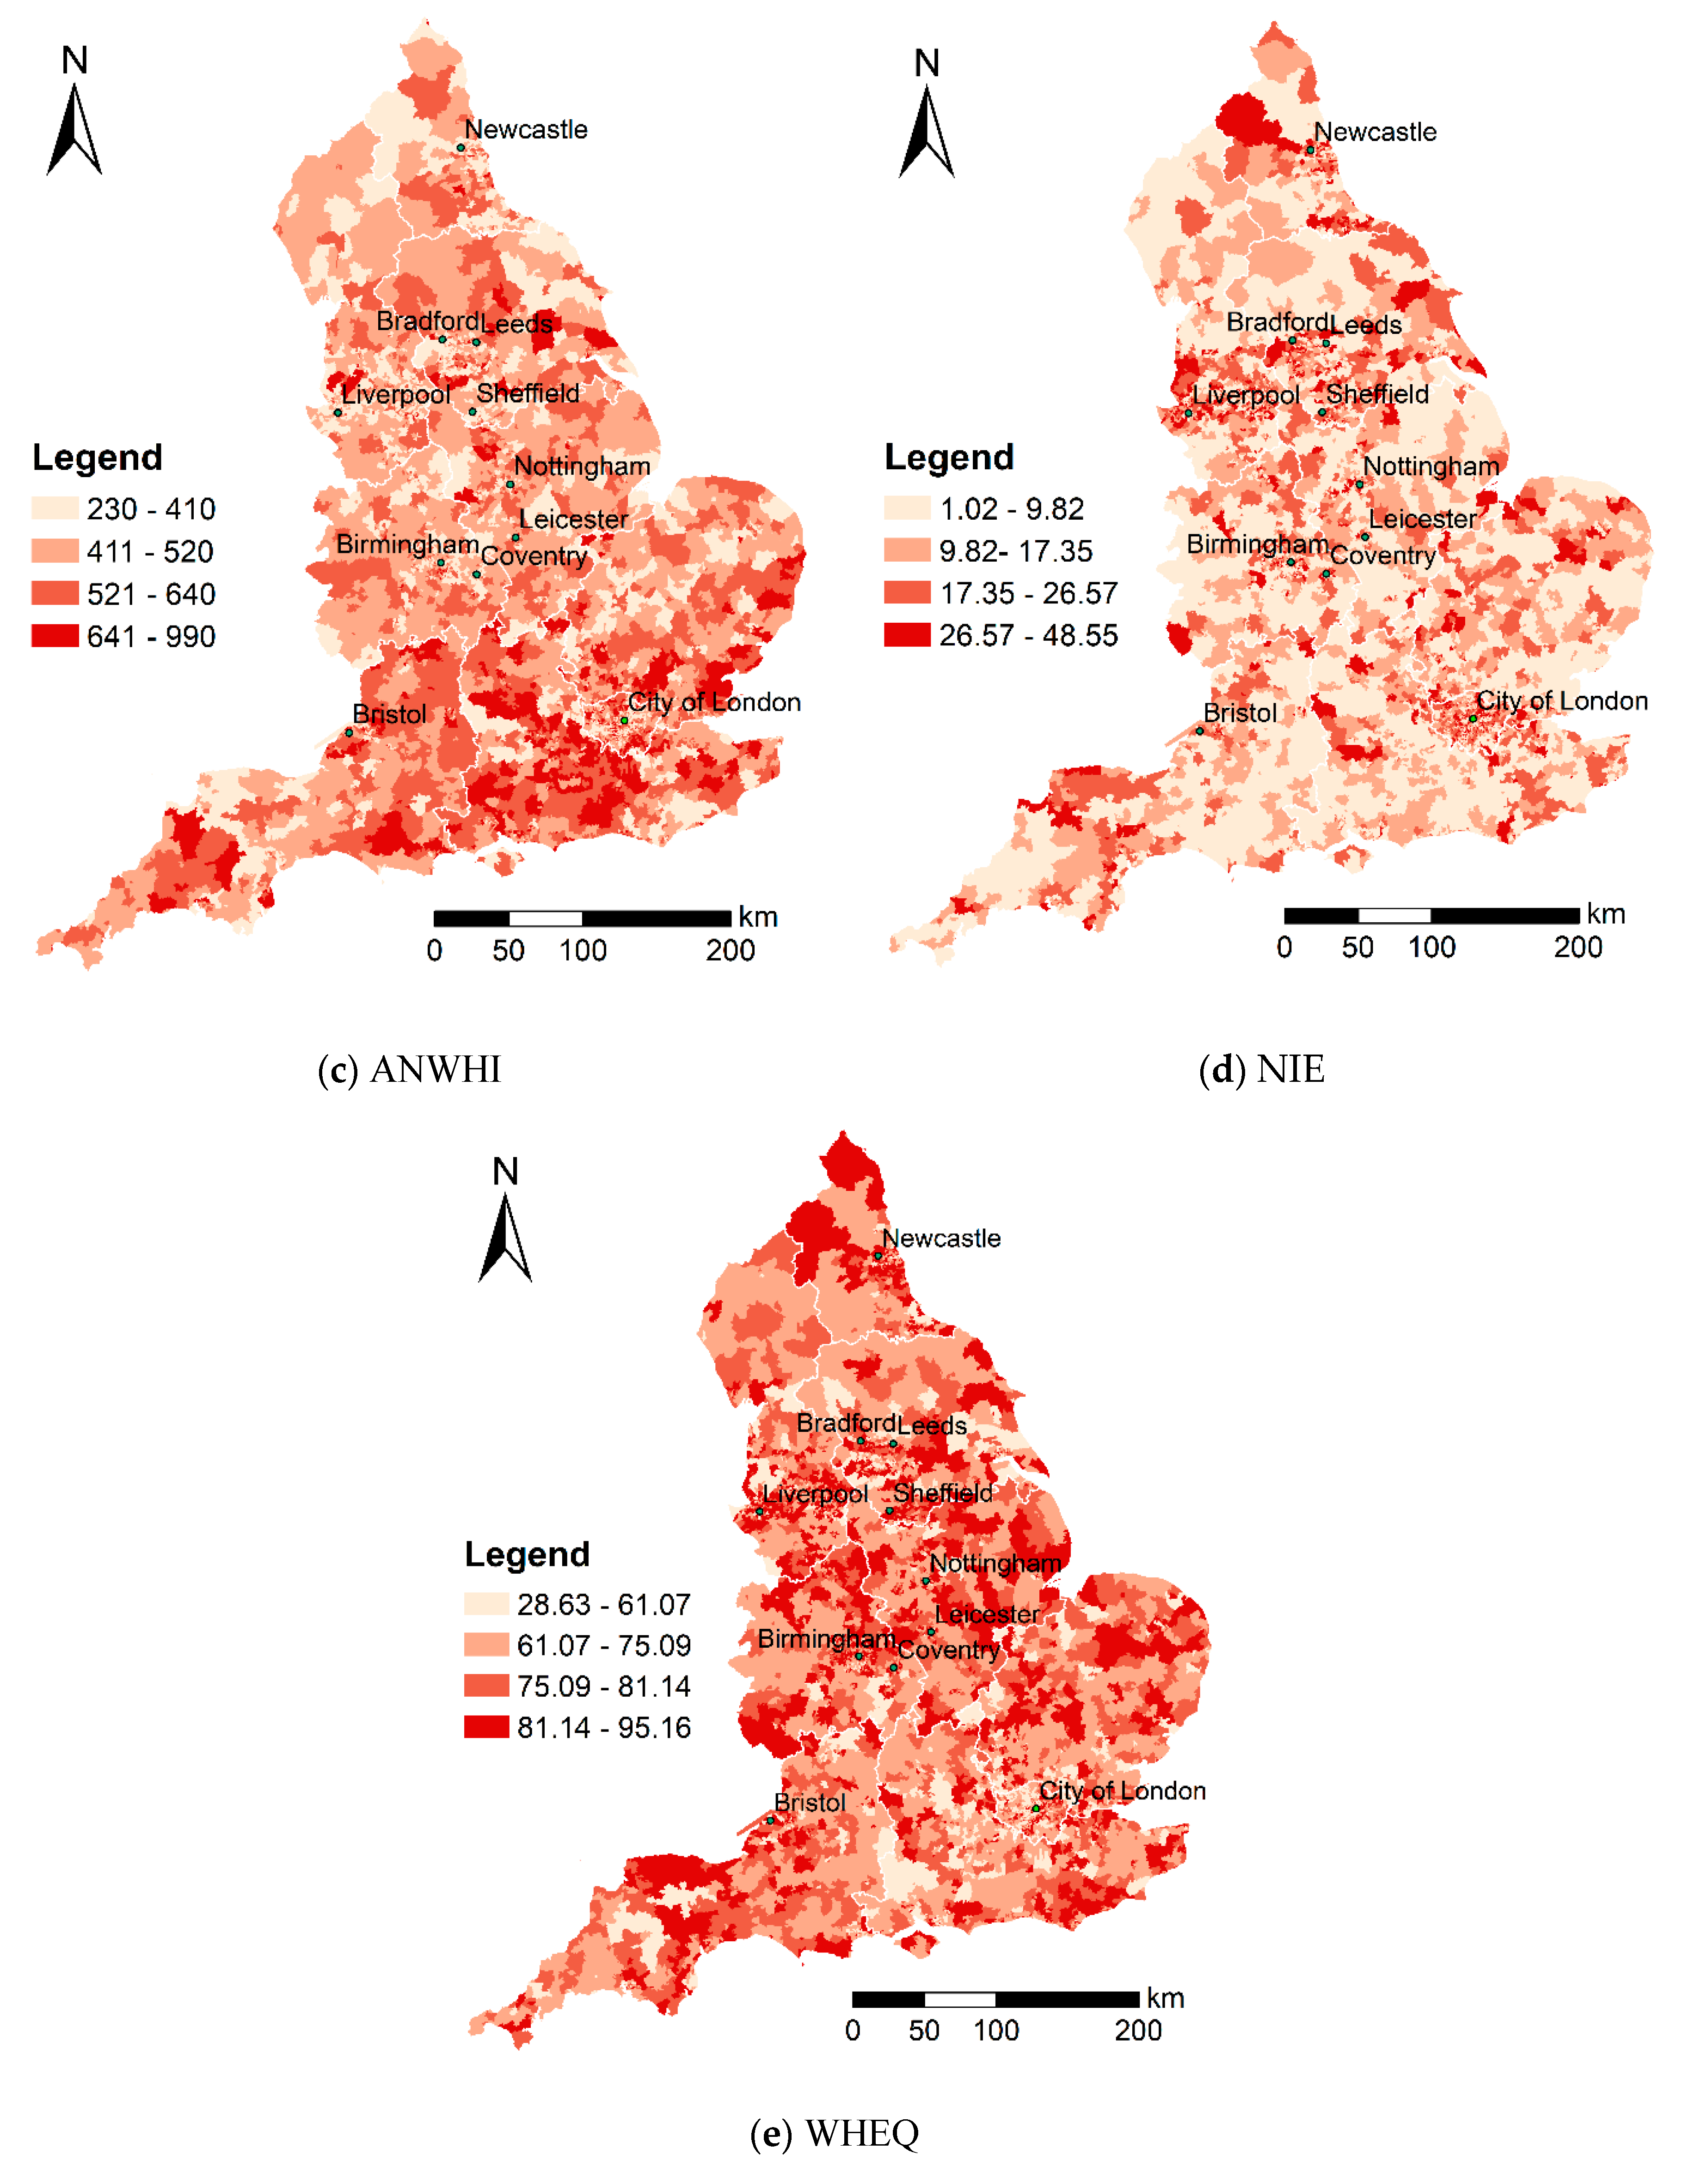
In this study, we attempted to examine the associations of accessibility factors and the prevalence of childhood obesity after controlling for socioeconomic factors. Table 1 lists the explanatory variables used in the model. In previous studies, childhood obesity prevalence was thought to be associated with the following socioeconomic factors: population density [13], non-white ethnicity [17], unemployment level [18], household income level [19,20,21,22], and educational level [13,23]. Table 2 shows the statistical descriptions for the variables in this study. Besides, Figure 2 maps the MSOA-level spatial distribution of the explanatory variables across England. Figure 1 and Figure 2 show that spatial inequalities exist in childhood obesity prevalence, as well as socioeconomic factors (explanatory variables).
2.3.2. Model Selection and Estimation
First of all, it is necessary to test whether residual spatial autocorrelation exists in the non-spatial regression model estimated initially. If there is a statistically significant presence of residual spatial autocorrelation, spatial regression models are recommended; otherwise, non-spatial regression models are recommended. Likewise, Moran’s I statistic is used to measure spatial dependence in the residuals of the non-spatial regression model estimated initially.
In this study, we select two newly developed specifications of spatial regression models. One is a spatial autoregressive (SAR) model and the other is an eigenvector spatial filtering (ESF) model. Specifically, we use two specifications of spatial regression models: the matrix exponential spatial specification of spatial autoregressive model (MESS-SAR model) and the random effects specification of eigenvector spatial filtering model (RES-ESF model).
Spatial autoregressive model (MESS-SAR model): the matrix exponential spatial specification (MESS) model has analytical, computational, and interpretive advantages over conventional spatial autoregressive models [24]. Additionally, the MESS-SAR model produces R2 values, which are direct measures of the explanation capacity of the model, whilst conventional spatial regression models do not. The coefficients estimated in the MESS-SAR model are usually similar to those in OLS models, but residual spatial correlation is much lower [11,24].
Eigenvector spatial filtering model (FRES-ESF): although eigenvector spatial filtering (ESF) models are likely to outperform spatial autoregressive models, they are computationally demanding and therefore not appropriate for large datasets [25]. Furthermore, a random effects specification of ESF (RES-ESF) has been developed because of its usefulness for spatial dependence analysis considering spatial confounding [26], but its computational demand is still high and therefore not appropriate for large datasets. In recent years, a fast random effects specification of ESF (FRES-ESF) has been developed for large datasets [25]. FRES-ESF performs well in some applications of urban and regional studies, ecological studies, and so on [25]. Likewise, the FRES-ESF model produces R2 values as well.
In this study, the model selection and estimation are all implementable in R. Specifically, OLS model estimation, Moran’s I test, MESS-SAR model estimation, and RES-ESF model estimation are supported by four R packages, named “stats”, “spdep”, “spatialreg”, and “spmoran”.
3. Results
In this section, the empirical results are presented. Firstly, spatial patterns of childhood obesity prevalence are explored. Then, spatial associations of childhood obesity prevalence and socioeconomic factors are investigated. Finally, we discuss the empirical results and link the findings to policy implications.
3.1. Spatial Patterns of Childhood Obesity Prevalence
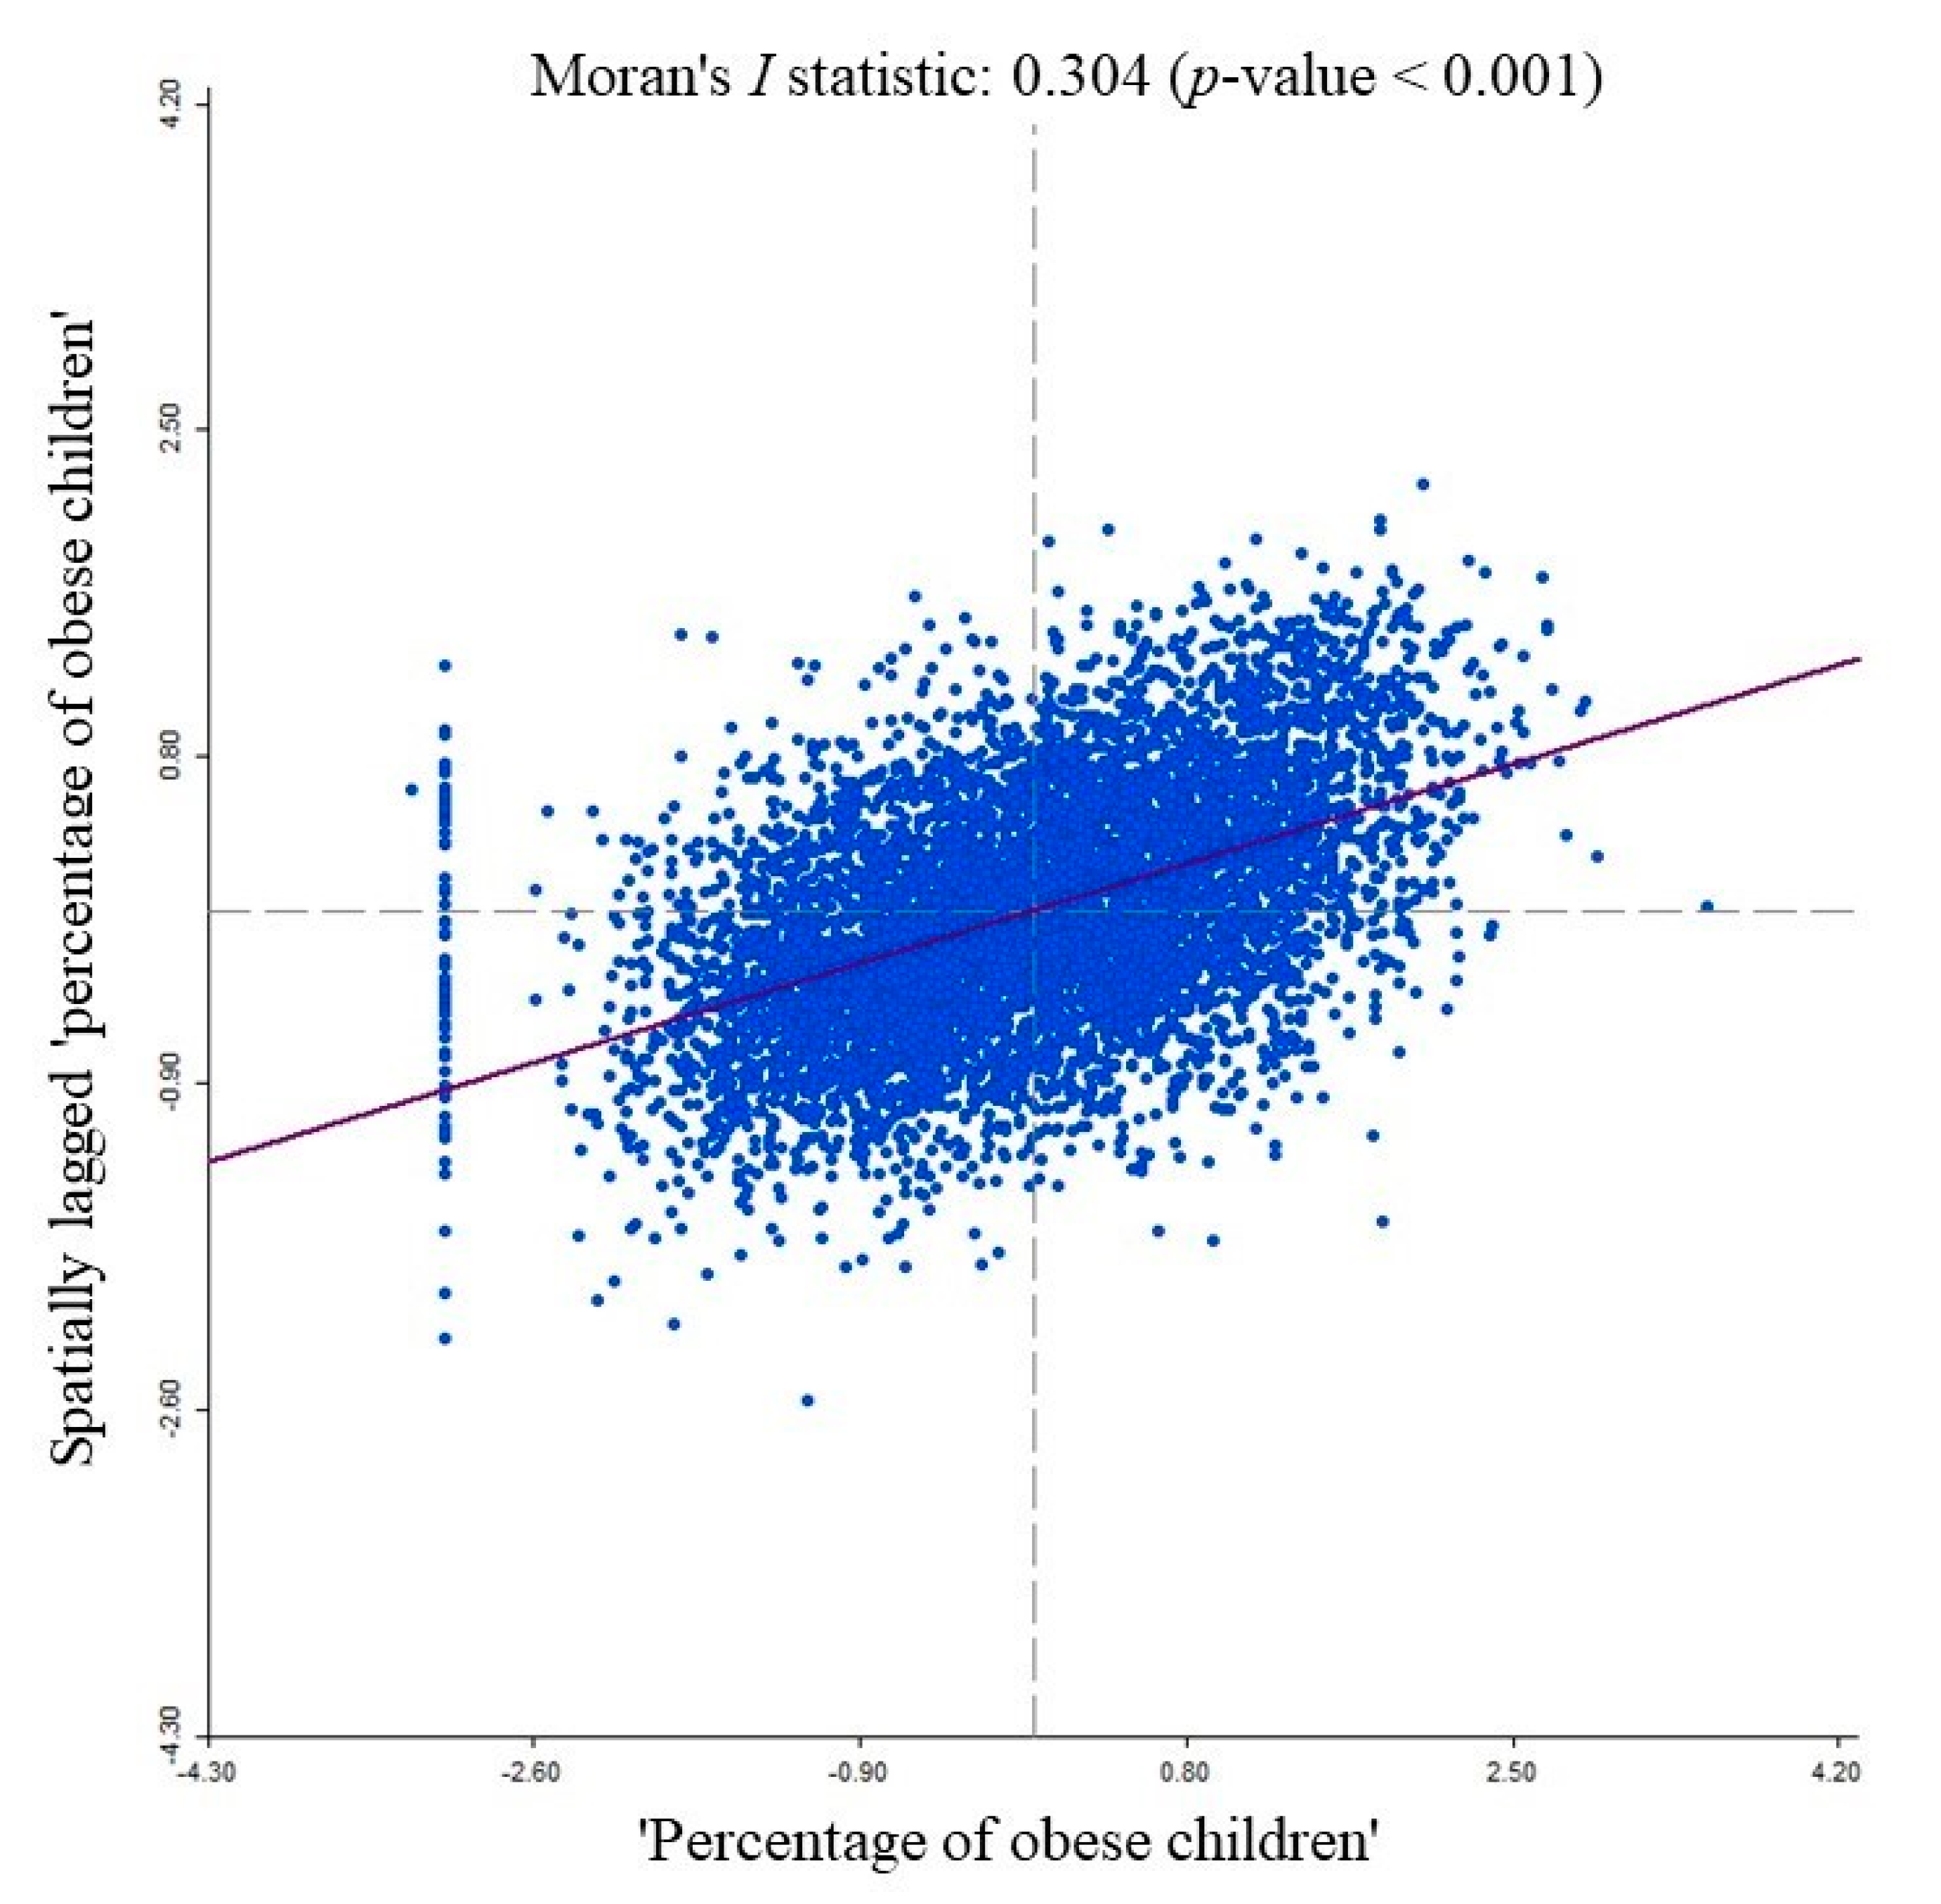
From Figure 1, we are not able to derive clear findings on spatial patterns of childhood obesity prevalence across England. Therefore, we tested whether spatial autocorrelation exists significantly in childhood obesity prevalence across England. In this study, global and local forms of Moran’s I statistic were computed and simulated according to 6791 observations (6791 MSOAs). First, we explored global spatial autocorrelation in childhood obesity prevalence across England. Figure 3 shows a global Moran scatterplot of the MSOA-level “percentage of obese children” across England. A global Moran’s I statistic value of 0.304 and a p-value of less than 0.001 indicate a statistically significant presence of global spatial autocorrelation in childhood obesity prevalence across England (see Figure 3). A significantly positive Moran’s I statistic value (0.304) indicates that observations at spatially close locations tend to have similar values. Specifically, some MSOAs with a high-value “percentage of obese children” are neighboured by MSOAs with a high-value “percentage of obese children” and some MSOAs with a low-value “percentage of obese children” are neighboured by MSOAs with a low-value “percentage of obese children” across England.
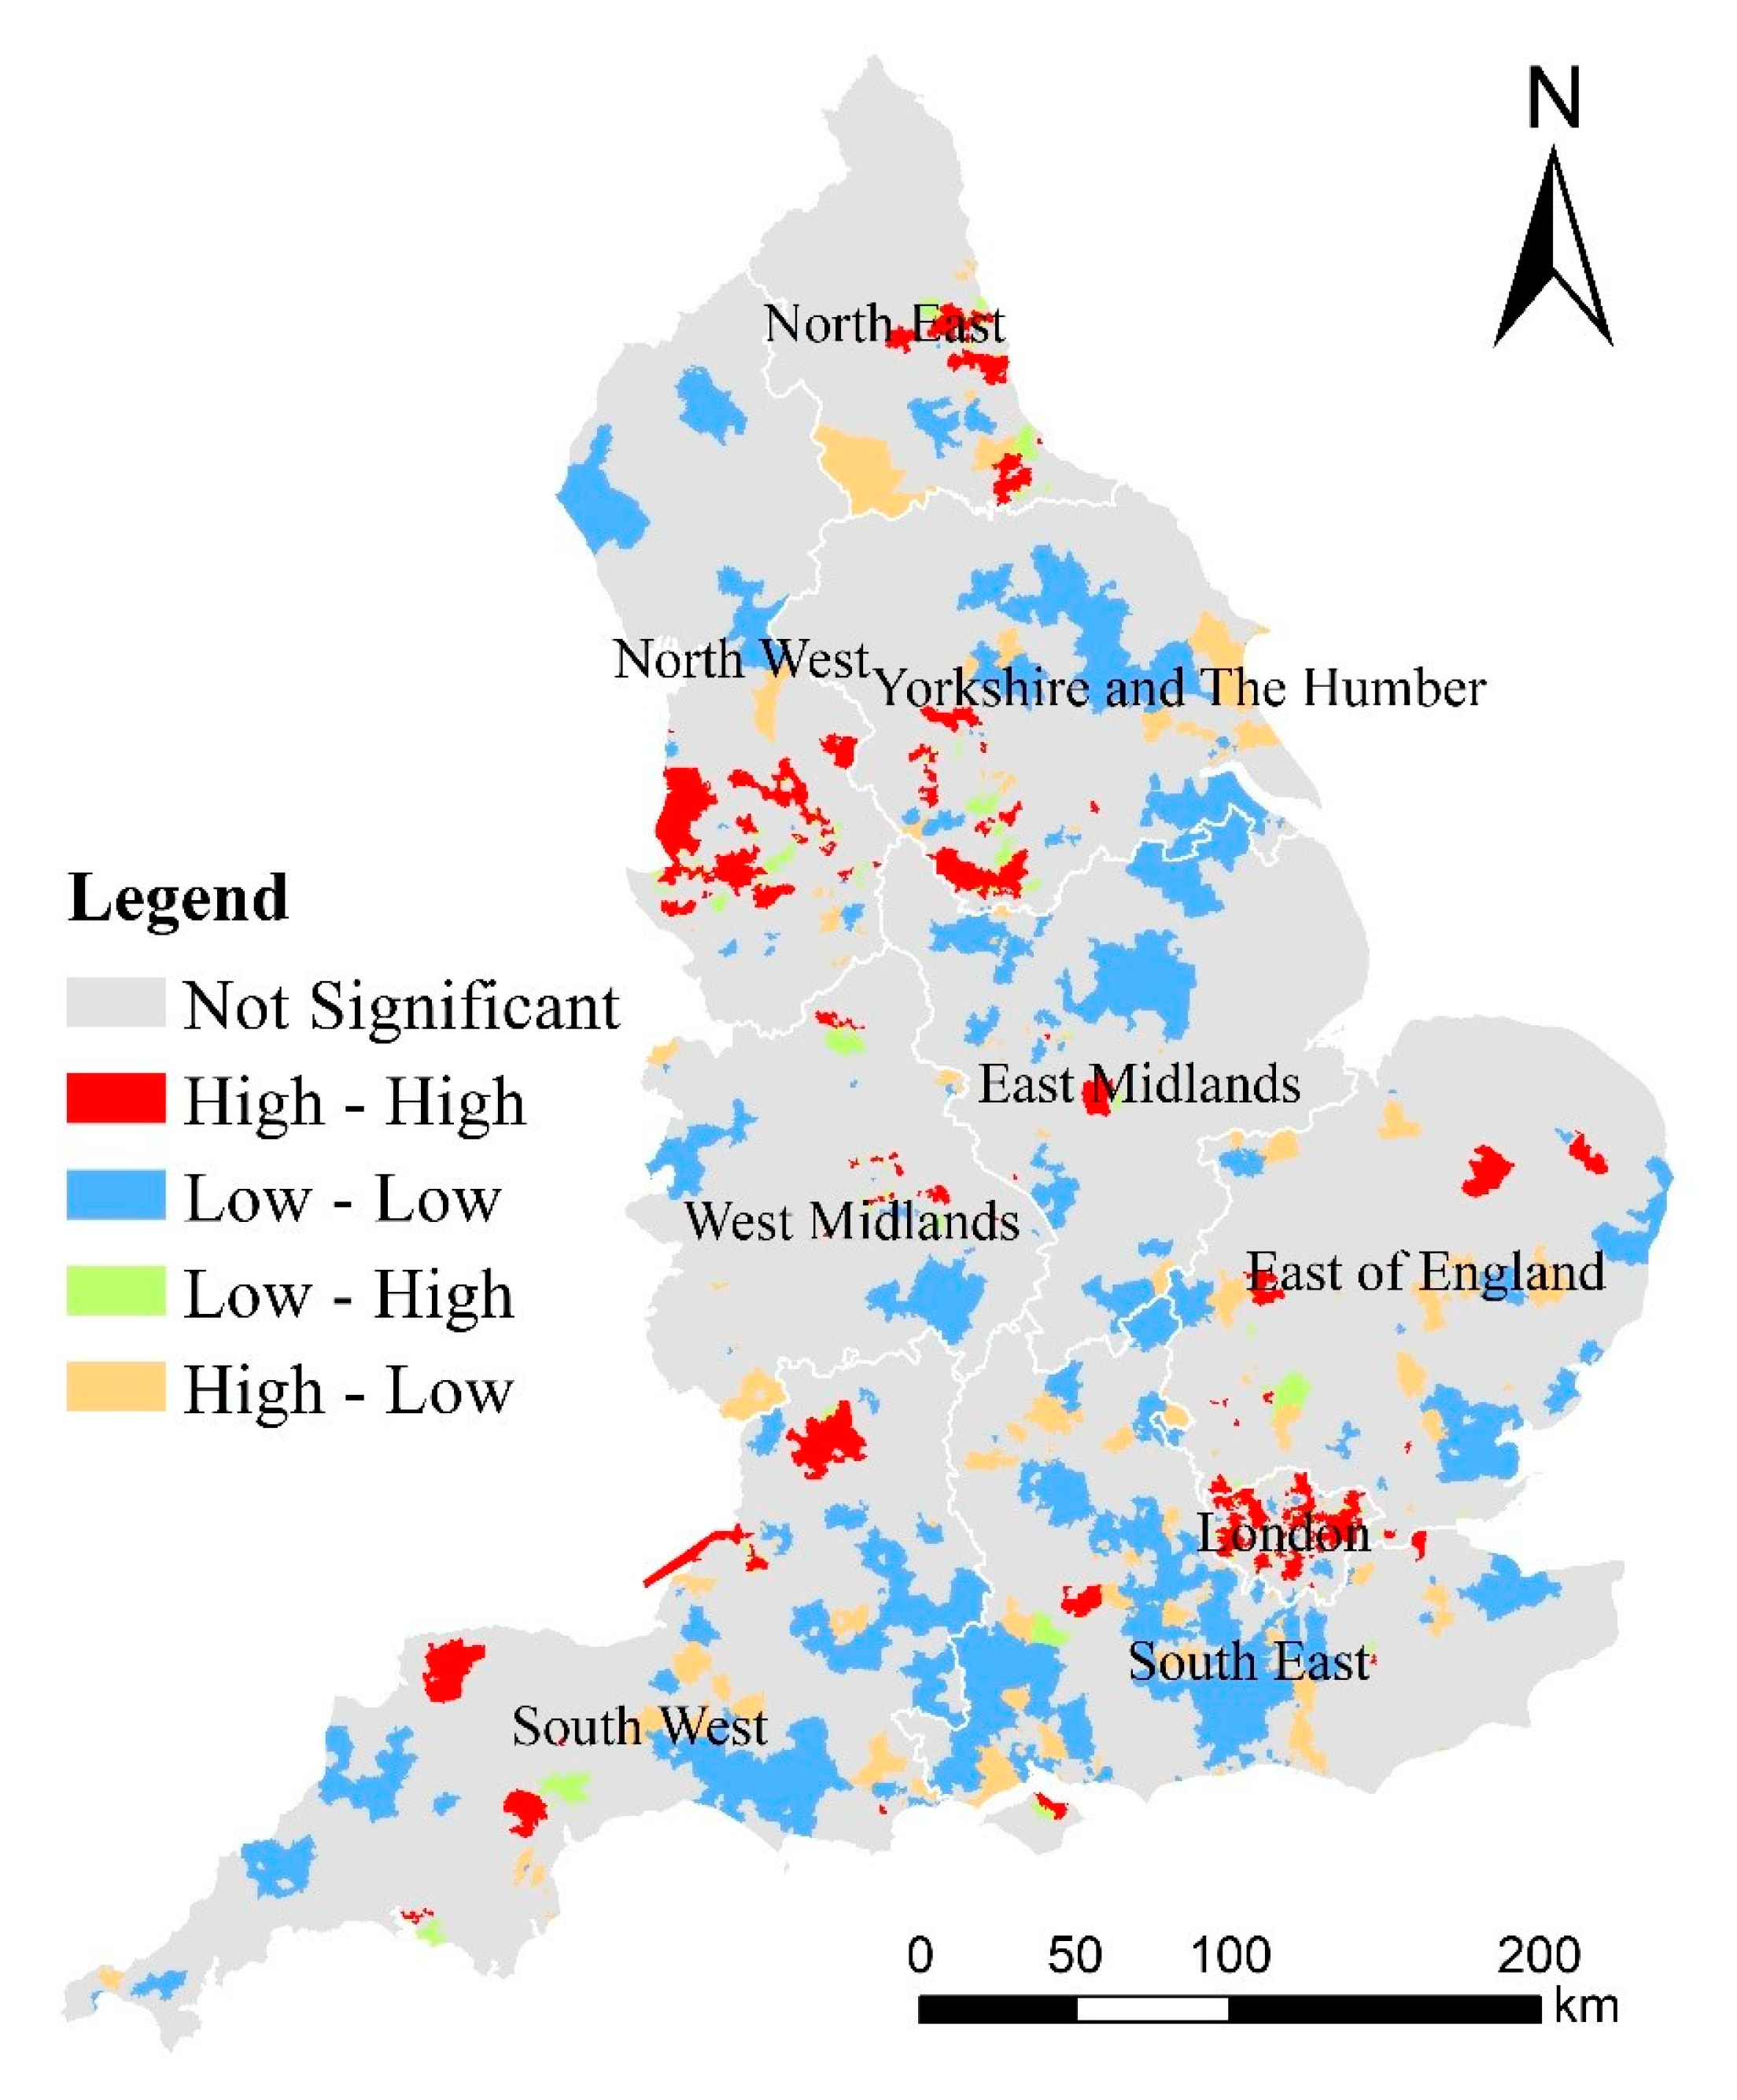
Moreover, we explored local spatial autocorrelation in childhood obesity prevalence across England. England consists of nine regions: East of England, London, North West, North East, East Midlands, Yorkshire and the Humber, South West, West Midlands, and South East. Figure 4 shows clusters and outliers of the MSOA-level “percentage of obese children” across the regions of England. Specifically, clusters (“High-High” or “Low-Low”) indicate MSOAs with a high-value “percentage of obese children” that are neighboured by MSOAs with a high-value “percentage of obese children” or MSOAs with a low-value “percentage of obese children” that are neighboured by MSOAs with a low-value “percentage of obese children”, whilst outliers (“Low-High” or “High-Low”) indicate MSOAs with a low-value “percentage of obese children” that are neighboured by MSOAs with a high-value “percentage of obese children” or MSOAs with a high-value “percentage of obese children” that are neighboured by MSOAs with a low-value “percentage of obese children” (see Figure 4). In this study, we focused on high-obesity clusters (“High-High”) and low-obesity clusters (“Low-Low”). High-obesity clusters and low-obesity clusters tend to concentrate around some regions. Particularly, one large concentration of high-obesity clusters occurs around London and another large concentration occurs around the southern part of the North West, whilst the greatest concentration of low-obesity clusters occurs in the South East.
3.2. Spatial Associations of Childhood Obesity Prevalence and Socioeconomic Factors
Firstly, the test for spatial dependence in regression models is presented. Then, models are estimated and compared to search for the most appropriate model.
3.2.1. Test Results for the Presence of Spatial Autocorrelation in the Residuals of an OLS Model
First of all, an OLS model was initially estimated according to 6791 observations (6791 MSOAs). A Moran’s I test was implemented to conduct testing for spatial dependence in the non-spatial regression model (i.e., OLS model) estimated initially. Table 3 shows the results of the Moran’s I testing results for spatial dependence in the non-spatial regression model. A positive observed value of global Moran’s I statistic and a p-value of less than 0.001 indicate the statistically significant presence of spatial dependence in the residuals of the OLS model estimated initially. This suggests that the spatial regression model appears to be more appropriate than the non-spatial model (i.e., OLS model).
3.2.2. Model Selection and Estimation
Subsequently, two spatial regression models were estimated according to 6791 observations (6791 MSOAs). Table 4 lists the estimation results for the regression models estimated. Despite having an Akaike information criterion (AIC) value slightly higher than that of the MESS-SAR model, the FRES-ESF model has the highest R2 value. Therefore, the FRES-ESF model appears to outperform the MESS-SAR model as well the OLS model. In addition, variance inflation factor (VIF) values for all the explanatory variables are below 10, which indicate that no serious multicollinearity exists in the models estimated. This means all the explanatory variables (predictors) are not highly correlated to each other.
We examined the associations of explanatory and responding variables. All the socioeconomic factors are statistically significantly associated with the child obesity rate. The directions of the associations of socioeconomic factors and child obesity rate in all the models are the same. Specifically, population density (PD), non-white population percentage (NW), percentage of households with dependent children not in employment (NIE), and percentage of adults without higher education qualifications (WHEQ) are all positively and significantly associated with the rate of childhood obesity over space, and average net weekly household income after housing costs (ANWHI) is negatively and significantly associated with the rate of childhood obesity over space. This indicates that local areas with high population density, low household disposable income, high unemployment, or low education level are likely to have a high childhood obesity prevalence.
4. Discussion and Policy Implications
By combining Figure 2, Figure 4, and Table 4, we can find that the concentration of high-obesity clusters is likely to occur in areas of lower SES. Typically, one large concentration around London and another around the southern part of the North West are likely to be areas of lower SES (e.g., higher levels of PD, NW, and NIE, as well as lower levels of ANWHI). The main concentration of low-obesity clusters around the South East is likely to be areas of higher SES (e.g., lower levels of PD, NW, and NIE, as well as higher levels of ANWHI).
In this study, the findings on associations of socioeconomic factors and childhood obesity prevalence are consistent with previous studies [13,17,18,19,20,21,22]. Specifically, childhood obesity prevalence was thought to be positively associated with population density [13], non-white ethnicity [17], and unemployment level [18], whilst it was thought to be negatively associated with household income level [20,21,22] and educational level [13,23]. High population density, non-white ethnicity, low income level, unemployment level, and low educational level indicate low SES. Previous studies indicate that children living in socioeconomically disadvantaged families or communities are more likely to be obese than other children [13,17,20,22]. This study further indicates that children living in areas with lower SES are at higher risk of obesity. This study suggests that effectively reducing spatial inequalities in socioeconomic status will play a vital role in mitigating spatial inequalities in childhood obesity prevalence.
Socioeconomic factors are theoretically thought to have an indirect impact on childhood obesity risk through influencing behavioural factors which have direct impact. Children living in families or communities with lower SES are more likely to exhibit poorer dietary behaviours and less physical activity, thereby contributing to an increase in obesity risk [21]. On the one hand, families with a lower socioeconomic position are likely to spend less on children’s health promotion through food choice and increased physical activity and to neglect health education, which can contribute to shaping daily behaviours towards a healthier lifestyle. On the other hand, communities with a lower socioeconomic position are likely to have less access to healthier food and recreational facilities [27,28], leading local children to consume less healthy food and to take part in less physical activity due to a preference for a sedentary lifestyle. Besides, population density is positively associated with the childhood obesity prevalence found in this study. This finding is consistent with previous findings on the impact of urbanisation on childhood obesity prevalence. Urbanisation leads to the spatial concentration of people adopting unhealthy lifestyles (e.g., an unhealthy diet or decreased physical activity), thereby putting residents, including adults and children, at increased risk of obesity [29].
Socioeconomic variables can affect long-term health and body weight through different causal pathways and at the individual, household and neighbourhood levels [12]. As MSOAs have been widely used to represent neighbourhood-level areas in UK studies [30,31,32], this study offers new empirical evidence on the associations of neighbourhood-level SES and childhood obesity [32,33,34]. To effectively mitigate spatial inequalities in childhood obesity prevalence across England, the government should continue to reduce inequalities in SES at the neighbourhood level. Moreover, neighbourhood-level interventions, e.g., promoting access to supermarkets, green spaces, and recreational facilities [35,36], should prioritise the areas with lower SES across England.
5. Conclusions
This study first explored spatial patterns of childhood obesity prevalence, and subsequently investigated the spatial associations of socioeconomic factors and childhood obesity prevalence across England. Moreover, we selected and estimated appropriate regression models to investigate the associations. Consequently, the FRES-ESF model appears to be the optimal one. Empirical results indicate that positive spatial dependence (spatial autocorrelation) is found to exist in childhood obesity prevalence and that socioeconomic factors are found to be significantly associated with childhood obesity prevalence across England. Specifically, (1) one large concentration of high-obesity clusters occurs around London and another large concentration occurs around the southern part of the North West; (2) the greatest concentration of low-obesity clusters occurs in the South East; (3) “population density”, “non-white population percentage”, “percentage of households with dependent children not in employment”, and “percentage of adults without higher education qualifications” are all positively and significantly associated with the rate of childhood obesity over space; and (4) “average net weekly household income after housing costs” is negatively and significantly associated with the rate of childhood obesity over space. In England, children living in areas with lower SES are at higher risk of obesity. Besides, the positive association of population density and childhood obesity prevalence offers new evidence on the impact of urbanisation on the increased childhood obesity prevalence. To effectively mitigate spatial inequalities in childhood obesity prevalence across England, we suggest that the implementation of neighbourhood-level interventions (e.g., promoting to supermarkets, green spaces, and recreational facilities) should prioritise areas with lower SES.
6. Limitations and Future Work
There are some limitations to this study. First, genetic factors which are not easily observed or measured were not considered due to the lack of relevant data. Second, some behavioural factors, such as fat and sugar intake, fruit and vegetable consumption, sleep duration, breastfeeding, and maternal smoking in pregnancy, are likely to be associated with childhood obesity level [37,38,39,40,41,42,43,44,45]. Those behavioural factors were not considered in this study due to the lack of data as well. Third, the data of NIE and WHEQ used are for 2011 and the other data are for 2014. There exists a time gap which might have had a potential influence on the model estimates.
In future research, some aspects should be considered for further study. First, we could incorporate some behavioural factors into the analysis if a country-wide health survey (e.g., the Health Survey for England) released health-related behaviour data (https://digital.nhs.uk/data-and-information/publications/statistical/health-survey-for-england/2018). For instance, the Health Survey for England interviewed thousands of households across England and covered the following topics: overweight and obesity, health-related behaviours, and so forth. Second, we could further conduct a metropolis-wide or city-wide investigation of spatial associations of socioeconomic factors and obesity prevalence to offer place-specific policy implications. Third, as this study used a cross-sectional dataset, we could attempt to use panel data accounting for temporal variations of childhood obesity prevalence once relevant data are available in the future.
Author Contributions
Conceptualisation, Yeran Sun, Xuke Hu, Ying Huang; Methodology, Yeran Sun; Formal analysis and investigation, Yeran Sun; Writing—original draft preparation, Yeran Sun, Xuke Hu, Ying Huang; Writing—review and editing, Yeran Sun, Xuke Hu, Ting On Chan; Funding acquisition, Yeran Sun, Ying Huang; Resources, Yeran Sun, Ying Huang. All authors have read and agreed to the published version of the manuscript.
Funding
This work is supported by the Fundamental Research Funds for the Central Universities (Grant No. 37000-31610445 and 37000-31610453), China.
Acknowledgments
We are thankful to the anonymous reviewers for their helpful comments.
Conflicts of Interest
The authors declare no conflict of interest.
References
- World Health Organization. Taking Action on Childhood Obesity; World Health Organization: Geneva, Switzerland, 2018; pp. 1–7. [Google Scholar]
- Singh, G.K.; Siahpush, M.; Kogan, M.D. Rising social inequalities in US childhood obesity, 2003–2007. Ann. Epidemiol. 2010, 20, 40–52. [Google Scholar] [CrossRef]
- Wang, Y.; Lim, H. The global childhood obesity epidemic and the association between socio-economic status and childhood obesity. Int. Rev. Psychiatry 2012, 24, 176–188. [Google Scholar] [CrossRef] [PubMed] [Green Version]
- Chung, A.; Backholer, K.; Wong, E.; Palermo, C.; Keating, C.; Peeters, A. Trends in child and adolescent obesity prevalence in economically advanced countries according to socioeconomic position: A systematic review. Obes. Rev. 2016, 17, 276–295. [Google Scholar] [CrossRef] [PubMed]
- Lobstein, T.; Baur, L.; Uauy, R. Obesity in children and young people: A crisis in public health. Obes. Rev. 2004, 5, 4–85. [Google Scholar] [CrossRef] [PubMed]
- McLaren, L. Socioeconomic status and obesity. Epidemiol. Rev. 2007, 29, 29–48. [Google Scholar] [CrossRef] [Green Version]
- Department of Health Public Health Research Consortium; Law, C.; Power, C.; Graham, H.; Merrick, D. Obesity and health inequalities. Obes. Rev. 2007, 8, 19–22. [Google Scholar] [CrossRef]
- Peeters, A.; Backholer, K. Prioritising and tackling socio-economic inequalities in obesity. BMC Obes. 2014, 1, 16. [Google Scholar] [CrossRef] [Green Version]
- Chi, G.; Zhu, J. Spatial regression models for demographic analysis. Popul. Res. Policy Rev. 2008, 27, 17–42. [Google Scholar] [CrossRef]
- Anselin, L. Spatial Econometrics: Methods and Models; Springer Science & Business Media: New York, NY, USA, 2013; Volume 4. [Google Scholar]
- LeSage, J.P.; Pace, R.K. Introduction to Spatial Econometrics; CRC Press: Boca Raton, FL, USA, 2009; Chapter 9. [Google Scholar]
- Drewnowski, A.; Rehm, C.D.; Arterburn, D. The geographic distribution of obesity by census tract among 59 767 insured adults in King County, WA. Int. J. Obes. 2014, 38, 833–839. [Google Scholar] [CrossRef] [Green Version]
- Chalkias, C.; Papadopoulos, A.G.; Kalogeropoulos, K.; Tambalis, K.; Psarra, G.; Sidossis, L. Geographical heterogeneity of the relationship between childhood obesity and socio-environmental status: Empirical evidence from Athens, Greece. Appl. Geogr. 2013, 37, 34–43. [Google Scholar] [CrossRef]
- Carroll-Scott, A.; Gilstad-Hayden, K.; Rosenthal, L.; Peters, S.M.; McCaslin, C.; Joyce, R.; Ickovics, J.R. Disentangling neighborhood contextual associations with child body mass index, diet, and physical activity: The role of built, socioeconomic, and social environments. Soc. Sci. Med. 2013, 95, 106–114. [Google Scholar] [CrossRef] [PubMed] [Green Version]
- GOV.UK. Child Obesity and Excess Weight: Small Area Level Data. 2019. Available online: https://www.gov.uk/government/statistics/child-obesity-and-excess-weight-small-area-level-data (accessed on 27 March 2019).
- Office for National Statistics. Small Area Model-Based Income Estimates, England and Wales: Financial Year Ending 2014. 2016. Available online: https://www.ons.gov.uk/peoplepopulationandcommunity/personalandhouseholdfinances/incomeandwealth/bulletins/smallareamodelbasedincomeestimates/financialyearending2014 (accessed on 16 December 2016).
- Williams, A.S.; Ge, B.; Petroski, G.; Kruse, R.L.; McElroy, J.A.; Koopman, R.J. Socioeconomic status and other factors associated with childhood obesity. J. Am. Board Fam. Med. 2018, 31, 514–521. [Google Scholar] [CrossRef] [Green Version]
- Oddo, V.M.; Nicholas, L.H.; Bleich, S.N.; Jones-Smith, J.C. The impact of changing economic conditions on overweight risk among children in California from 2008 to 2012. J. Epidemiol. Community Health 2016, 70, 874–880. [Google Scholar] [CrossRef] [PubMed]
- Evans, G.W.; Jones-Rounds, M.L.; Belojevic, G.; Vermeylen, F. Family income and childhood obesity in eight European cities: The mediating roles of neighborhood characteristics and physical activity. Soc. Sci. Med. 2012, 75, 477–481. [Google Scholar] [CrossRef] [PubMed]
- Rogers, R.; Eagle, T.F.; Sheetz, A.; Woodward, A.; Leibowitz, R.; Song, M.; Sylvester, R.; Corriveau, N.; Kline-Rogers, E.; Jiang, Q.; et al. The relationship between childhood obesity, low socioeconomic status, and race/ethnicity: Lessons from Massachusetts. Child. Obes. 2015, 11, 691–695. [Google Scholar] [CrossRef]
- Eagle, T.F.; Sheetz, A.; Gurm, R.; Woodward, A.C.; Kline-Rogers, E.; Leibowitz, R.; DuRussel-Weston, J.; Palma-Davis, L.; Aaronson, S.; Fitzgerald, C.M.; et al. Understanding childhood obesity in America: Linkages between household income, community resources, and children’s behaviors. Am. Heart. J. 2012, 163, 836–843. [Google Scholar] [CrossRef] [PubMed]
- Singh, G.K.; Kogan, M.D.; Van Dyck, P.C. Changes in state-specific childhood obesity and overweight prevalence in the United States from 2003 to 2007. Arch. Pediatr. Adolesc. Med. 2010, 164, 598–607. [Google Scholar] [CrossRef] [Green Version]
- Padez, C.; Mourao, I.; Moreira, P.; Rosado, V. Long sleep duration and childhood overweight/obesity and body fat. Am. J. Hum. Biol. 2009, 21, 371–376. [Google Scholar] [CrossRef]
- LeSage, J.P.; Pace, R.K. A matrix exponential specification. J. Econom. 2007, 140, 190–214. [Google Scholar] [CrossRef]
- Murakami, D.; Griffith, D.A. Eigenvector spatial filtering for large data sets: Fixed and random effects approaches. Geogr. Anal. 2019, 51, 23–49. [Google Scholar] [CrossRef] [Green Version]
- Murakami, D.; Griffith, D.A. Random effects specifications in eigenvector spatial filtering: A simulation study. J. Geogr. Syst. 2015, 17, 311–331. [Google Scholar] [CrossRef]
- Neelon, S.E.; Burgoine, T.; Gallis, J.A.; Monsivais, P. Spatial analysis of food insecurity and obesity by area-level deprivation in children in early years settings in England. Spat. Spatio-Temporal Epidemiol. 2017, 23, 1–9. [Google Scholar] [CrossRef] [PubMed]
- Nackers, L.M.; Appelhans, B.M. Food insecurity is linked to a food environment promoting obesity in households with children. J. Nutr. Educ. Behav. 2013, 45, 780–784. [Google Scholar] [CrossRef] [PubMed]
- Miao, J.; Wu, X. Urbanization, socioeconomic status and health disparity in China. Health Place 2016, 42, 87–95. [Google Scholar] [CrossRef]
- Stein, R.E. Neighborhood Scale and Collective Efficacy: Does Size Matter? Sociol. Compass 2014, 8, 119–128. [Google Scholar] [CrossRef]
- Vandecasteele, L.; Fasang, A.E. Neighbourhoods, networks and unemployment: The role of neighbourhood disadvantage and local networks in taking up work. Urban Stud. 2020, 24, 0042098020925374. [Google Scholar] [CrossRef]
- Grow, H.M.; Cook, A.J.; Arterburn, D.E.; Saelens, B.E.; Drewnowski, A.; Lozano, P. Child obesity associated with social disadvantage of children’s neighborhoods. Soc. Sci. 2010, 71, 584–591. [Google Scholar]
- Wood, S.L.; Demougin, P.R.; Higgins, S.; Husk, K.; Wheeler, B.W.; White, M. Exploring the relationship between childhood obesity and proximity to the coast: A rural/urban perspective. Health Place 2016, 40, 129–136. [Google Scholar] [CrossRef] [Green Version]
- Kim, Y.; Cubbin, C.; Oh, S. A systematic review of neighbourhood economic context on child obesity and obesity-related behaviours. Obes. Rev. 2019, 20, 420–431. [Google Scholar] [CrossRef]
- Edwards, K.L.; Clarke, G.P.; Ransley, J.K.; Cade, J. The neighbourhood matters: Studying exposures relevant to childhood obesity and the policy implications in Leeds, UK. J. Epidemiol. Community Health 2010, 64, 194–201. [Google Scholar] [CrossRef]
- Burgoine, T.; Mackenbach, J.D.; Lakerveld, J.; Forouhi, N.G.; Griffin, S.J.; Brage, S.; Wareham, N.J.; Monsivais, P. Interplay of socioeconomic status and supermarket distance is associated with excess obesity risk: A UK cross-sectional study. Int. J. Environ. Res. Public Health. 2017, 14, 1290. [Google Scholar] [CrossRef] [PubMed] [Green Version]
- Ludwig, D.S.; Peterson, K.E.; Gortmaker, S.L. Relation between consumption of sugar-sweetened drinks and childhood obesity: A prospective, observational analysis. Lancet 2001, 357, 505–508. [Google Scholar] [CrossRef]
- James, J.; Thomas, P.; Cavan, D.; Kerr, D. Preventing childhood obesity by reducing consumption of carbonated drinks: Cluster randomised controlled trial. BMJ 2004, 328, 1237. [Google Scholar] [CrossRef] [PubMed] [Green Version]
- Epstein, L.H.; Gordy, C.C.; Raynor, H.A.; Beddome, M.; Kilanowski, C.K.; Paluch, R. Increasing fruit and vegetable intake and decreasing fat and sugar intake in families at risk for childhood obesity. Obes. Res. 2001, 9, 171–178. [Google Scholar] [CrossRef] [PubMed]
- Chen, X.; Beydoun, M.A.; Wang, Y. Is sleep duration associated with childhood obesity? A systematic review and meta-analysis. Obesity 2008, 16, 265–274. [Google Scholar] [CrossRef] [PubMed]
- Sekine, M.; Yamagami, T.; Handa, K.; Saito, T.; Nanri, S.; Kawaminami, K.; Tokui, N.; Yoshida, K.; Kagamimori, S. A dose–response relationship between short sleeping hours and childhood obesity: Results of the Toyama Birth Cohort Study. Child Care Health Dev. 2002, 28, 163–170. [Google Scholar] [CrossRef] [PubMed] [Green Version]
- Arenz, S.; Rückerl, R.; Koletzko, B.; von Kries, R. Breast-feeding and childhood obesity—A systematic review. Int. J. Obes. 2004, 28, 1247. [Google Scholar] [CrossRef] [PubMed] [Green Version]
- Armstrong, J.; Reilly, J.J. Breastfeeding and lowering the risk of childhood obesity. Lancet 2002, 359, 2003–2004. [Google Scholar] [CrossRef]
- Von Kries, R.; Toschke, A.M.; Koletzko, B.; Slikker, W., Jr. Maternal smoking during pregnancy and childhood obesity. Am. J. Epidemiol. 2002, 156, 954–961. [Google Scholar] [CrossRef] [Green Version]
- Toschke, A.; Koletzko, B.; Slikker, W.; Hermann, M.; von Kries, R. Childhood obesity is associated with maternal smoking in pregnancy. Eur. J. Pediatr. 2002, 161, 445–448. [Google Scholar] [CrossRef]
Figure 1.
Middle Super Output Area (MSOA)-level percentage of obese children in Year 6 (age 10–11 years) across England, 2013/14 to 2015/16.
Figure 1.
Middle Super Output Area (MSOA)-level percentage of obese children in Year 6 (age 10–11 years) across England, 2013/14 to 2015/16.

Figure 2.
MSOA-level spatial distribution of explanatory variables across England.


Figure 3.
Global Moran scatterplot of MSOA-level “percentage of obese children”.

Figure 4.
Clusters and outliers of MSOA-level “percentage of obese children” across the regions of England.
Figure 4.
Clusters and outliers of MSOA-level “percentage of obese children” across the regions of England.


Table 1.
Explanatory variables considered in the model.
| Variables | Full Names | Year |
|---|---|---|
| PD | Population density (persons/hectare) | 2014 |
| NW | Non-white population percentage | 2014 |
| ANWHI | Average net weekly household income after housing costs (£) | 2014 |
| NIE | Percentage of households with dependent children not in employment | 2011 |
| WHEQ | Percent of adults without higher education qualifications | 2011 |
Table 2.
Statistical description for the variables in this study.
| Variables | Mean | SD |
|---|---|---|
| Prevalence of childhood obesity | 18.62 | 5.75 |
| PD | 33.22 | 34.74 |
| NW | 13.66 | 18 |
| ANWHI | 496.22 | 113.14 |
| NIE | 13.83 | 8.62 |
| WHEQ | 72.91 | 11.42 |
Table 3.
Moran’s I test results for residual spatial dependence in the non-spatial model (i.e., ordinary least squares (OLS) model).
Table 3.
Moran’s I test results for residual spatial dependence in the non-spatial model (i.e., ordinary least squares (OLS) model).
| Observed Moran’s I | P-Value |
|---|---|
| 0.125 | <0.001 |
Table 4.
Estimation results for the regression models estimated.
| Coefficient | OLS | MESS-SAR (Matrix Exponential Spatial Specification of Spatial Autoregressive) | FRES-ESF (Fast Random Effects Specification of Eigenvector Spatial Filtering) |
|---|---|---|---|
| Intercept | 5.271 *** | 1.695 * | 6.205 *** |
| PD | 0.021 *** | 0.019 *** | 0.02 *** |
| NW | 0.077 *** | 0.067 *** | 0.072 *** |
| ANWHI | −0.007 *** | −0.005 *** | −0.008 *** |
| NIE | 0.172 *** | 0.167 *** | 0.150 *** |
| WHEQ | 0.172 *** | 0.169 *** | 0.174 *** |
| Adjusted R2 | 0.579 | 0.551 | 0.665 |
| Akaike information criterion (AIC) | 37,039 | 36,930 | 36,947 |
Note: “.”, “*”, and “***” mean the p-values are below 0.1, 0.05, 0.01, and 0.001, respectively.
© 2020 by the authors. Licensee MDPI, Basel, Switzerland. This article is an open access article distributed under the terms and conditions of the Creative Commons Attribution (CC BY) license (http://creativecommons.org/licenses/by/4.0/).
Share and Cite
MDPI and ACS Style
Sun, Y.; Hu, X.; Huang, Y.; On Chan, T. Spatial Patterns of Childhood Obesity Prevalence in Relation to Socioeconomic Factors across England. ISPRS Int. J. Geo-Inf. 2020, 9, 599. https://doi.org/10.3390/ijgi9100599
AMA Style
Sun Y, Hu X, Huang Y, On Chan T. Spatial Patterns of Childhood Obesity Prevalence in Relation to Socioeconomic Factors across England. ISPRS International Journal of Geo-Information. 2020; 9(10):599. https://doi.org/10.3390/ijgi9100599
Chicago/Turabian StyleSun, Yeran, Xuke Hu, Ying Huang, and Ting On Chan. 2020. "Spatial Patterns of Childhood Obesity Prevalence in Relation to Socioeconomic Factors across England" ISPRS International Journal of Geo-Information 9, no. 10: 599. https://doi.org/10.3390/ijgi9100599
Note that from the first issue of 2016, this journal uses article numbers instead of page numbers. See further details here.