Changes in Climate Extremes in Central Asia under 1.5 and 2 °C Global Warming and their Impacts on Agricultural Productions


1
Key Laboratory of Land Surface Pattern and Simulation, Institute of Geographic Sciences and Natural Resources Research, Chinese Academy of Sciences, Beijing 100101, China
2
College of Resources and Environment, University of Chinese Academy of Sciences, Beijing 101408, China
*
Author to whom correspondence should be addressed.
Atmosphere 2020, 11(10), 1076; https://doi.org/10.3390/atmos11101076
Submission received: 15 September 2020
/
Revised: 28 September 2020
/
Accepted: 3 October 2020
/
Published: 9 October 2020
(This article belongs to the Special Issue Impacts of Climate Change on Agricultural Productivity in Semi-Arid Regions)
Abstract
:Changes in climate extremes under 1.5 °C and 2 °C global warming may impact agricultural production across Central Asia. We used the simulated daily data of average temperature, maximum temperature, minimum temperature, and precipitation provided by the Inter-Sectoral Impact Model Intercomparison Project and analyzed the current climate status and future projected changes of a set of climate extreme indices related to agricultural production under 1.5 °C and 2 °C global warming. In addition, the possible impacts of climate change on agricultural production in Central Asia were discussed. The results show that the annual mean temperature in Central Asia will increase by 1.48 °C and 2.34 °C at 1.5 °C and 2 °C warming levels, respectively, compared to the base period (1986–2005), and the increasing trends are significant at the α = 0.01 level for all grids. The number of warm days and growing season length will increase. Under the 1.5 °C scenario, the mean annual total precipitation (PRCPTOT) and heavy precipitation (R95P) will experience increases of 7.68% and 26.55%, respectively, and the consecutive dry days (CDD) will be reduced by 1.1 days. However, the standardized precipitation evapotranspiration index (SPEI) shows significant drought conditions in most of Central Asia (more than 60%). Under the 2 °C scenario, there will be a 3.89% increase in PRCPTOT and a 24.78% increase in R95P. Nevertheless, accompanying the increase in CDD (0.8 day) and the decrease in SPEI, drought conditions will be further exacerbated. These results indicate that Central Asia is likely to face more severe ecological problems in the future, which will threaten the regional agricultural production and the food security. Therefore, adaptation strategies should be implemented immediately to mitigate the negative impacts of climate change on Central Asia’s agriculture.
1. Introduction
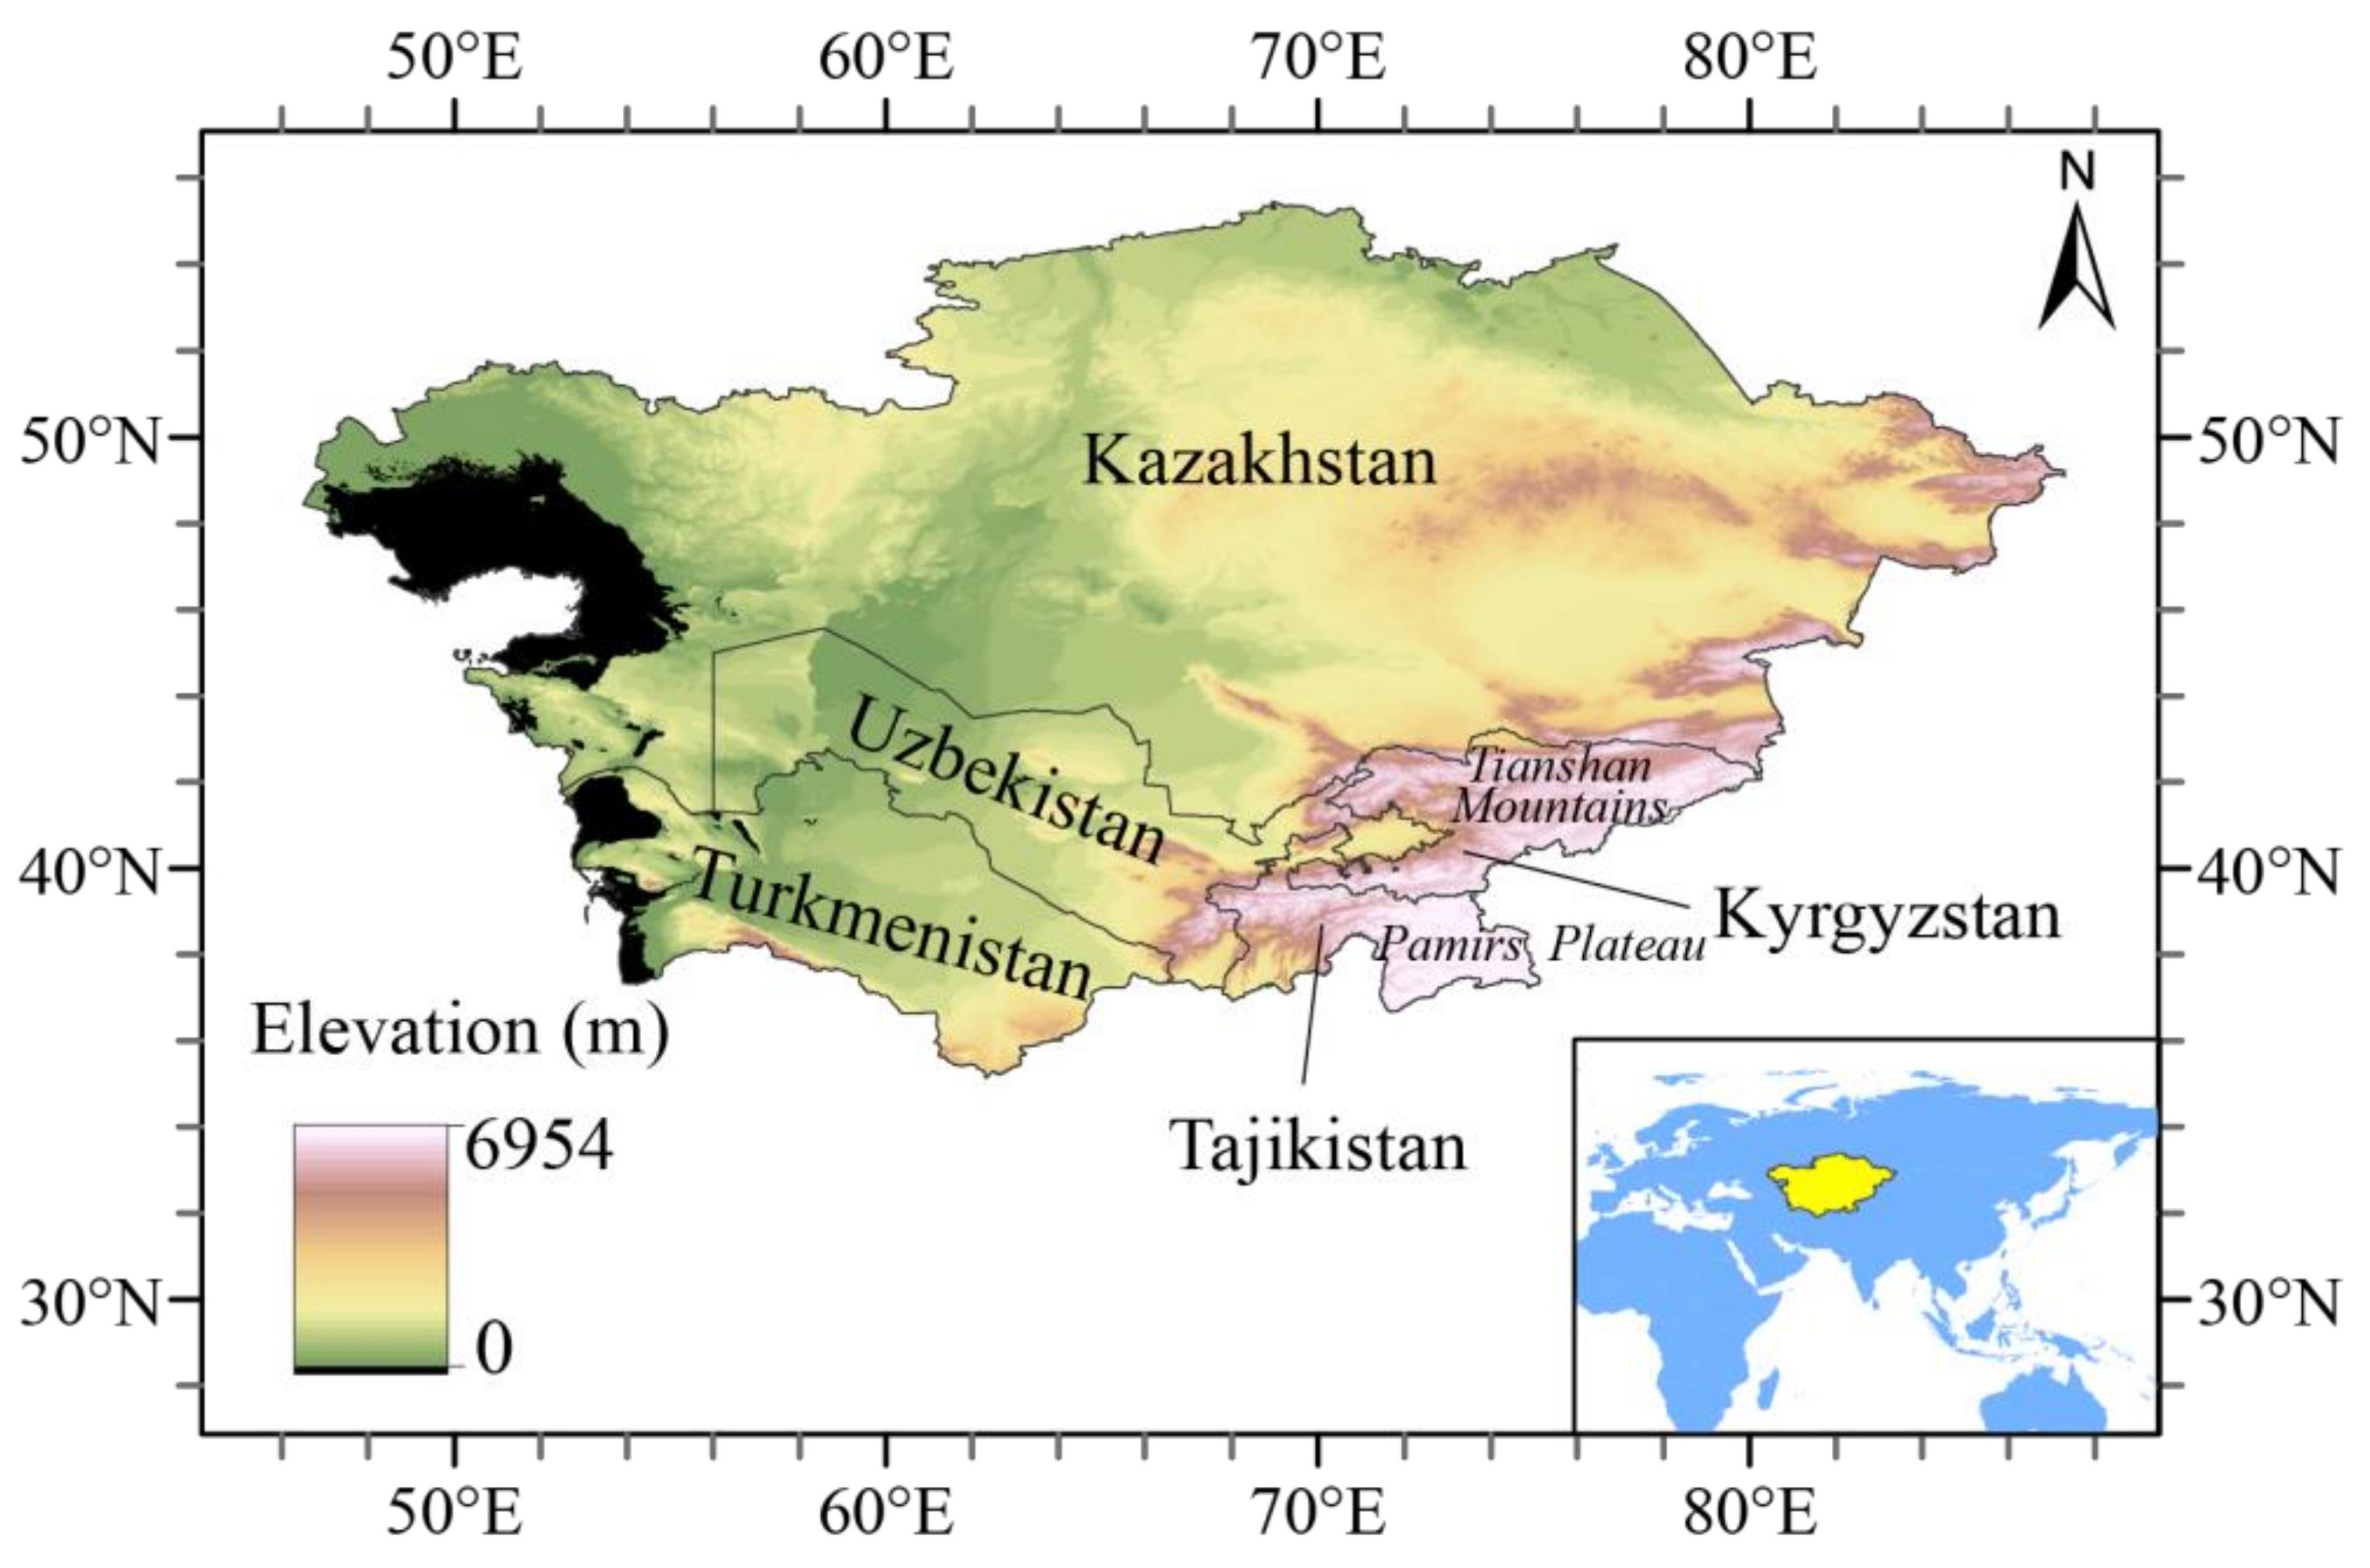
Central Asia, consisting of Kazakhstan, Kyrgyzstan, Tajikistan, Turkmenistan, and Uzbekistan, is located in arid and semi-arid areas of Eurasia, with a total area of near 400 million hectares and a total population of 73 million (UNdata, https://data.un.org/). The various landscapes from deserts and mountains are distributed from country to country, which include highest ridges of the Pamir in Tajikistan, the Tianshan Mountains in Kyrgyzstan, the vast Karakum Desert in Turkmenistan, the Syr-Darya in Kazakhstan, the Amu-Darya in Turkmenistan and Uzbekistan, and inland seas [1]; thus, only 20% of the area in Central Asia is suitable for farming. However, agriculture plays a key role in the regional economy via its contribution to incomes and employment [2]. Central Asia’s agriculture has had a large contribution to its gross domestic product; for example, Uzbekistan ranks the highest with a rate of 30.8%, and the rate is 21.9% in Tajikistan, whereas Kazakhstan ranks the lowest, with a rate of 4.7% [3]. In addition, the employment rate from the agricultural sector is high in all five countries, with 51.8% in Tajikistan, 33.9% in Uzbekistan, 29.4% in Kyrgyzstan, 23.3% in Turkmenistan, and 18.0% in Kazakhstan [3]. Therefore, understanding the frequency and intensity of extreme climate conditions closely related with the agricultural productions is critical to the social economy in Central Asia [4,5].
The impact of climate change on the agriculture has significant regional and seasonal differences. Previous studies showed that in the middle and high latitudes, a moderate increase in temperature (1–2 °C) will be beneficial to increase crop yields. However, in low latitudes, any increase of temperature will have an adverse impact on crop growth [6], especially in areas where temperatures are close to or at the optimal level [7,8,9,10]. Although some crops may benefit from carbon fertilization, the overall effect is negative when considering the climate change [11]. Central Asia is located in the arid mid-latitude region, and it shows a larger warming trend than the global average. The increases in temperature are projected to be the most pronounced in summer and winter, with the largest magnitudes of 5.0 °C and 5.4 °C, respectively, by the end of the century [12]. In recent decades, the maximum temperatures, minimum temperatures, diurnal temperature ranges, and some warm extreme indices (warm days and warm nights) have experienced significant increasing trends in Central Asia, which could accelerate the frequencies and magnitudes of temperature extremes, such as the warm days and heat waves [13]. The annual total precipitation and related extreme precipitation indices (such as the number of very heavy precipitation days and max 5-day precipitation amount) also exhibited increasing trends in most areas of Central Asia [14]. In addition, a drying trend was detected over the past decades [15,16], and relative to other countries, Turkmenistan and Uzbekistan have a higher risk of drought in Central Asia, especially in the desert region [17]. The increase in the frequency and intensity of climate extreme events with warming will expose agriculture to dramatic fluctuating agrometeorological conditions [18,19,20,21].
Recognizing the urgent and potentially irreversible threat to human societies caused by climate change, the participating member nations of the United Nations Framework Convention on Climate Change (UNFCCC) signed the Paris Agreement in December 2015 and set a long-term goal for climate protection as “holding the increase in the global average temperature to well below 2 °C above pre-industrial levels and pursuing efforts to limit the temperature increase to 1.5 °C” [22]. An increase in temperature of more than 1.5 °C will cause the global net primary productivity to level off or decrease [23], and any additional magnitudes of warming above 2 °C will increase the risk of severe, pervasive, and irreversible impacts. Therefore, the 2 °C of global warming should be seen as an upper limit instead of a “safe” limit [24]. Over Central Asia, some studies have carried out future projections of the mean temperature and precipitation change on seasonal or annual scale by global and regional climate models [25,26,27]. They show relatively stronger increasing rates for both regional mean temperature and precipitation during the twenty-first century. Agriculture was a vulnerable sector affected by climate extreme events, and these problems are likely to be more prominent at 1.5 °C and 2 °C global warming scenarios in the future. However, less effort has been made to the projection of climate extremes and the impacts on agriculture in a 1.5 °C and 2 °C global warming. Thus, such questions are concentrated in this study as follows: (1) How will the agriculture-related climate extremes change under warming and wetting in Central Asia in the two global warming scenarios? (2) How will the drought change in regard to a positive effect from precipitation and negative effect from temperature? Answering these questions is necessary and valuable for the adaption and implementation of agricultural policy.
2. Materials and Methods
2.1. Study Area
Central Asia, as the core region of the Asian continent, includes Kazakhstan, Kyrgyzstan, Tajikistan, Turkmenistan, and Uzbekistan (Figure 1). The landscape in this region is characterized by desert and grasslands, with a transition from steppes in the north to semi-desert in the south [28]. The climate in most areas is dominated by less precipitation, intensive evaporation, and large diurnal and annual fluctuations of temperature, especially in the lowlands of Kazakhstan, Turkmenistan, and Uzbekistan. Kyrgyzstan and Tajikistan are located in mountainous areas of Tianshan and Pamir, respectively, having lower annual mean temperatures but more precipitation. The mean summer temperatures range from 2 to 31 °C, while the mean winter temperatures usually vary between −25 °C and 7 °C [29]. More precipitation occurs during winter and early spring, whereas summers are usually hot and dry [30].
2.2. Data
The future climate projections (2006–2100) are forced with emissions from Representative Concentration Pathways (RCPs), which is a set of four pathways (RCP2.6, RCP4.5, RCP6.0, and RCP8.5) developed by the climate modeling community as a basis for long-term and near-term modeling experiments. RCP2.6 assumes that radiative forcing peaks at approximately 3 W/m2 before 2100 and then declines to 2.6 W/m2 by 2100. RCP4.5 and RCP6.0 assume that radiative forcing is stabilized at 4.5 and 6.0 W/m2 after 2100, respectively, and RCP8.5 assumes that radiative forcing reaches 8.5 W/m2 by 2100. Relative to 1850–1900, global surface temperature changes are likely to exceed 1.5 °C for all RCPs except for RCP2.6 with high confidence by the end of the 21st century (2081–2100). It is likely to exceed 2 °C for RCP6.0 and RCP8.5 with high confidence but more likely than not to exceed 2 °C with medium confidence for RCP4.5, and warming is unlikely to exceed 2 °C for RCP2.6 [31,32]. Therefore, RCP2.6 and RCP4.5 are used for determining the threshold timings of 1.5 °C and 2 °C global warming.
The data used here include the daily meteorological outputs of temperatures and precipitation for the historical period 1986–2005 and forecast period 2006–2100 under RCP2.6 and RCP4.5 scenarios, which are provided by the Inter-Sectoral Impact Model Intercomparison Project (ISI-MIP) [33]. The temperatures refer to the atmospheric temperatures observed near the surface (generally at an altitude of 2 m above the ground) and include the daily minimum temperature, average temperature, and maximum temperature. The source data are developed from five Coupled Model Intercomparison Project Phase 5 (CMIP5) models’ simulation outputs: HadGEM2-ES (MOHC, UK), IPSL-CM5A-LR (IPSL, France), MIROC-ESM-CHEM (MIROC, Japan), GFDL-ESM2M (GFDL, USA), and NorESM1-M (NCC, Norway) (Table 1), and they have been bias-corrected based on the observation-based reference dataset [34]. To ensure consistency with the global temperature information, the project adopted a multiplicative correction for precipitation and an additive correction for temperature to adjust the monthly mean and daily variability of simulated climate data to observations. Simultaneously, these data were bi-linearly interpolated in space to the 0.5° × 0.5° grid. The detailed procedures for data management are introduced in reference [33]. The evaluation results showed that in most areas of the globe (including Central Asia), several statistical properties of the temperature and precipitation data were improved after bias correction, such as the matching of the long-term mean and the matching of the inter-percentile ranges. More details about the bias-correction are available from [33].
2.3. Methodology
2.3.1. The Threshold Timings of 1.5 °C and 2 °C Global Warming
The Intergovernmental Panel on Climate Change claimed that the global temperature in 1986–2005 was 0.6 °C higher than the pre-industrial level of 1850–1900 and set 1986–2005 as a reference period to analyze the impacts of climate change on different sectors [42]. Therefore, the 1.5 °C and 2 °C warming levels were translated to 0.9 °C and 1.4 °C above the 1986–2005 mean in this study. To reduce the uncertainty in calculating the timings of warming caused by inter-annual variability, we smoothed the time series of temperature dataset by using a 20-year smoothing window for the period 2006–2099 [43]. The time slices were derived from the RCP2.6 scenario for 1.5 °C global warming and from the RCP4.5 scenario for 2 °C global warming. We also considered 1986–2005 as the common reference period for projected change assessment in climate extremes. In addition, previous studies have demonstrated that combining different models to a multi-model ensemble generally improved the amplitude of variation and root mean square error, and it increases the performance, reliability, and consistency of model projections [44,45]. In addition for climate extreme simulations, a multi-model ensemble can be superior to a single model, with greater agreement of results with observed values [46,47,48,49]. Therefore, we used the multi-model ensemble to determine the timings of 1.5 °C and 2 °C global warming and analyze the climate extremes.
2.3.2. Selection and Calculation of Extreme Meteorological Indices
Meteorological indices are often used to quantitatively understand the impacts of climate extremes on agricultural productivity [17,50,51,52]. In this study, we select seven key indicators, including warm days (TX90P), growing season length (GSL), annual total precipitation (PRCPTOT), very wet days (R95P), consecutive dry days (CDD), annual mean temperature (TAVG), and the standardized precipitation evapotranspiration index (SPEI) (Table 2). TX90P is the number of days in a year with daily maximum temperature above the threshold value of the corresponding date. Taking 21st January as an example, the threshold value is calculated as the 90th percentile of the dataset consisting of the daily maximum temperatures for 5 consecutive days centered on 21st January of each year in the reference period. Similarly, the threshold value for each calendar day can be calculated. R95P is the precipitation amount per year above a threshold value for very wet days. The threshold value is calculated as the 95th percentile of the distribution of daily precipitation amounts on days with 1 mm or more precipitation in the reference period [53]. In addition, the bootstrap procedure was implemented for the calculation of TX90P in 1986–2005 to ensure that the percentile-based temperature indicators do not have artificial jumps at the beginning and end of the reference periods [54]. For example, we use the data from 1986–1989 and 1991–2005 (sample dataset) to calculate the TX90P in 1990. By repeating an additional year of data from the sample dataset (such as data from 1986), we constructed a 20-year block of data (sample dataset + data from 1986) to calculate one sample value of TX90P for 1990. Similarly, we can calculate another 18 sample values of TX90P by repeating each year of data from the sample dataset, and the final index was obtained by averaging the 19 sample values. The monthly precipitation and the monthly Potential Evapotranspiration (PET) will be used to calculate the SPEI. We followed the Modified-Hargreaves approach to calculate the PET [55], which requires the daily maximum temperature, daily minimum temperature, and latitude of a site. The equation is the following form for the PET:
where TD is the difference between mean daily maximum and mean daily minimum temperature in °C; P is the precipitation in mm per month; and RA can be looked up by latitude from the tables [56]. SPEI can be computed for different time scales, such as 1, 2, 3, 6, 9, 12, and 24 months, to capture both short-term and long-term droughts. Considering that the growing season of the main crops almost covered a whole year, e.g., October to next May for winter wheat, and April to October for cotton, thus, 12 months of SPEI was selected to analyze the annual drought conditions.
2.3.3. The Non-Parametric Wilcoxon Rank Sum Test
The Wilcoxon rank sum test (equivalent to the Mann–Whitney U-test) [57] is used to investigate the significance of the difference of the means among two samples, which is a non-parametric test equivalent to the t-test for independent samples that has no normal distribution assumption requirement. The procedure for the test involves pooling the observations from the two samples into one combined sample, keeping track of which sample each observation comes from, and then ranking lowest to highest, respectively. A random rank order would mean that the two samples are not different, while a cluster of one sample’s values would indicate a difference between them. For large samples, rank sum uses a z-statistic to compute the approximate p-value of the test, and reference [57] provides step-by-step instructions. In this study, we test whether there is a significant increasing or decreasing trend in climate extreme indicators for each grid under the two global warming scenarios relative to the reference period. We show an example of TAVG (unit: °C) at a grid point (69.75° E, 50.25° N) under a 1.5 °C global warming scenario. Firstly, we set up the null hypothesis (H0: There is no significant difference in TAVG in the reference and forecast period) and the alternative hypothesis (H1: There is an increasing trend in TAVG in the forecast period relative to the reference period). Secondly, we put the TAVG series from the reference period (T1, sample number n = 20) and forecast period (T2, sample number m = 20) together and rank them, giving 1 for the smallest, 2 for the next smallest, and so on. Thirdly, we sum the ranks of the TAVG values in the reference period (R1) and forecast period (R2). Then, W = min (R1, R2) is selected to construct the normal distribution test statistic z = [W − m × (m + n + 1)/2]/sqrt(m × n × (m + n + 1)/12). For our example, R1 = 210 and z = −5.41. By comparing to a critical value from a reference table [57], the critical value for rejecting the null hypothesis is −2.58. Therefore, we accept the alternative hypothesis—that is, for the example grid point (69.75° E, 50.25° N), there is an increasing trend in TAVG in the forecast period (under 1.5 °C global warming scenario) relative to the reference period.
3. Results
3.1. Threshold Timings of 1.5 °C and 2 °C Global Warming
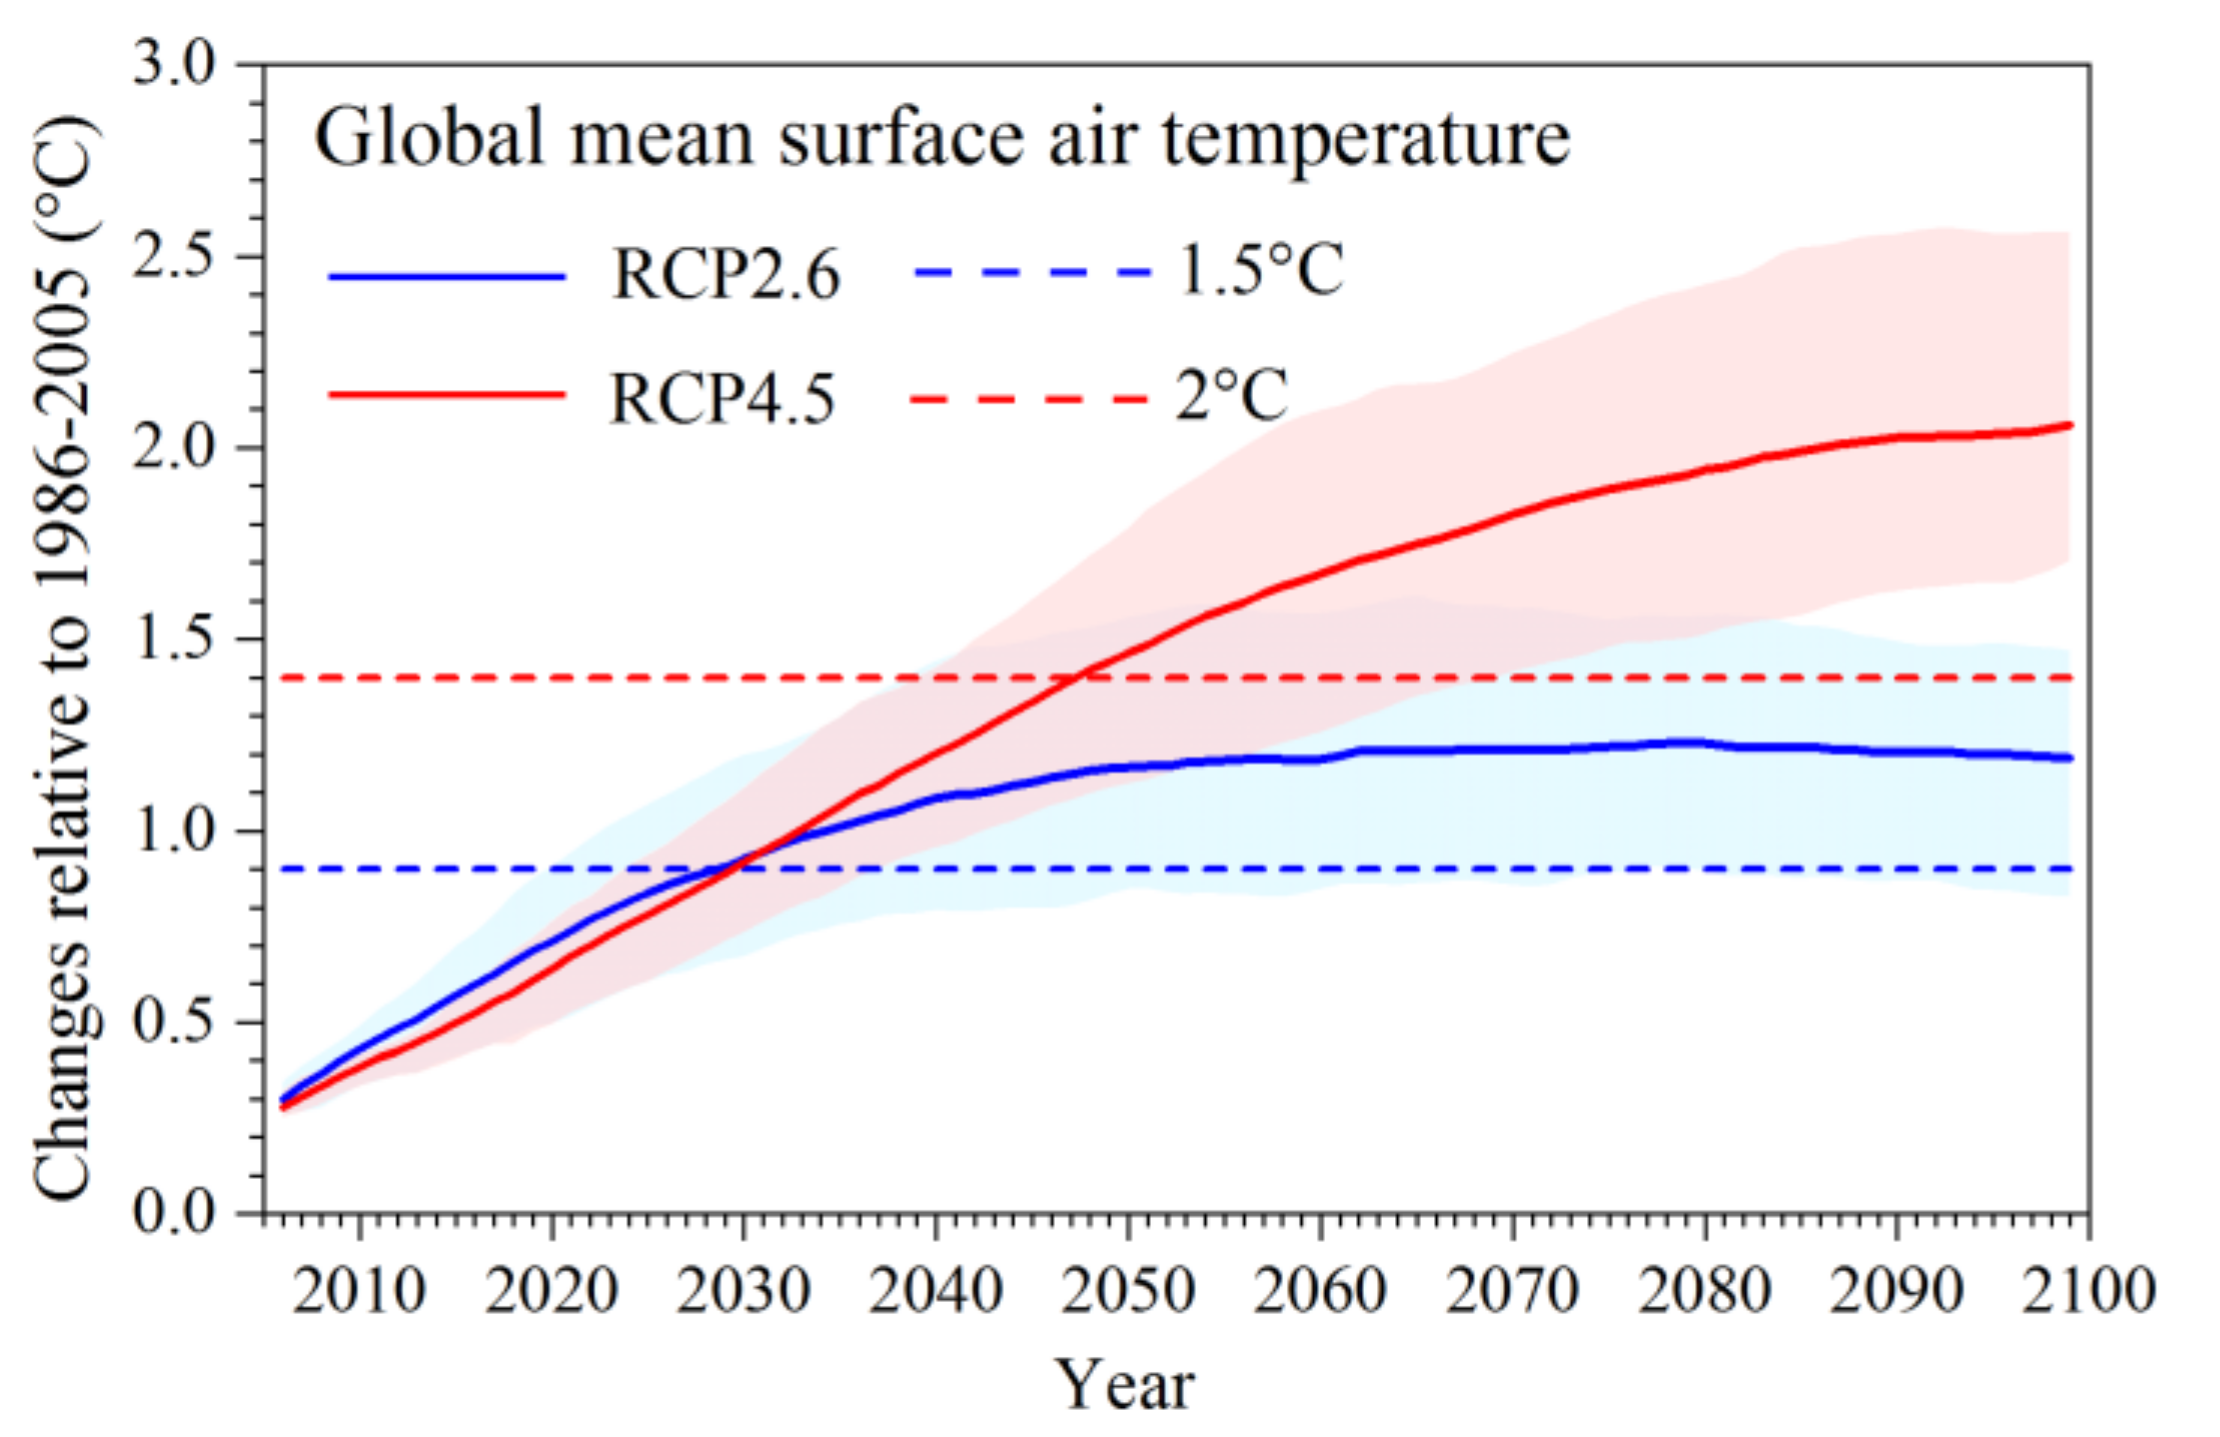
For the multi-model ensemble mean, the timing of 1.5 °C global warming is projected to be reached in the period 2020–2039 (20-year smoothing) under the RCP2.6 scenario. The 2 °C warming will be reached in 2040–2059 under the RCP4.5 scenario but will not be reached by the end of the 21st century under RCP2.6 (Figure 2). However, a large spread exists among the models in the projection of the timings of the 1.5 °C and 2 °C global warming levels (Table 3). The slopes of the temperature-increasing trends simulated by the models of GFDL-ESM2M and NorESM1-M are relatively small, while HadGEM2-ES and MIROC-ESM-CHEM simulated larger warming slopes. The result of MIROC-ESM-CHEM is consistent with the multi-model ensemble mean.
3.2. Changes in Climate Extremes over Central Asia Under 1.5 °C and 2 °C Global Warming
3.2.1. Annual Mean Temperature (TAVG)
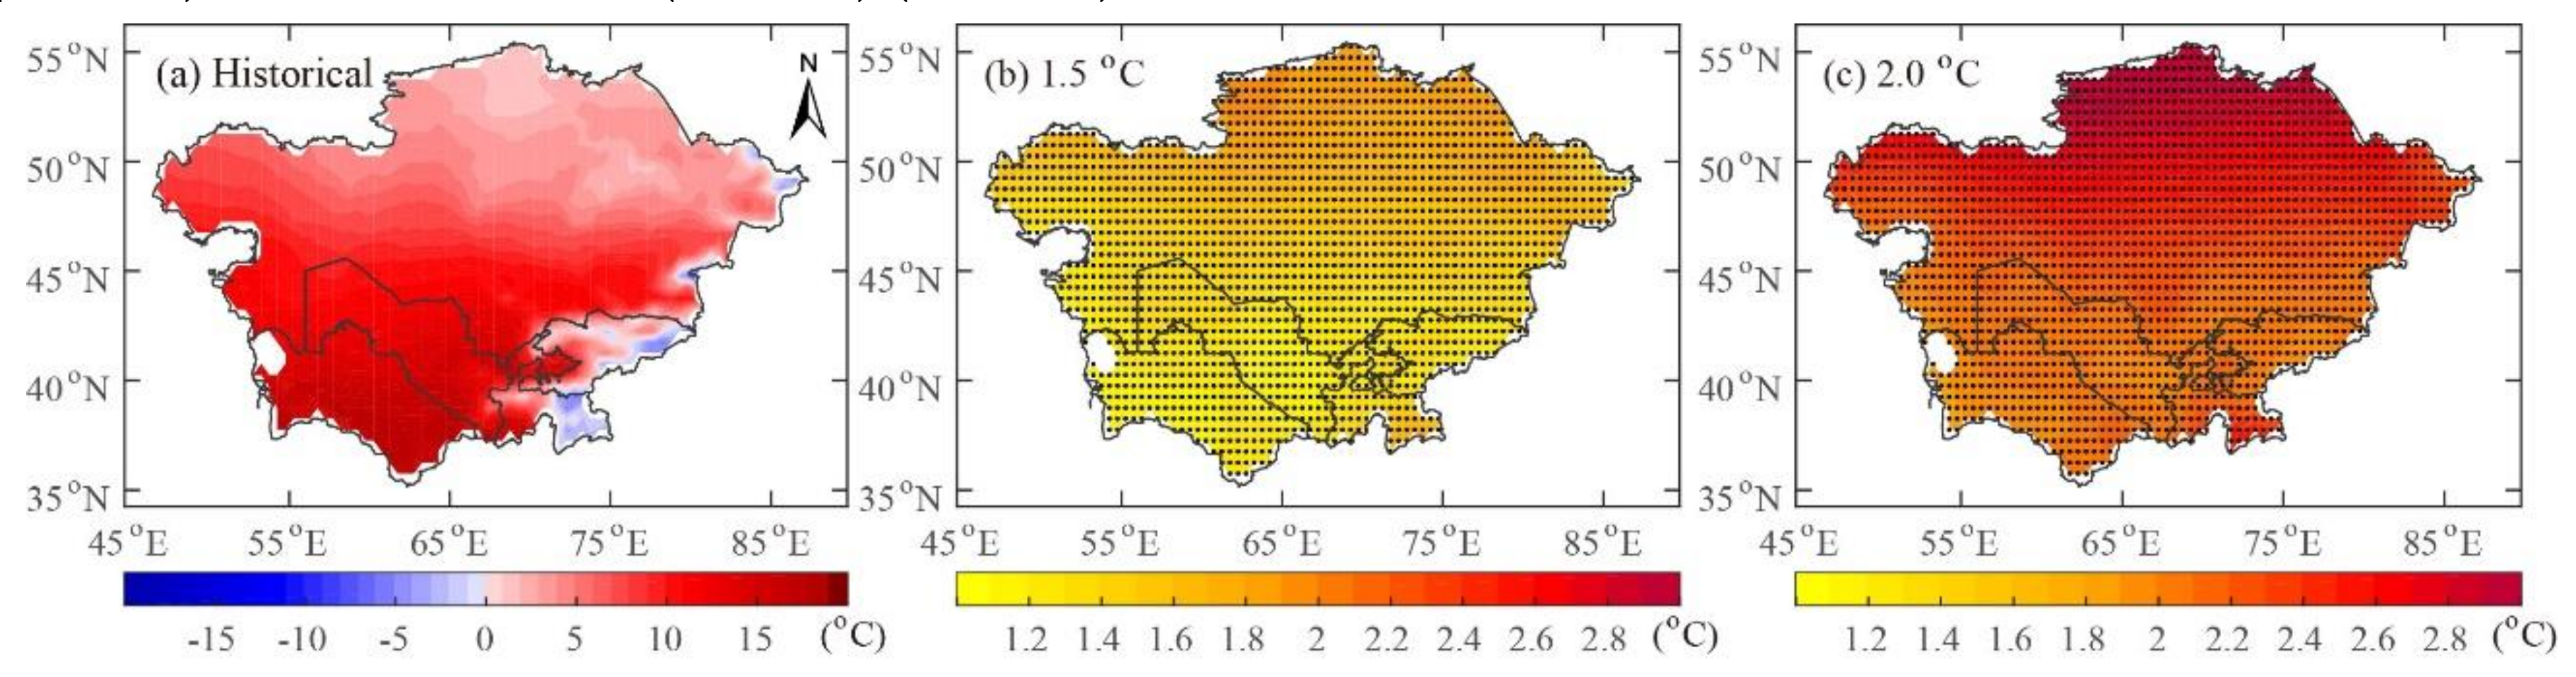
In the reference period (1986–2005), the regions with a low TAVG (less than 0 °C) in Central Asia were in the high altitudes of the east, such as Tianshan Mountains, Pamirs Plateau, and their surroundings. In plain and hilly regions, there were different TAVG distributions at different latitudes; that is, the TAVG decreased gradually with increasing latitude (Figure 3a). The average TAVG over the whole of Central Asia was 7.95 °C. At the country level, the TAVG of Kyrgyzstan, Tajikistan, Kazakhstan, Uzbekistan, and Turkmenistan was 1.94 °C, 4.28 °C, 6.50 °C, 13.29 °C, and 16.03 °C, respectively. The spatial distribution of the projected TAVG showed a latitudinal gradient: warming in the northern part was greater than that in the south, and the increasing trends were significant at the 1% level for all grids at both warming levels of 1.5 °C and 2 °C (Figure 3b,c). Under 1.5 °C global warming, the TAVG in Central Asia will be about 1.48 °C above the reference period, which is higher than the global mean of 0.9 °C. Except for the temperature of Kazakhstan (1.57 °C), which is higher than 1.5 °C, other countries are lower than 1.5 °C, i.e., 1.44 °C in Kyrgyzstan, 1.29 °C in Tajikistan, 1.25 °C in Turkmenistan, and 1.21 °C in Uzbekistan. However, under a 2 °C warming scenario, warming across the region is projected to have a mean value of 2.34 °C compared to the reference period, which is almost 1 °C higher than the global level, and Kazakhstan has the largest temperature rise of 2.45 °C. The temperature is close to 2 °C in Turkmenistan (2.06 °C), Tajikistan (2.03 °C), and Uzbekistan (2.01 °C) (Table 4).
3.2.2. Warm Days (TX90P)
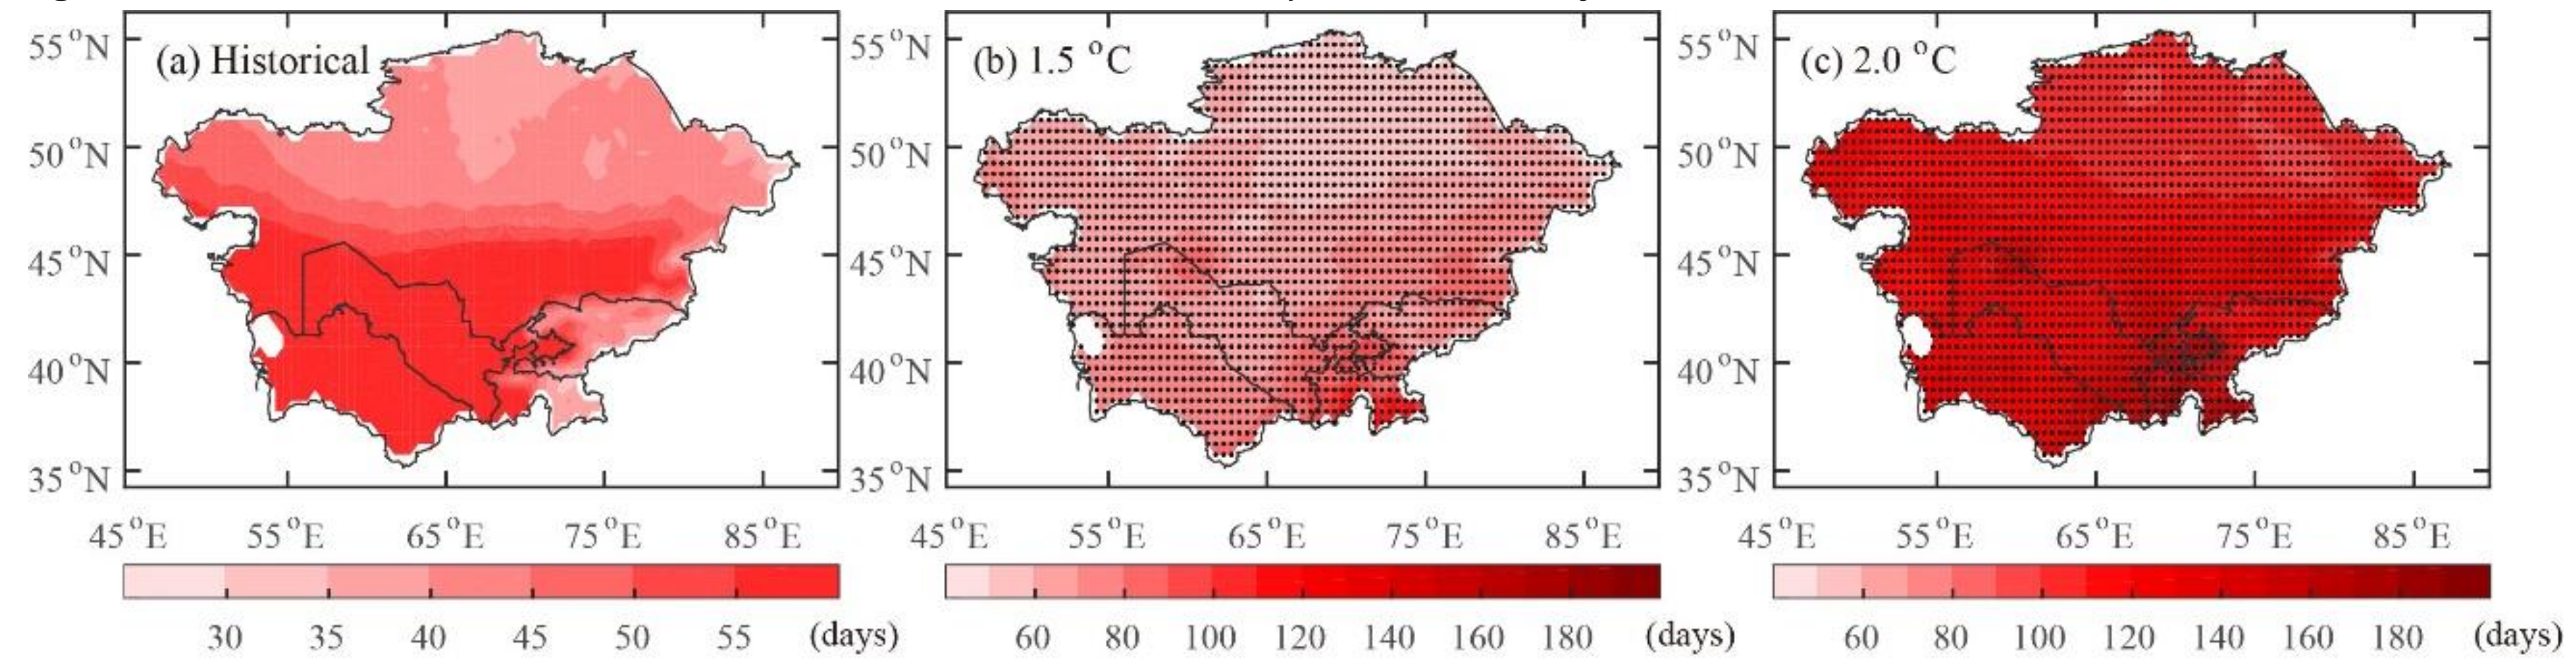
The spatial distribution of TX90P in most regions of Central Asia was characterized by higher values in the south from 1986 to 2005. However, the Pamirs Plateau and Tianshan Mountains, located in the southeastern part of Central Asia, had a relatively low value of TX90P due to the high altitudes (Figure 4a). The frequency of TX90P will experience a significant increase (at the 1% level) in all grids in Central Asia under 1.5 °C and 2 °C global warming. The largest increase in TX90P is found in the southeast of the region, especially in the Pamirs Plateau and the regions with high altitudes, and the increase of warmer days under 2 °C warming is higher than that in a 1.5 °C world. Under 1.5 °C global warming, the frequency change of TX90P for the whole of Central Asia is 67.67 days, ranging from 64 (Kazakhstan) to 102 (Tajikistan) days for the five countries. Under 2 °C global warming, the region will experience more warm days, with an increase of 121.91 days for the whole region and between 115 (Kazakhstan) and 165 (Tajikistan) days for the five countries (Table 4).
3.2.3. Growing Season Length (GSL)
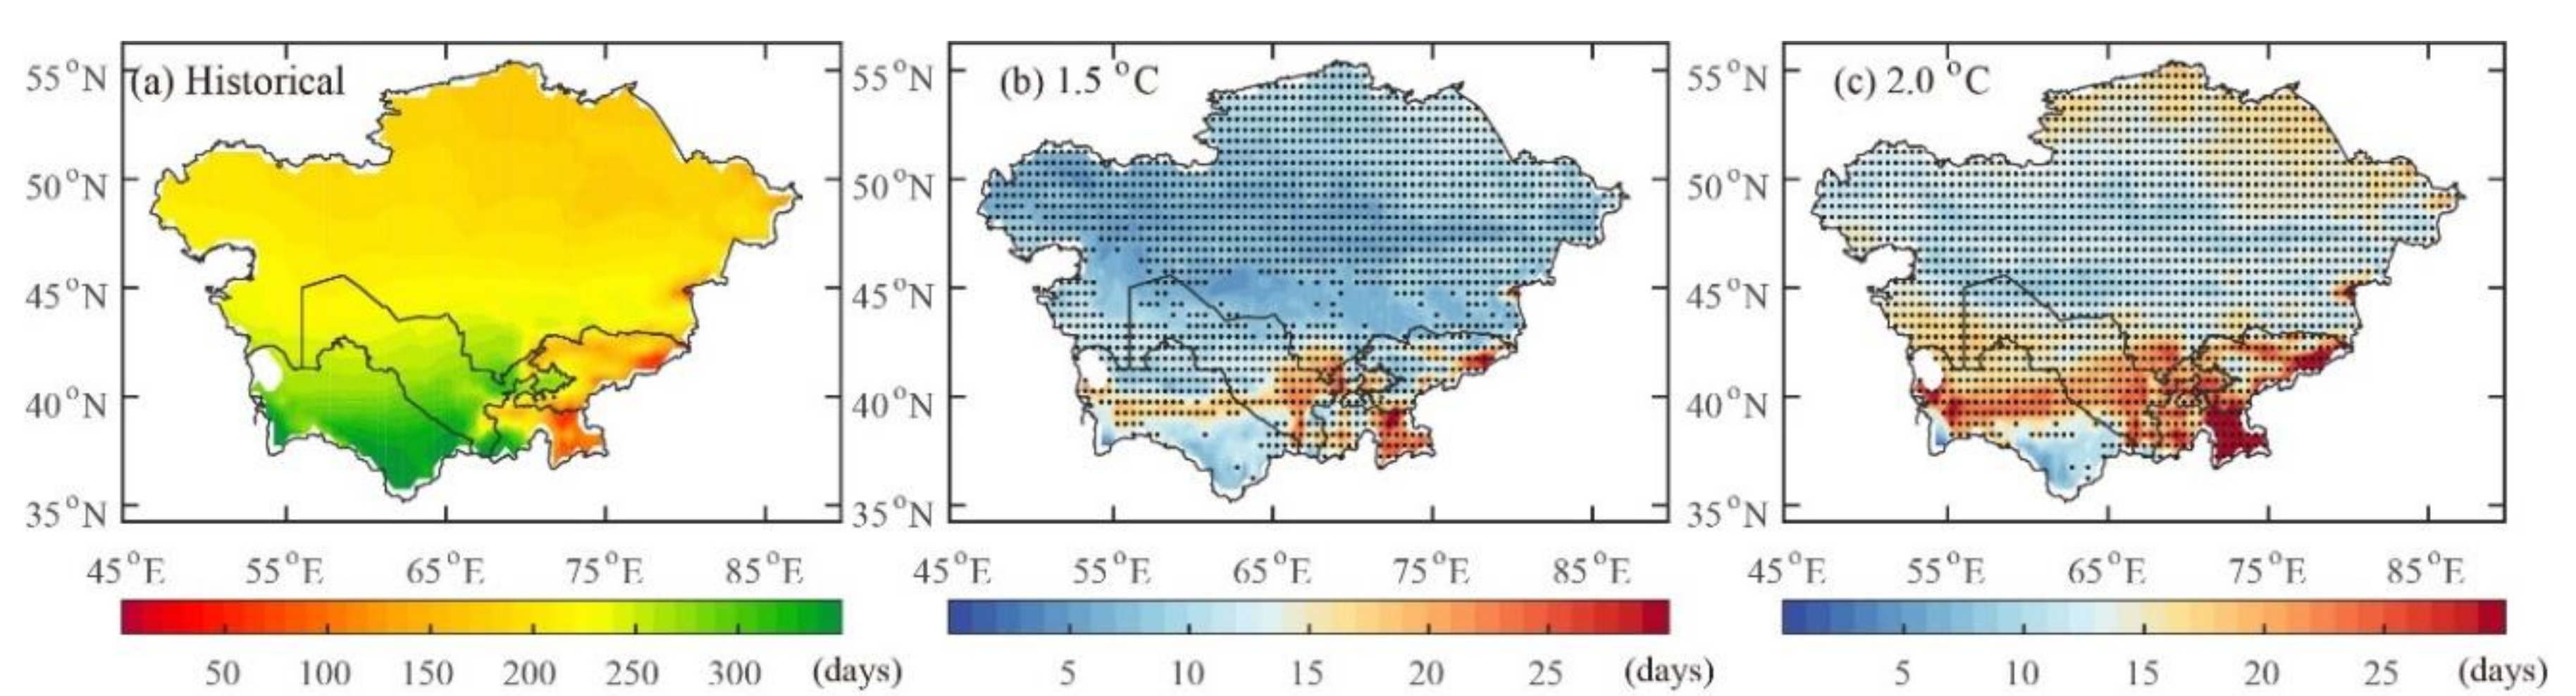
The spatial distribution of GSL in Central Asia was consistent with the TAVG, with the warmer regions having a longer growing season (Figure 5a), i.e., Turkmenistan (302.97 days) and Uzbekistan (260.61 days) have a longer GSL, but in the northern part, Tajikistan and Kyrgyzstan have a shorter growing season, of 175.49 days and 161.5 days, respectively. In 1.5 °C and 2 °C worlds, the GSLs for the entire region are both projected to increase, with most of the region increasing by 10 days and even more than 30 days over the southern portions of the region (Figure 5b,c). Under the scenario of 1.5 °C global warming, about 83.99% of the grids showed a statistically significant (at the 1% significance level) increase in GSL; those without significant trends are mainly distributed in southern Kazakhstan and southern Turkmenistan. The regions with the largest increase in GSL are mainly found in the east of Tajikistan and a small part of eastern Kyrgyzstan, reaching 50 days. On average, the GSL for the whole of Central Asia is projected to increase by 10.10 days. Tajikistan shows the largest increase (19.44 days) among the five countries, while Kazakhstan has the lowest increase (8.71 days), and that of the three other countries ranges from 12 to 14 days. Under the scenario of 2 °C global warming, most of the grids (96.39%) in Central Asia will experience a significant increase (at the 1% level), and grids without significant trends are distributed in southern Turkmenistan. The increases in GSL in the south of Central Asia have higher values than in the northern parts, especially in the east of Tajikistan, with more than 50 days for almost all grids. The GSL will increase by 15.26 days on average for the whole region, while those of Tajikistan and Kyrgyzstan will increase by 27.04 days and 21.57 days, respectively. The increases for Uzbekistan, Turkmenistan, and Kazakhstan are less than 20 days, ranging from 13.83 days to 17.39 days (Table 4).
3.2.4. Annual Total Wet-Day Precipitation (PRCPTOT)
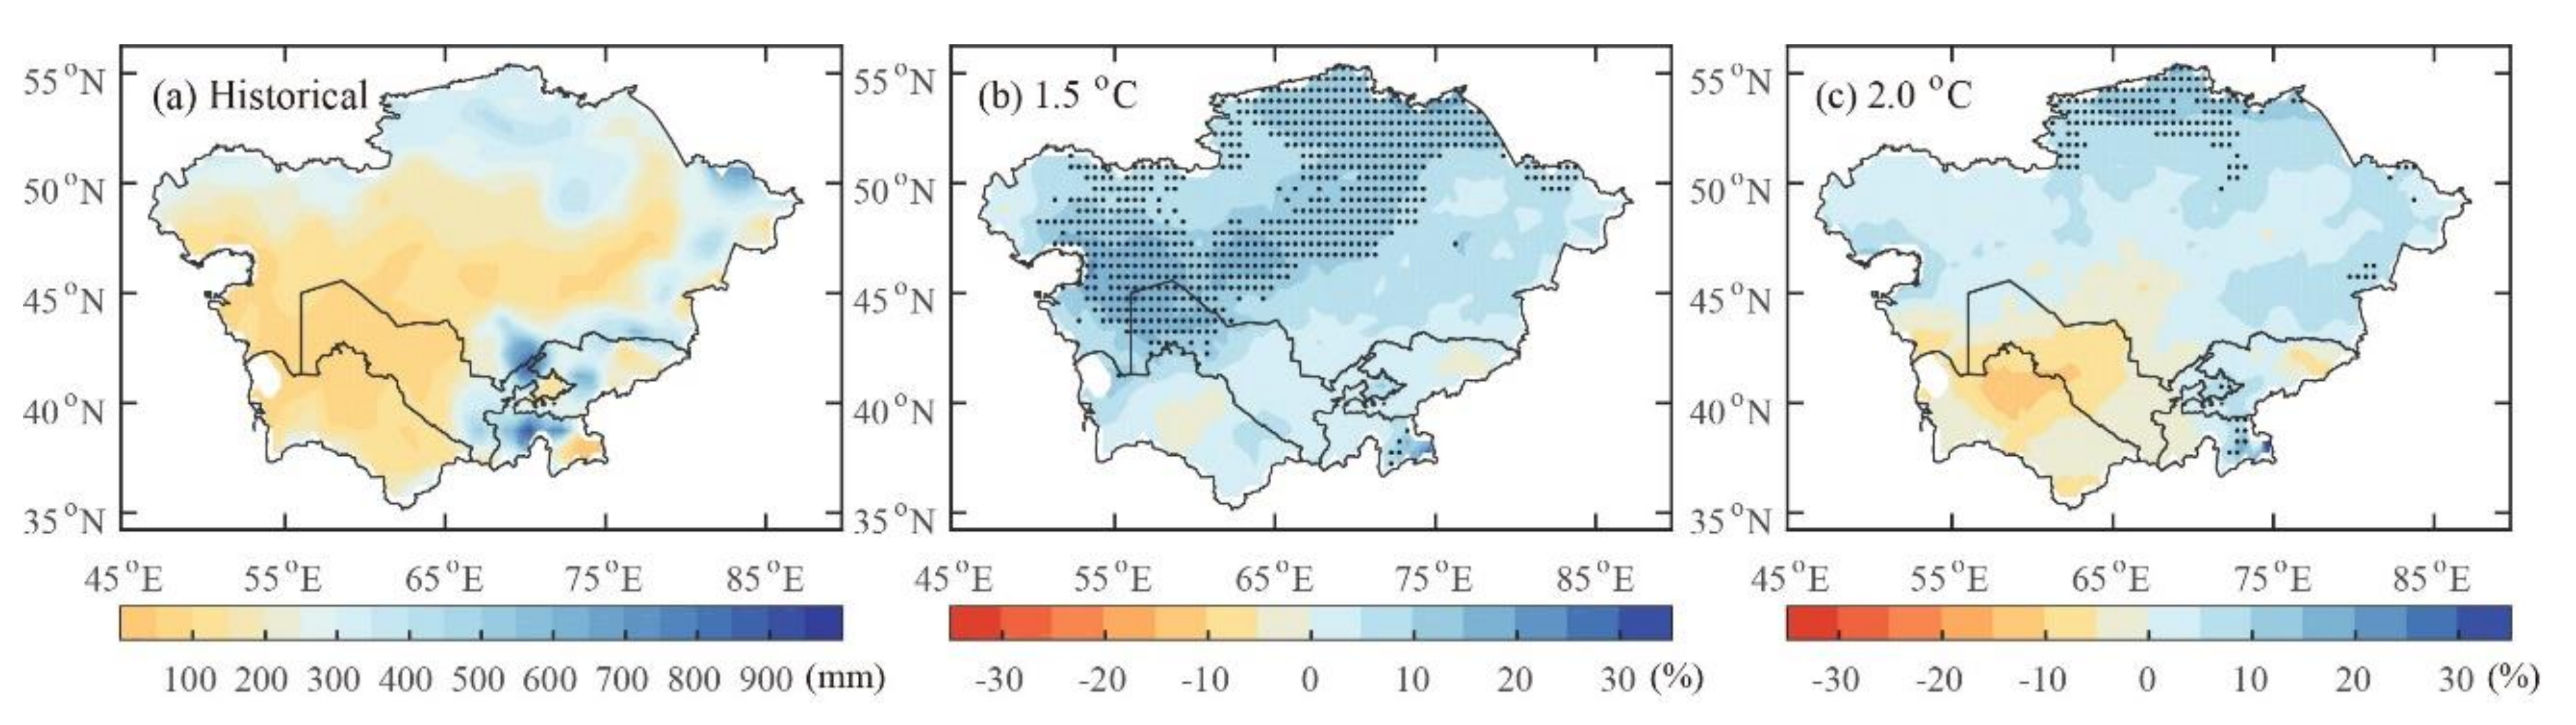
In the reference period, Central Asia was quite dry, with less than 300 mm of annual precipitation for most of the region. However, parts of the Tianshan Mountains and the Pamirs Plateau had relatively abundant precipitation, with a maximum exceeding 800 mm (Figure 6a). Tajikistan and Kyrgyzstan received more precipitation (363.83 mm and 313.14 mm, respectively), while Turkmenistan and Uzbekistan were in a dry condition, receiving less than 200 mm precipitation. In a 1.5 °C world, the annual precipitation in most of the region is projected to increase, especially in Kazakhstan, with about 45.94% of the grids having a significant increasing trend at the 1% level. The areas with decreasing PRCPTOT are found in the center of Turkmenistan and a small part of eastern Kyrgyzstan, but the decreasing trends are not significant at the 1% level (Figure 6b). In a 2 °C world, the areas with a significant increasing trend in annual precipitation are projected to retreat compared with the 1.5 °C world and are concentrated in a small part of northern Kazakhstan. Turkmenistan and Uzbekistan show a non-significant decrease in precipitation, of 4.94% and 1.91%, respectively (Figure 6c).
3.2.5. Very Wet Days (R95P)
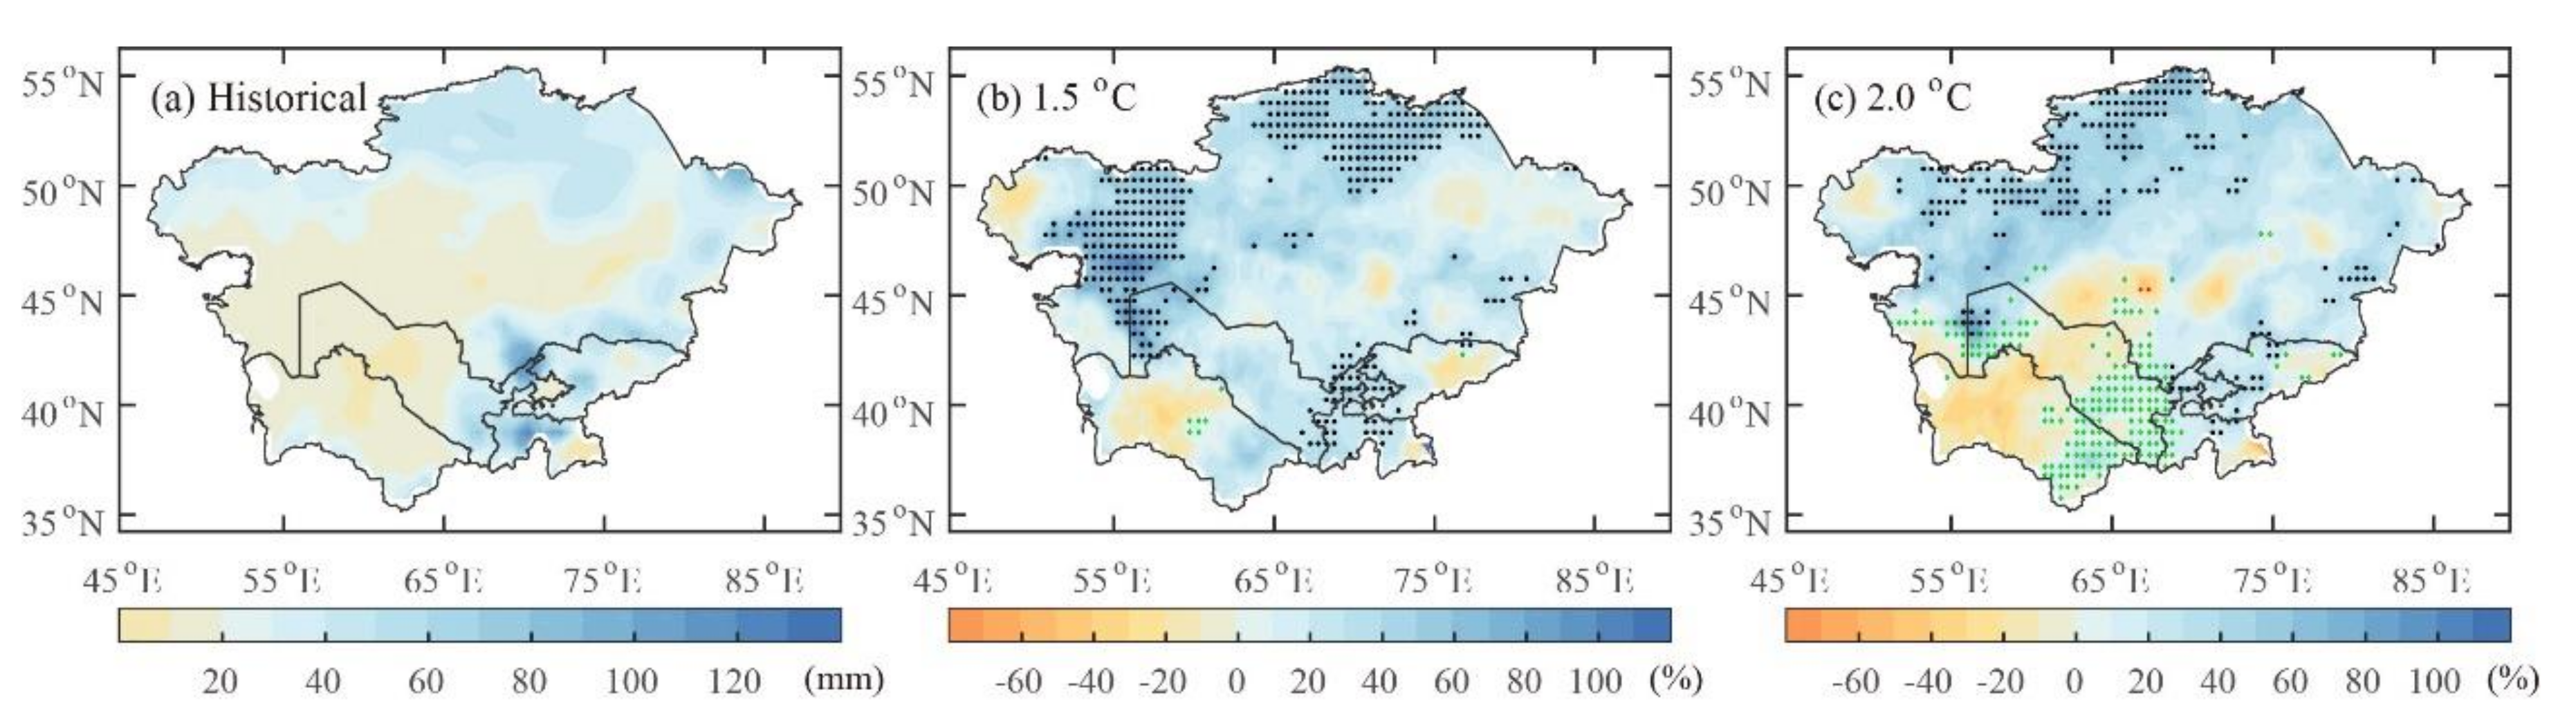
In the reference period, the spatial distribution of R95P in Central Asia was consistent with the PRCPTOT, and high values of R95P were found in the regions with more PRCPTOT. The values of R95P were less than 40 mm for most of the region, except for some higher elevation areas in Tajikistan and Kyrgyzstan, which exceeded 100 mm (Figure 7a). Under 1.5 °C global warming, the average R95P for the entire region will increase by 26.55%, and the regions with significant increasing trends were concentrated in the north and west of Kazakhstan, accounting for about 21.24% of the regional area (black dots in Figure 7b). Under 2 °C global warming, an increase in R95P will still be seen for the region as a whole, averaging about 24.78%, while the grids with a significant increasing trend will retreat to the west of Kazakhstan (Figure 7c). In a warmer world, some grids show a decrease in PRCPTOT and an increase in R95P (green dots), which were rare under 1.5 °C global warming. However, these grids will greatly increase in a 2 °C world, and they are mainly concentrated in the east and west of Uzbekistan and the east of Turkmenistan, indicating an increase in drought risk for these regions.
3.2.6. Consecutive Dry Days (CDD)
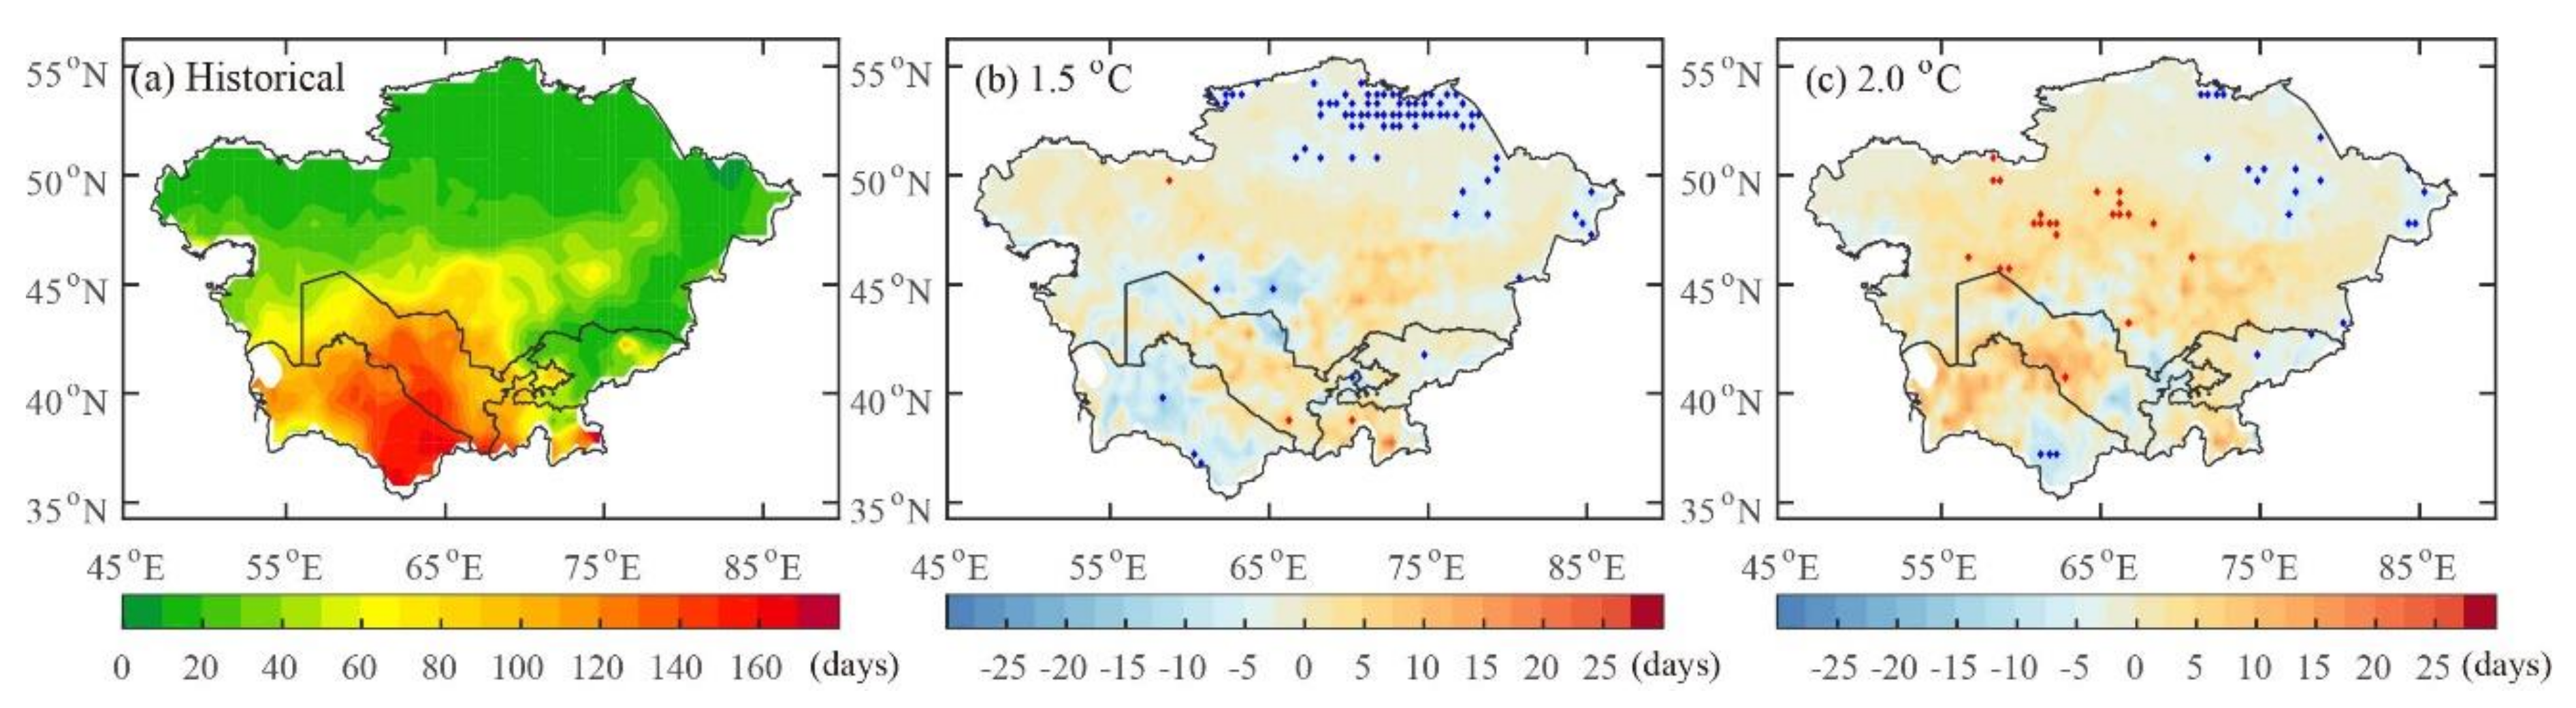
In the reference period, along the latitudinal gradient, there appeared to be a decrease in CDD while moving from south to north (Figure 8a). Most regions of Turkmenistan and Uzbekistan had high levels of CDD, with a maximum of 170 days, while northern Kazakhstan had the lowest level of CDD, generally around 10 days. Under 1.5 °C global warming, the CDD in Central Asia is projected to show a pattern of “decrease—increase—decrease—increase—decrease” from northeast to southwest (Figure 8b). The regions having the largest increase in CDD (5–10 days) are concentrated in the south of Tajikistan and a small part of southeastern Kazakhstan, while the west and south of Turkmenistan and some portions of southern Kazakhstan will experience a larger decrease of 5–11 days. Almost all countries in the region are projected to experience slight decreases in CDD, on average 1.1 days for the entire region, except for Tajikistan, which is projected to experience an increase of 1.7 days. The grids with a significant decreasing trend will be found concentrated in northern Kazakhstan, while almost no grids with a significant increasing trend will be found in the region. Under 2 °C global warming, changes in CDD are evident across the region, with the areas experiencing an increase in CDD expanding (Figure 8c). The regions with an increase of more than 5 days in CDD will be distributed in the sporadic areas of southern Kazakhstan, the middle of Uzbekistan, the west of Turkmenistan, and a small part of eastern Kyrgyzstan, and the increase in some portions of middle Uzbekistan will reach 10 days. Some small portions of eastern Uzbekistan and eastern Turkmenistan have a decrease of more than 5 days with respect to CDD, but the total area is small. The grids with a significant increasing trend in CDD will increase and will be distributed in Kazakhstan, while only sporadic grids found in the northeast of Kazakhstan will see a significant decreasing trend. In contrast to the 1.5 °C global warming, almost all the countries in Central Asia will see slight increases in CDD, on average 0.8 days for the whole region, while Kyrgyzstan will experience a slight decrease of 0.4 days (Table 5).
3.2.7. Standardized Precipitation Evapotranspiration Index (SPEI)
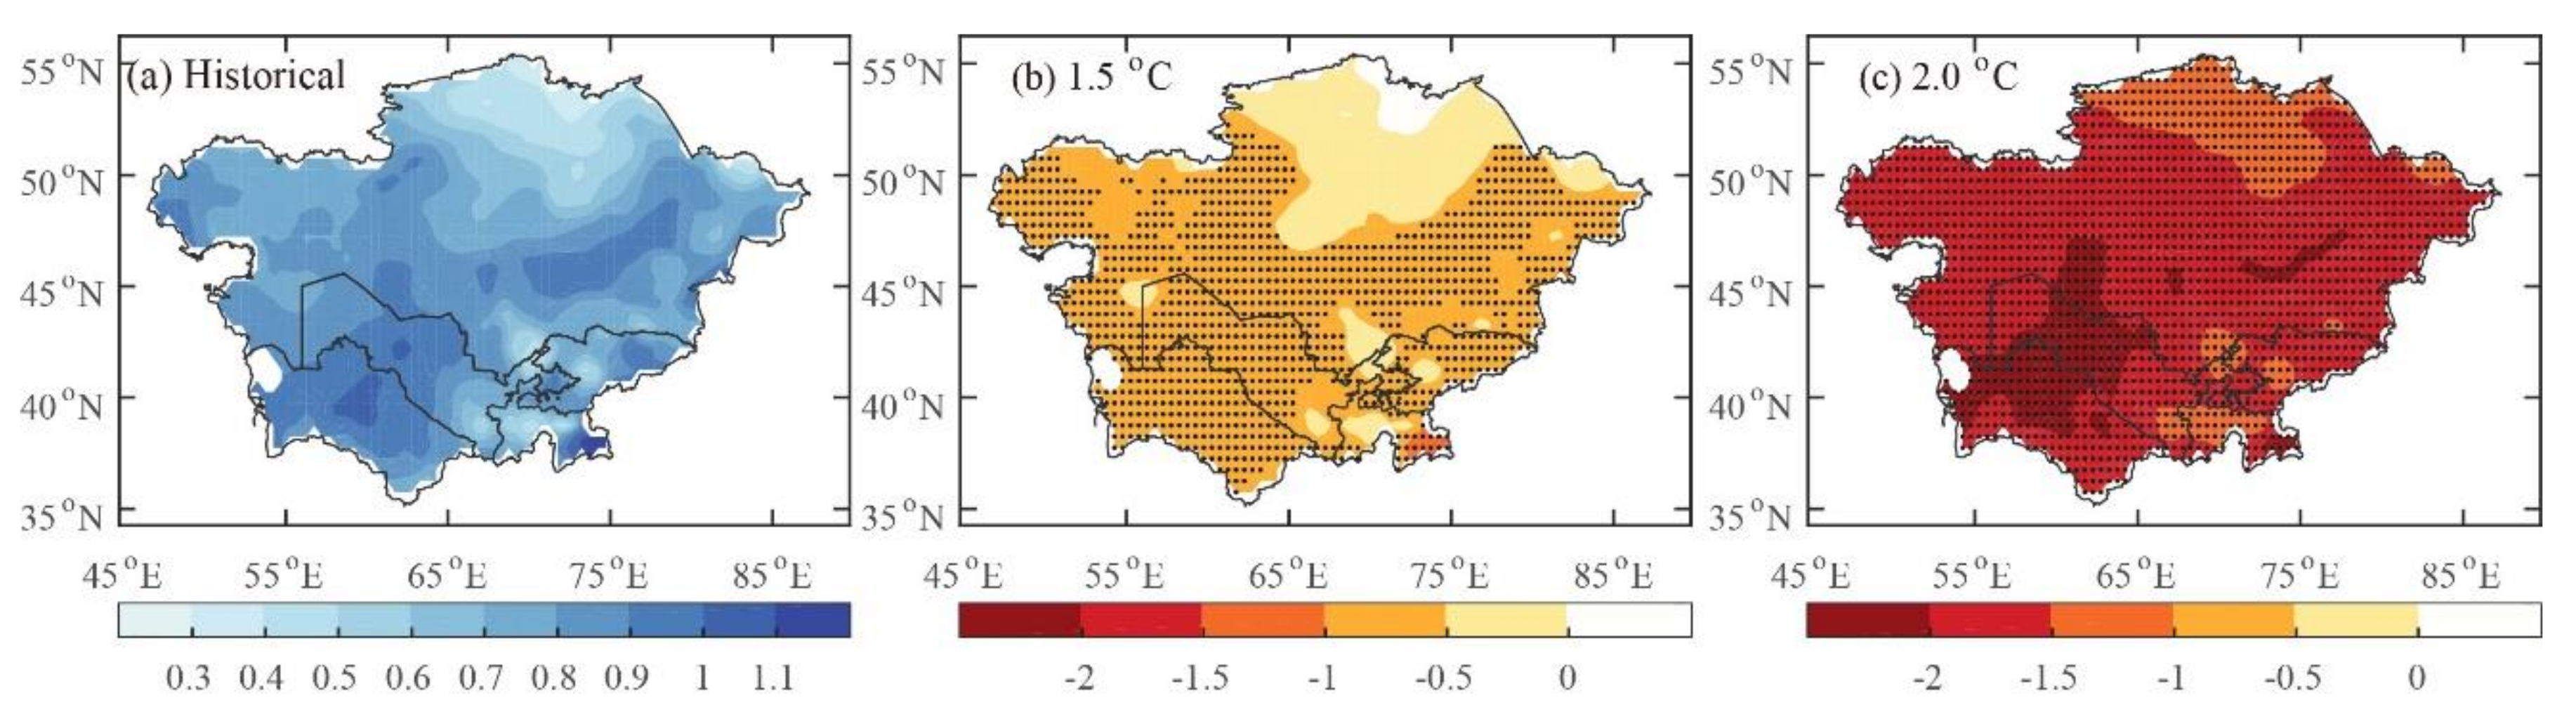
In the reference period, Central Asia was relatively humid, with SPEI values higher than 0 for all of the grids in the region (Figure 9a). Under a temperature increase of 1.5 °C, almost the entire region will experience a decrease in SPEI, indicating a more arid climate compared to the period 1986–2005, except for small portions in the northernmost regions of Kazakhstan, which are projected to experience an increase in SPEI of 0–0.5. The decreasing trends across 61.94% of the grids will be significant at the 1% level, and the changes in SPEI range from −1 to −0.5 for most of the region. In parts of northern Kazakhstan, the values of SPEI will decrease by 0 to 0.5, indicating a relatively slow drying trend (Figure 9b). Under 2 °C global warming, drought across the whole region will increase in magnitude, with all of the grids experiencing a significant decrease (at the 1% level) in SPEI. The Karakum Desert in the southwest of Central Asia is projected to experience the most severe drought, with an SPEI decreasing by over 2, while Northern Kazakhstan and a small part of southeastern Central Asia will experience a relatively slight decrease in SPEI, ranging from 1 to 1.5. The majority of the region is projected to experience a decrease of 1.5 to 2 in SPEI (Figure 9c). Therefore, the increased precipitation could not offset the increased potential evapotranspiration, resulting in a drought condition.
Overall, the results based on the ISI-MIP model projections indicated a rapid and drastic change in the extreme climate conditions related to agricultural production across Central Asia. The temperature-related extreme events such as TAVG, TX90P, and GSL generally tended to show significant increases across the whole of Central Asia at both warming levels of 1.5 and 2 °C, while precipitation-related extreme events such as PRCPTOT, R95P, and CDD did not show significant changes for most areas in Central Asia. The scarce precipitation (although a small increase is expected) and sharp rise in temperature increase the potential evapotranspiration, leading to a significant decrease in SPEI, especially in the case of the 2 °C scenario, where both the magnitude and scope of the change are greater than those in the case of 1.5 °C scenario. Warmer and drier climate conditions will have a negative impact on the agricultural ecological environment of arid areas of Central Asia.
4. Discussion
The agricultural development in Central Asia is partly driven by both arable land and pastures. The general temperature increase in northern Central Asia will bring a longer growing and frost-free season, and the cold constraints for winter crops (such as winter wheat and barley) will decrease and the suitable croplands will be expanded. In addition, the projected significant increase in precipitation could be beneficial to the growth of grasses and rain-fed crops to some extent. In Kazakhstan, the grasslands are mainly concentrated in the northern regions (Figure 10) where the increasing precipitation is the most pronounced (Figure 6), and the vegetation growth of grasslands are positively correlated with annual precipitation [58]. However, not all of the projected climate change poses optimistic impacts on Kazakhstan’s agriculture. Warming will also exacerbate water deficits and increase the risk of extreme heat events, which affects crop growth and development at the critical stages (such as anthesis and grain filling). High summer temperature above 33 °C could damage crops and reduce production [59]. A slight air temperature increase in winter and spring may have positive effects on crop yield, but these conditions after anthesis may negatively affect grain yield [60]. In some areas under spring wheat in the north of Kazakhstan, climate change will bring notably extreme high temperatures during flowering, leading to the sterility of flowers and affecting the formation of final yields [61]. Winter wheat may suffer from hot and dry winds at the late growth stages. The moderate rainfall increase (Figure 6) in northern Kazakhstan may have only a minor positive impact on crop production under rain-fed conditions, because the increasing potential evapotranspiration under higher future temperatures will exacerbate the drought conditions (Figure 9). In addition, a significant increase in heavy precipitation over the north and west of Kazakhstan (Figure 7) is expected with a decline in the evenness of rainfall distribution adding to the risk of rainstorm and waterlogging, which may reduce grain yields in both wheat and barley cultivars to a large magnitude [62].
In the southern areas of Central Asia including Uzbekistan, Kyrgyzstan, Tajikistan, and Turkmenistan, agriculture mainly depends on irrigation. Compared to northern Central Asia, the warming in these regions is relatively weak, but the warm days increase (Table 4). With the decrease in precipitation and increase in consecutive dry days, the drought conditions will be exacerbated in the future, especially in Turkmenistan and Uzbekistan. High temperature and more droughts will lead to an increase in water demand in agricultural irrigation. Some studies have predicted the increase in Central Asia’s agricultural irrigation water under climate change [64,65,66,67]. However, a more than 10% increase in extreme heavy precipitation was found in some regions of southern Central Asia where the total precipitation showed a decreasing trend. It indicated that precipitation intensity will increase and mudflows, flash floods, landslides, and accelerated rates of erosion and sedimentation could be triggered at a more than two-fold rate [68].
Agriculture in Central Asia will be full of challenges due to the increase in water stress, especially in the southern countries. For example, the water supply for Uzbekistan is projected to decrease by 10–20% in the near future, which may reduce the areas to be irrigated by 6.3–9.7% of the current area and may cause unemployment in the range of 5.1–8.2% in the agricultural sector [65]. Relative to 1990–2005, the cotton yields in the Syr Darya and Amu Darya river basins will decrease by 11–13% and 13–23%, respectively [69]. Crop yields in Tajikistan are projected to drop by 2.5–10% and 5–30% by 2020 and 2050, respectively [70]. In addition, there are also large areas of fodder grassland in these areas (Figure 10), while the increase of temperature and decrease of precipitation will both have adverse effects on the vegetation of grassland and affect the development of livestock husbandry.
For the whole of Central Asia, drought is undoubtedly the most dramatic and negative change in climate predicted for Central Asia. Central Asia is landlocked and far away from the ocean, with scarce precipitation, and drought is a major constraint on agricultural development [16,71,72]. Drought events with high frequency and severity, along with the local relatively low capacity to cope with drought, have resulted in severe agricultural losses. For example, a strong spring and a subsequent summer drought in Kyrgyzstan caused great damage to national wheat yields in 2008, with the yield significantly declining to 1.94 MT/ha. The drought in 2012 cut grain yields of Kazakhstan by 52.3% compared with the previous year, with the wheat yield dropping by 57%. From 1999 to 2008, The Kara-Kum area of Turkmenistan experienced severe droughts for 6 years, leading to the average yield loss of pasture dropping to 82 kg/ha [73]. However, the drought condition is likely to be further exacerbated in the future. The changes in SPEI found in Section 3.2.7 reveal that more than 60% and 100% of the area will suffer from drier climate conditions (significant at the 1% level) under 1.5 °C and 2 °C global warming, respectively. Some other studies have similar conclusions. According to Reyer et al. [74], the arid regions will expand by about 6% in a 2 °C world. In a 4 °C world, the area of land classified as hyper-arid or arid could increase from 29.6% in 1951–1980 to 36.8% in 2071–2099, which is an increase of more than 20%. Naumann et al. [75] found that the 100-year drought events are projected to turn into 30-year drought events under 1.5 °C warming in Central Asia. The cycles of droughts will further decrease with the warming of 2 °C and 3 °C, from 100 years to less than 10 years. Therefore, it is anticipated that drought will continue to be an important constraint on agricultural development in Central Asia under future climate change. In addition, the soil salinization and land degradation mostly caused by climate change and unreasonable irrigation are also among the most serious problems restricting local agricultural development in recent years [76], especially in the southern region where the agricultural irrigation rate is high [69,77,78].
Overall, the changes in extreme climate conditions related to agricultural production are likely to be more pronounced in the southern region of Central Asia, such as greater increases in extremely warm days (Figure 10), a greater decrease in precipitation, and a larger decreasing trend in SPEI. This indicated that the southern regions may be more vulnerable to the negative effects of climate change than the northern regions. According to the study by Sutton et al. [71], in the southern regions (Tajikistan, Turkmenistan, and Uzbekistan), especially in Uzbekistan, the yields per hectare of each crop will be reduced due to higher temperatures and water scarcity. Viter et al. [79] reported that the large-scale commercial farms in northern Kazakhstan are expected to see positive returns in agricultural income gains, while the small-scale farms in arid areas of Tajikistan are likely to be adversely affected by climate change. Producers in Kyrgyzstan may expect both higher revenues and higher income volatilities in the future. Agricultural producers in Uzbekistan may benefit from the positive effects of climate change in the short term but may lose their income in the future, with the positive effects being completely offset by the negative effects.
5. Conclusions
Based on the meteorological datasets obtained from ISIMIP, we projected the changes in temperature and precipitation extremes under 1.5 °C and 2 °C global warming for Central Asia. As a whole, the changes in temperature extremes are likely to be more significant than those in precipitation extremes, and the scope and magnitude of changes are greater under 2 °C global warming.
The TAVG in Central Asia is about 1.48 °C and 2.34 °C above the reference period under 1.5 °C and 2 °C warming scenarios, respectively, which are higher than global levels. For all of the grids, statistically significant increases in TAVG and TX90P are expected under the two global warming levels. The GSL shows a significant increase for most grids of the region accompanying the rising temperature. However, no consistent pattern of changes could be detected for the majority of precipitation extremes. The grids with significant change trends in PRCPTOT and R95p are all concentrated in small portions of northern Kazakhstan under 1.5 °C and 2 °C warming scenarios. The scarce precipitation (although a small increase is expected) and sharp rise in temperature will lead to a significant decrease in SPEI for more than 60% of the grids under 1.5 °C global warming and for 100% of the grids under 2 °C global warming. This indicates that drought conditions will be further exacerbated across Central Asia in the future.
Climate change will put Central Asia’s agricultural production at a high risk of facing more ecological problems, such as drought, water scarcity, and soil salinization, which will lead to regional food insecurity. Some adaptation measures should be taken to cope with the negative effects, especially the measures to relieve water pressure such as changing the irrigation method.
Author Contributions
Conceptualization, Z.H. and J.Z.; methodology, Y.L. and X.G.; software, Y.L.; resources, Y.L. and X.G.; writing—original draft preparation, X.G. and Y.L.; writing—review and editing, Y.L.; visualization, Y.L.; supervision, Z.H.; funding acquisition, Z.H. All authors have read and agreed to the published version of the manuscript.
Funding
This research was funded by the Strategic Priority Research Program of Chinese Academy of Sciences, Pan-Third Pole Environment Study for a Green Silk Road (Pan-TPE) (Grant XDA20020202), the National Natural Science Foundation of China (Grant 41831174).
Acknowledgments
We acknowledge the World Climate Research Programme’s Working Group on Coupled Modelling, which is responsible for CMIP, and we thank the climate modeling groups (listed in Table 1 of this paper) for producing and making available their model output.
Conflicts of Interest
The authors declare no conflict of interest.
References
- Qushimov, B.; Ganiev, I.M.; Rustamova, I.; Haitov, B.; Islam, K.R. Land degradation by agricultural activities in Central Asia. In Climate Change and Terrestrial Carbon Sequestration in Central Asia; Lal, R., Suleimenov, M., Stewart, B.A., Hansen, D.O., Eds.; Taylor and Francis Group: London, UK, 2007; pp. 137–146. [Google Scholar]
- Bekchanov, M.; Ringler, C.; Bhaduri, A.; Jeuland, M. How would the Rogun Dam affect water and energy scarcity in Central Asia? Water Int. 2015, 40, 856–876. [Google Scholar] [CrossRef] [Green Version]
- World Bank. World Development Indicators. Available online: https://datacatalog.worldbank.org/dataset/world-development-indicators (accessed on 12 December 2019).
- Varis, O. Resources: Curb vast water use in central Asia. Nature 2014, 514, 27–29. [Google Scholar] [CrossRef] [PubMed]
- Schöne, T.; Zubovich, A.; Zech, C.; Illigner, J.; Sharshebaev, A.; Mandychev, D. In Situ and Remote Water Monitoring in Central Asia—The Central Asian Water (CAWa) Network. In Current Trends in Landscape Research; Mueller, L., Eulenstein, F., Eds.; Springer: Cham, Switzerland, 2019; pp. 599–610. [Google Scholar] [CrossRef]
- Rosegrant, M.W.; Yohe, G.; Ewing, M.; Santos, R.V.; Zhu, T.; Burton, I.; Huq, S. Climate change and Asian agriculture. Asian J. Agric. Dev. 2010, 7, 41–82. [Google Scholar] [CrossRef]
- Baker-Austin, C.; Trinanes, J.A.; Taylor, N.G.H.; Hartnell, R.; Siitonen, A.; Martinez-Urtaza, J. Emerging vibrio risk at high latitudes in response to ocean warming. Nat. Clim. Chang. 2013, 3, 73–77. [Google Scholar] [CrossRef]
- Wilcox, J.; Makowski, D. A meta-analysis of the predicted effects of climate change on wheat yields using simulation studies. Field Crops Res. 2014, 156, 180–190. [Google Scholar] [CrossRef]
- Auffhammer, M.; Schlenker, W. Empirical studies on agricultural impacts and adaptation. Energy Econ. 2014, 46, 555–561. [Google Scholar] [CrossRef] [Green Version]
- Yohannes, H. A review on relationship between climate change and agriculture. J. Earth Sci. Clim. Chang. 2016, 7, 335. [Google Scholar] [CrossRef]
- Cline, W.R. Global Warming and Agriculture. Financ. Dev. 2008, 45, 23–27. [Google Scholar]
- Christensen, J.H.; Kanikicharla, K.K.; Aldrian, E.; An, S.; Cavalcanti, I.F.A.; de Castro, M.; Dong, W.; Goswami, P.; Hall, A.; Kanyanga, J.K.; et al. Climate Phenomena and their Relevance for Future Regional Climate Change. In Climate Change 2013: The Physical Science Basis. Contribution of Working Group I to the Fifth Assessment Report of the Intergovernmental Panel on Climate Change; Stocker, T.F., Qin, D., Plattner, G.-K., Tignor, M.M.B., Allen, S.K., Boschung, J., Nauels, A., Xia, Y., Bex, V., Midgley, P.M., Eds.; Cambridge University Press: Cambridge, UK; New York, NY, USA, 2013; pp. 1217–1285. [Google Scholar]
- Feng, R.; Yu, R.D.; Zheng, H.W.; Gan, M. Spatial and temporal variations in extreme temperature in Central Asia. Int. J. Climatol. 2017, 38, e388–e400. [Google Scholar] [CrossRef]
- Zhang, M.; Chen, Y.N.; Shen, Y.J.; Li, Y.P. Changes of precipitation extremes in arid Central Asia. Quat. Int. 2017, 436, 16–27. [Google Scholar] [CrossRef]
- Li, Z.; Chen, Y.N.; Fang, G.H.; Li, Y.P. Multivariate assessment and attribution of droughts in Central Asia. Sci. Rep. 2017, 7, 1316. [Google Scholar] [CrossRef] [PubMed]
- Guo, H.; Bao, A.M.; Liu, T.; Jiapaer, G.L.; Ndayisaba, F.; Jiang, L.L.; Kurban, A.; Maeyer, P.D. Spatial and temporal characteristics of droughts in Central Asia during 1966–2015. Sci. Total Environ. 2018, 624, 1523–1538. [Google Scholar] [CrossRef] [PubMed]
- Ta, Z.J.; Yu, R.D.; Chen, X.; Mu, G.J.; Guo, Y.F. Analysis of the Spatio-Temporal Patterns of Dry and Wet Conditions in Central Asia. Atmosphere 2018, 9, 7. [Google Scholar] [CrossRef] [Green Version]
- Lesk, C.; Rowhani, P.; Ramankutty, N. Influence of extreme weather disasters on global crop production. Nature 2016, 529, 84–87. [Google Scholar] [CrossRef]
- Steiner, J.L.; Briske, D.D.; Brown, D.P.; Rottler, C.M. Vulnerability of Southern Plains agriculture to climate change. Clim. Chang. 2018, 146, 201–218. [Google Scholar] [CrossRef] [Green Version]
- Dosio, A.; Fischer, E.M. Will half a degree make a difference? Robust projections of indices of mean and extreme climate in Europe under 1.5 °C, 2 °C, and 3 °C global warming. Geophys. Res. Lett. 2018, 45, 935–944. [Google Scholar] [CrossRef] [Green Version]
- Neset, T.S.; Wiréhn, L.; Opach, T.; Glaas, E.; Linnér, B.O. Evaluation of indicators for agricultural vulnerability to climate change: The case of Swedish agriculture. Ecol. Indic. 2019, 105, 571–580. [Google Scholar] [CrossRef]
- UNFCCC. Adoption of the Paris Agreement. Available online: https://unfccc.int/resource/docs/2015/cop21/eng/l09r01.pdf (accessed on 20 December 2019).
- Zhang, C.; Ren, W. Complex climatic and CO2 controls on net primary productivity of temperate dryland ecosystems over Central Asia during 1980–2014. J. Geophys. Res. Biogeosci. 2017, 122, 2356–2374. [Google Scholar] [CrossRef]
- UNFCCC. Report on the Structured Expert Dialogue (SED) on the 2013–2015 Review. Available online: https://unfccc.int/topics/science/workstreams/periodic-review/the-structured-expert-dialogue-the-2013-2015-review (accessed on 20 December 2019).
- Luo, M.; Liu, T.; Meng, F.H.; Duan, Y.C.; Bao, A.M.; Frankl, A.; Maeyer, P.D. Spatiotemporal characteristics of future changes in precipitation and temperature in Central Asia. Int. J. Climatol. 2019, 39, 1571–1588. [Google Scholar] [CrossRef]
- Huang, A.; Zhou, Y.; Zhang, Y.; Huang, D.; Zhao, Y.; Wu, H. Changes of the annual precipitation over central Asia in the twenty-first century projected by multimodels of CMIP5. J. Clim. 2014, 27, 6627–6646. [Google Scholar] [CrossRef]
- Ozturk, T.; Turp, M.T.; Türkeş, M.; Kurnaz, M.L. Projected changes in temperature and precipitation climatology of Central Asia CORDEX Region 8 by using RegCM4. 3.5. Atmos. Res. 2017, 183, 296–307. [Google Scholar] [CrossRef]
- Zhang, G.; Biradar, C.M.; Xiao, X.; Dong, J.; Zhou, Y.; Qin, Y.; Zhang, Y.; Liu, F.; Ding, M.; Thomas, R.J. Exacerbated grassland degradation and desertification in Central Asia during 2000–2014. Ecol. Appl. 2018, 28, 442–456. [Google Scholar] [CrossRef] [PubMed] [Green Version]
- de Beurs, K.; Henebry, G. Land surface phenology, climatic variation, and institutional change: Analyzing agricultural land cover change in Kazakhstan. Remote Sens. Environ. 2004, 89, 497–509. [Google Scholar] [CrossRef]
- Dubovyk, O. Spatiotemporal Assessment of Vegetation Trends in the Post-Soviet Central Asia. In Vegetation of Central Asia and Environs; Egamberdieva, D., Öztürk, M., Eds.; Springer: Cham, Switzerland, 2018; pp. 1–13. [Google Scholar]
- Vuuren, D.P.V.; Edmonds, J.; Kainuma, M.; Riahi, K.; Thomson, A.; Hibbard, K.; Hurtt, G.C.; Kram, T.; Krey, V.; Lamarque, J.F.; et al. The representative concentration pathways: An overview. Clim. Chang. 2011, 109, 5–31. [Google Scholar] [CrossRef]
- IPCC. Climate Change 2014: Synthesis Report. Contribution of Working Groups I, II and III to the Fifth Assessment Report of the Intergovernmental Panel on Climate Change; IPCC: Geneva, Switzerland, 2014; pp. 1–151. [Google Scholar]
- Hempel, S.; Frieler, K.; Warszawski, L.; Schewe, J.; Piontek, F. A trend-preserving bias correction―The ISI-MIP approach. Earth Syst. Dynam. 2013, 4, 219–236. [Google Scholar] [CrossRef] [Green Version]
- Weedon, G.P.; Gomes, S.; Viterbo, P.; Shuttleworth, W.J.; Blyth, E.; Österle, H.; Adam, J.C.; Bellouin, N.; Boucher, O.; Best, M. Creation of the WATCH forcing data and its use to assess global and regional reference crop evaporation over land during the twentieth century. J. Hydrometeorol. 2011, 12, 823–848. [Google Scholar] [CrossRef] [Green Version]
- Dunne, J.P.; John, J.G.; Adcroft, A.J.; Griffies, S.M.; Hallberg, R.W.; Shevliakova, E.N.; Stouffer, R.J.; Cooke, W.; Dunne, K.A.; Harrison, M.J.; et al. GFDL’s ESM2 global coupled climate-carbon earth system models. Part I: Physical formulation and baseline simulation characteristics. J. Clim. 2012, 25, 6646–6665. [Google Scholar] [CrossRef] [Green Version]
- Dunne, J.P.; John, J.G.; Shevliakova, E.N.; Stouffer, R.J.; Krasting, J.P.; Malyshev, S.L.; Milly, P.C.D.; Sentman, L.T.; Adcroft, A.J.; Cooke, W.; et al. GFDL’s ESM2 global coupled climate-carbon earth system models. Part II: Carbon system formulation and baseline simulation characteristics. J. Clim. 2013, 26, 2247–2267. [Google Scholar] [CrossRef] [Green Version]
- Martin, G.M.; Bellouin, N.; Collins, W.J.; Culverwell, I.D.; Halloran, P.R.; Hardiman, S.C.; Hinton, T.J.; Jones, C.D.; McDonald, R.E.; McLaren, A.J.; et al. The HadGEM2 family of Met Office Unified Model climate configurations. Geosci. Model Dev. 2011, 4, 723–757. [Google Scholar] [CrossRef] [Green Version]
- Dufresne, J.L.; Foujols, M.-A.; Denvil, S.; Caubel, A.; Marti, O.; Aumont, O.; Balkanski, Y.; Bekki, S.; Bellenger, H.; Benshila, R.; et al. Climate change projections using the IPSL-CM5 Earth System Model: From CMIP3 to CMIP5. Clim. Dyn. 2013, 40, 2123–2165. [Google Scholar] [CrossRef]
- Watanabe, S.; Hajima, T.; Sudo, K.; Nagashima, T.; Takemura, T.; Okajima, H.; Nozawa, T.; Kawase, H.; Abe, M.; Yokohata, T.; et al. MIROC-ESM 2010: Model description and basic results of CMIP5-20c3m experiments. Geosci. Model Dev. 2011, 4, 845–872. [Google Scholar] [CrossRef] [Green Version]
- Bentsen, M.; Bethke, I.; Debernard, J.B.; Iversen, T.; Kirkevåg, A.; Seland, Ø.; Drange, H.; Roelandt, C.; Seierstad, I.A.; Hoose, C.; et al. The Norwegian Earth System Model, NorESM1-M–Part 1: Description and basic evaluation of the physical climate. Geosci. Model Dev. 2013, 6, 687–720. [Google Scholar] [CrossRef] [Green Version]
- Iversen, T.; Bentsen, M.; Bethke, I.; Debernard, J.B.; Kirkevåg, A.; Seland, Ø.; Drange, H.; Kristjansson, J.E.; Medhaug, I.; Sand, M.; et al. The Norwegian Earth System Model, NorESM1-M–Part 2: Climate response and scenario projections. Geosci. Model Dev. 2013, 6, 389–415. [Google Scholar] [CrossRef] [Green Version]
- IPCC. Technical summary. In Climate Change 2013: The Physical Science Basis. Contribution of Working Group I to the Fifth Assessment Report of the Intergovernmental Panel on Climate Change; Stocker, T.F., Qin, D., Plattner, G.-K., Tignor, M.M.B., Allen, S.K., Boschung, J., Nauels, A., Xia, Y., Bex, V., Midgley, P.M., Eds.; Cambridge University Press: Cambridge, UK; New York, NY, USA, 2013; pp. TS1–TS127. [Google Scholar]
- Ault, T.R.; Mankin, J.S.; Cook, B.I.; Smerdon, J.E. Relative impacts of mitigation, temperature, and precipitation on 21st-century mega drought risk in the American Southwest. Sci. Adv. 2016, 2, e1600873. [Google Scholar] [CrossRef] [Green Version]
- Tebaldi, C.; Knutti, R. The use of the multi-model ensemble in probabilistic climate projections. Philos. Trans. R. Soc. A 2007, 365, 2053–2075. [Google Scholar] [CrossRef]
- Hao, Z.X.; Geng, X.; Wang, F.; Zheng, J.Y. Impacts of climate change on agrometeorological indices at winter wheat overwintering stage in northern China during 2021–2050. Int. J. Climatol. 2018, 38, 5576–5588. [Google Scholar] [CrossRef]
- Kendon, E.J.; Rowell, D.P.; Jones, R.G.; Buonomo, E. Robustness of future changes in local precipitation extremes. J. Clim. 2008, 21, 4280–4297. [Google Scholar] [CrossRef]
- Fowler, H.J.; Ekström, M. Multi-model ensemble estimates of climate change impacts on UK seasonal precipitation extremes. Int. J. Climatol. 2009, 29, 385–416. [Google Scholar] [CrossRef]
- Donat, M.G.; Leckebusch, G.C.; Wild, S.; Ulbrich, U. Future changes in European winter storm losses and extreme wind speeds inferred from GCM and RCM multi-model simulations. Nat. Hazards Earth Syst. Sci. 2011, 11, 1351–1370. [Google Scholar] [CrossRef]
- Sillmann, J.; Kharin, V.V.; Zhang, X.; Zwiers, F.W.; Ronaugh, D. Climate extremes indices in the CMIP5 multimodel ensemble: Part 1. Model evaluation in the present climate. J. Geophys. Res. Atmos. 2013, 118, 1716–1733. [Google Scholar] [CrossRef]
- Vogel, E.; Donat, M.G.; Alexander, L.V.; Meinshausen, M.; Ray, D.K.; Karoly, D.; Meinshausen, N.; Frieler, K. The effects of climate extremes on global agricultural yields. Environ. Res. Lett. 2019, 14, 054010. [Google Scholar] [CrossRef]
- Yuan, Z.; Yan, D.-H.; Yang, Z.-Y.; Yin, J.; Yuan, Y. Temporal and spatial variability of drought in Huang-Huai-Hai River Basin, China. Theor. Appl. Climatol. 2015, 122, 755–769. [Google Scholar] [CrossRef]
- Klein Tank, A.M.G.; Zwiers, F.; Zhang, X.B. Guidelines on analysis of extremes in a changing climate in support of informed decisions for adaptation. In Climate data and Monitoring; WMO: Geneva, Switzerland, 2009; pp. 1–56, WCDMP-No. 72, WMO-TD No. 1500. [Google Scholar]
- Klein Tank, A.M.G.; Peterson, T.C.; Quadir, D.A.; Dorji, S.; Zou, X.; Tang, H.; Santhosh, K.; Joshi, U.R.; Jaswal, A.K.; Kolli, R.K.; et al. Changes in daily temperature and precipitation extremes in central and south Asia. J. Geophys. Res. 2006, 111, 709–720. [Google Scholar] [CrossRef]
- Zhang, X.B.; Hegerl, G.; Zwiers, F.W.; Kenyon, J. Avoiding inhomogeneity in percentile-based indices of temperature extremes. J. Clim. 2005, 18, 1641–1651. [Google Scholar] [CrossRef] [Green Version]
- Droogers, P.; Allen, R.G. Estimating reference evapotranspiration under inaccurate data conditions. Irrig. Drain. Syst. 2002, 16, 33–45. [Google Scholar] [CrossRef]
- Hargreaves, G.H. Defining and Using Reference Evapotranspiration. J. Irrig. Drain. Eng. 1994, 120, 1132–1139. [Google Scholar] [CrossRef]
- Corder, G.W.; Foreman, D.I. Nonparametric Statistics for NonStatisticians: A Step-by-Step Approach; Wiley: Hoboken, NJ, USA, 2009; pp. 57–78. [Google Scholar]
- Yin, G.; Hu, Z.; Chen, X.; Tiyip, T. Vegetation dynamics and its response to climate change in Central Asia. J. Arid Land. 2016, 8, 375–388. [Google Scholar] [CrossRef] [Green Version]
- Lioubimtseva, E.; Henebry, G.M. Grain production trends in Russia, Ukraine and Kazakhstan: New opportunities in an increasingly unstable world? Front Earth Sci. 2012, 6, 157–166. [Google Scholar] [CrossRef]
- Braun, H.J.; Atlin, G.; Payne, T. Multi-location testing as a tool to identify plant response to global climate change. In Climate Change and Crop Production; Reynolds, M., Ed.; CABI: Wallingford, UK, 2010; pp. 115–138. [Google Scholar]
- Sommer, R.; Glazirina, M.; Yuldashev, T.; Otarov, A.; Ibraeva, M.; Martynova, L.; Bekenov, M.; Kholov, B.; Ibragimov, N.; Kobilov, R.; et al. Impact of climate change on wheat productivity in Central Asia. Agric. Ecosyst. Environ. 2013, 178, 78–99. [Google Scholar] [CrossRef]
- de San Celedonio, R.P.; Abeledo, L.G.; Miralles, D.J. Identifying the critical period for waterlogging on yield and its components in wheat and barley. Plant Soil. 2014, 378, 265–277. [Google Scholar] [CrossRef]
- Portmann, F.T.; Siebert, S.; Döll, P. MIRCA2000—Global monthly irrigated and rain-fed crop areas around the year 2000: A new high-resolution data set for agricultural and hydrological modeling. Glob. Biogeochem. Cycles 2010, 24, GB1011. [Google Scholar] [CrossRef]
- Wada, Y.; Wisser, D.; Eisner, S.; Flörke, M.; Gerten, D.; Haddeland, I.; Hanasaki, N.; Masaki, Y.; Portmann, F.T.; Stacke, T.; et al. Multimodel projections and uncertainties of irrigation water demand under climate change. Geophys. Res. Lett. 2013, 40, 4626–4632. [Google Scholar] [CrossRef] [Green Version]
- Bekchanov, M.; Lamers, J.P.A. Economic costs of reduced irrigation water availability in Uzbekistan (Central Asia). Reg. Environ. Chang. 2016, 16, 2369–2387. [Google Scholar] [CrossRef]
- Nikanorova, A.; Dronin, N. Optimal Future for the Irrigation Agriculture under Climate Change in the Fergana Valley, Central Asia. Int. J. Environ. Sci. Nat. Res. 2017, 3, 555607. [Google Scholar] [CrossRef]
- Tian, J.; Zhang, Y.Q. Detecting changes in irrigation water requirement in Central Asia under CO2 fertilization and land use changes. J. Hydrol. 2020, 583, 124315. [Google Scholar] [CrossRef]
- Rakhmatullaev, S.; Abdullaev, I. Central Asian irrigation sector in a climate change context: Some reflections. J. Water Clim. Chang. 2014, 5, 341–356. [Google Scholar] [CrossRef]
- UNFCCC. Second National Communication of the Republic of Uzbekistan under the United Nations Framework Convention on Climate Change. Available online: https://unfccc.int/resource/docs/natc/uzbnc2e.pdf (accessed on 15 January 2020).
- Christmann, S.; Martius, C.; Bedoshvili, D.; Bobojonov, I.; Carli, C.; Devkota, K.; Ibragimov, Z.; Khalikulov, Z.; Kienzler, K.; Manthrithilake, H.; et al. Food Security and Climate Change in Central Asia and the Caucasus.; CGIAR-PFU; ICARDA: Tashkent, Uzbekistan, 2009; pp. 1–75. [Google Scholar]
- Sutton, W.R.; Srivastava, J.P.; Neumann, J.E.; Droogers, P.; Boehlert, B.B. Reducing the Vulnerability of Uzbekistan’s Agricultural Systems to Climate Change. Impact Assessment and Adaptation Options.; The World Bank: Washington, DC, WA, USA, 2013; pp. 1–145. [Google Scholar]
- Xu, H.J.; Wang, X.P.; Zhang, X.X. Decreased vegetation growth in response to summer drought in Central Asia from 2000 to 2012. Int. J. Appl. Earth Obs. Geoinf. 2016, 52, 390–402. [Google Scholar] [CrossRef]
- Nurberdiev, M.; Bekieva, G.S.; Mamedov, B.K.; Orlovsky, L. Drought and pastures productivity on plains of Turkmenistan. Arid Ecosyst. 2009, 15, 43–49. [Google Scholar]
- Reyer, C.P.O.; Otto, I.M.; Adams, S.; Albrecht, T.; Baarsch, F.; Cartsburg, M.; Coumou, D.; Eden, A.; Ludi, E.; Marcus, R.; et al. Climate change impacts in Central Asia and their implications for development. Reg. Environ. Chang. 2017, 17, 1639–1650. [Google Scholar] [CrossRef]
- Naumann, G.; Alfieri, L.; Wyser, K.; Mentaschi, L.; Betts, R.A.; Carrao, H.; Spinoni, J.; Vogt, J.; Feyen, L. Global changes in drought conditions under different levels of warming. Geophys. Res. Lett. 2018, 45, 3285–3296. [Google Scholar] [CrossRef]
- ITC. Cotton and Climate Change: Impacts and Options to Mitigate and Adapt; International Trade Centre: Geneva, Switzerland, 2011; pp. 1–32. [Google Scholar]
- Bucknall, J.; Klytchnikova, I.; Lampietti, J.; Lundell, M.; Scatasta, M.; Thurman, M. Irrigation in Central Asia: Social, Economic and Environmental Considerations; The World Bank: Washington, D.C., WA, USA, 2003; pp. 1–104. [Google Scholar]
- CAREC. Gap Analysis on Adaptation to Climate Change in Central Asia. Available online: http://www.asiapacificadapt.net/sites/default/files/resource/attach/carec-climate-change-adaptation-gaps-needs-assessment.pdf (accessed on 15 January 2020).
- Viter, A.; Zsarnóczai, S.J.; Laszlo, V. Climate change impact on crop production in Central Asian countries. Appl. Stud. Agribus. Commer. 2015, 9, 75–82. [Google Scholar] [CrossRef]
Figure 1.
Country distribution and elevation of Central Asia.

Figure 2.
Projected changes in annual mean surface air temperature over the globe. Changes are relative to 1986–2005 mean, with a 20-year smoothing applied. Thick lines represented the multi-model mean, and the shaded parts showed the interquartile range of the five models. The dashed lines represented 1.5 °C and 2 °C global warming levels.

Figure 3.
The spatial distribution of annual mean temperature (TAVG) in the reference period (1986–2005) (a) and the difference under 1.5 °C (b) and 2 °C (c) global warming relative to the reference period. Dark gray dots indicate that the increasing trends are significant at the 1% level in these grids.

Figure 4.
The spatial distribution of the warm days (TX90P) in the reference period (1986–2005) (a) and the difference under 1.5 °C (b) and 2 °C (c) global warming relative to the reference period. Dark gray dots indicate that the increasing trends are significant at the 1% level in these grids.
Figure 4.
The spatial distribution of the warm days (TX90P) in the reference period (1986–2005) (a) and the difference under 1.5 °C (b) and 2 °C (c) global warming relative to the reference period. Dark gray dots indicate that the increasing trends are significant at the 1% level in these grids.

Figure 5.
The spatial distribution of the growing season length (GSL) in the reference period (1986–2005) (a) and the difference under 1.5 °C (b) and 2 °C (c) global warming relative to the reference period. Dark gray dots indicate that the increasing trends are significant at the 1% level in these grids.

Figure 6.
The spatial distribution of the mean annual total precipitation (PRCPTOT) in the reference period (1986–2005) (a) and the difference under 1.5 °C (b) and 2 °C (c) global warming relative to the reference period. Dark gray dots indicate that the increasing trends are significant at the 1% level in these grids.

Figure 7.
The spatial distribution of the very wet days (R95P) in the reference period (1986–2005) (a) and the difference under 1.5 °C (b) and 2 °C (c) global warming relative to the reference period. Dark gray dots indicate that the increasing trends are significant at the 1% level in these grids. Green dots indicate a decrease in PRCPTOT and an increase in R95P.

Figure 8.
The spatial distribution of the consecutive dry days (CDD) in the reference period (1986–2005) (a) and the difference (b) under 1.5 °C and (c) 2 °C global warming relative to reference period. Blue dots indicate that the decreasing trends are significant at the 1% level in these grids. Red dots indicate that the increasing trends are significant at the 1% level.

Figure 9.
The spatial distribution of standardized precipitation evapotranspiration index (SPEI) in the reference period (1986–2005) (a) and the difference under 1.5 °C (b) and 2 °C (c) global warming relative to the reference period. Dark gray dots indicate that the decreasing trends are significant at the 1% level in these grids.

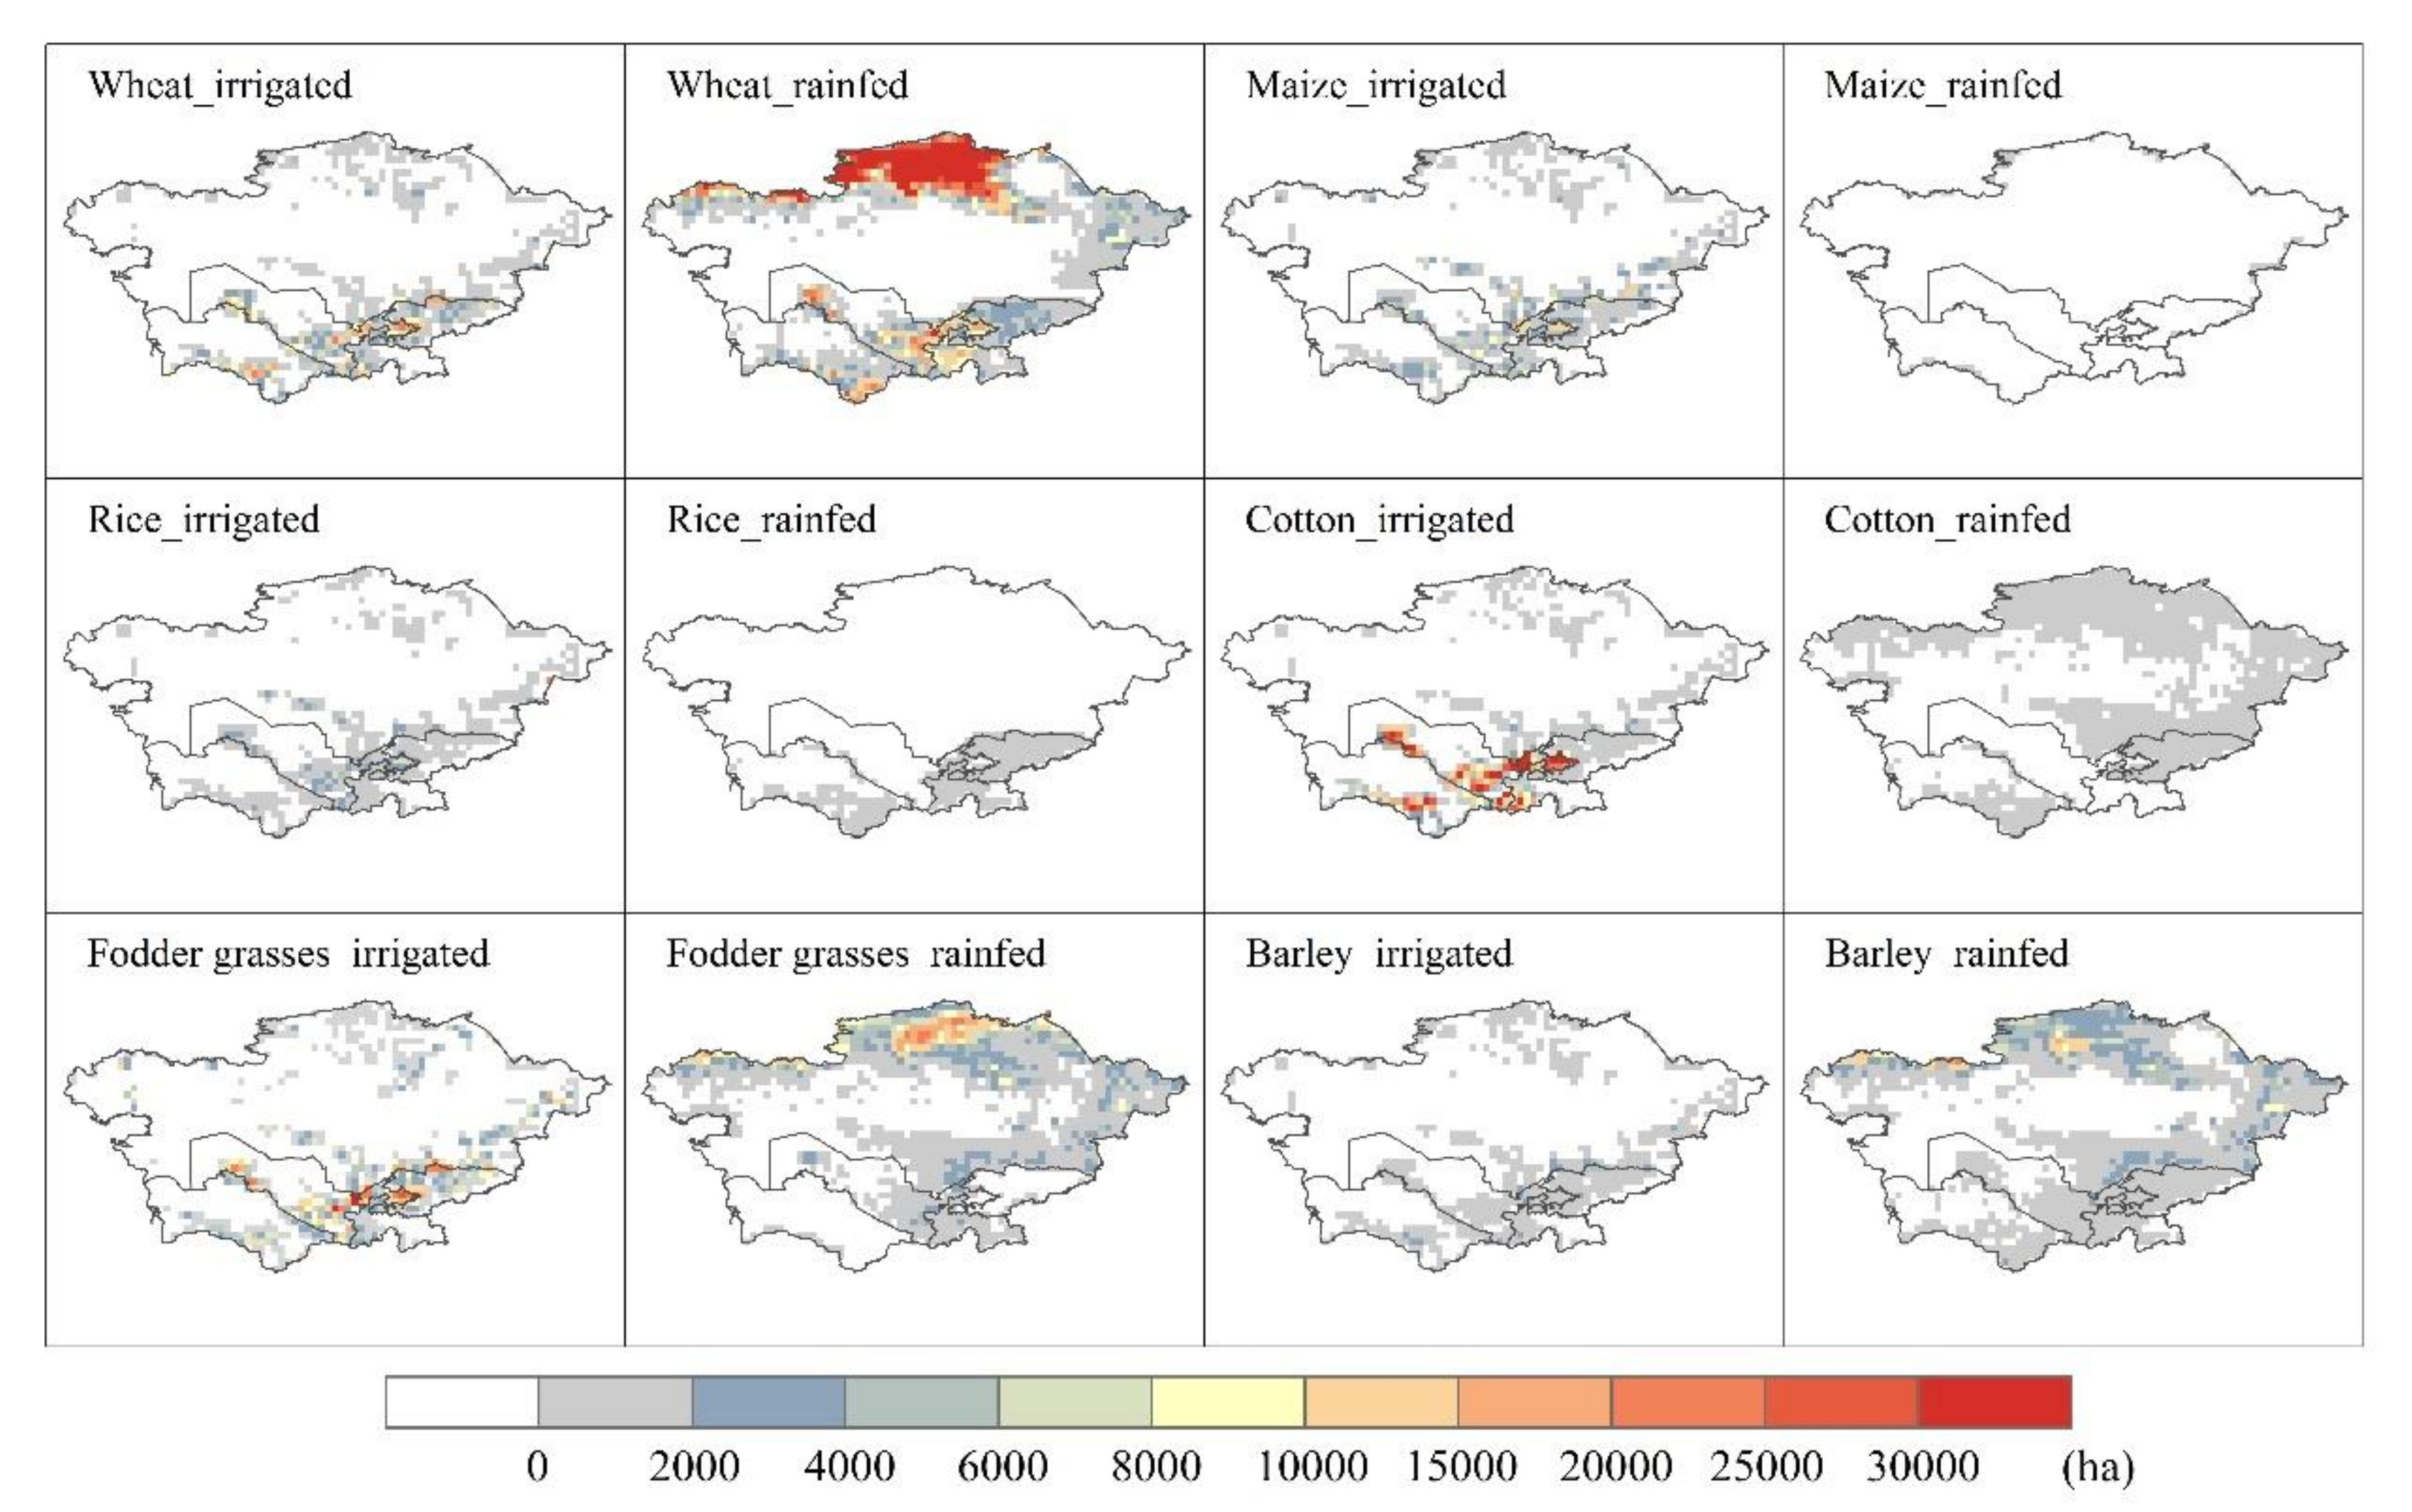
Figure 10.
The spatial distribution of harvested areas around the year 2000 for the main crops in Central Asia [63].
Figure 10.
The spatial distribution of harvested areas around the year 2000 for the main crops in Central Asia [63].


Table 1.
Information of five CMIP5 climate models.
| Model | Source | Resolution (Lat × Lon) | References |
|---|---|---|---|
| GFDL-ESM2M | National Oceanic and Atmospheric Administration Geophysical Fluid Dynamics Laboratory, American | 2° × 2.5° | [35,36] |
| HadGEM2-ES | Met Office Hadley Centre, England | 1.25° × 1.875° | [37] |
| IPSL-CM5A-LR | Institute Pierre Simon Laplace, France | 1.875° × 3.75° | [38] |
| MIROC-ESM-CHEM | Japan Agency for Marine-Earth Science and Technology | 2.8125° × 2.8125° | [39] |
| NorESM1-M | Norwegian Climate Centre, Norway | 1.875° × 2.5° | [40,41] |
Table 2.
Definitions of the selected climate indices.
| Index | Description | Definition | Unit |
|---|---|---|---|
| TAVG | Annual mean temperature | Annual mean temperature | °C |
| TX90P | Warm days | Annual days when daily maximum temperature >90th percentile | days |
| GSL | Growing season length | Annual (1st January to 31st December in northern hemisphere, 1st July to 30th June in southern hemisphere) count between the first span of at least 6 days with daily average temperature >5 °C and the first span after July 1 (January 1 in southern hemisphere) of 6 days with daily average temperature <5 °C | days |
| PRCPTOT | Annual total wet-day precipitation | Annual total precipitation of wet days (daily precipitation ≥1 mm) | mm |
| R95P | Very wet days | Annual total precipitation when daily precipitation >95% | mm |
| CDD | Consecutive dry days | Maximum number of consecutive days with daily precipitation <1 mm | days |
| SPEI | Standardized Precipitation Evapotranspiration Index | The monthly (or weekly) difference between precipitation and potential evapotranspiration. | / |
Table 3.
The timings of 1.5 °C and 2 °C global warming simulated by five models and their ensemble.
| Model | Global Warming Level | |
|---|---|---|
| 1.5 °C | 2 °C | |
| GFDL-ESM2M | / | / |
| HadGEM2-ES | 2010–2029 | 2028–2047 |
| IPSL-CM5A-LR | 2020–2039 | 2035–2054 |
| MIROC-ESM-CHEM | 2010–2029 | 2030–2049 |
| NorESM1-M | / | 2060–2079 |
| Multi-model ensemble | 2020–2039 | 2040–2059 |
Table 4.
Changes in temperature extreme indices under 1.5 °C and 2 °C global warming.
| Country | TAVG (°C) | TX90P (Days) | GSL (Days) | |||
|---|---|---|---|---|---|---|
| 1.5 °C | 2 °C | 1.5 °C | 2 °C | 1.5 °C | 2 °C | |
| Kazakhstan | 1.57 | 2.45 | 64.04 | 115.65 | 8.71 | 13.83 |
| Kyrgyzstan | 1.44 | 2.03 | 75.28 | 131.79 | 14.26 | 21.57 |
| Tajikistan | 1.29 | 2.03 | 102.00 | 165.86 | 19.44 | 27.04 |
| Turkmenistan | 1.25 | 2.06 | 73.08 | 133.02 | 12.39 | 16.96 |
| Uzbekistan | 1.21 | 2.01 | 73.29 | 135.75 | 12.95 | 17.39 |
| Entire Central Asia | 1.48 | 2.34 | 67.67 | 121.91 | 10.10 | 15.26 |
Table 5.
Changes in precipitation extreme indices under 1.5 and 2 °C global warming.
| Country | PRCPTOT(%) | R95P(%) | CDD(days) | SPEI | ||||
|---|---|---|---|---|---|---|---|---|
| 1.5 °C | 2 °C | 1.5 °C | 2 °C | 1.5 °C | 2 °C | 1.5 °C | 2 °C | |
| Kazakhstan | 8.89 | 5.48 | 28.72 | 29.98 | −0.9 | 0.6 | −0.54 | −1.72 |
| Kyrgyzstan | 2.62 | 2.33 | 12.15 | 19.75 | −1.5 | −0.4 | −0.74 | −1.64 |
| Tajikistan | 4.12 | 2.33 | 27.79 | 15.82 | 1.7 | 1.1 | −0.75 | −1.59 |
| Turkmenistan | 3.55 | −4.94 | 7.70 | −9.06 | −4.1 | 2.1 | −0.82 | −1.96 |
| Uzbekistan | 5.91 | −1.91 | 31.51 | 13.28 | −0.1 | 1.9 | −0.70 | −1.88 |
| Entire Central Asia | 7.68 | 3.89 | 26.55 | 24.78 | −1.1 | 0.8 | −0.60 | −1.75 |
© 2020 by the authors. Licensee MDPI, Basel, Switzerland. This article is an open access article distributed under the terms and conditions of the Creative Commons Attribution (CC BY) license (http://creativecommons.org/licenses/by/4.0/).
Share and Cite
MDPI and ACS Style
Liu, Y.; Geng, X.; Hao, Z.; Zheng, J. Changes in Climate Extremes in Central Asia under 1.5 and 2 °C Global Warming and their Impacts on Agricultural Productions. Atmosphere 2020, 11, 1076. https://doi.org/10.3390/atmos11101076
AMA Style
Liu Y, Geng X, Hao Z, Zheng J. Changes in Climate Extremes in Central Asia under 1.5 and 2 °C Global Warming and their Impacts on Agricultural Productions. Atmosphere. 2020; 11(10):1076. https://doi.org/10.3390/atmos11101076
Chicago/Turabian StyleLiu, Yang, Xiu Geng, Zhixin Hao, and Jingyun Zheng. 2020. "Changes in Climate Extremes in Central Asia under 1.5 and 2 °C Global Warming and their Impacts on Agricultural Productions" Atmosphere 11, no. 10: 1076. https://doi.org/10.3390/atmos11101076
Note that from the first issue of 2016, this journal uses article numbers instead of page numbers. See further details here.