Hyperspectral and Lidar: Complementary Tools to Identify Benthic Features and Assess the Ecological Status of Sabellaria alveolata Reefs
 Touria Bajjouk1*
  Cecile Jauzein2
  Lucas Drumetz3
  Mauro Dalla Mura4,5 Audrey Duval6
  Stanislas F. Dubois1
- 1Ifremer, Dynamiques des Ecosystèmes Côtiers (DYNECO), Laboratoire d’Ecologie Benthique Côtière (LEBCO), Plouzané, France
- 2Ifremer, Dynamiques des Ecosystèmes Côtiers (DYNECO), Laboratoire d’Ecologie Pélagique (PELAGOS), Plouzané, France
- 3Laboratoire des Sciences et Techniques de l’Information, de la Communication et de la Connaissance (Lab-STICC), IMT Atlantique, Université Bretagne Loire (UBL), Brest, France
- 4Gipsa Lab, Grenoble INP, Centre National de la Recherche Scientifique (CNRS), University of Grenoble Alpes, Grenoble, France
- 5Tokyo Tech World Research Hub Initiative (WRHI), School of Computing, Tokyo Institute of Technology, Tokyo, Japan
- 6Ifremer, LITTORAL, Laboratoire Environnement Ressources de Bretagne Occidentale (LERBO), Concarneau, France
Sabellaria alveolata is a sedentary gregarious tube-building species widely distributed from southwest Scotland to Morocco. This species builds what are currently considered the largest European biogenic reefs in the bay of Mont-Saint-Michel (France). As an ecosystem engineer, S. alveolata generates small to large scale topographic complexity, creating numerous spatial and trophic niches for other species to colonize. Sabellaria reefs are also under anthropogenic pressures, leading locally to massive degradation. However, stakeholders lack spatially explicit measures of reef ecological status, at adapted spatial resolution to provide key management information for this protected habitat. Traditional field surveys are extremely time-consuming and rely on expertise for visual ecological status assessment. The present study aims at using an automatic processing approach based on optical airborne data to (i) assess the potential of hyperspectral imagery to discriminate Sabellaria bioconstructions and its main ecosystem associated habitats, including different types of substrate as well as biological components and (ii) to use the combination of the hyperspectral and LiDAR signals to estimate the spatial structure of the different bioconstruction types (veneers vs. hummocks and platforms) and ecological phases (retrograding and prograding). A reef from Mont-Saint-Michel was used as a test site. We built a processing chain based on supervised classification using the Mahalanobis distance to generate an accurate distribution map (overall accuracy of 88% and a Kappa of 0.85) of 10 Sabellaria-related benthic features, including large reef developing on sand and smaller veneers encrusting rocky shore areas. Specific spectral indices were used to define the spatial distribution of the main primary producers, in particular the microphytobenthos. Joining the hyperspectral and LiDAR data led characterizing the distribution of S. alvealata’s ecological status (prograding and retrograding phases) with an overall classification accuracy and Kappa coefficient that can respectively amount to up to 93 and 0.86. In our study site, the Sabellaria reef area (between 5.52 and 6.76 ha) was dominated by retrograding phases (between 53 and 58%). Our results showed that this automatic processing chain could be relevant for the spatial characterization of other Sabellaria reef sites. Study perspectives tend toward a quantitative estimation of their ecological status index.
Introduction
Biogenic reefs are not only limited to coral reefs but also include a wide variety of species capable of building biogenic structures (or bioconstructions), including the gregarious tube-building worms of the Sabellariidae family. Over the world coastlines, large bioconstructions are found on the coasts of South America, built by the species Phragmatopoma lapidosa (Kinberg, 1866) and Sabellaria wilsoni (Lana and Gruet, 1989). On European coasts, the largest intertidal bioconstructions are built by the species Sabellaria alveolata (Linnaeus, 1767), which is presented from the north of the English coast to the south of the Moroccan coast. Sabellaria growths mainly on rocky area (Muir et al., 2016), but can also be present on soft sediments. In France, the Sainte-Anne reef (Mont-Saint-Michel bay) is known as the largest European bioconstruction. S. alveolata is an engineer species that generates small to large scale topographic complexity and creates numerous spatial and trophic niches for other species to colonize (Dubois et al., 2002, 2006; Bonifazi et al., 2019). Moreover, by modifying local hydrodynamics, S. alveolata reef structures also impact the habitats of benthic assemblages located in the immediately surrounding sediments (Dubois et al., 2002; Jones et al., 2018).
S. alveolata reefs are also under direct mechanical disturbances (recreational fishing) and indirect anthropogenic pressures (shellfish cultures) that can lead to massive degradation of some reef areas. Current damages are characterized by irregular surface features with lower densities of S. alveolata tubes (Dubois et al., 2002). Gruet (1982) described an evolving S. alveolata morphotype, from “veneers,” where the tubes adhere to the substratum, to “hummocks” where the tubes radiate out from the initial settlement point before reaching “platforms” formed of extensive areas of hummocks fused together. Any one of these types can display outward signs of being in a “progradation” or “retrogradation” phases (Curd et al., 2019), either partially or totally. At European level, these formations are targeted, under the designation of Special Areas of Conservation (SACs), as a part of marine habitat (type 1170 “Reef”) to be protected by the European Union’s Habitats Directive 92/43/EEC. The latter states that bioconstructions should currently be monitored in order to acquire the missing knowledge regarding their management and ultimately their preservation.
Several studies searched for indicators to characterize the ecological state of S. alveolata reefs. Desroy et al. (2011) developed a “Health Status Index” for the Mont-Saint-Michel bay bioconstructions, based on fragmentation, morphological types and epibiont coverage. However, this index is only applicable to areas where S. alveolata formations reach extensive bioconstructions, which strongly restricts its application potential. More recently, Curd et al. (2019) attempted to investigate the relationship between the structural appearance of the bioconstruction and physiological state of the tube-building polychete. In this study, physiological indicators (lipid markers and metabolic enzymes) were used as biochemical indicators of S. alveolata health status, and linked to bioconstructions types (veneers or hummocks). Biochemical analyses are useful tools to investigate worm’s health status, but they are costly, time-consuming and not always connected to the reef status or phase (progradation vs. retrogradation). Other indicators were previously developed from in situ surveys. However, their use is limited to the surrounding extension of the evaluated area: analysis carried out on a larger scale (whole reef) leads to a simplification of the “landscape” and therefore potentially to wrong reef ecological assessments. Jones et al. (2018) analyzed the effects of a continuous and increasing disturbance on beta diversity indices. They also stressed the importance of spatial and temporal scales for evaluating the impact of disturbances on S. alveoata reefs. Indeed, there is a real need for effective management to develop alternative analytical tools that (i) allow for approaching metrics measured in situ to assess conservation status on a large scale and (ii) guarantee robust reproducibility of acquired information. Moreover, all these studies used destructive sampling techniques, which although still commonplace in benthic ecology, are not viable options in low-abundance habitats (Beisiegel et al., 2017).
Several studies of S. alveolata reefs have been achieved using remote sensing techniques. Acoustic tools were more specifically adopted as suitable method for Sabellaria reefs in subtidal areas (Griffin et al., 2020). The most the studies were mainly based on aerial photography (Bonnot-Courtois et al., 2005; Desroy et al., 2011) or satellite imagery (Marchand and Cazoulat, 2003; Jones, 2017) as well as UAVs (unmanned aerial vehicles) as an efficient and cost-effective tool for fine scale reef characterization (Ventura et al., 2018; Collin et al., 2019). Noernberg et al. (2010) have also exploited aerial photographs and LiDAR (Light Detection and RAnging) digital elevation model to quantify intertidal complex landform volume. A more recent work used artificial neural network modeling to map S. alveolata relative abundance (Collin et al., 2018). Such studies have been successful to investigate reef formations developing on soft-sediment, where bioconstructions sit on top of sediment are discrete objects relatively easy to identify. Yet, most of the reef formations in Europe develop over hard rocky substrata, and compete for space with other species and macroalgae (Firth et al., 2015). To the best of our knowledge, no study has tackled the problem of automatically separating reef bioconstructions from other associated benthic features in a rocky reef environment, nor has any study tried to remotely and automatically assess S. alveolata reef ecological status.
To overcome limitations in large scale S. alveolata reef characterization, we propose an approach based on the combination of two complementary techniques: (i) LiDAR a widely used tool to depict the 3D habitat structural complexity (Wedding et al., 2008; Davies and Asner, 2014; D’Urban et al., 2020) and (ii) hyperspectral imagery that allows for the characterization of bio-optical properties variability in time and space (Fyfe, 2003; Schmidt and Skidmore, 2003; Chennu et al., 2013; Bajjouk et al., 2019b). Hyperspectral imagery has been used in coastal areas to study shallow tropical coral reefs, reef-forming species with symbiotic microalgae species with primary photosynthetic pigments (Petit et al., 2017; Bajjouk et al., 2019a). Characterizing reef-forming species such as S. alveolata, a species without photosynthetic pigments and obvious spectral reflectance is a challenging task. By using hyperspectral images coupled with field observations, we also aim at better estimating the microphytobenthos (hereafter MPB) spatial distribution in sediments surrounding the bioconstructions. MPB is a key information for understanding the role of engineered habitats and species biological activities (feces and pseudofaeces) (Echappé et al., 2018).
We address here three main questions: (1) Do the bioconstructions of S. alveolata have a specific spectral signature, so that one can discriminate reefs from other associated habitats, including MPB patches (2) Does the spectral signature of S. alveolata bioconstructions allow for the identification of reef constructions affixed to intertidal rocky substrate as well as soft-sediments? (3) Can we automatically and remotely estimate the ecological health status of these bioconstructions based on hyperspectral and LiDAR signal combination? Reefs located in the bay of Mont-Saint-Michel were used as a test site. Resulting spatial patterns are discussed regarding their ecological coherence. Future developments are finely formulated for S. alveolata conservation and management perspectives.
Study Site Description
The Bay of Mont-Saint-Michel (France) is a coastal area of the Western part of the English Channel. The study site, named Champeaux (−1.53°, 48.73°), was located in the east part of this bay that hosts the largest S. alveolata reefs in Europe (Figure 1). The sedimentary environment of the bay is mainly controlled by tidal residual currents, typically characterized by an anticyclonic gyre (Noernberg et al., 2010). This site was chosen for its bioconstruction density and diversity of habitats: it includes both reefs developing on sand and bioconstructions developing on rocky shores (Lecornu et al., 2016) and stretches from the upper intertidal to the lower eulittoral zone.
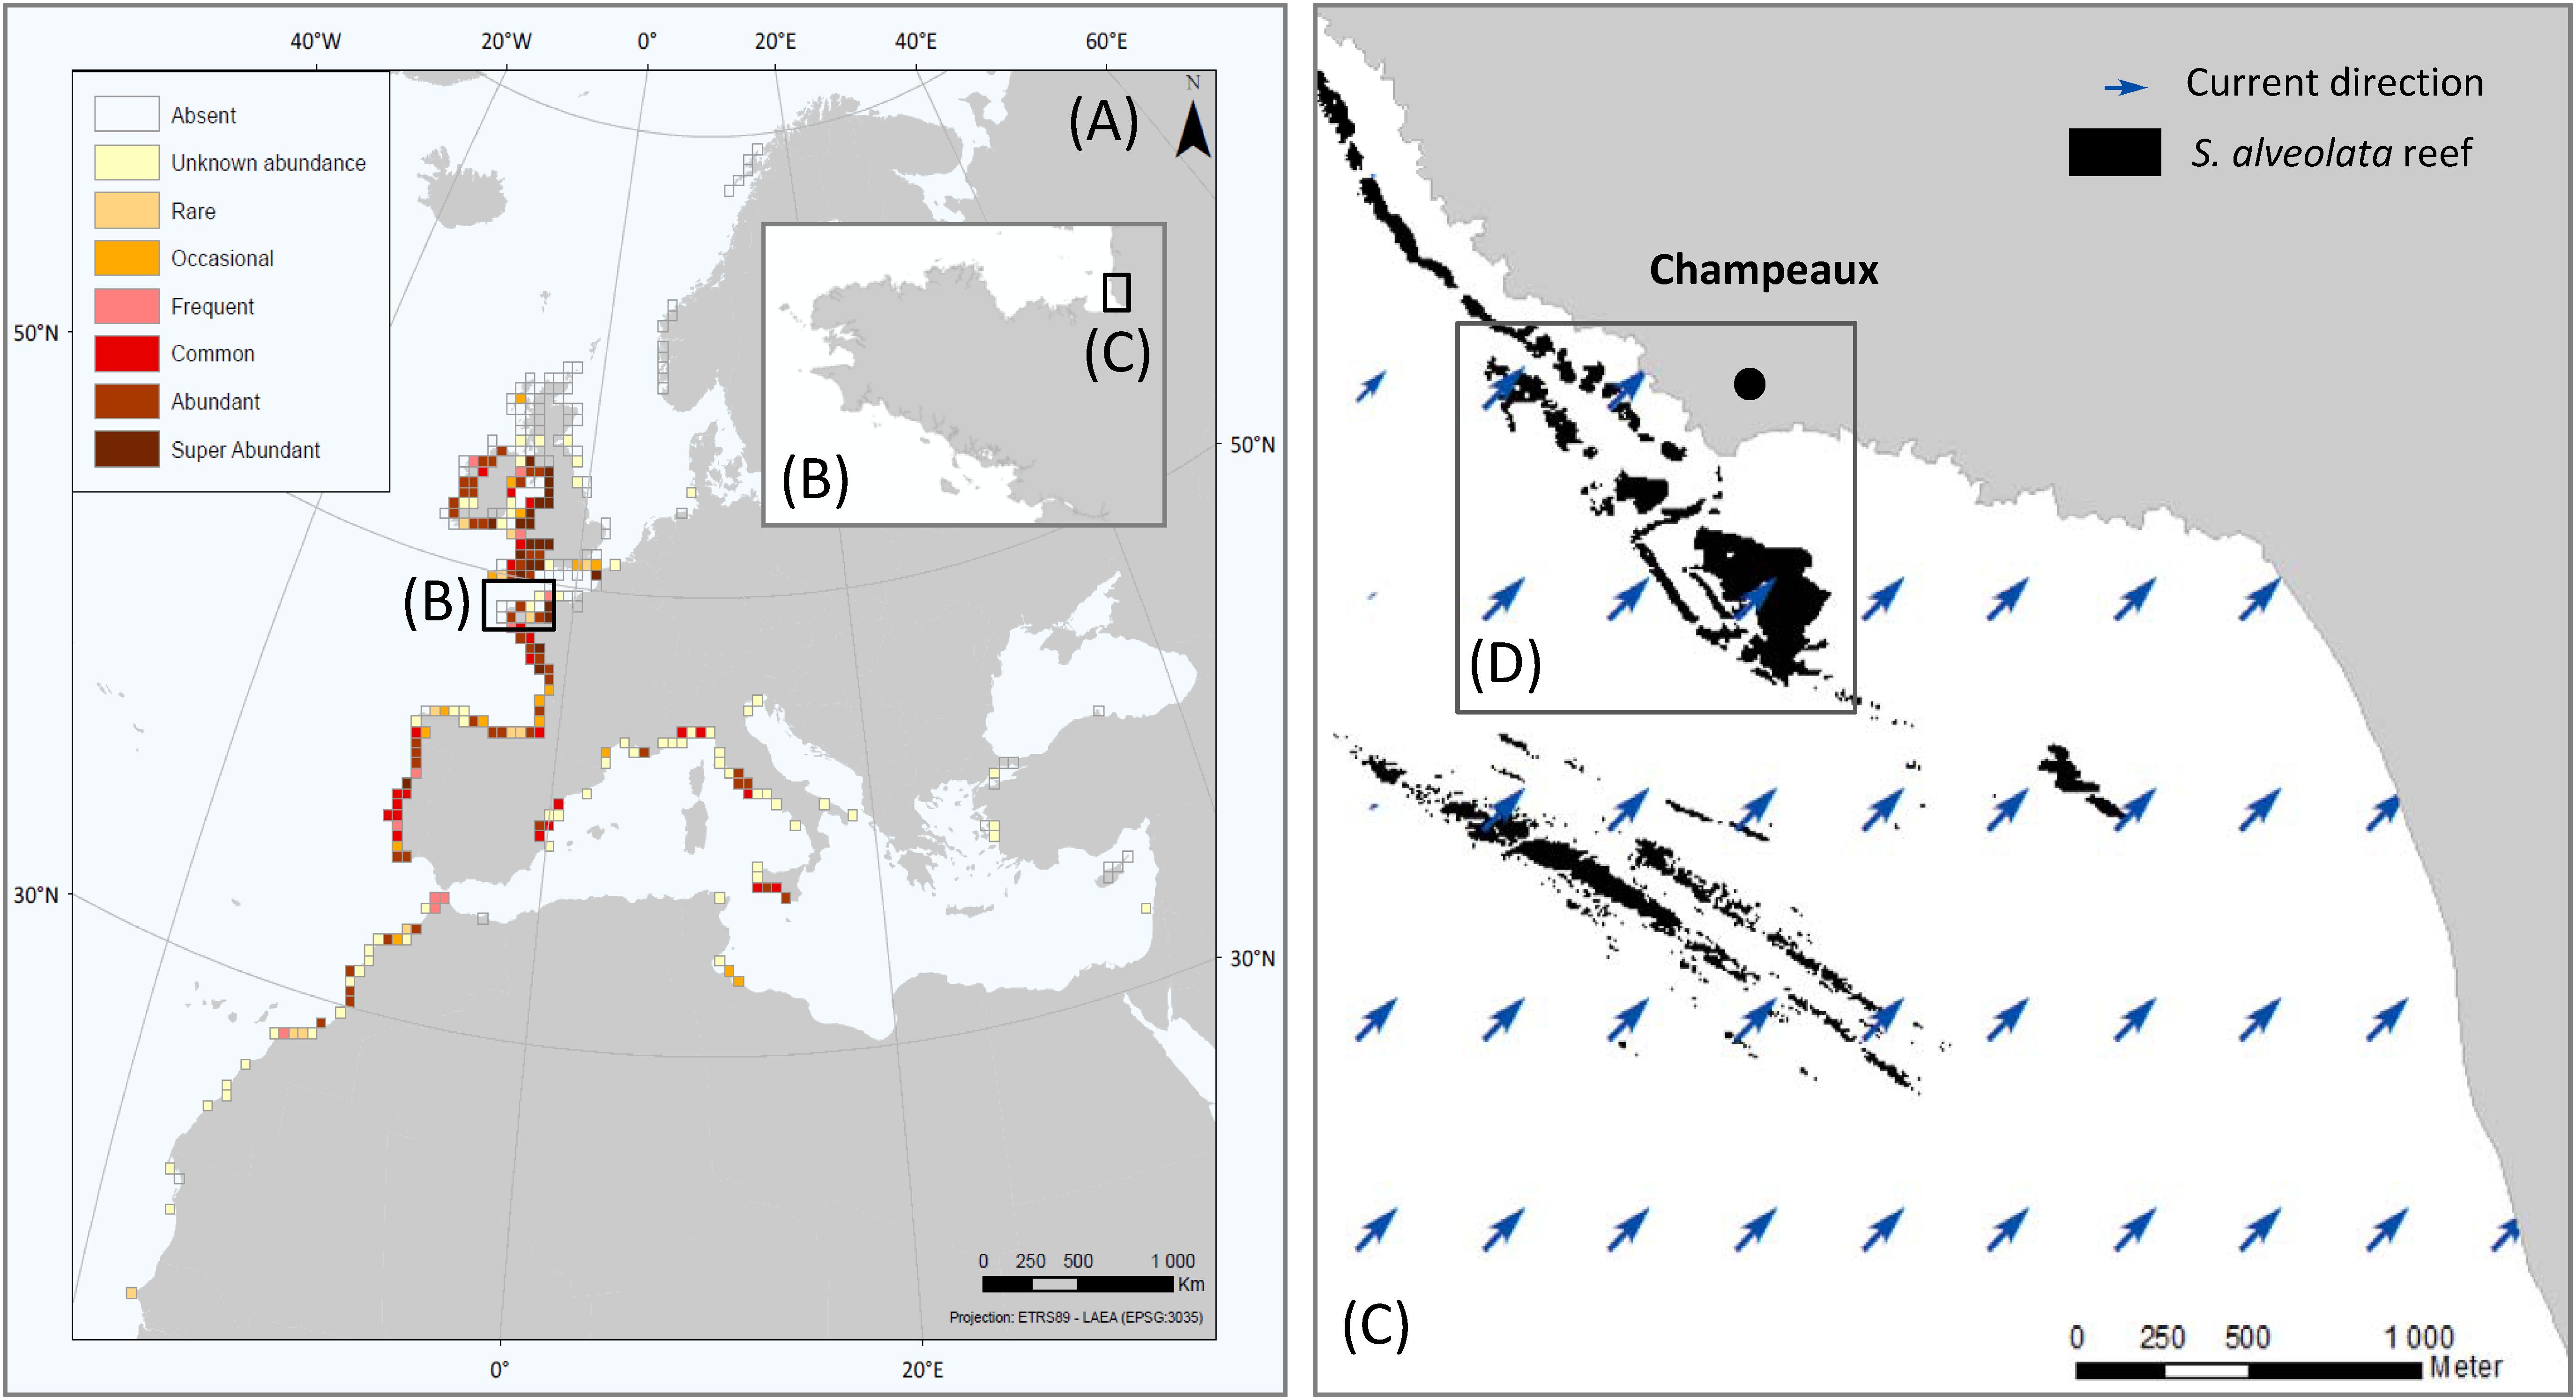
Figure 1. Global distribution and abundance of S. alveolata (from Curd et al., 2020) (A), Brittany region (B), Eastern part of Mont-Saint-Michel bay (C) and study site showing S. alveolata existing map (from Basuyaux and Lecornu, 2015) (D).
In Champeaux, S. alveolata can build three-dimensional structures which present a variety of morphotypes (Gruet, 1972; Curd et al., 2019): elevated platforms, more or less coalescent ball-shaped structures (hummocks) or adhering to rocks (veneers). Each morphological structure can display different phases in the reef dynamics: progradation, where bioconstructions are expanding, with new surfaces colonized by the worms and retrogradation, where bioconstructions are eroding and reef surfaces are lost (Curd et al., 2019).
Materials and Methods
Data Acquisition
Field and Laboratory Measurements
Several field surveys were carried out in 2019 across Champeaux site during the low spring tides:
(i) A field spectral library was acquired on the 22nd of April. Reflectance spectra were measured on 505 channels from 325 to 1075 nm using an Analytical Spectral Devices (ASD) field spectroradiometer that automatically averages 5 multiple records to provide a single output. The ASD was calibrated via a spectralon to provide reflectance standardized measurements. Reflectance recordings were carried out vertically, avoiding any shadow on the target and at a height allowing a homogeneous footprint. For each target, about three to five spectra were recorded to take into account intra-target variability. These measurements were taken on different homogeneous samples representing different types of benthic features: the spectral library is composed of 53 reflectance spectra of 10 different pure targets including three vegetation types (green and brown algae, MPB), S. alveolata bioconstructions developing on both rock and sediment area at different ecological phases, oyster reefs as well as substrate types (mud, sand, shells and rocks). Principal component analysis (PCA) was used as an exploratory tool to summarize and to visualize the information in the benthic features described by their spectral signatures. PCA was performed using R statistical software.
(ii) A total of 221 field control points (Figure 2B) were set on the 17th and 18th of June. Photography is associated with each spectroradiometric measurement. All the descriptive information of the target (substrates and epibionts) was also recorded for each measurement. Efforts were made to cover a wide range of ecologically diverse features of the reef providing an on-foot access.
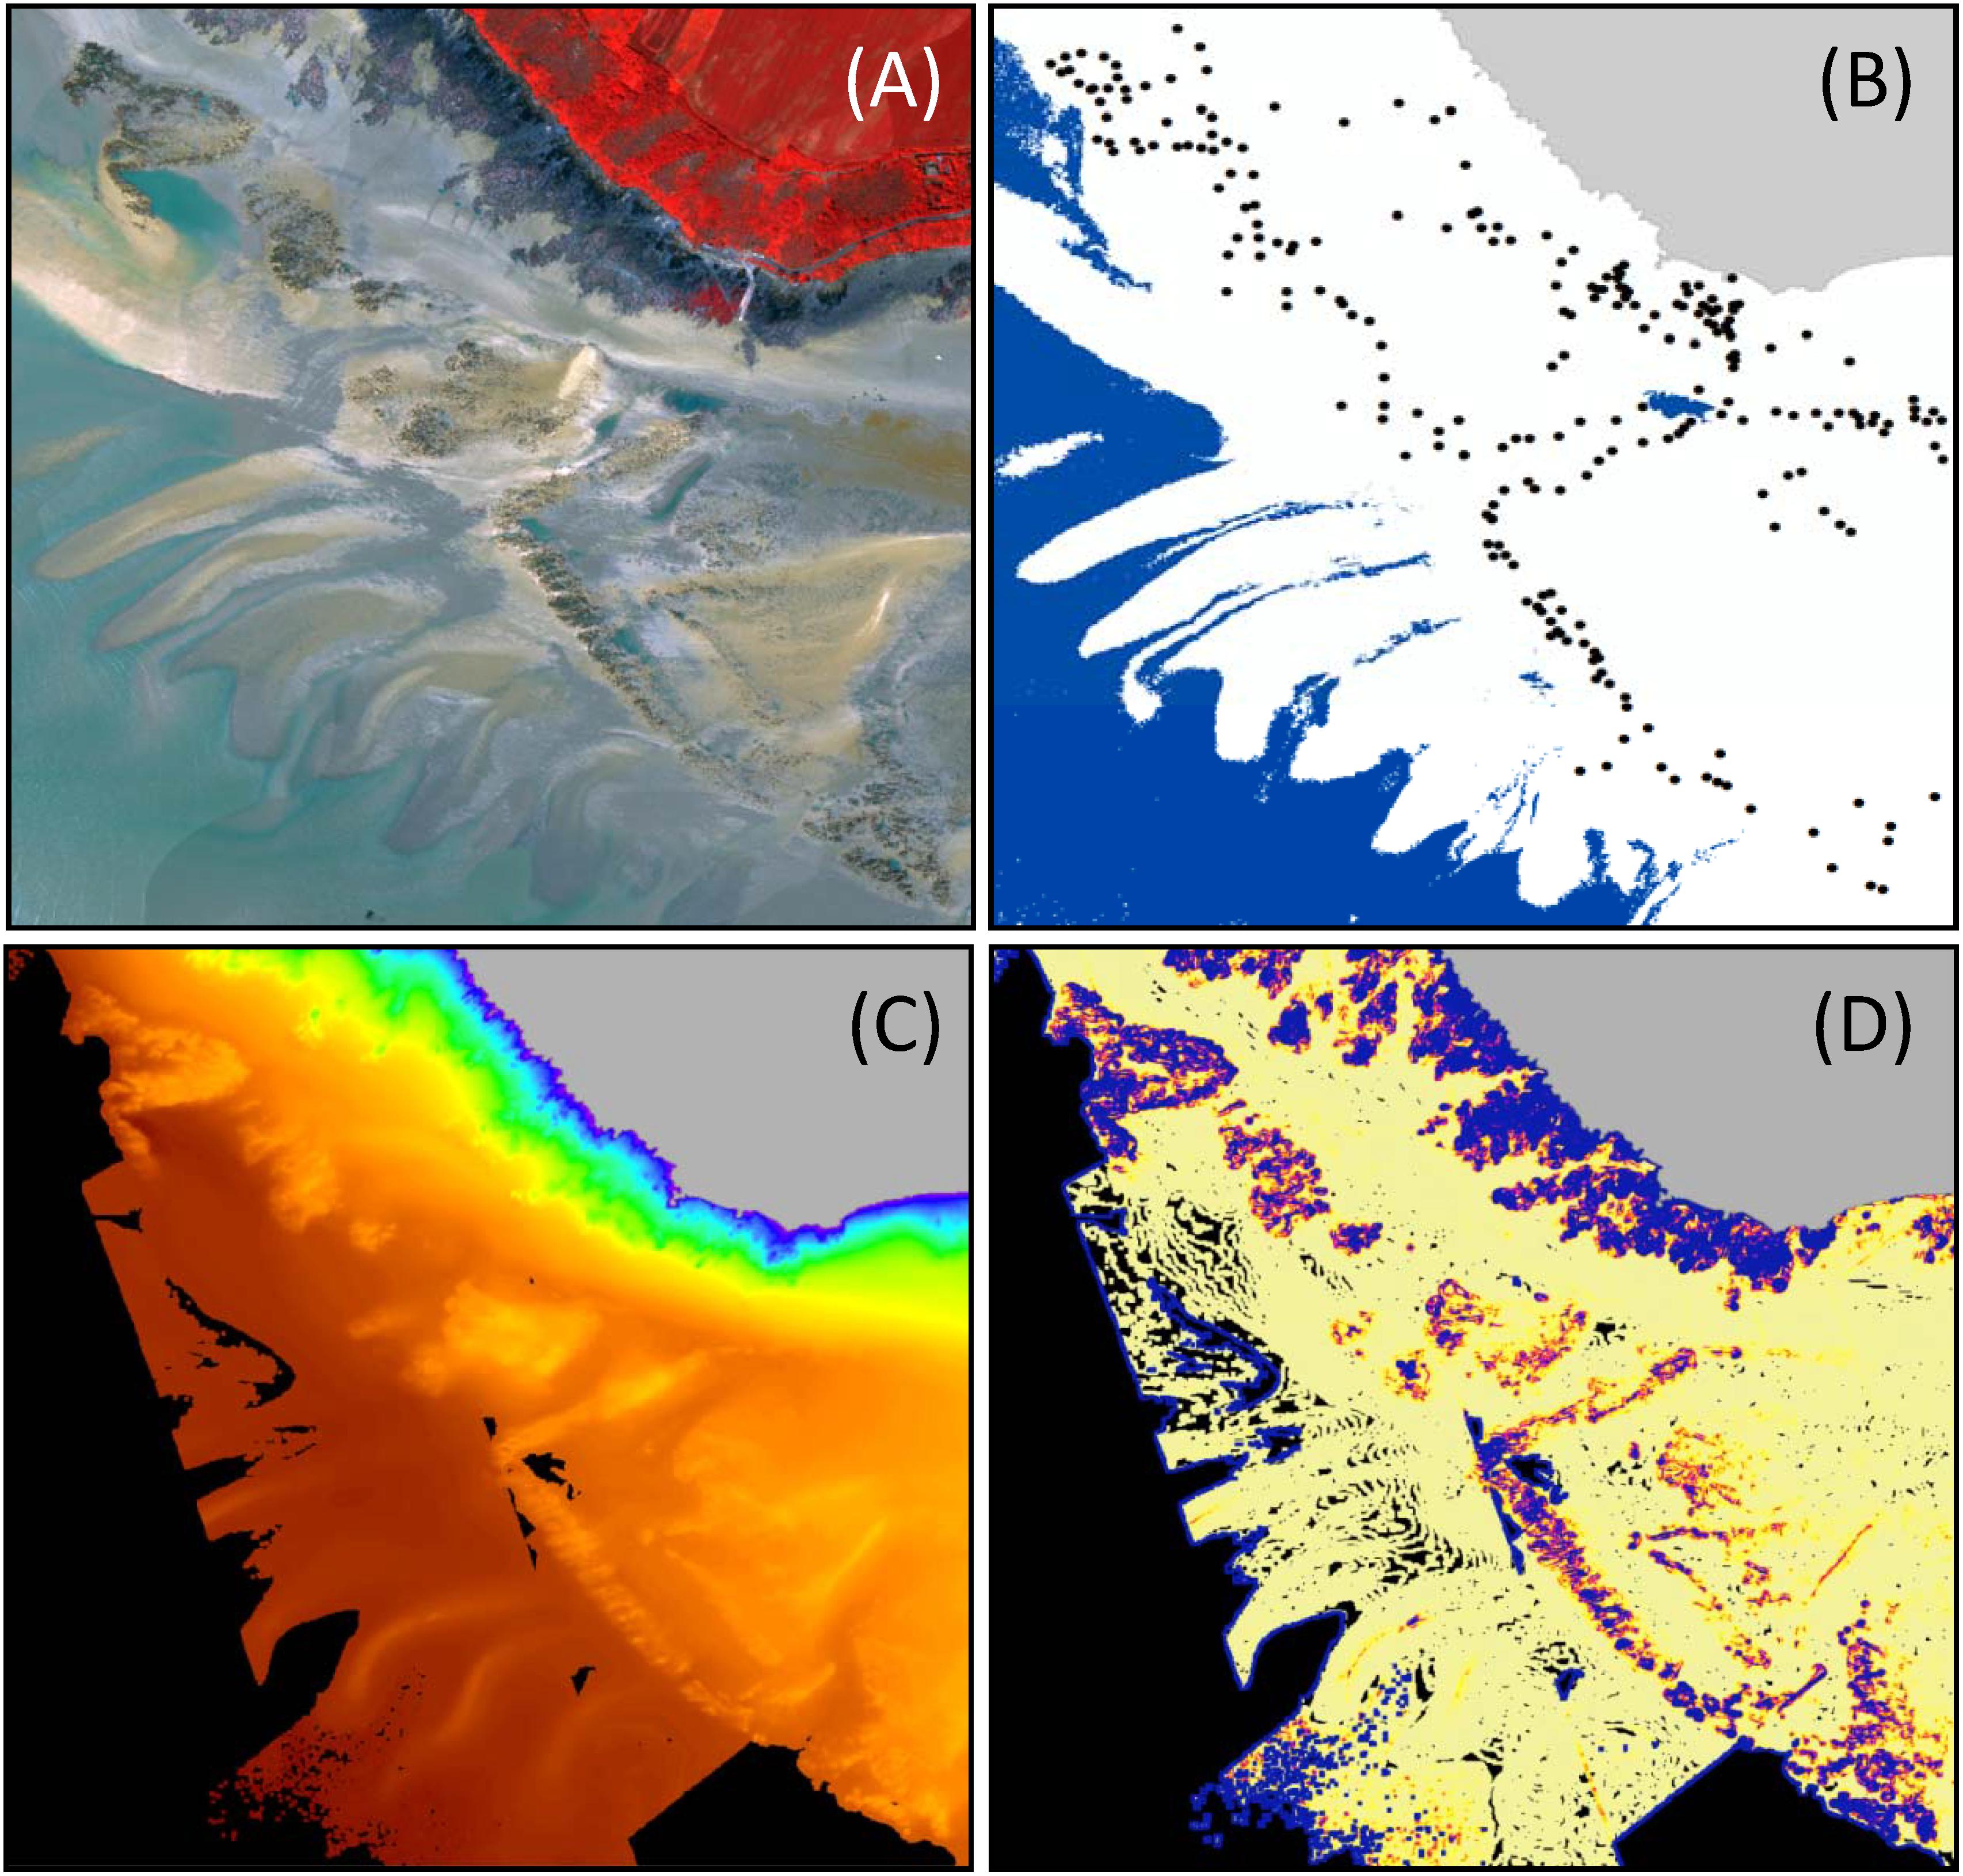
Figure 2. Data acquired on Champeaux site. Hyperspectral (A) and field data (B) were specifically acquired for the present study. lidar bathymetry data (C) were provided by SHOM, the French hydrographic office and rugosity (D) was computed from bathymetry data.
(iii) During the same summer field survey, on June 17th, samples were collected for identification of the main genera or species present in MPB communities. MPB was harvested using pieces of artificial substrates, cut in a nylon net of 100 μm mesh. Substrates consisted in small squares of 2.5 cm2. They were deployed in four stations located few meters apart from each other, in an area close to S. alveolata reefs and where MPB biofilms are recurrently observed at low tide. Pieces of artificial substrates were placed on wet sand 2 h before low tide. They were collected at low tide, when colonized by a biofilm of MPB cells, and immediately transferred to plastic tubes containing 4 ml of filtered seawater with a fixative (1% final concentration of Lugol’s solution). Samples were brought back to the laboratory and kept at 4°C until analysis. Before microalgal cell identification and counting, tubes were agitated in order to help for detachment of MPB cells from the substrate. Then, a sub-sample was taken, diluated 100x in filtered seawater and settled for 12 h in a Utermhöl chamber (Utermöhl, 1958). Most of supernatant was replaced by bleach (0.1% diluted in milliQ water) during one night, in order to remove a large part of organic matter residues and preserve silice frustule. Bleach was then replaced by milliQ water and microalgal cells were settled again for 12 h. Identification and counting of cells were conducted under 400 magnification, using an inverted microscope (Zeiss Axio Observer).
All field position measurements were made using a GARMIN GPS with an uncertainty of 3 m. The position recording of ground control points was done by allowing the device to capture as many satellite signals as possible and thus increase the precision of the geolocalization. Positions have then been expressed in the same projection system as that of hyperspectral images (Lambert-93 associated with the RGF93 geodetic system). Locations of ground control points were matched to images and verified by visual inspection. This last operation was performed by experts who know well the surveyed area using the ArcGIS tool.
Airborne Optical Data Acquisition
An airborne survey was carried out on June 17, 2019 as part of the BIOHERM Project, using an hyperspectral imaging sensor of the Hyspex VNIR 1600 type deployed at an altitude of 1 200 m (Figure 2A). The sensor measured radiance between 400 nm and 1 000 nm with spectral and spatial resolutions of respectively 3.7 nm and 0.5 m, providing a total of 160 spectral bands.
LiDAR data (Figure 2C) were acquired in March 2019 as part of the Litto3D program (Litto3D, 2019). LiDAR topo-bathymetric data comes from a HawkEye III sensor used in dual configuration: Chiroptera (Topo- Shallow Channel) and Deep Channel. The point cloud density in topographic configuration (corresponding to the area of interest for our study) is 8 points/m2 with a planimetric and vertical precision better than 20 cm. All data are expressed in the Lambert-93 projection system associated with the RGF93 geodetic system, and in the IGN69 altimeter system, compatible with the WGS84 world system at metric level. For the purpose of the analysis, the LiDAR point cloud was interpolated to a 1 m regular grid DEM (Digital Elevation Model). The DEM was also used to create layers describing seafloor topographic rugosity (Figure 2D) using Arc GIS Benthic Terrain Modeler tool (NOAA and Oregon State University).
Data Pre-processing
Geometric and atmospheric corrections were performed prior to image processing (Figure 3). Orthorectification allowed generating geolocated images in the Lambert 93 system. The relative geometric precision obtained was of the order of the pixel. Atmospheric corrections were subsequently applied using the ATCOR software on each flight line in order to obtain reflectance images above the water surface. The oxygen absorption band, around 760 nm, was linearly interpolated. A post empirical correction was thereafter applied. It was carried out in two steps: (i) a linear correction based on the overlap between the lines to correct the variation in lighting conditions, (ii) a second linear correction, for each spectral band, which allowed for the correction of local atmospheric effects not or poorly taken into account by the atmospheric model. Their correction was done using measurements on a calibrated reference target installed on site. Land and water area were masked using, respectively, coastal shoreline derived from LiDAR data and Infra-Red band thresholding.
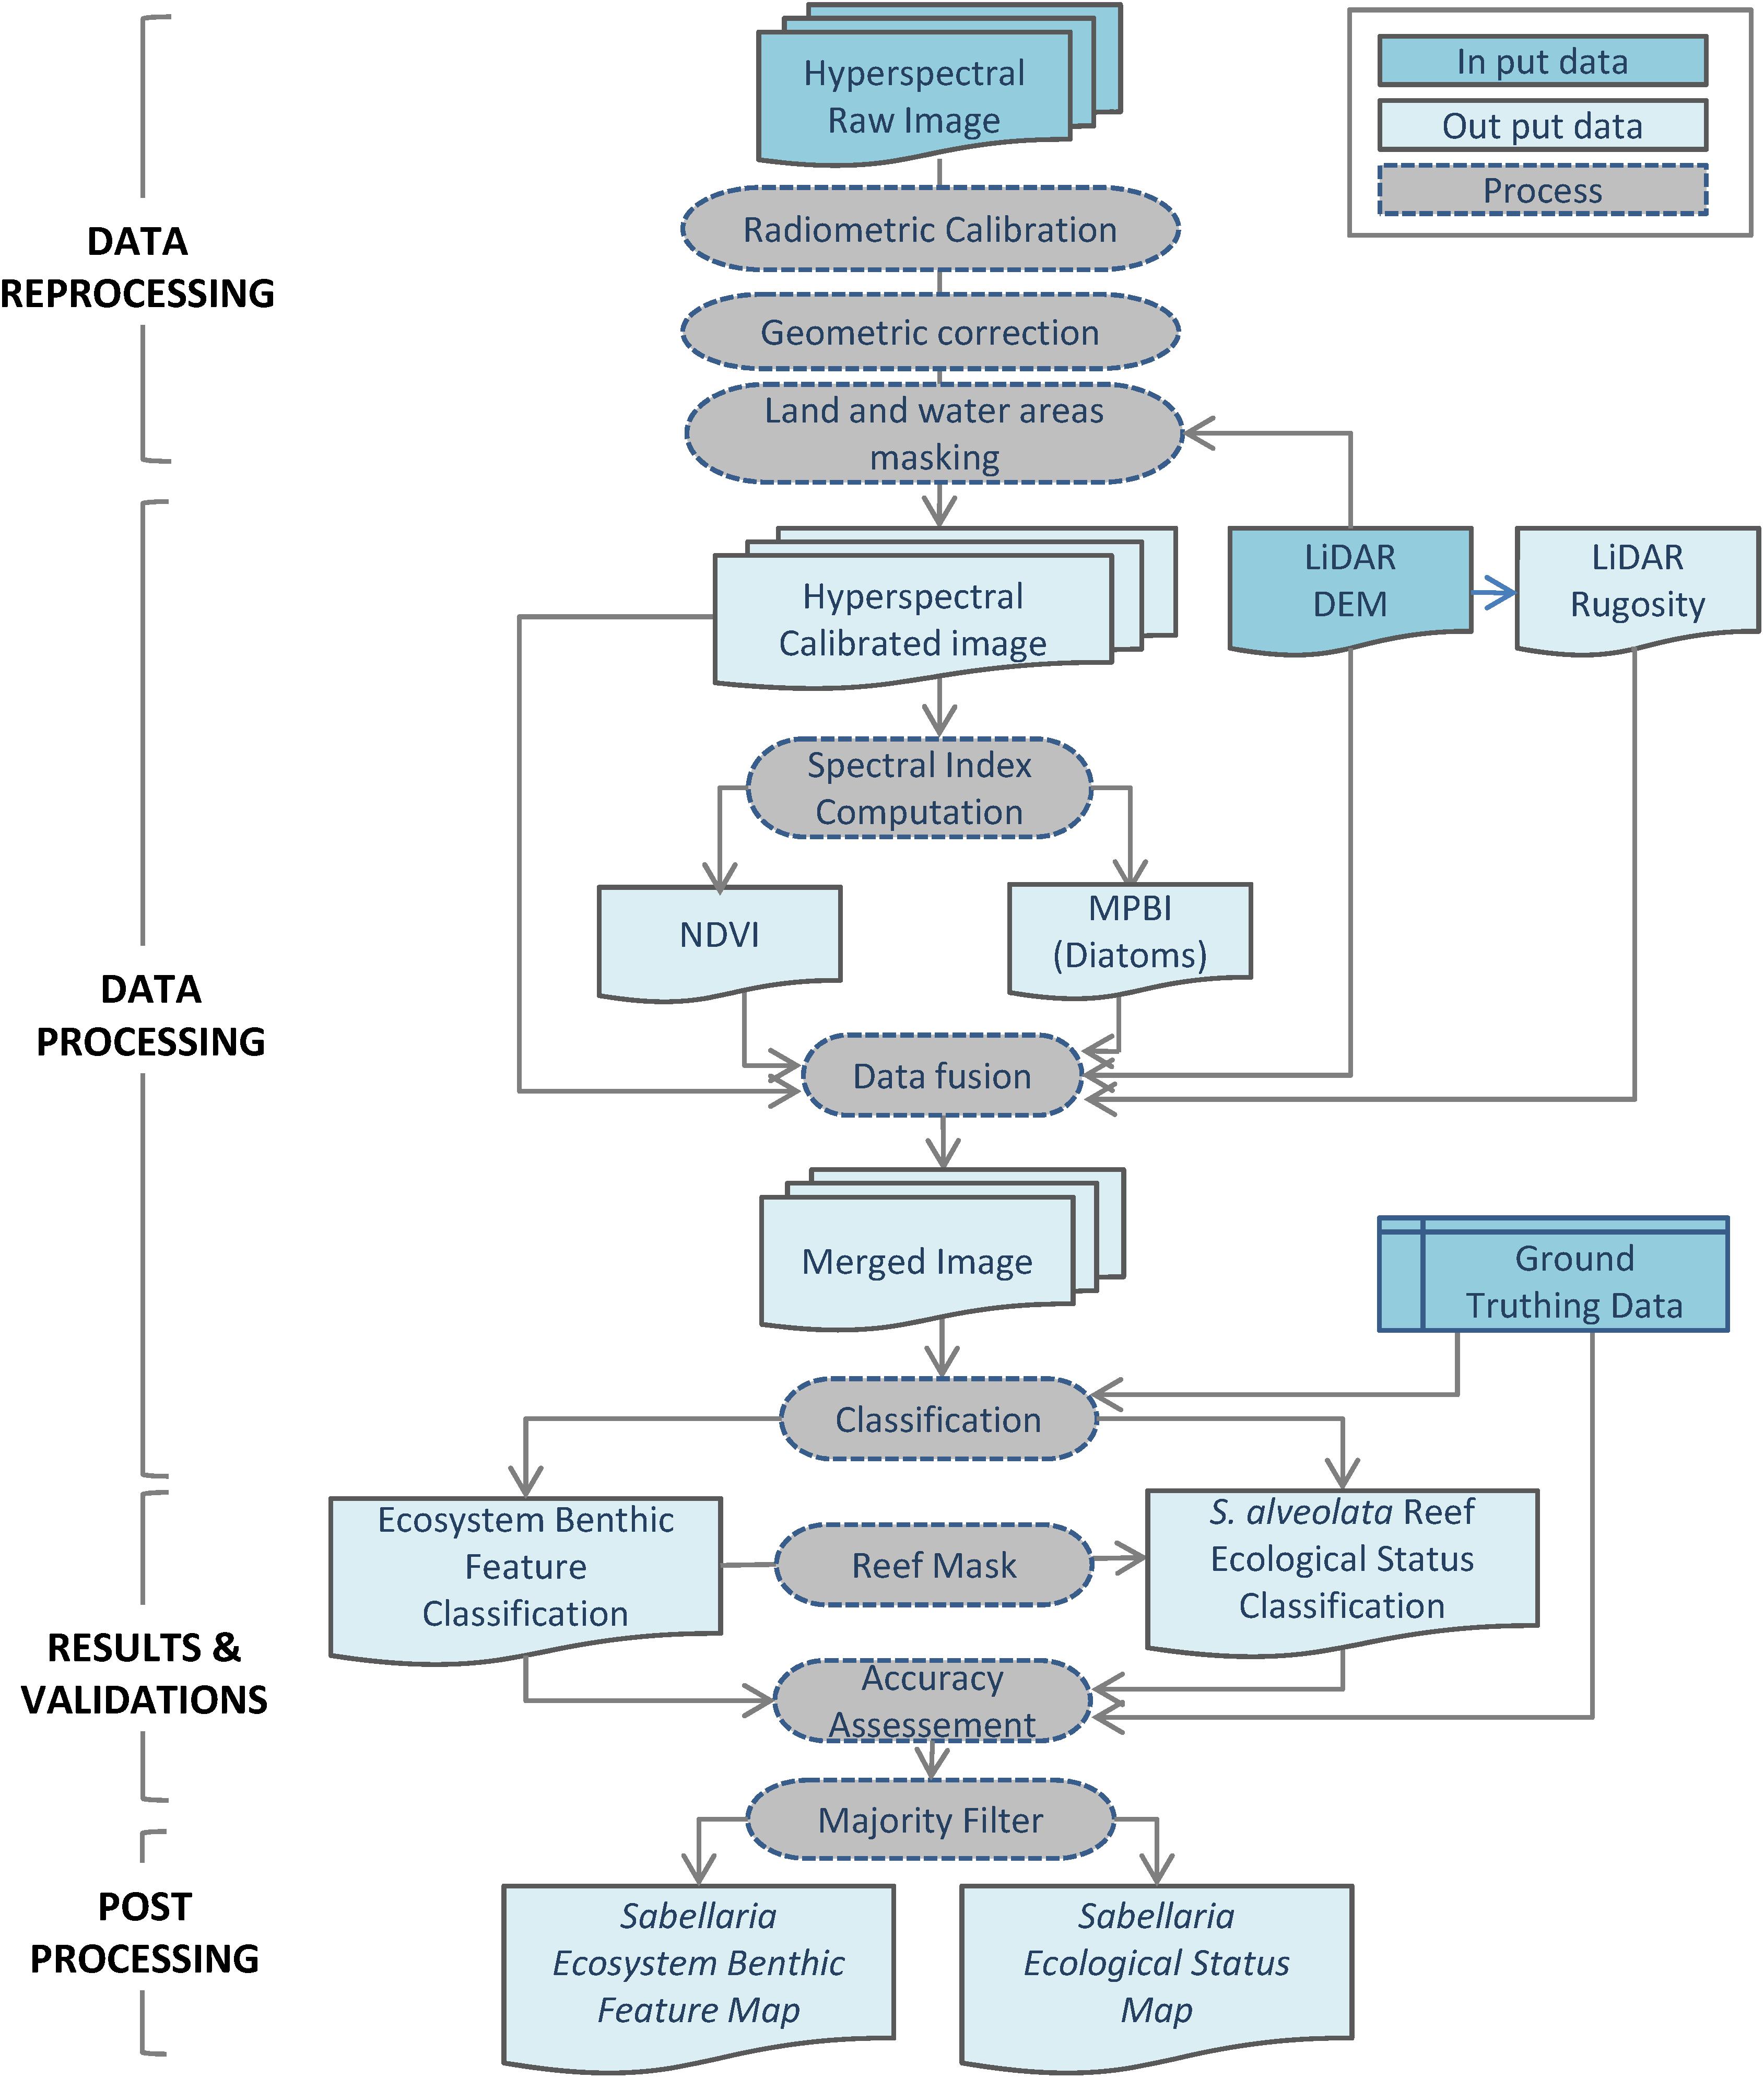
Figure 3. Processing Workflow for Sabellaria alveolata reef ecosystem feature classification and ecological status distribution.
Data Processing
The imagery data processing procedure consisted of several steps. They are illustrated in the workflow diagram (Figure 3) and are detailed below.
Vegetation Index Computation
At first, spectral vegetation indices were computed in order to specifically characterize vegetation present in the study site. The principle consists in linking together certain characteristics and the measurements acquired in at least two spectral bands. Two indices were calculated using ENVI image processing software: (i) the Normalized Difference Vegetation Index (hereafter NDVI, Tucker, 1979), widely used to analyze vegetation (Cracknell, 2001; Pu et al., 2008; Kushnir et al., 2011) and (ii) the Diatom index (Van der Wal et al., 2010; Launeau et al., 2018) as MPB sampling analysis revealed that this compartment was mainly dominated by diatoms in the study site (Figure 4N).
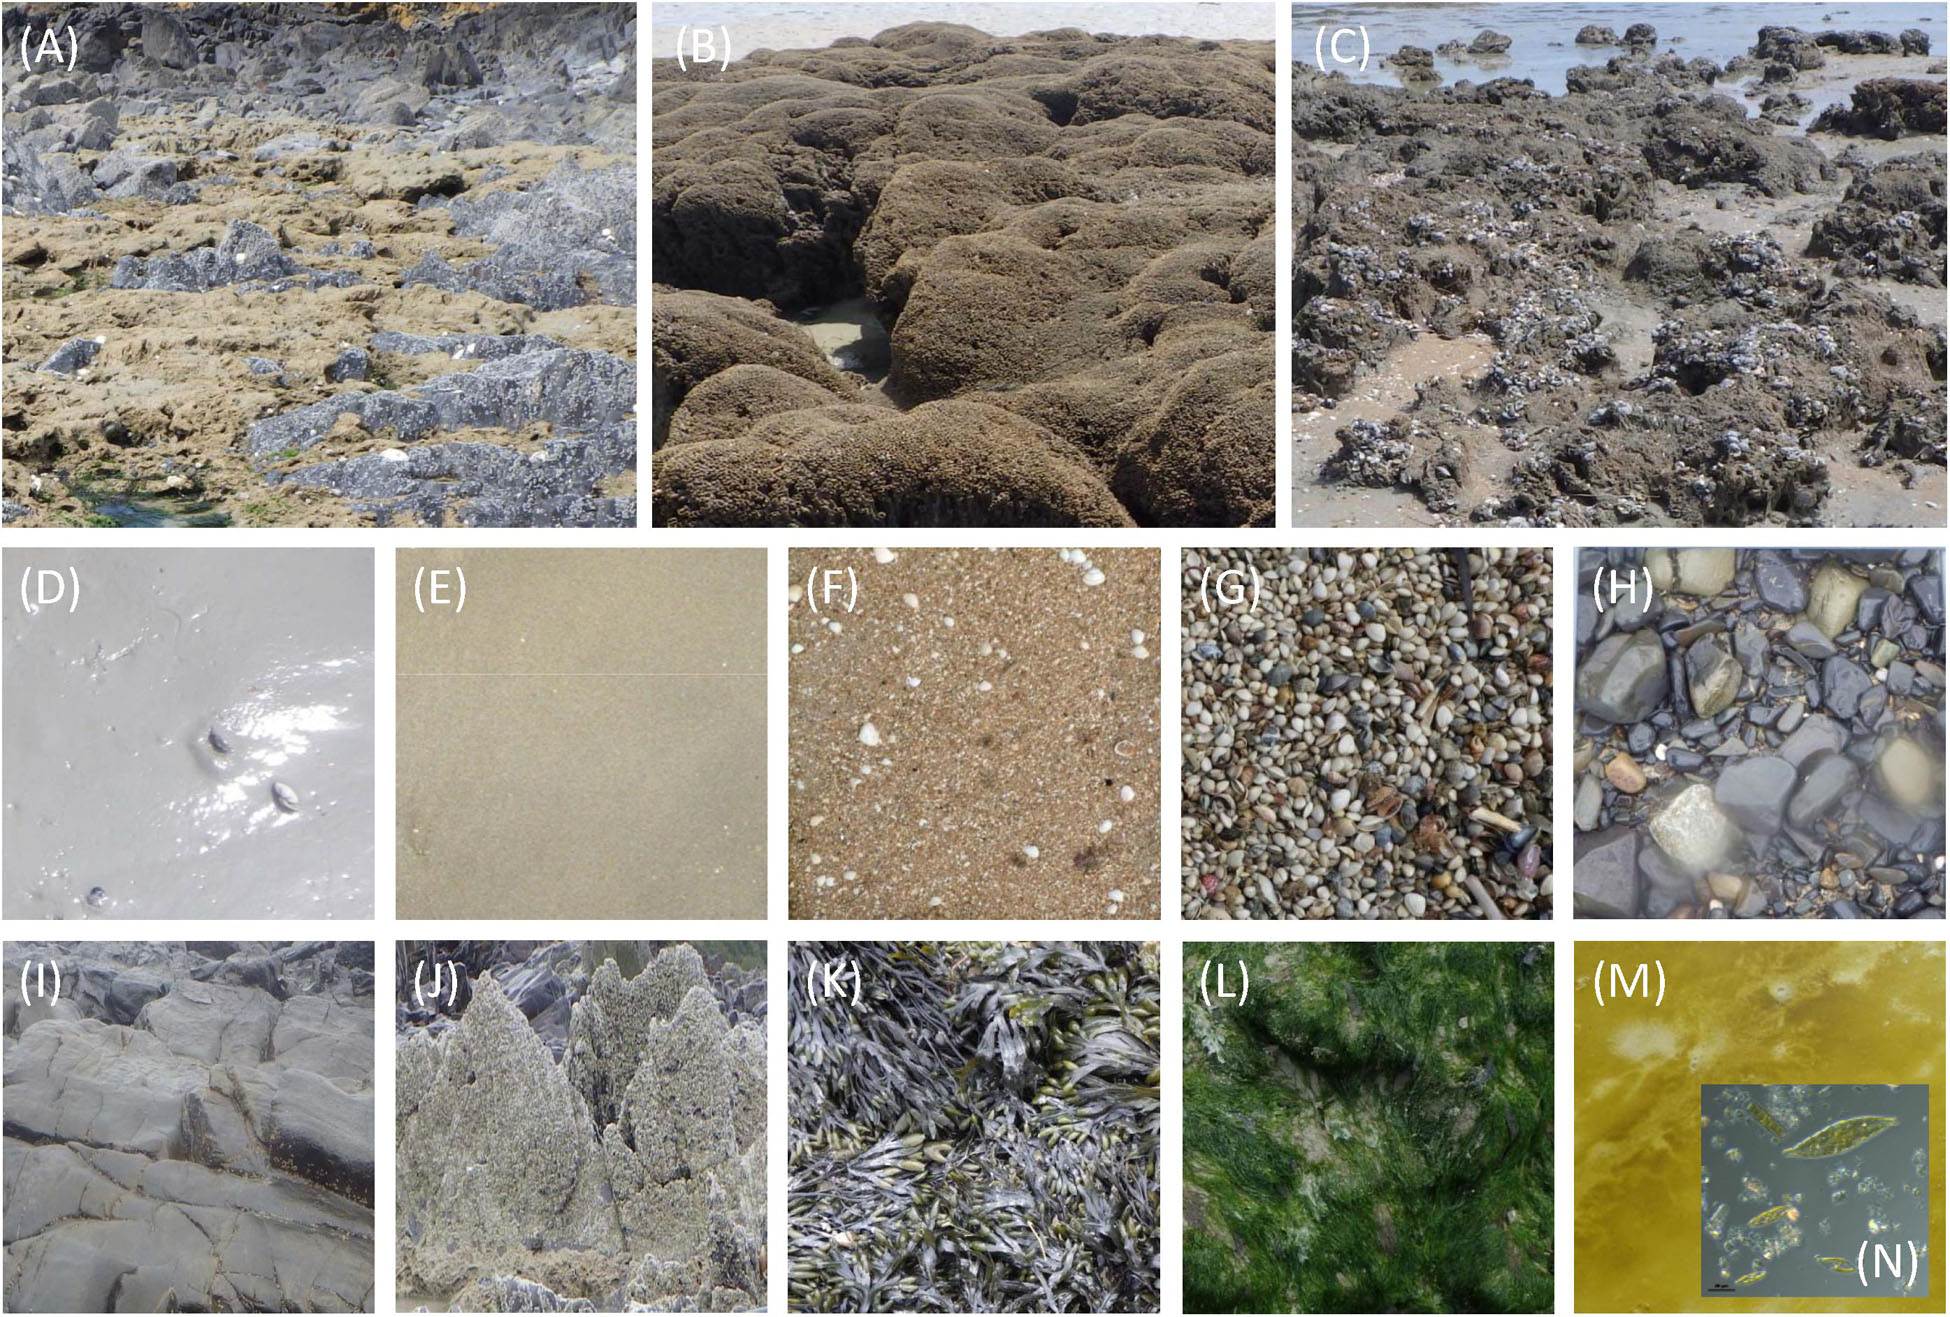
Figure 4. Sabellaria alveolata reef ecosystem benthic features: S. alveolata on rock (A), healthy S. alveolata on sand (B), degraded S. alveolata on sand (C), muddy sediments (D), sand (E), coarse sediments (F), shells (G), pebble and cobble substrates (H), bare rock (I), rock with epifauna (J), brown algae (K), green algae (L), microphytobenthos (M) mainly composed of diatoms (N) of the Naviculaceae family and Amphora, Pleurosigma or Gyrosigma genera.
To enhance discrimination of benthic features that characterize the area, topographic and spectral indices layers were merged with hyperspectral masked image, as classification input, using layer stacking processing (Figure 4). Prior to their concatenation, the hyperspectral image and the LiDAR data were georeferenced to the same projection system with a precision of 0.5 and 0.2 m respectively. They were then merged together in the same file thanks to the “Layer stacking” function implemented in the ENVI image processing software using the “Nearest Neighbor” resampling method.
Classification
The Mahalanobis distance (Richards, 1999), found to be most suitable in a majority of applications (McLachlan, 1999; Chang et al., 2004; Xiang et al., 2008; Govender et al., 2008), was used as distance function in the classification algorithm. This distance also has the advantage of taking into account the correlations of the data set (De Maesschalck et al., 2000). Indeed, hyperspectral data are measured over a large number and continuous spectral bands, each band containing potential redundant information. In addition, a Mahalanobis distance metric is scale-invariant and can adjust the geometrical distribution of data so that the distance between similar data points is small (Xing et al., 2003). This is supposed to enhance the classification performance.
To perform image classification, regions of interest (ROIs, areas of image that contain pixels of the same spectral characteristics representing the same seabed feature according to field observations) were created interactively. Ten habitat classes were considered to produce associated S. alveolata benthic habitat maps. Supervised classification clustered pixels in a dataset into classes based on previously defined training data. All pixels were classified to the closest ROI class using the Mahalanobis classification function implemented in ENVI software. For S. alveolata ecological status estimation, classification was applied in the same way but only on areas where it was previously detected.
Accuracy Assessment
The classification quality was assessed quantitatively using accuracy assessment based on comparison with field reference data none overlapping from the data used for training the classification algorithms. The kappa coefficient and the overall accuracy, the two statistics most prominently used (Foody and Mathur, 2006), were computed for classification accuracy assessment. Both the precision of localization of field data and the high spatial variability that exhibits the S. alveolata ecological status make the classification accuracy assessment of this latter very difficult to carry out. As it was stressed by Florén et al. (2015), low prediction accuracies could have several explanations but it is likely that most of them are driven by inaccurate positioning and/or the small-scale heterogeneity of the habitats as it is the case in the present study. Thus, many field data fell erroneously near the reefs when plotted on the image and thus could not be used. To overcome this issue, “hummocks” type observations were discarded because they do not constitute continuous formations and their localization lacks precision as they are occupying surfaces often lower than the image resolution (50 cm). For the S. alveolata reef status, data extraction from the classified image was done by searching the observed status within a radius of 2 m. This allowed to take into account the GPS accuracy (3 m) and thus to increase the number of kept samples for statistical evaluation. Overall accuracy and Kappa coefficient were thereafter calculated and compared for both datasets. For qualitative accuracy evaluation, we also plotted sample field data on ecological status classification map and made a comparison with the status estimated in the field.
Post-processing
As is often used in the post-processing of a thematic per-pixel classification map (e.g., Stuckens et al., 2000), a “Majority filter,” that generalizes and reduces single pixel misclassification, was applied using ArcGIS tool. This filter considers a neighborhood of pixels and assigns to the central pixel the semantic class most occurring in all pixels in the neighborhood. The kernel of the filter was the eight nearest neighbors (a three-by-three window) to the processed cell.
Results
Spectral Reflectance Signatures
Field spectra were acquired to examine if S. alveolata bioconstructions have a sufficiently specific spectral signature leading to their identification and discrimination from the other benthic feature present in the study site. Recorded spectra are shown in Figure 5. Measures over 900 nm, less reliable due to the instrument sensitivity in this spectral region, have been dismissed.
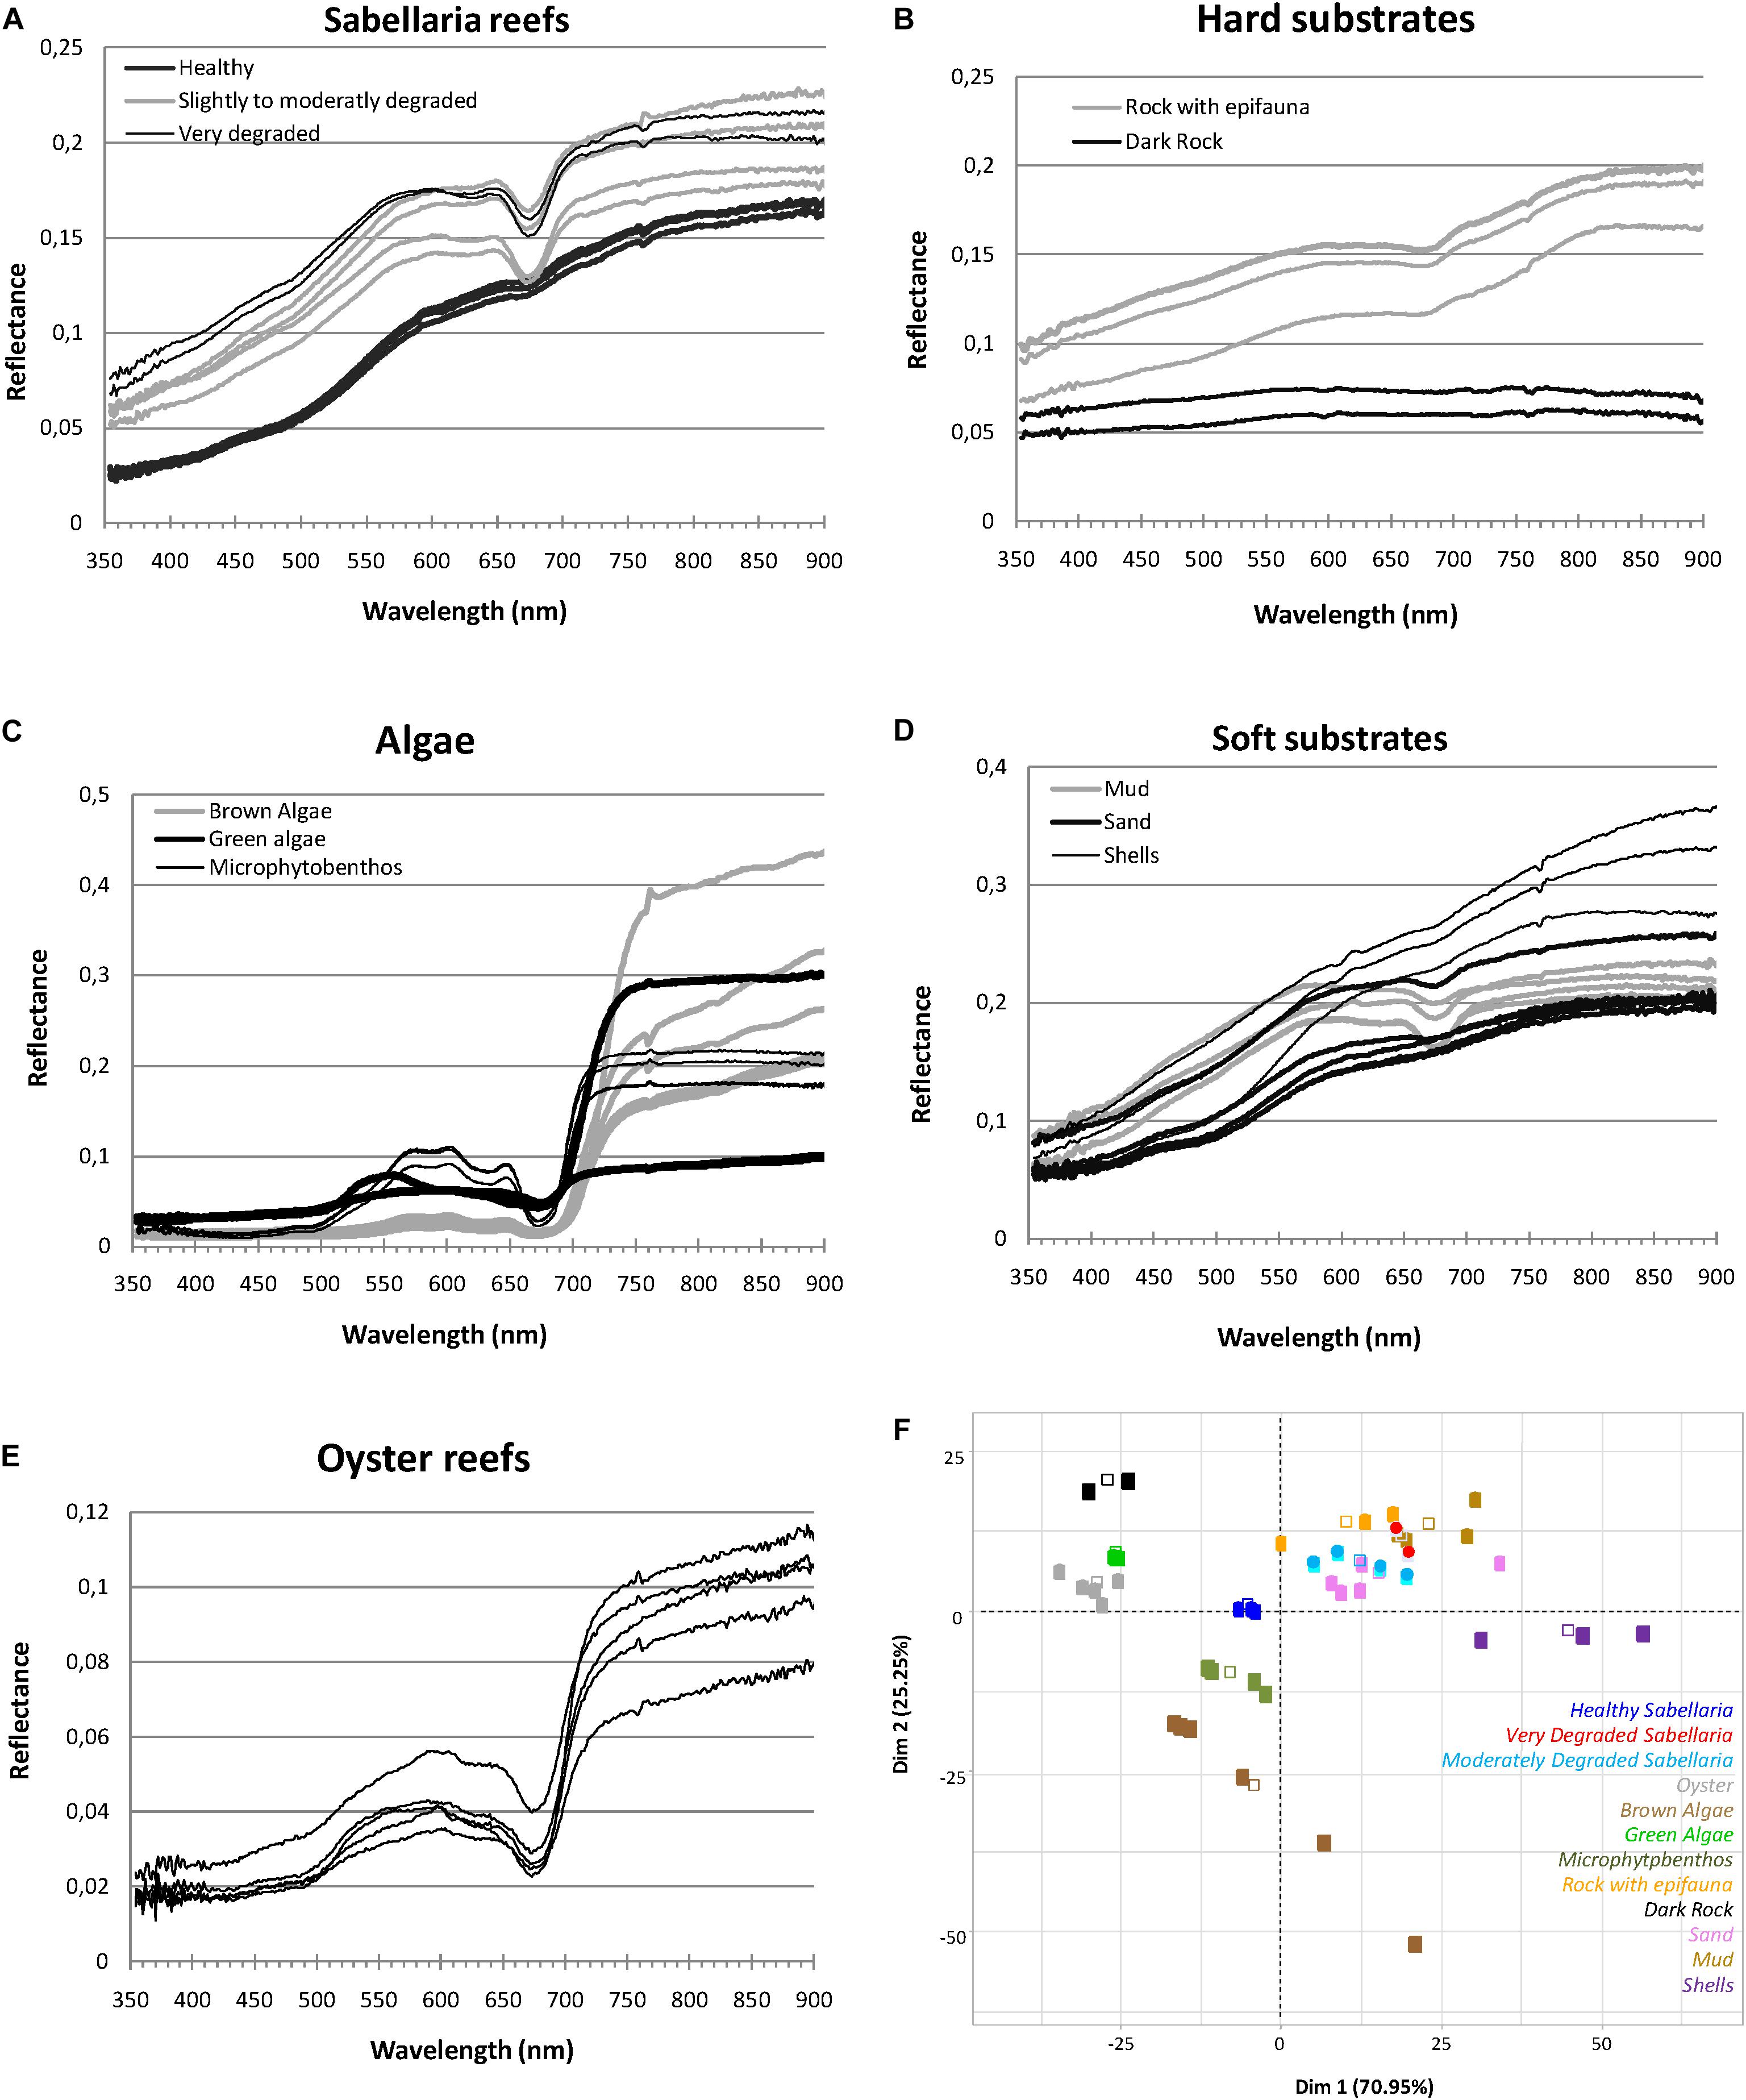
Figure 5. Spectral signature of Sabellaria alveolata reef (A) and associated benthic features (B–E) with the corresponding PCA analysis biplot of the two first dimensions (F).
Benthic features showed clear differences in their spectral reflectance shapes and/or their magnitudes (Figure 5). For vegetation types, reflectance values were low in the visible bands but showed a strong increase with wavelength above 673 nm reaching high levels in the entire infrared region (Figure 5C). The spectral signature presents a significant jump between the absorption at 673 nm and the reflection in the near infrared. This jump is generally less marked on the spectral signature of the MPB population. Conversely, the absorption peak at this wavelength is stronger in the latter. The MPB also present several peaks of reflectance in the visible around 570, 602, and 646 nm when smaller specific absorption features were observed in reflectance spectra at 581 nm and 632 nm compared to macroalgae (Figure 5C). Brown algae reflectance spectra displayed lower values in the green part of the spectrum than the other vegetation types. For substrate types, spectra showed increasing reflectance with increasing wavelength in both visible and near infrared ranges (Figures 5B,D). Soft sediments displayed overall higher reflectance values than hard substrata. The highest values were recorded for shelly sediment (shells) in the infrared region. The lowest values were recorded for dark rock with an almost flat spectrum all over the range of wavelengths analyzed, without any obvious absorption feature. The spectrum corresponding to mud showed an absorption band at 673 nm similar to that of microphytobenthos. Oyster reefs exhibited greater variability in their spectral amplitude than S. alveolata reefs, especially in the infrared region, with some peaks of reflectance in the visible that were not always well discriminated. Regarding S. alveolata reefs, the spectral signatures of prograding bioconstructions showed a shape similar to that of sand with, however, a lower amplitude (Figure 5A). With the state of degradation, their reflectance values increased and the shape of the spectrum was modified: degraded reef portions in retrograding reefs showed spectrum similar to muddy sediments, with an absorption peak at 673 nm.
According to statistical analysis, the first two dimensions of the PCA accounted for 71 and 25% of the total variation in the dataset, respectively, expressing together more than 96% of the data variability (Figure 5F). Correlation biplots showed that the specific spectral signature of some benthic features, such as dark rock, shells, macroalgae as well as prograding S. alveolata reefs, was probably sufficient for their discrimination. However, other benthic features seemed to be more difficult to distinguish solely on the basis of their spectral signature, as for rocky substrata (Rock) with epifauna, fine sand sediment and retrograding S. alveolata reefs.
Benthtic Feature Classification and Validation
Preprocessed airborne data were classified using statistical supervised classifier based on Mahalanobis distance. As a result, dominant habitat types were automatically grouped into classes representing the pattern of Champeaux site ecosystem (Figure 6). Among the 10 benthic feature classes obtained, three were identified as soft substrates (fine sand, mud and coarse sediments), and two of them as hard substrates (rocky reefs and “other hard substrates”). Microphytobenthos was differentiated from macroalgae and displayed patches with varying levels of biomass. The pattern of class distribution also revealed the distinction between the two types of S. alveolata formations, large reefs developing on sand and adhering to rocky reefs on high shore.
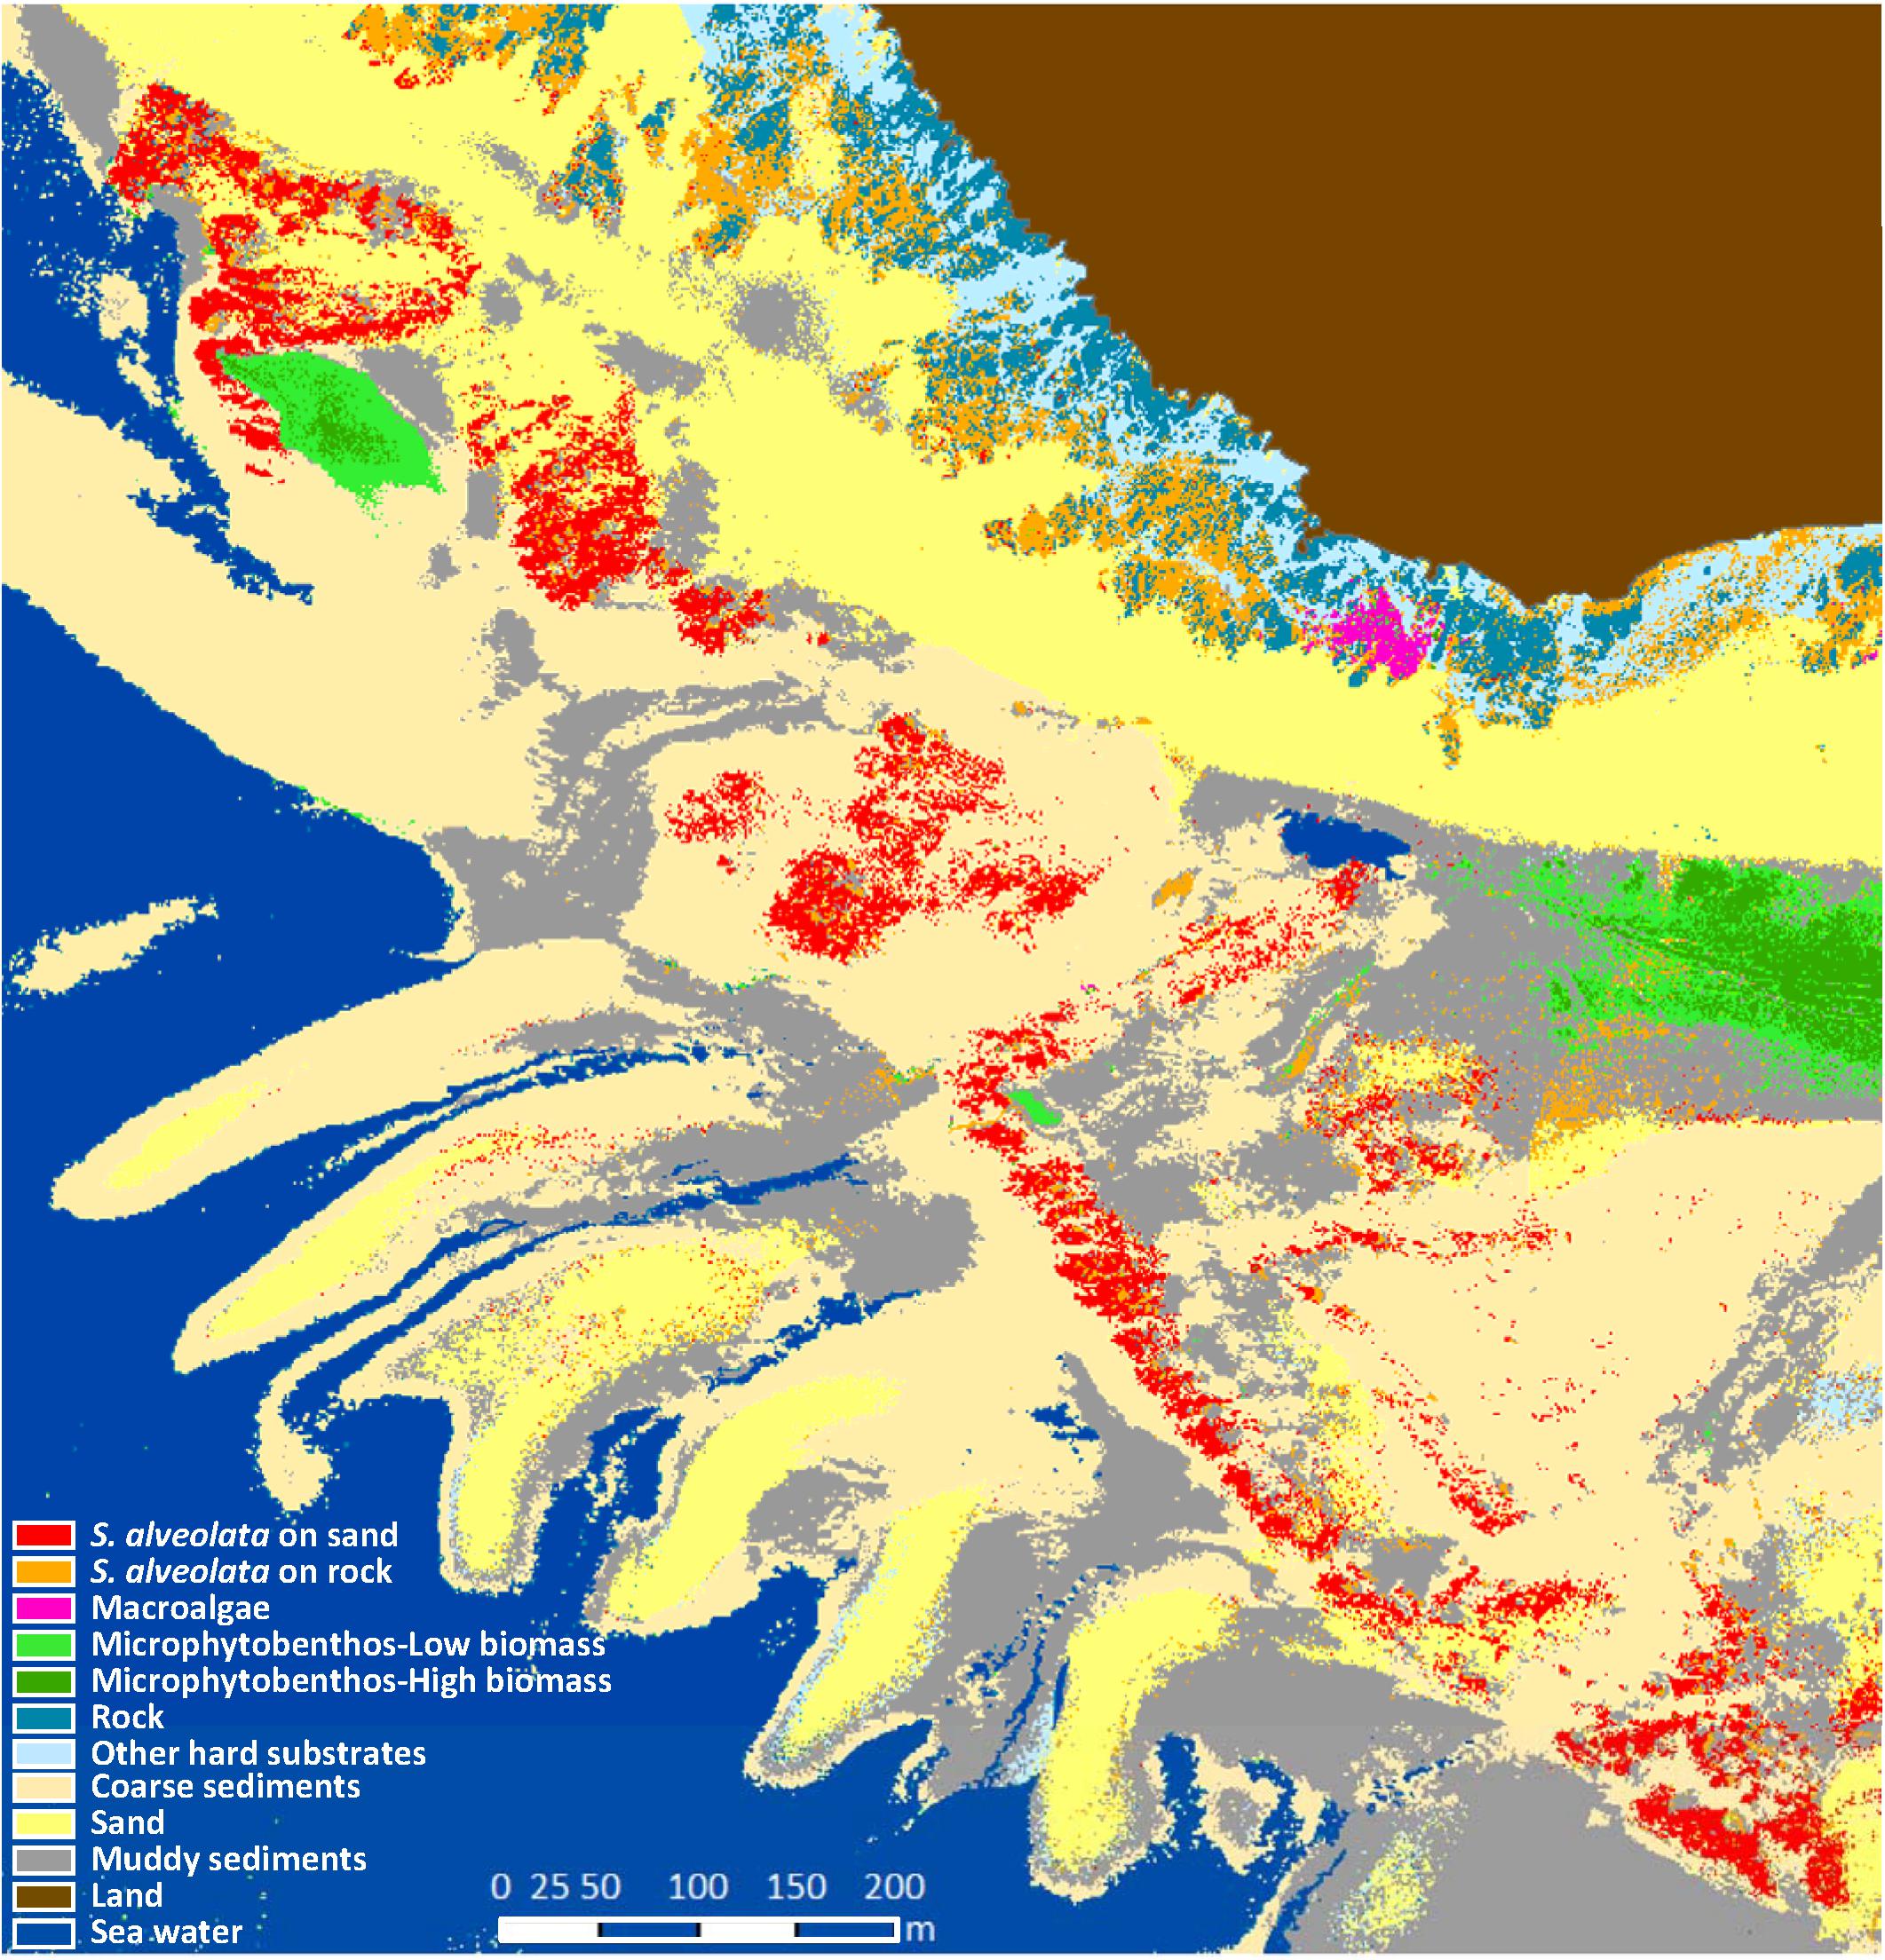
Figure 6. Benthic habitat map of Champeaux site obtained from the hyperspectral airborne imagery using supervised classification based on Mahalanobis distance.
The performance of the obtained classification was assessed using the confusion matrix method (Figure 7). In this approach, classified benthic habitats were compared with field observed benthic features, resulting in an overall accuracy of 88% and a Kappa of 0.85. Khi2 test (p < 0.0001, α = 5%) corroborated the high performance of the used classifier for S. alveolata formations and its associated benthic features. Few confusions were recorded, however, mainly between S. alveolata on sand and bare sand sediments or between S. alveolata on rocky substrata and coarse sediments, but in much lower proportions than correctly classified pixels.
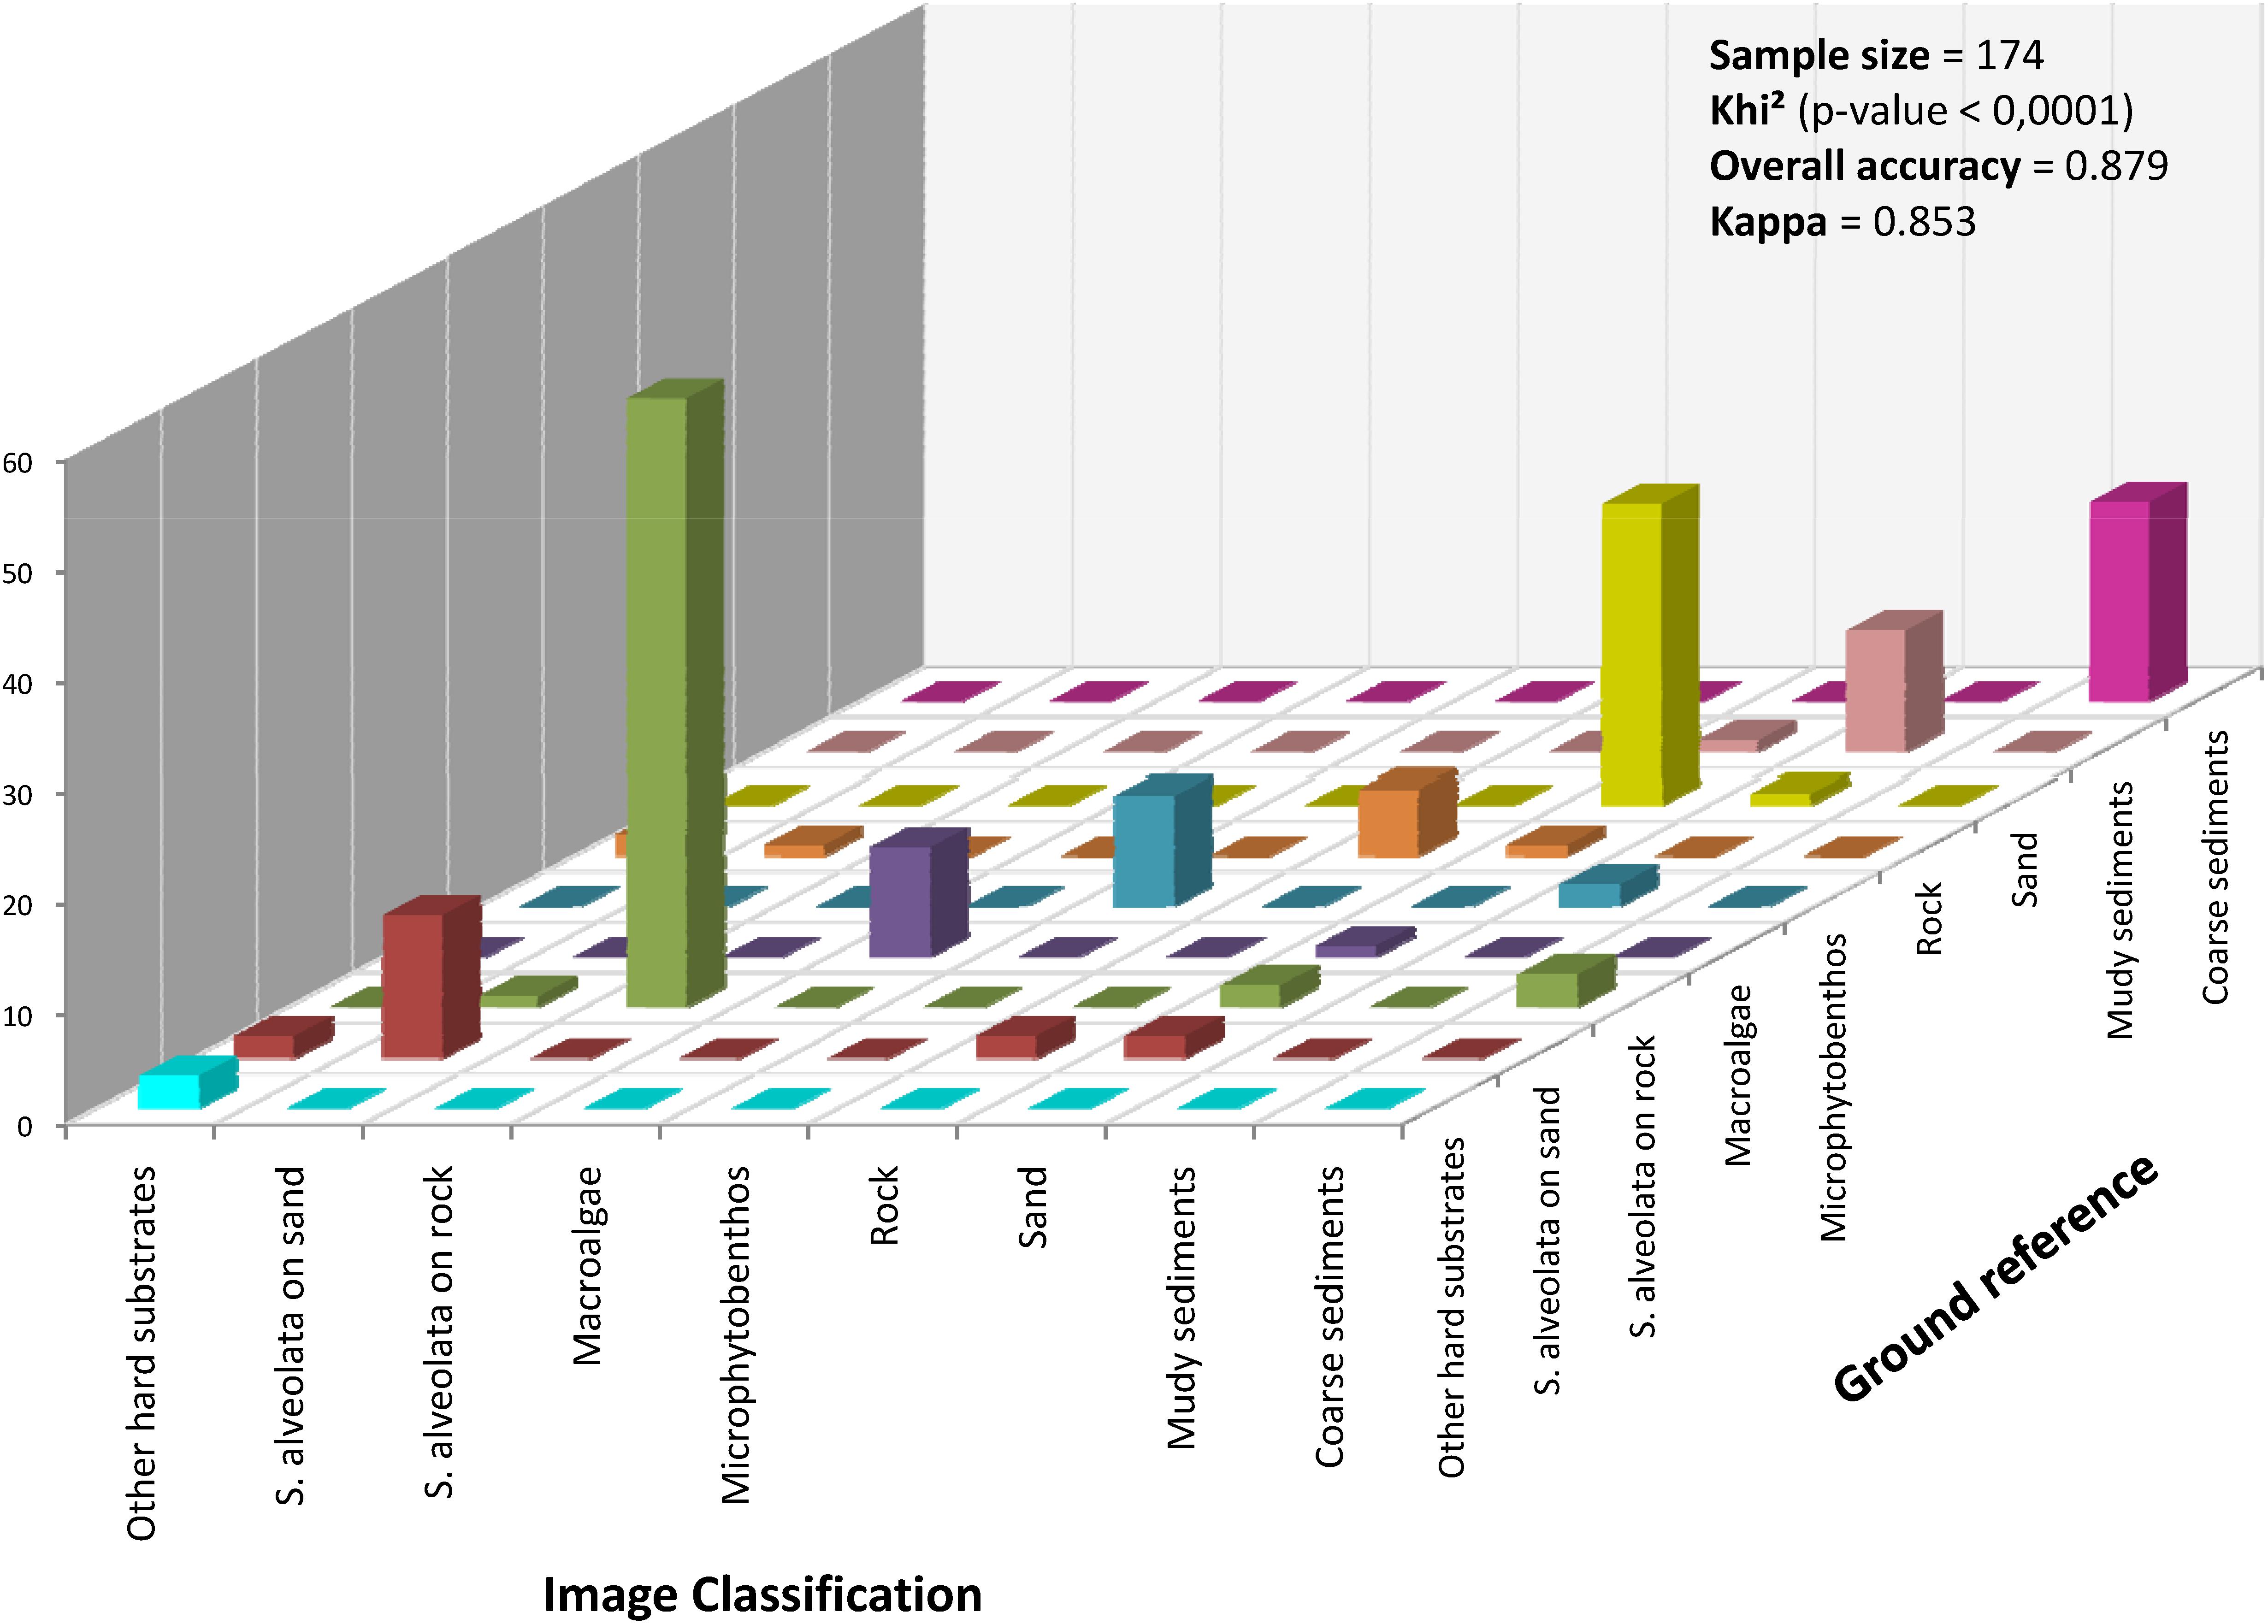
Figure 7. Accuracy assessment of the hyperspectral image classification based on Mahalanobis distance. The height of the bars in the diagonal indicates the number of samples correctly classified.
Remote Estimation of S. alveolatta Reef Ecological Status
In order to continuously map ecological status, supervised Mahalanobis distance based classifier was applied to each pixel of merged hyperspectral and LiDAR data. Prograding and retrograding phases were provided with 0.5 m spatial resolution. The ecological status map obtained exhibited an heterogeneous distribution with a co-presence of prograding and retrograding phases whatever the location (Figure 8). Nevertheless, prograding phase seemed to be seaward dominant, where retrograding phase was mainly present in the southeast part of the study site and closed to the shoreline.
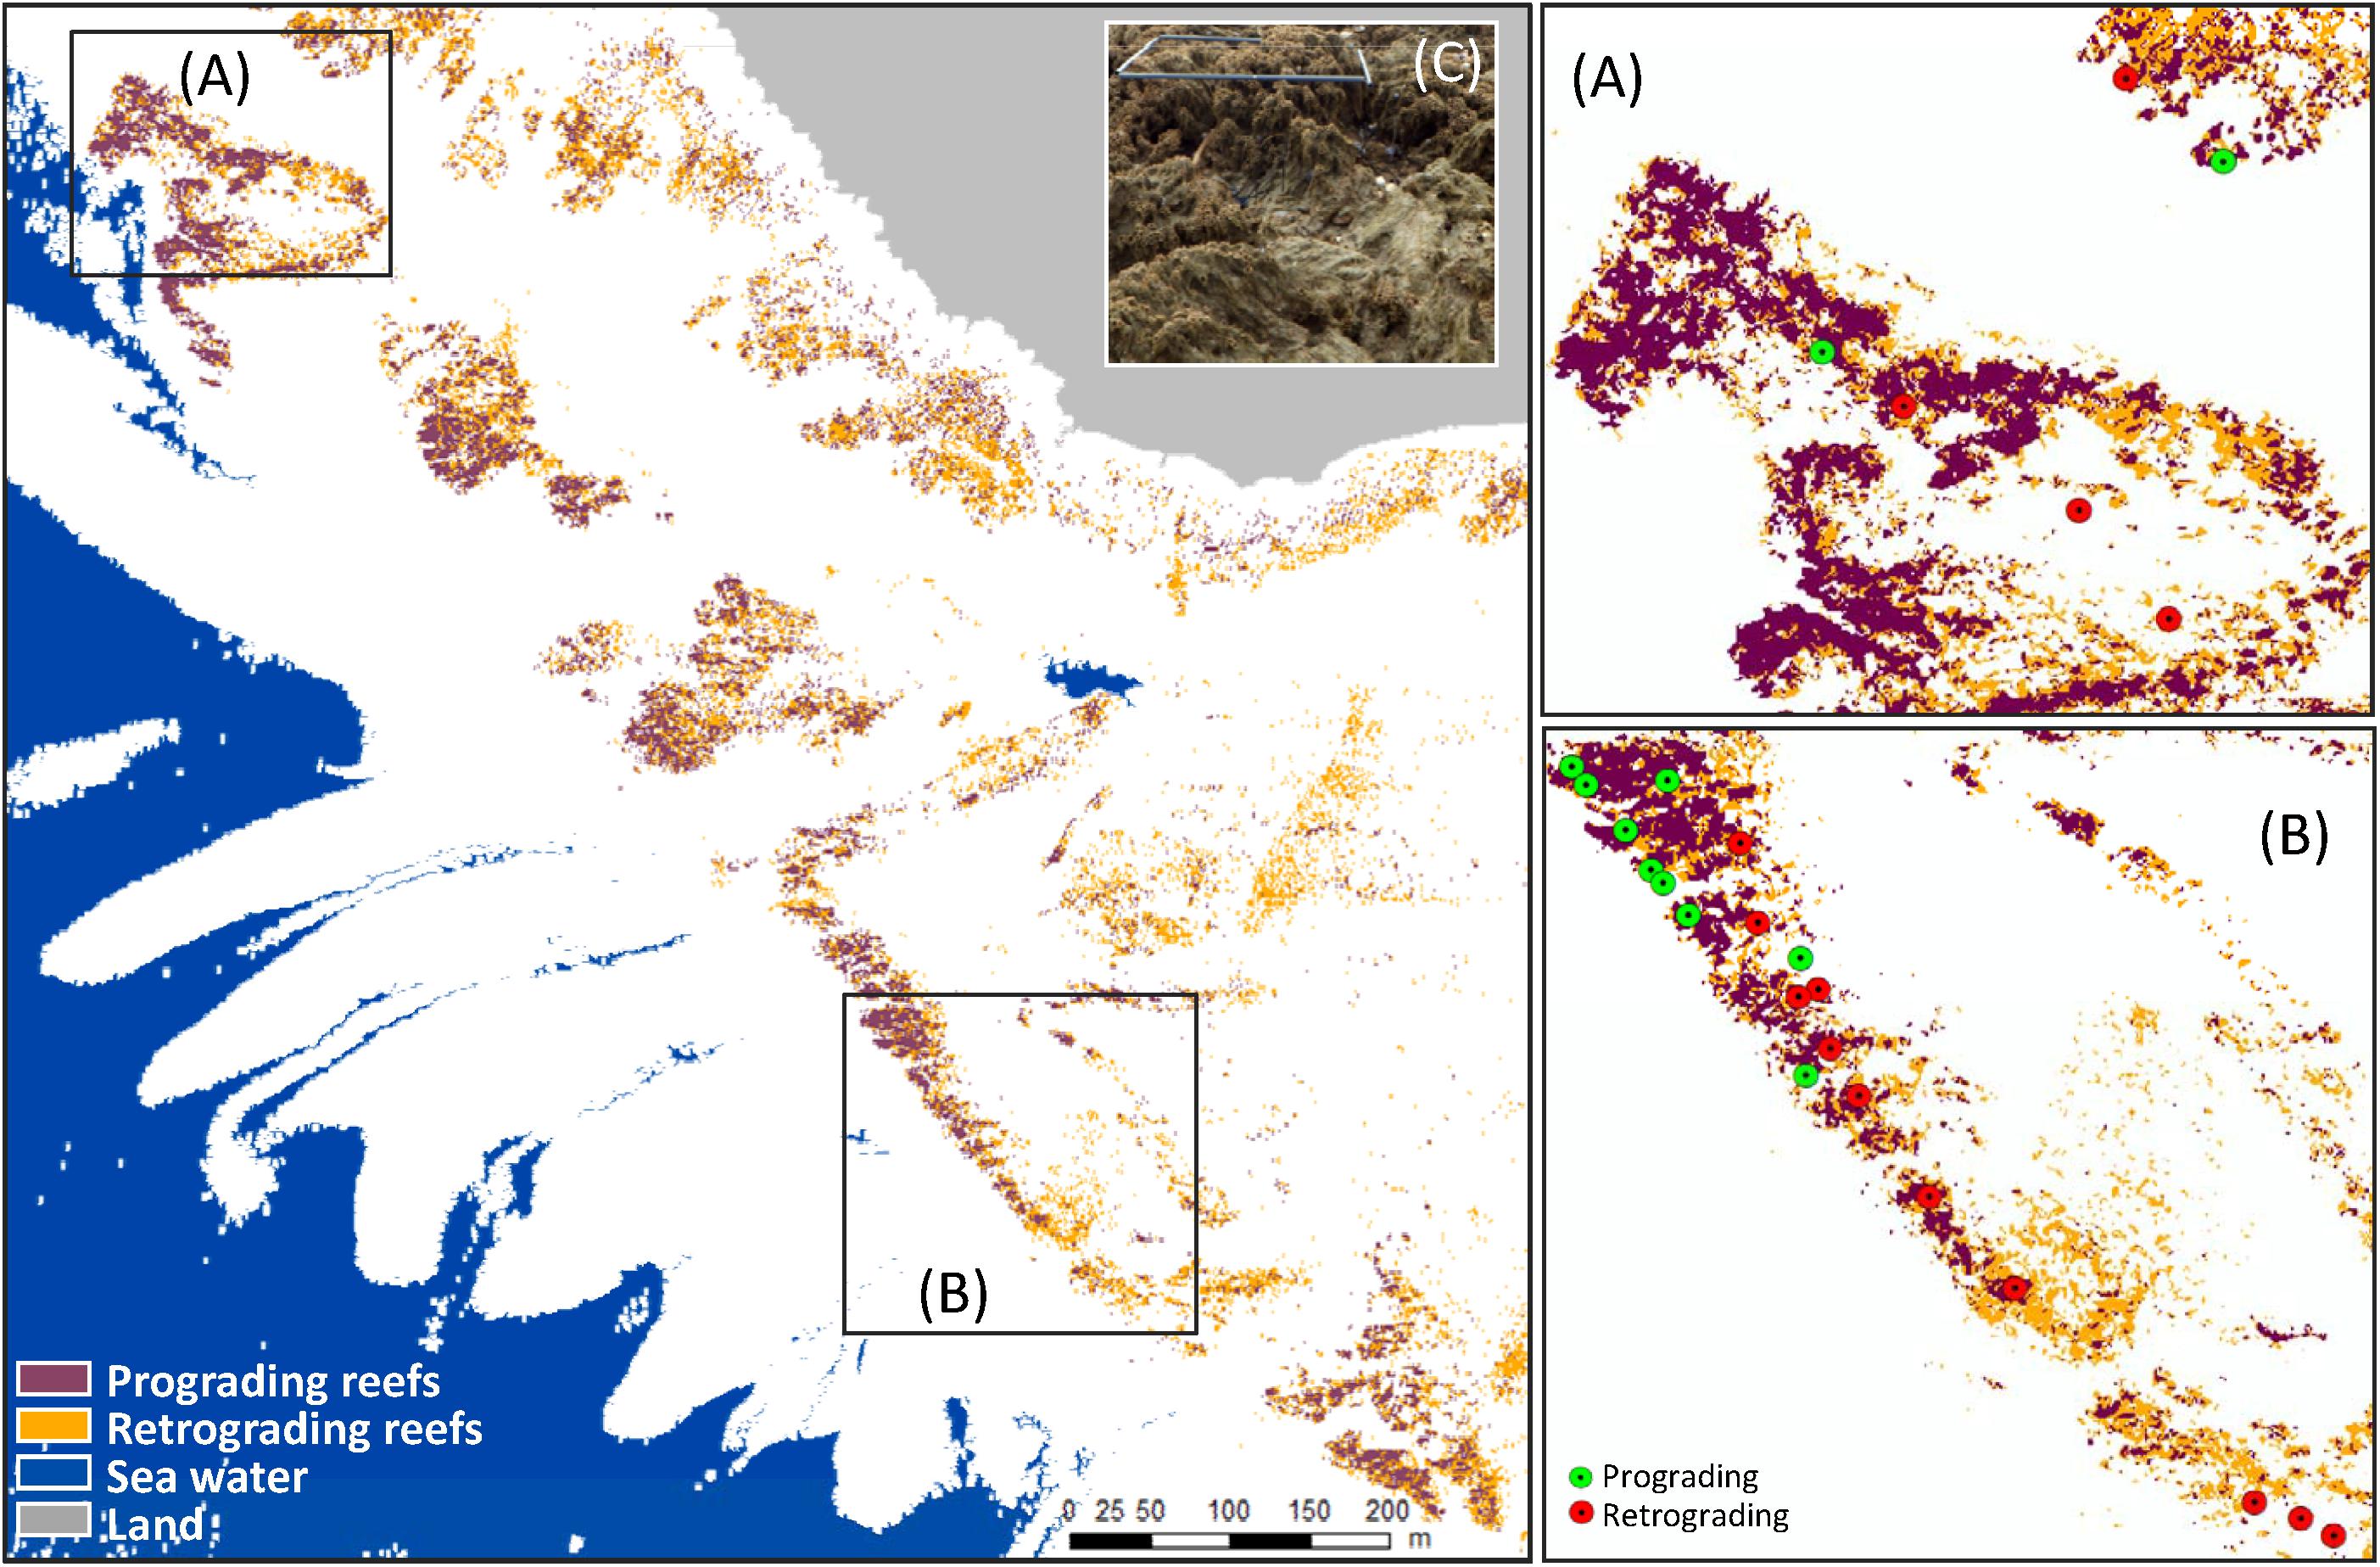
Figure 8. Sabellaria alveolata reef ecological status distribution in Champeaux showing zones displaying plotted field samples on ecological status classification (A,B) and field photography with a quadrat of 0.5 × 0.5 cm on S. alveolatta reef exhibiting high spatial variability in ecological status (C): prograding reef at the back of the image and retrograding reef in front of the image.
The calculated overall accuracy and Kappa coefficient varied with the number of pixels used in the evaluation. Values of 0.77 and 0.55 were obtained, respectively, when using 22 samples, but increased to 0.93 and 0.86, respectively, taking into account a larger field dataset (113 samples). The S. alveolata area in the Champeaux site was estimated at 5.52 and 6.76 ha, respectively with and without post-processing spatial filtering (Table 1). Sabellaria reefs in this site seemed to be slightly dominated by retrograded phase (58 and 53% respectively).
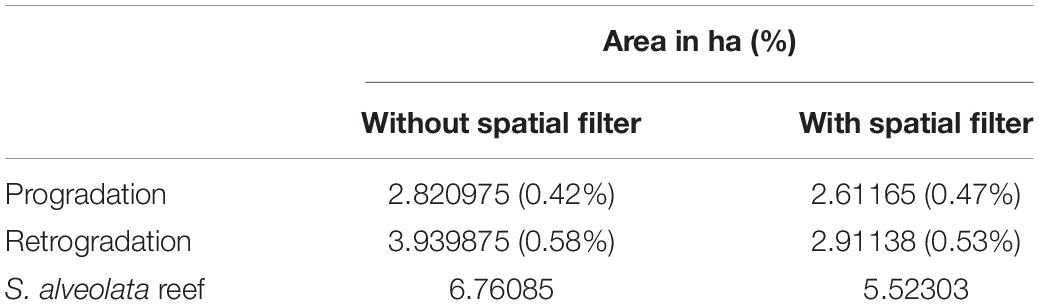
Table 1. S. alveolata area estimation based on combined LiDAR and hyperspectral data automatic classification.
Discussion
By using an automatic supervised classification algorithm, we demonstrated the ability of combining hyperspectral and LiDAR signals to (i) provide a high-resolution (0.5 m) map with 10 identified habitat classes describing S. alveolata reefs and their associated benthic features; (ii) accurately discriminate two S. alveolata reef forms, large reefs developing on sand and smaller veneers encrusting rocky shore areas, as well as its main ecosystem associated habitats, and (iii) reliably and remotely estimate the spatial structure of these bioconstructions ecological prograding vs. retrograding phase. Further details are presented in the following sections.
Seabed Type Spectral Discrimination
The visual inspection of field-measured spectra acquired in the Mont-Saint-Michel bay (France) shows that most of the spectral profiles are characterized by numerous absorption bands, mainly due to the presence of pigments. Previous studies showed that differences in pigment mixtures mostly explain differences observed in specific spectral signatures (Guillaumont et al., 1997; Méléder et al., 2003; Jesus et al., 2014). The absorption band observed at 673 nm is characteristic of all plants due to the ubiquitous presence of chlorophyll a, while chlorophyll c is responsible for absorption bands at 581 and 632 nm (Kuczynska et al., 2015) as displayed by brown algae and microalgae spectra. Chlorophylls a and c are dominant pigments in diatoms, haptophytes (Haptophyta or Prymnesiophyta) and to a lesser extent in some dinoflagellates (Kuczynska et al., 2015; Coupel et al., 2015). These two pigments typify microphytobenthos assemblages dominated by diatoms (Méléder et al., 2003; Jesus et al., 2014). These observations are coherent with taxonomic analyses of biofilm samples that show communities highly dominated by diatoms. Apart from chlorophylls, diatoms contain carotenoids in their pigment profile that are mainly composed of carotene, fucoxanthin and diatoxanthin under light conditions (Kuczynska et al., 2015). Carotenoids exhibit an intense absorption between 400 and 500 nm, fucoxanthin having a slightly higher absorption band (460–570 nm) than the others (Kuczynska et al., 2015). The dominance of fucoxanthin in the pigment profile of brown algae (Kirk, 1977) can also explain the main specificity of the spectral signature of this group. Lower reflectance spectra were observed for brown algae compared to other vegetation types in the blue-green part of the spectrum. This mainly results from a high concentration of fucoxanthin per cell, exhibiting high absorption in the range 460–570 nm (Kuczynska et al., 2015).
Intertidal substrates have spectral characteristics that seem to be related to both their mineral and chemical composition, as well as their structural properties (grain size and sorting parameters). Typical reflectance spectra of substrates reveal spectral shapes characterized by increasing reflectance with increasing wavelength, similar to those recorded by previous studies (Guillaumont, 1991; Méléder et al., 2003; Bajjouk et al., 2019a). Dark rocks are however an exception. Their gray black color seems to explain the very weak reflectance on all the visible and infrared spectral range. The slight absorption that appears at 673 nm is characteristic of vegetation and is observed in muddy sediment spectra, due to adhering alga cells in poor physiological state and chlorophyll a degradation products that also participate in absorption at 673 nm (Méléder et al., 2003).
Coherence of Benthic Feature Distributions
Multivariate analysis showed that although spectral richness, confusions between certain features (e.g., retrograding S. alveolata reefs vs. sand sediments) are possible. The integration of LiDAR sensor information into the hyperspectral image provides an additional characteristic on the nature of the topographic complexity that can help for improving the discrimination between benthic features. As discussed by Chang et al. (2004), materials in real world imaging could occupy a full pixel or be either mixed with other targets such as background or embedded in a single pixel as a subpixel target. Unlike SAM (Spectral Angle Mapper) and Euclidean distance that are generally used for pure pixel-based classical image processing, Mahalanobis distance does not take into account the spectral correlation among pixels. This characteristic of Mahalanobis is very useful and brings crucial information in identification or discrimination of materials in real images. The S. alveolata reef being spatially very heterogeneous in terms of abundance and structure, even at a high resolution, we therefore favor the use of Mahalanobis distance for image supervised classification.
The highly accurate overall accuracy (88% with a Kappa coefficient of 0.85) is consistent with the outputs of previous work that also successfully used this distance for image classification (Chang et al., 2004; Govender et al., 2008). Obtained results also reinforce the recommendations encouraging integration of direct observation field techniques with remotely sensed data to capture detailed habitat information at large scales, thus avoiding trade-offs between three types of scale: spatial, temporal and thematic (Lecours et al., 2015; Rhodes et al., 2015; D’Urban et al., 2020). The benthic habitat map of Champeaux obtained from the hyperspectral airborne imagery using Mahalanobis supervised classification allows the delineation of a higher number of discriminated habitats (ten) than what was identified using RGB (Red-Green-Blue) images and digital surface model, as shown for S. alveolata reefs growing atop of soft sediment exclusively (Collin et al., 2019). The most significant information that the pattern of class distribution reveals is the distinction between two types of S. alveolata formations; large reefs developing on sandy bottoms and smaller veneers encrusting rocky shore areas. This is the first time that the two types of intertidal S. alveolata reefs are automatically mapped and discriminated, revealing how relevant LiDAR information is. As stressed by Brown (2004), elevation data has the ability to enhance discrimination of intertidal species, since topographic metrics (e.g., elevation, rugosity or slope) can be computed and used as proxies for their position in relation to the tidal cycle. Visual inspection of the map shows, however, that pixels a priori automatically labeled “S. alveolata on rock” are actually located in an area (south-eastern part) without rocky substrata. This can be explained by the fact that bioconstructions in this specific area have a veneer shape but lack 3D structure, as is generally the case with S. alveolata reefs developing on sandy bottoms. Regarding reef ecological status distribution, the general orientation of the reef exhibits spatial pattern parallel to the coast. This is most likely due to the hydrodynamic conditions. Tidal currents at Champeaux are often fast and opposite to near shore direction. As a resulting effect, sand transport and probably reef development extend perpendicularly to the main current direction (Gruet, 1986).
We also showed here the benefits of using specific spectral indices to improve discrimination between algal groups. By not being limited only to the commonly used NDVI—a generic index to detect vegetation—and by calculating a spectral index specific to diatoms, it was possible to separately map macroalgae and microphytobenthos populations. The presence of benthic microalgae in the sediments landward is consistent with previous works confirming the importance of S. alveolata bioconstructions in enhancing the local benthic primary production (Jones et al., 2018). Jones et al. (2018) have also demonstrated how the engineered sediment significantly affects the sedimentary characteristics of the associated reef sediment, specifically grain-size, organic matter content and ultimately microphytobenthos. 3-dimensional engineered structures act as a physical barrier: wave energy is reduced and tidal currents are slowed, increasing sedimentation between reef structures and coastline (Noernberg et al., 2010; Desroy et al., 2011; Jones et al., 2018).
Contribution of Hyperspectral and Lidar Combination to Reef Status Estimation
Estimating the ecological status of benthic habitats is a requirement of the European Union Habitat Directive, where reef-habitats are listed as priority (Council Directive 92/43/EEC). Sabellaria alveolata reefs of varying abundance are common on all European coasts and all developments toward automatic assessment of ecological status of this habitat would tremendously help large scale ecological assessments, while limiting time consuming and costly local surveys. Previous local investigation of reef ecological status based on reef types (veneer, hummock, platform) and phases (retrogradation and progradation) are costly in human resources and showed high inter-operator variability (Desroy et al., 2011). In this study, prograding and retrograding phases accurate map was provided with 0.5 m spatial resolution. An overall classification accuracy and Kappa coefficient of respectively 0.93 and 0.86 can be reached when using a validation against field data that takes into account a large sampling dataset. The sample field data plots on ecological status classification map also showed good coherence in terms of distribution pattern. This shows that the combination of LiDAR and hyperspectral reflectance variables had a robust explanatory capacity of the variability of S. alveolata reef ecological status. Indeed, LiDAR has also proven to be effective in characterizing health status of other ecosystems, namely shallow coral reefs. Using an artificial neural network classification, Collin et al. (2018) have shown that the dual combination of LiDAR surface and intensity variables had a robust explanatory power to predict the variability of coral reef states, with an overall accuracy of 0.75. We showed here that combined remote-sensing techniques can provide a high-confidence assessment of the prograding or retrograding phase of this habitat. This definitely calls for larger applications to other coastal areas.
The ecological status of S. alveolata reef was mapped continuously throughout Champeaux site. The 50 cm spatial resolution targeted in the present study outperformed the 75 m in Desroy et al. (2011). The latter authors used in situ expert-dependent estimation, while we based our method on an automatic objective processing for reef status estimation. Spatial patterns emerging from ecological status classification, also display a barrier reef on sand with a vigorous seaward front core, while the retrograded and sparse reefs are mainly located in the south-east part and next to shoreline. This seems to be consistent with previous work carried out by Collin et al. (2019) that have described a strong polarization of S. alveolata reefs with high abundance on forereef and low abundance on backreef. The forereef is subject to strong hydrodynamic and potentially higher coarse sediment resuspension, leading to increased tube-building activity, while the back reef mainly expands into more sheltered and muddier environments, less favorable to S. alveolata development (Bonnot-Courtois et al., 2008). Environmental impacts may also be exacerbated by human activities which shape the spatial pattern of reef status. Degraded reefs are mostly present in areas that are easily accessible to pedestrians. As it was observed for Mediterranean S. alveolata reef (Lisco et al., 2020), this degraded localization most likely drives the direct mechanical disturbances related to higher trampling and recreational fishing, leading to massive degradation of some reef areas (Dubois et al., 2002).
Perspectives for S. alveolata Reef Monitoring and Management
The trained classification yielded very accurate benthic feature identification. However, some pixels were wrongly classified. Processing improvements are thereby still needed to improve discrimination between mixed up classes. The strategy of field data acquisition can also be optimized to provide a sampling as balanced as possible between the different classes targeted. This can increase the efficiency of both calibration and validation steps. Another crucial criterion is the position accuracy, due to the high heterogeneity of the seafloor: an inaccuracy of only few meters often means a different substrate, a different species or a different ecological status (Florén et al., 2015). In future studies, field data should be collected and accurately positioned, by using for example DGPS (Differential Global Positioning System), to facilitate and make more robust accuracy assessment achievement. Placing benthic markers that can be identified in the imagery, as suggested by Mumby et al. (2004), is also a possibility to address this issue. Moreover, other classification algorithms, such as deep learning prediction (LeCun et al., 2015) should also be tested to examine their powerfulness compared to Mahalanobis distance based classification. This may allow for a better estimation of the areas occupied by benthic habitats, more particularly S. alveolata bioconstructions. Such a metric can be used in spatiotemporal dynamic monitoring or even integrated into ecological status indicators, as is the case for other habitats in European Directive framework (Duarte et al., 2017).
Regarding S. alveolata reef status estimation, the work reported here represents a first step which illustrates a promising approach, based on the combination of hyperspectral and LiDAR data. The review of coral reef monitoring and assessment technologies carried out by Obura et al. (2019), emphasized that satellite data combined with airborne imagery and airborne LiDAR data are now routinely used in identifying and monitoring marine protected areas as a new ways to assess benthic habitat. Quantitative estimation of S. alveolata ecological status index is an attainable goal: further work, particularly a linear mixing model approach (Bioucas-Dias et al., 2012; Bajjouk et al., 2019b), may prove to be relevant to estimate S. alveolata epibiont abundance—a key element in reef dynamics—and possibly further develop a finer metric than the prograding vs. retrograding status qualitative estimation. Integrated applications of these remote sensing techniques are still lacking to target S. alveolata ecosystem spatial ecology. As wisely pointed out by D’Urban et al. (2020), there is a strong need for policymakers to have access to high-quality environmental information, in order to make objective conservation decisions leading to ecosystem service maintenance. In addition to helping gain a better understanding of ecological processes, 3D remote sensing approaches constitute an efficient tool for recording accurate environmental key information at both large scale and high spatial resolution. These characteristics are of great interest, especially for the study of rapidly changing environments such as those associated with S. alveolata reefs. We also highlight the relevance of such information in improving communication and targeted awareness-raising through their ability to provide virtual reality system overviews.
Conclusion
The present study is an initial step toward designing a new alternative operational approach targeting broad-scale, high-resolution, non-destructive monitoring of S. alveolata reefs. The main goal is to assess the potential of optical imagery, more specifically hyeperspectral and LiDAR data, for a high-resolution (0.5 m) spatial characterization of the S. alveolata reef ecosystem.
The main benthic features showed clear differences in their field spectral reflectance shapes and/or their magnitudes. However, statistical analysis revealed the difficulty to distinguish between some types solely on the basis of their spectral signatures. The joint analysis of the LiDAR sensor information with the hyperspectral imagery provides an additional characteristic on the nature of the topographic complexity, thus enhancing the discrimination capability.
By using an automatic supervised classification, we have shown for the first time the potential of hyperspectral and Lidar signal combination (i) to accurately discriminate the two S. alveolata reef forms, large reef developing on sand and smaller veneers encrusting rocky shore areas, as well as its main ecosystem associated habitats and (ii) to reliably and remotely estimate the spatial structure of these bioconstruction prograding and retrograding dynamic phases as a proxy of ecological status. This latter is commonly required by both scientists, for better understanding of ecosystem process, and managers, for better implementation of European directives.
The study also highlighted the importance of field positioning accuracy to perform a robust statistical validation, mainly in high spatial heterogeneity as displays the S. alveolata reefs. Further work has therefore been identified to improve obtained results and to provide quantitative information on S. alveolata reef ecological status. Such information, if is provided on a large scale and at a sufficient frequency, will allow (i) improved understanding of physical and biological structural changes of these complex bioconstructions, (ii) better prediction of their spatio-temporal evolution and (iii) elaboration of appropriate measures for their preservation and socio-economic management.
Data Availability Statement
The online publication of data is planned at the end of the BIOHERM project in 2021. Requests to access the datasets should be directed to touria.bajjouk@ifremer.fr.
Author Contributions
TB, LD, and MD designed the project strategy and performed funding acquisition. TB supervised and managed the project. TB, CJ, and SD collected field data. AD and CJ carried out the laboratory analysis. TB performed data processing and experimental validation and drafted the manuscript. SD validated the classification models. TB, CJ, SD, LD, and MD contributed to manuscript writing and editing. All authors shared the responsibility for contributing to the final version of the manuscript.
Funding
This work was funded by the CNES (French National Center for Space Studies) as part of the space scientific research TOSCA program to support the CHIMERE sensor and the Biodiversity mission. The study was carried out within the framework of the BIOHERM project (Ref. 4911/4500062124).
Conflict of Interest
The authors declare that the research was conducted in the absence of any commercial or financial relationships that could be construed as a potential conflict of interest.
Acknowledgments
We are very grateful to Yves Pastol from the SHOM (Hydrographic and Oceanographic Service of the Navy) for providing Lidar data acquired within the framework of Litto3D program. We also thank Pierre-Olivier Liabot and Simon Martin from Ifremer, for their help on field data acquisition, as well as Hytech Imaging for airborne data acquisition. We wish to warmly thank Amelia Curd, native English-speaker, for proofreading the manuscript. Finally, we would like to gratefully thank the two reviewers for their valuable comments and suggestions.
References
Bajjouk, T., Mouquet, P., Ropert, M., Quod, J. P., Hoarau, L., Bigot, L., et al. (2019a). Detection of changes in shallow coral reefs status: towards a spatial approach using hyperspectral and multispectral data. Ecol. Indic. 96, 174–191. doi: 10.1016/j.ecolind.2018.08.052
Bajjouk, T., Zarati, I., Drumetz, L., and Dalla Mura, M. (2019b). “Spatial characterization of marine vegetation using semisupervised hyperspectral unmixing,” in Proceedings of the 2019 10th Workshop on Hyperspectral Imaging and Signal Processing: Evolution in Remote Sensing (WHISPERS), Piscataway, NJ. doi: 10.1109/WHISPERS.2019.8920949
Basuyaux, O., and Lecornu, B. (2015). Cartographie des Hermelles sur la Façade ouest du Cotentin en 2014. Durham: Produit SMEL.
Beisiegel, K., Darr, A., Gogina, M., and Zettler, M. L. (2017). Benefits and shortcomings of non-destructive benthic imagery for monitoring hard-bottom habitats. Mar. Pollut. Bull. 121, 5–15. doi: 10.1016/j.marpolbul.2017.04.009
Bioucas-Dias, J. M., Plaza, A., Dobigeon, N., Parente, M., Du, Q., Gader, P., et al. (2012). “Hyperspectral unmixing overview: geometrical, statistical, and sparse regression-based approaches,” in Proceedings of the IEEE Journal of Selected Topics in Applied Earth Observations and Remote Sensing, Piscataway, NJ. doi: 10.1109/JSTARS.2012.2194696
Bonifazi, A., Lezzi, M., Ventura, D., Lisco, S., Cardone, F., and Gravina, M. F. (2019). Macrofaunal biodiversity associated with different developmental phases of a threatened Mediterranean Sabellaria alveolata (Linnaeus, 1767) reef. Mar. Environ. Res. 145, 97–111. doi: 10.1016/j.marenvres.2019.02.009
Bonnot-Courtois, C., Bassoulet, P., Tessier, B., Cayocca, F., Le Hir, P., and Baltzer, A. (2008). Remaniements sedimentaires superficiels sur l’estran occidental de la baie du Mont-Saint-Michel. Eur. J. Environ. Civil Eng. 12, 51–65. doi: 10.3166/ejece.12.51-65
Bonnot-Courtois, C., Fournier, J., Rollet, C., Populus, J., Guillaumont, B., and Loarer, R. (2005). Bio-morpho-sedimentary cartography of the tidal zones in the French Benthic Network context (complementary of coastal orthophotographs and Lidar data). Photo Interprét. 41, 13–27.
Brown, K. (2004). “Increasing classification accuracy of coastal habitats using integrated airborne remote sensing,” in Proceedings of the European Association of Remote Sensing Laboratories eProceedings, 3, SIG “Remote Sensing of the Coastal Zone, Belgium.
Chang, C. I., Liu, W., and Chang, C. C. (2004). “Discrimination and identification for subpixel targets in hyperspectral imagery,” in Proceedings of the 2004 International Conference on Image Processing, New York, NY.
Chennu, A., Färber, P., Volkenborn, N., Al-Najjar, M. A. A., Janssen, F., de Beer, D., et al. (2013). Hyperspectral imaging of the microscale distribution and dynamics of microphytobenthos in intertidal sediments. Limnol. Oceanogr. Methods 11, 511–528. doi: 10.4319/lom.2013.11.511
Collin, A., Dubois, S., James, D., and Houet, T. (2019). Improving intertidal reef mapping using UAV surface, red edge, and near-infrared data. Drones 3:67. doi: 10.3390/drones3030067
Collin, A., Dubois, S., Ramambason, C., and Etienne, S. (2018). Very high-resolution mapping of emerging biogenic reefs using airborne optical imagery and neural network: the honeycomb worm (Sabellaria alveolata) case study. Int. J. Remote Sens. 39, 5660–5675. doi: 10.1080/01431161.2018.1484964
Coupel, P., Matsuoka, A., Ruiz-Pino, D., Gosselin, M., Marie, D., Tremblay, J. E., et al. (2015). Pigment signatures of phytoplankton communities in the Beaufort Sea. Biogeosciences 12, 991–1006. doi: 10.5194/bg-12-991-2015
Cracknell, A. P. (2001). The exciting and totally unanticipated success of the AVHRR in applications for which it was never intended. Adv. Space Res. 28, 233–240. doi: 10.1016/s0273-1177(01)00349-0
Curd, A., Cordier, C., Firth, L. B., Bush, L., Gruet, Y., Le Mao, P., et al. (2020). A broad-scale long-term dataset of Sabellaria alveolata distribution and abundance curated through the REEHAB (REEf HABitat) Project. SEANOE doi: 10.17882/72164
Curd, A., Pernet, F., Corporeau, C., Delisle, L., Firth, L. B., Nunes, F. L., et al. (2019). Connecting organic to mineral: how the physiological state of an ecosystem-engineer is linked to its habitat structure. Ecol. Indic. 98, 49–60. doi: 10.1016/j.ecolind.2018.10.044
Davies, A. B., and Asner, G. P. (2014). Advances in animal ecology from 3D-LiDAR ecosystem mapping. Trends Ecol. Evol. 29, 681–691. doi: 10.1016/j.tree.2014.10.005
De Maesschalck, R., Jouan-Rimbaud, D., and Massart, D. L. (2000). The mahalanobis distance. Chemometr. Intellig. Lab. Syst. 50, 1–18. doi: 10.1016/S0169-7439(99)00047-7
Desroy, N., Dubois, S. F., Fournier, J., Ricquiers, L., Le Mao, P., Guerin, L., et al. (2011). The Conservation status of Sabellaria alveolata (L.) (Polychaeta: Sabellariidae) reefs in the Bay of Mont-Saint-Michel. Aquat. Conserv. Mar. Freshw. Ecosyst. 21, 462–471. doi: 10.1002/aqc.1206
Duarte, B., Neto, J. M., Marques, J. C., Adams, J. B., and Caçador, I. (2017). Marine angiosperm indices used to assess ecological status within the water framework directive and south african national water act: learning from differences and common issues. Ecol. Indic. 83, 192–200. doi: 10.1016/j.ecolind.2017.07.032
Dubois, S., Commito, J. A., Olivier, F., and Retiere, C. (2006). Effects of epibionts on Sabellaria alveolata (L.) biogenic reefs and their associated fauna in the Bay of Mont Saint-Michel. Estuar. Coast. Shelf Sci. 68, 635–646. doi: 10.1016/j.ecss.2006.03.010
Dubois, S., Retiere, C., and Olivier, F. (2002). Biodiversity associated with Sabellaria alveolata (Polychaeta: Sabellariidae) reefs: effects of human disturbances. J. Mar. Biol. Assoc. U. K. 82, 817-26. doi: 10.1017/S0025315402006185
D’Urban, J. T., Williams, G. J., Walker-Springett, G., and Davies, A. J. (2020). Three-dimensional digital mapping of ecosystems: a new era in spatial ecology. Proc. R. Soc. B 287:20192383. doi: 10.1098/rspb.2019.2383
Echappé, C., Gernez, P., Méléder, V., Jesus, B., Cognie, B., Decottignies, P., et al. (2018). Satellite remote sensing reveals a positive impact of living oyster reefs on microalgal biofilm development. Biogeosciences 15, 905–918. doi: 10.5194/bg-15-905-2018
Firth, L. B., Nova Mieszkowska, L. M., Grant, L. E., Bush, A. J., Davies, M. T., Frost, P. S., et al. (2015). Historical comparisons reveal multiple drivers of decadal change of an ecosystem engineer at the range edge. Ecol. Evol. 5, 3210-22. doi: 10.1002/ece3.1556
Florén, K., Tulldahl, M., and Wikström, S. (2015). “Using Lidar and satellite data to estimate cover of substrate and vegetation in the Baltic sea,” in Proceedings of the 35th EARSeL Symposium - European Remote Sensing: Progress, Challenges and Opportunities Stockholm, Sweden.
Foody, G. M., and Mathur, A. (2006). The use of small training sets containing mixed pixels for accurate hard image classification: training on mixed spectral responses for classification by a SVM. Remote Sens. Environ. 103, 179–189. doi: 10.1016/j.rse.2006.04.001
Fyfe, S. K. (2003). Spatial and temporal variation in spectral reflectance: are seagrass species spectrally distinct? Limnol. Oceanogr. 48, 464–479. doi: 10.4319/lo.2003.48.1_part_2.0464
Govender, M., Chetty, K., Naiken, V., and Bulcock, H. (2008). A comparison of satellite hyperspectral and multispectral remote sensing imagery for improved classification and mapping of vegetation. Water SA 34, 147–154. doi: 10.4314/wsa.v34i2.183634
Griffin, R. A., Jones, R. E., Lough, N. E., Lindenbaum, C. P., Alvarez, M. C., Clark, K. A., et al. (2020). Effectiveness of acoustic cameras as tools for assessing biogenic structures formed by Sabellaria in highly turbid environments. Aquat. Conserv. Mar. Freshw. Ecosyst. 30, 1121–1136. doi: 10.1002/aqc.3313
Gruet, Y. (1972). Aspects morphologiques et dynamiques de constructions de l’annélide polychète Sabellaria alveolata (Linné). Revue Travaux l’Institut. Pêches Mar. 36, 131–161.
Gruet, Y. (1982). Recherches sur L’écologie des “Récifs” D’hermelles Édifiés par l’Annélide Polychète Sabellaria alveolata Linné. Ph. D thesis, Université de Nantes, Nantes.
Gruet, Y. (1986). Spatio-temporal changes of sabellarian reefs built by the sedentary polychaete Sabellaria alveolata (Linne). Mar. Ecol. 7, 303–319. doi: 10.1111/j.1439-0485.1986.tb00166.x
Guillaumont, B. (1991). “Utilisation de l’imagerie satellitaire pour les comparaisons spatiales et temporelles en zones intertidale,” in Proceedings of the Esturaries ans Coasts: Spatial and Temporal Intercomparisons - ECSA 19 Symposium, Olsen.
Guillaumont, B., Bajjouk, T., and Talec, P. (1997). “Seaweed and remote sensing: a critical review of sensors and data processing,” in Progress in Phycological Research, eds F. E. Round and D. J. Chapman (London: Biopress Ltd), 213–282.
Jesus, B., Rosa, P., Mouget, J. L., Méléder, V., Launeau, P., and Barillé, L. (2014). Spectral-radiometric analysis of taxonomically mixed microphytobenthic biofilms. Remote Sens. Environ. 140, 196–205. doi: 10.1016/j.rse.2013.08.040
Jones, A. (2017). Effect of an Engineer Species on the Diversity and Functioning of Benthic Communities: the Sabellaria Alveolata Reef Habitat, Doctoral thesis, Université de Bretagne occidentale, Brest.
Jones, A., Dubois, S., Desroy, N., and Fournier, J. (2018). Interplay between abiotic factors and species assemblages mediated by the ecosystem engineer Sabellaria alveolata (Annelida: Polychaeta). Estuar. Coast. Shelf Sci. 200, 1–18. doi: 10.1016/j.ecss.2017.10.001
Kinberg, J. G. H. (1866). Annulata Nova. Öfversigt af Königlich vetenskapsakademiens förhandlingar. Remote Sens. 22, 239–258.
Kirk, J. T. O. (1977). Thermal dissociation of fucoxanthin-prothein binding in pigment complexes from chloroplasts of Hormosira(phaeophyta). Plant Sci. Lett. 9, 373–380. doi: 10.1016/0304-4211(77)90109-2
Kuczynska, P., Jemiola-Rzeminska, M., and Strzalka, K. (2015). Photosynthetic pigments in diatoms. Mar. Drugs 13, 5847–5881. doi: 10.3390/md13095847
Kushnir, V., Korotaev, G., Kogan, F., and Powel, A. M. (2011). “Consequences of Land and Marine Ecosystems Interaction for the Black Sea Coastal Zone,” in Use of Satellite and In-Situ Data to Improve Sustainability. NATO Science for Peace and Security Series C: Environmental Security, eds F. Kogan, A. Powell, and O. Fedorov (Dordrecht: Springer), doi: 10.1007/978-90-481-9618-0_21
Lana, P. D., and Gruet, Y. (1989). Sabellaria wilsoni sp.n. (Polychaeta, Sabellariidae) from the southeast coast of Brazil. Zool. Scripta 18, 239–244. doi: 10.1111/j.1463-6409.1989.tb00449.x
Launeau, P., Méléder, V., Verpoorter, C., Barillé, L., Kazemipour-Ricci, F., Giraud, M., et al. (2018). Microphytobenthos biomass and diversity mapping at different spatial scales with a hyperspectral optical model. Remote Sens. 10:716. doi: 10.3390/rs10050716
Lecornu, B., Schlund, E., Basuyaux, O., Cantat, O., and Dauvin, J. C. (2016). Dynamics (from 2010-2011 to 2014) of Sabellaria alveolata reefs on the western coast of Cotentin (English Channel, France). Reg. Stud. Mar. Sci. 8, 157–169. doi: 10.1016/j.rsma.2016.07.004
Lecours, V., Devillers, R., Schneider, D. C., Lucieer, V. L., Brown, C. J., and Edinger, E. N. (2015). Spatial scale and geographic context in benthic habitat mapping: review and future directions. Mar. Ecol. Prog. Ser. 535, 259–284. doi: 10.3354/meps11378
LeCun, Y., Bengio, Y., and Hinton, G. (2015). Deep learning. Nature 521:436. doi: 10.1038/nature14539
Lisco, S. N., Acquafredda, P., Gallicchio, S., Sabato, L., Bonifazi, A., Cardone, F., et al. (2020). The sedimentary dynamics of Sabellaria alveolata bioconstructions (Ostia, Tyrrhenian Sea, central Italy). J. Palaeogeogr. 9, 1–18. doi: 10.1186/s42501-019-0050-6
Litto3D (2019). Litto3D Partie Maritime. Produit Réseau d’Observation du Littoral Normand et Picard (ROLNP), Service Hydrographique et Océanographique de la Marine (SHOM), l’Etat, Région Normandie, Région Hauts-de-France, Agence de l’eau Seine Normandie, Agence de l’eau Artois-Picardie, Parc Naturel Marin des Estuaires Picards et de la Mer d’Opale- V. 20190831.
Marchand, Y., and Cazoulat, R. (2003). Biological reef survey using spot satellite data classification by cellular automata method e bay of Mont Saint-Michel. Comput. Geosci. 29, 413–421. doi: 10.1016/s0098-3004(02)00116-4
Méléder, V., Launeau, P., Barillé, L., and Rincé, Y. (2003). Cartographie des peuplements du microphytobenthos par télédétection spatiale visible-infrarouge dans un écosystème conchylicole. C. R. Biol. 326, 377–389. doi: 10.1016/s1631-0691(03)00125-2
Muir, A. P., Nunes, F. L., Dubois, S. F., and Pernet, F. (2016). Lipid remodelling in the reef-building honeycomb worm, Sabellaria alveolata, reflects acclimation and local adaptation to temperature. Sci. Rep. 6:35669. doi: 10.1038/srep35669
Mumby, P. J., Hedley, J. D., Chisholm, J. R. M., Clark, C. D., Ripley, H., and Jaubert, J. (2004). The cover of living and dead corals from airborne remote sensing. Coral Reefs 23, 171–183. doi: 10.1007/s00338-004-0382-1
Noernberg, M. A., Fournier, J., Dubois, S., and Populus, J. (2010). Using airborne laser altimetry to estimate Sabellaria alveolata (Polychaeta: Sabellariidae) reefs volume in tidal flat environments. Estuar. Coast. Shelf Sci. 90, 93–102. doi: 10.1016/j.ecss.2010.07.014
Obura, D. O., Appeltans, W., Amornthammarong, N., Aeby, G., Bax, N. J., Bishop, J., et al. (2019). Coral reef monitoring, reef assessment technologies, and ecosystem-based management. Front. Mar. Sci. 6:580. doi: 10.3389/fmars.2019.00580
Petit, T., Bajjouk, T., Mouquet, P., Rochette, S., Vozel, B., and Delacourt, C. (2017). Hyperspectral remote sensing of coral reefs by semi-analytical model inversion - Comparison of different inversion setups. Remote Sens. Environ. 190, 348–365. doi: 10.1016/j.rse.2017.01.004
Pu, R., Gong, P., Tian, Y., Miao, X., Carruthers, R. I., and Anderson, G. L. (2008). Using classification and NDVI differencing methods for monitoring sparse vegetation coverage: a case study of saltcedar in Nevada, USA. Internat. J. Remote Sens. 29, 3987–4011. doi: 10.1080/01431160801908095
Rhodes, C. J., Henrys, P., Siriwardena, G. M., Whittingham, M. J., and Norton, L. R. (2015). The relative value of field survey and remote sensing for biodiversity assessment. Methods Ecol. Evol. 6, 772–781. doi: 10.1111/2041-210x.12385
Richards, J. A. (1999). Remote Sensing Digital Image Analysis. Berlin: Springer-Verlag. doi: 10.1007/978-3-662-03978-6
Schmidt, K. S., and Skidmore, A. K. (2003). Spectral discrimination of vegetation types in a coastal wetland. Remote Sens. Environ. 85, 92–108. doi: 10.1016/s0034-4257(02)00196-7
Stuckens, J., Coppin, P. R., and Bauer, M. E. (2000). Integrating contextual information with per-pixel classification for improved land cover classification. Remote Sens. Environ. 71, 282–296. doi: 10.1016/s0034-4257(99)00083-8
Tucker, C. J. (1979). Red and photographic infrared linear combinations for monitoring vegetation. Remote Sens. Environ. 8, 127–150. doi: 10.1016/0034-4257(79)90013-0
Utermöhl, H. (1958). Zur Vervoll kommung der quantitativen phytoplankton-methodik. Mitteilungen. Int. Ver. Theor. Angew. Limnol. 9, 1–38. doi: 10.1080/05384680.1958.11904091
Van der Wal, D., Wielemaker-van den Dool, A., and Herman, P. M. (2010). Spatial synchrony in intertidal benthic algal biomass in temperate coastal and estuarine ecosystems. Ecosystems 2010, 338–351. doi: 10.1007/s10021-010-9322-9
Ventura, D., Bonifazi, A., Gravina, M. F., Belluscio, A., and Ardizzone, G. (2018). Mapping and classification of ecologically sensitive marine habitats using unmanned aerial vehicle (UAV) imagery and object-based image analysis (OBIA). Remote Sens. 10:1331. doi: 10.3390/rs10091331
Wedding, L. M., Friedlander, A. M., McGranaghan, M., Yost, R. S., and Monaco, M. E. (2008). Using bathymetric lidar to define nearshore benthic habitat complexity: implications for management of reef fish assemblages in Hawaii. Remote Sens. Environ. 112, 4159–4165. doi: 10.1016/J.RSE.2008.01.025
Xiang, S., Nie, F., and Zhang, C. (2008). Learning a Mahalanobis distance metric for data clustering and classification. Pat. Recogn. 41, 3600–3612. doi: 10.1016/j.patcog.2008.05.018
Keywords: benthic habitats, biogenic reefs, ecological status, hyperspectral, intertidal, lidar, mapping
Citation: Bajjouk T, Jauzein C, Drumetz L, Dalla Mura M, Duval A and Dubois SF (2020) Hyperspectral and Lidar: Complementary Tools to Identify Benthic Features and Assess the Ecological Status of Sabellaria alveolata Reefs. Front. Mar. Sci. 7:575218. doi: 10.3389/fmars.2020.575218
Received: 22 June 2020; Accepted: 02 September 2020;
Published: 08 October 2020.
Edited by:
Massimo Ponti, University of Bologna, ItalyReviewed by:
Paolo Rossi, University of Modena and Reggio Emilia, ItalyStefania Lisco, University of Bari Aldo Moro, Italy
Copyright © 2020 Bajjouk, Jauzein, Drumetz, Dalla Mura, Duval and Dubois. This is an open-access article distributed under the terms of the Creative Commons Attribution License (CC BY). The use, distribution or reproduction in other forums is permitted, provided the original author(s) and the copyright owner(s) are credited and that the original publication in this journal is cited, in accordance with accepted academic practice. No use, distribution or reproduction is permitted which does not comply with these terms.
*Correspondence: Touria Bajjouk, touria.bajjouk@ifremer.fr