Microstructures and Fabric Transitions of Natural Ice from the Styx Glacier, Northern Victoria Land, Antarctica
by
 , , and
Daeyeong Kim
1,* ,
,
David J. Prior
2, 
Yeongcheol Han
3,
Chao Qi
4,
Hyangsun Han
5 and
Hyeon Tae Ju
6 1
Division of Polar Earth-System Sciences, Korea Polar Research Institute, Incheon 21990, Korea
2
Department of Geology, University of Otago, Dunedin 9054, New Zealand
3
Division of Polar Paleoenvironment, Korea Polar Research Institute, Incheon 21990, Korea
4
Key Laboratory of Earth and Planetary Physics, Institute of Geology and Geophysics, Chinese Academy of Sciences, Beijing 100029, China
5
Department of Geophysics, Kangwon National University, Chuncheon 24341, Korea
6
Antarctic K-Route Expedition Team, Korea Polar Research Institute, Incheon 21990, Korea
*
Author to whom correspondence should be addressed.
Minerals 2020, 10(10), 892; https://doi.org/10.3390/min10100892
Submission received: 10 August 2020
/
Revised: 23 September 2020
/
Accepted: 7 October 2020
/
Published: 8 October 2020
(This article belongs to the Special Issue Lattice-Preferred Orientation and Microstructures of Minerals and Their Implications for Seismic Anisotropy)
Abstract
:We investigated the microstructures of five ice core samples from the Styx Glacier, northern Victoria Land, Antarctica. Evidence of dynamic recrystallization was found in all samples: those at 50 m mainly by polygonization, and those at 170 m, largely by grain boundary migration. Crystallographic preferred orientations of all analyzed samples (view from the surface) typically showed a single cluster of c-axes normal to the surface. A girdle intersecting the single cluster occurs at 140–170 m with a tight cluster of a-axes normal to the girdle. We interpret the change of crystallographic preferred orientations (CPOs) at <140 m as relating to a combination of vertical compression, and shear on a horizontal plane, and the girdle CPOs at depths >140 m, as the result of horizontal extension. Based on the data obtained from the ground penetrating radar, the underlying bedrock topography of a nunatak could have generated the extensional stress regime in the study area. The results imply changeable stress regimes that may occur during burial as a result of external kinematic controls, such as an appearance of a small peak in the bedrock.
1. Introduction
Understanding the rheological behavior of Antarctic ice is essential for predictions of sea-level change in the future. Ice in the polar regions flow continuously from the continents to the oceans driven by gravity. The flow of ice is usually controlled by two processes: frictional sliding on the bedrock, which often occurs where the base is at pressure melting or pre-melting conditions [1,2,3,4,5,6,7,8], and the internal plastic deformation of the polycrystalline ice [9,10,11,12,13,14,15].
The plastic deformation of Antarctic ice results in the development of crystallographic preferred orientations (CPOs), which may induce a strong mechanical anisotropy that can enhance or impede the flow of ice and can be used to study the kinematics of flow [16]. The CPOs of ice vary with the kinematics (e.g., compression or shear), stress, temperature, and strain [10,17,18,19]. In nature, usually three types of ice c-axes fabrics form: single cluster, double clusters, and a girdle. Single and double clusters of ice c-axes can form due to simple shear [20]. Single cluster can also form due to uniaxial compression (e.g., [21]). Girdles have been interpreted as due to uniaxial extension [22]. The ice CPOs are often reorganized by kinematic changes, such as the progressive development of folds, shear zones, and an increased depth of burial (confining pressure) [21,22,23,24,25]; however, studies related to the CPO evolution are limited, especially for natural ice.
Single-maxima clusters are observed in uniaxial compression laboratory experiments only at low temperatures and/or fast strain rates [17,26]. The vast majority of laboratory experiments give an open cone (small circle) CPO in uniaxial compression. Laboratory experiments have shown that a transition from an open cone to a single cluster of c-axes [26,27,28] with increasing stress, decreasing temperature, and increasing strain. This has been interpreted as an increase in pyramidal slip systems by Piazolo et al. [27] and to a change in balance between lattice rotation and grain boundary migration recrystallization by Qi et al. [28]. A series of simple shear experiments have reported a transition of double cluster to single clustered c-axes with increasing strain, and have documented different patterns of evolution with strain dependent upon deformation temperature [29,30,31]. The transition in the CPOs of natural ice is often ascribed to environmental variables, such as the concentration of air bubbles, layers of volcanic tephra, snow accumulation rates, and the structures of bedrock [32,33,34]. Although recent experimental studies have reported stress and temperature as prevailing factors that lead to the formation CPOs of ice [28,29], microstructural evolution of natural ice, which occurs at lower strain rates, and proceeds to higher strain than experiments, probably involves further complexities that are not adequately understood.
In this study, we report a microstructural evolution of ice in cores drilled from the Styx Glacier in northern Victoria Land, Antarctica, which is a renowned site for snow accumulation. The slow ice flow allows for a high probability of the development of diverse stress regimes. We describe the deformation behavior of the ice with increasing depth based on calculations of physical properties and careful investigations of CPOs using electron backscatter diffraction (EBSD) in a scanning electron microscope. We also compare the deformation features of the sample to conventional ice flow models, which is followed by a discussion of glaciological implications.
2. Materials and Methods
2.1. Geological Outline and Sample Descriptions
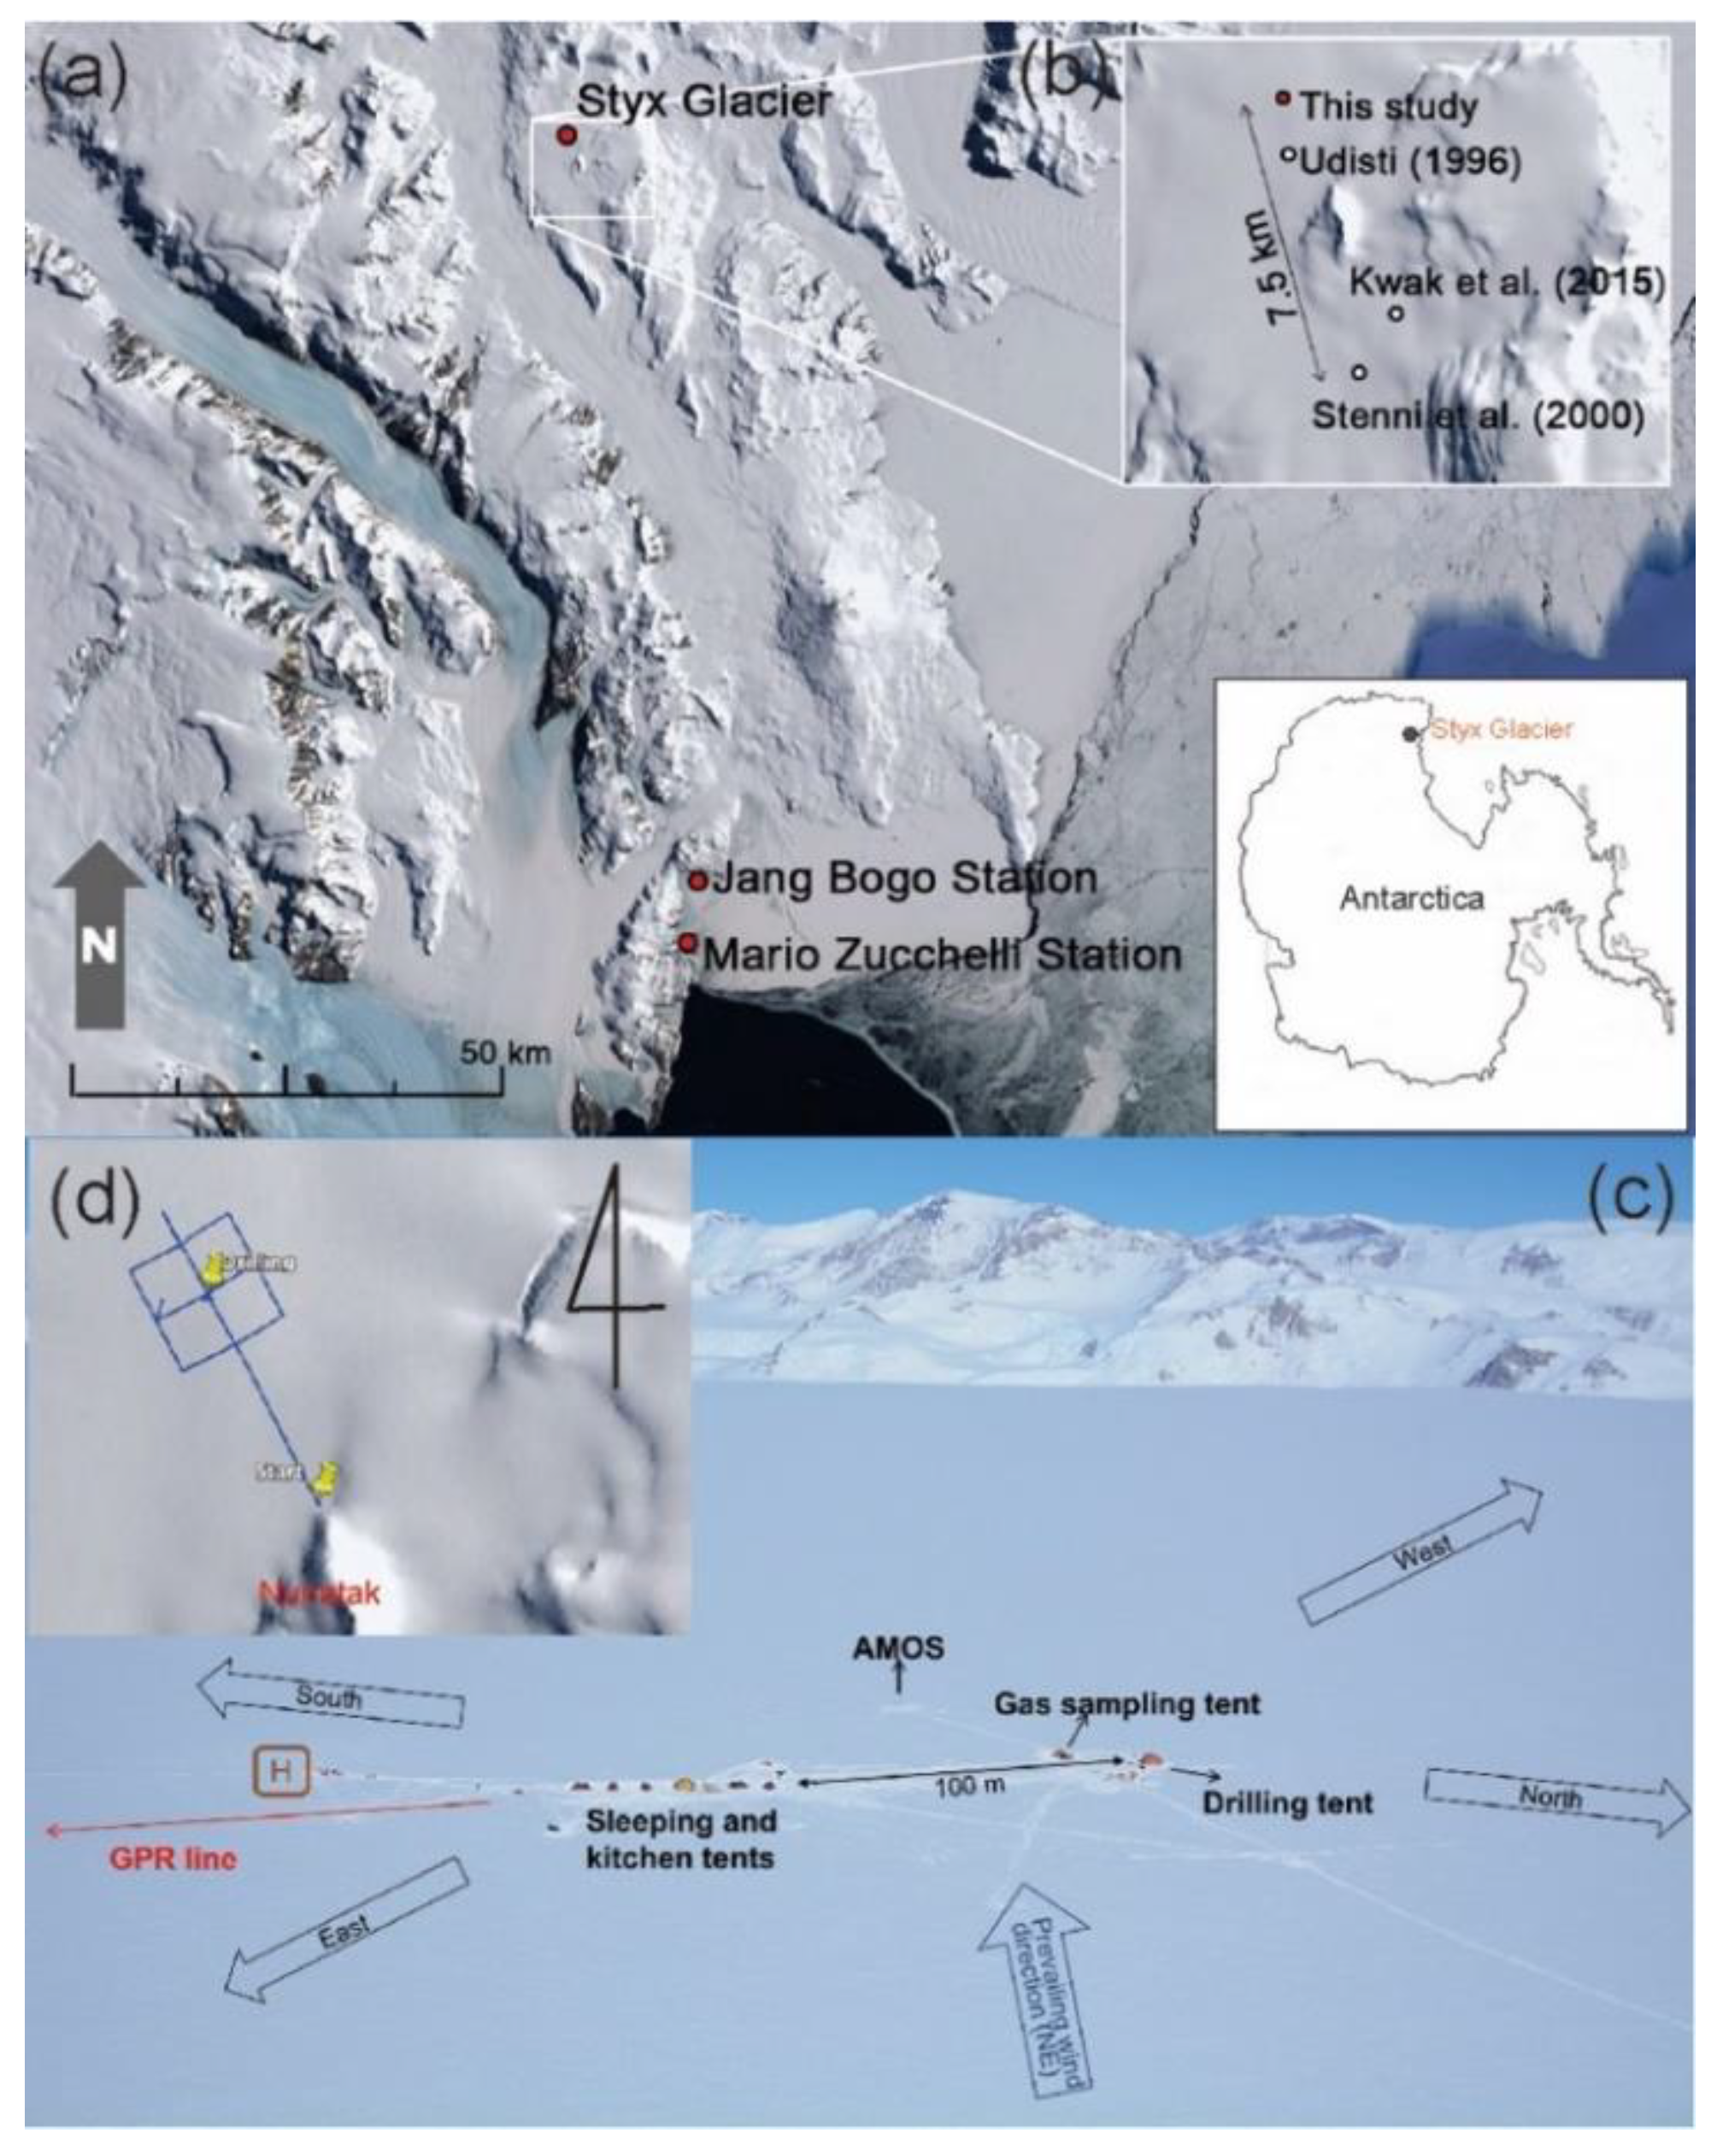
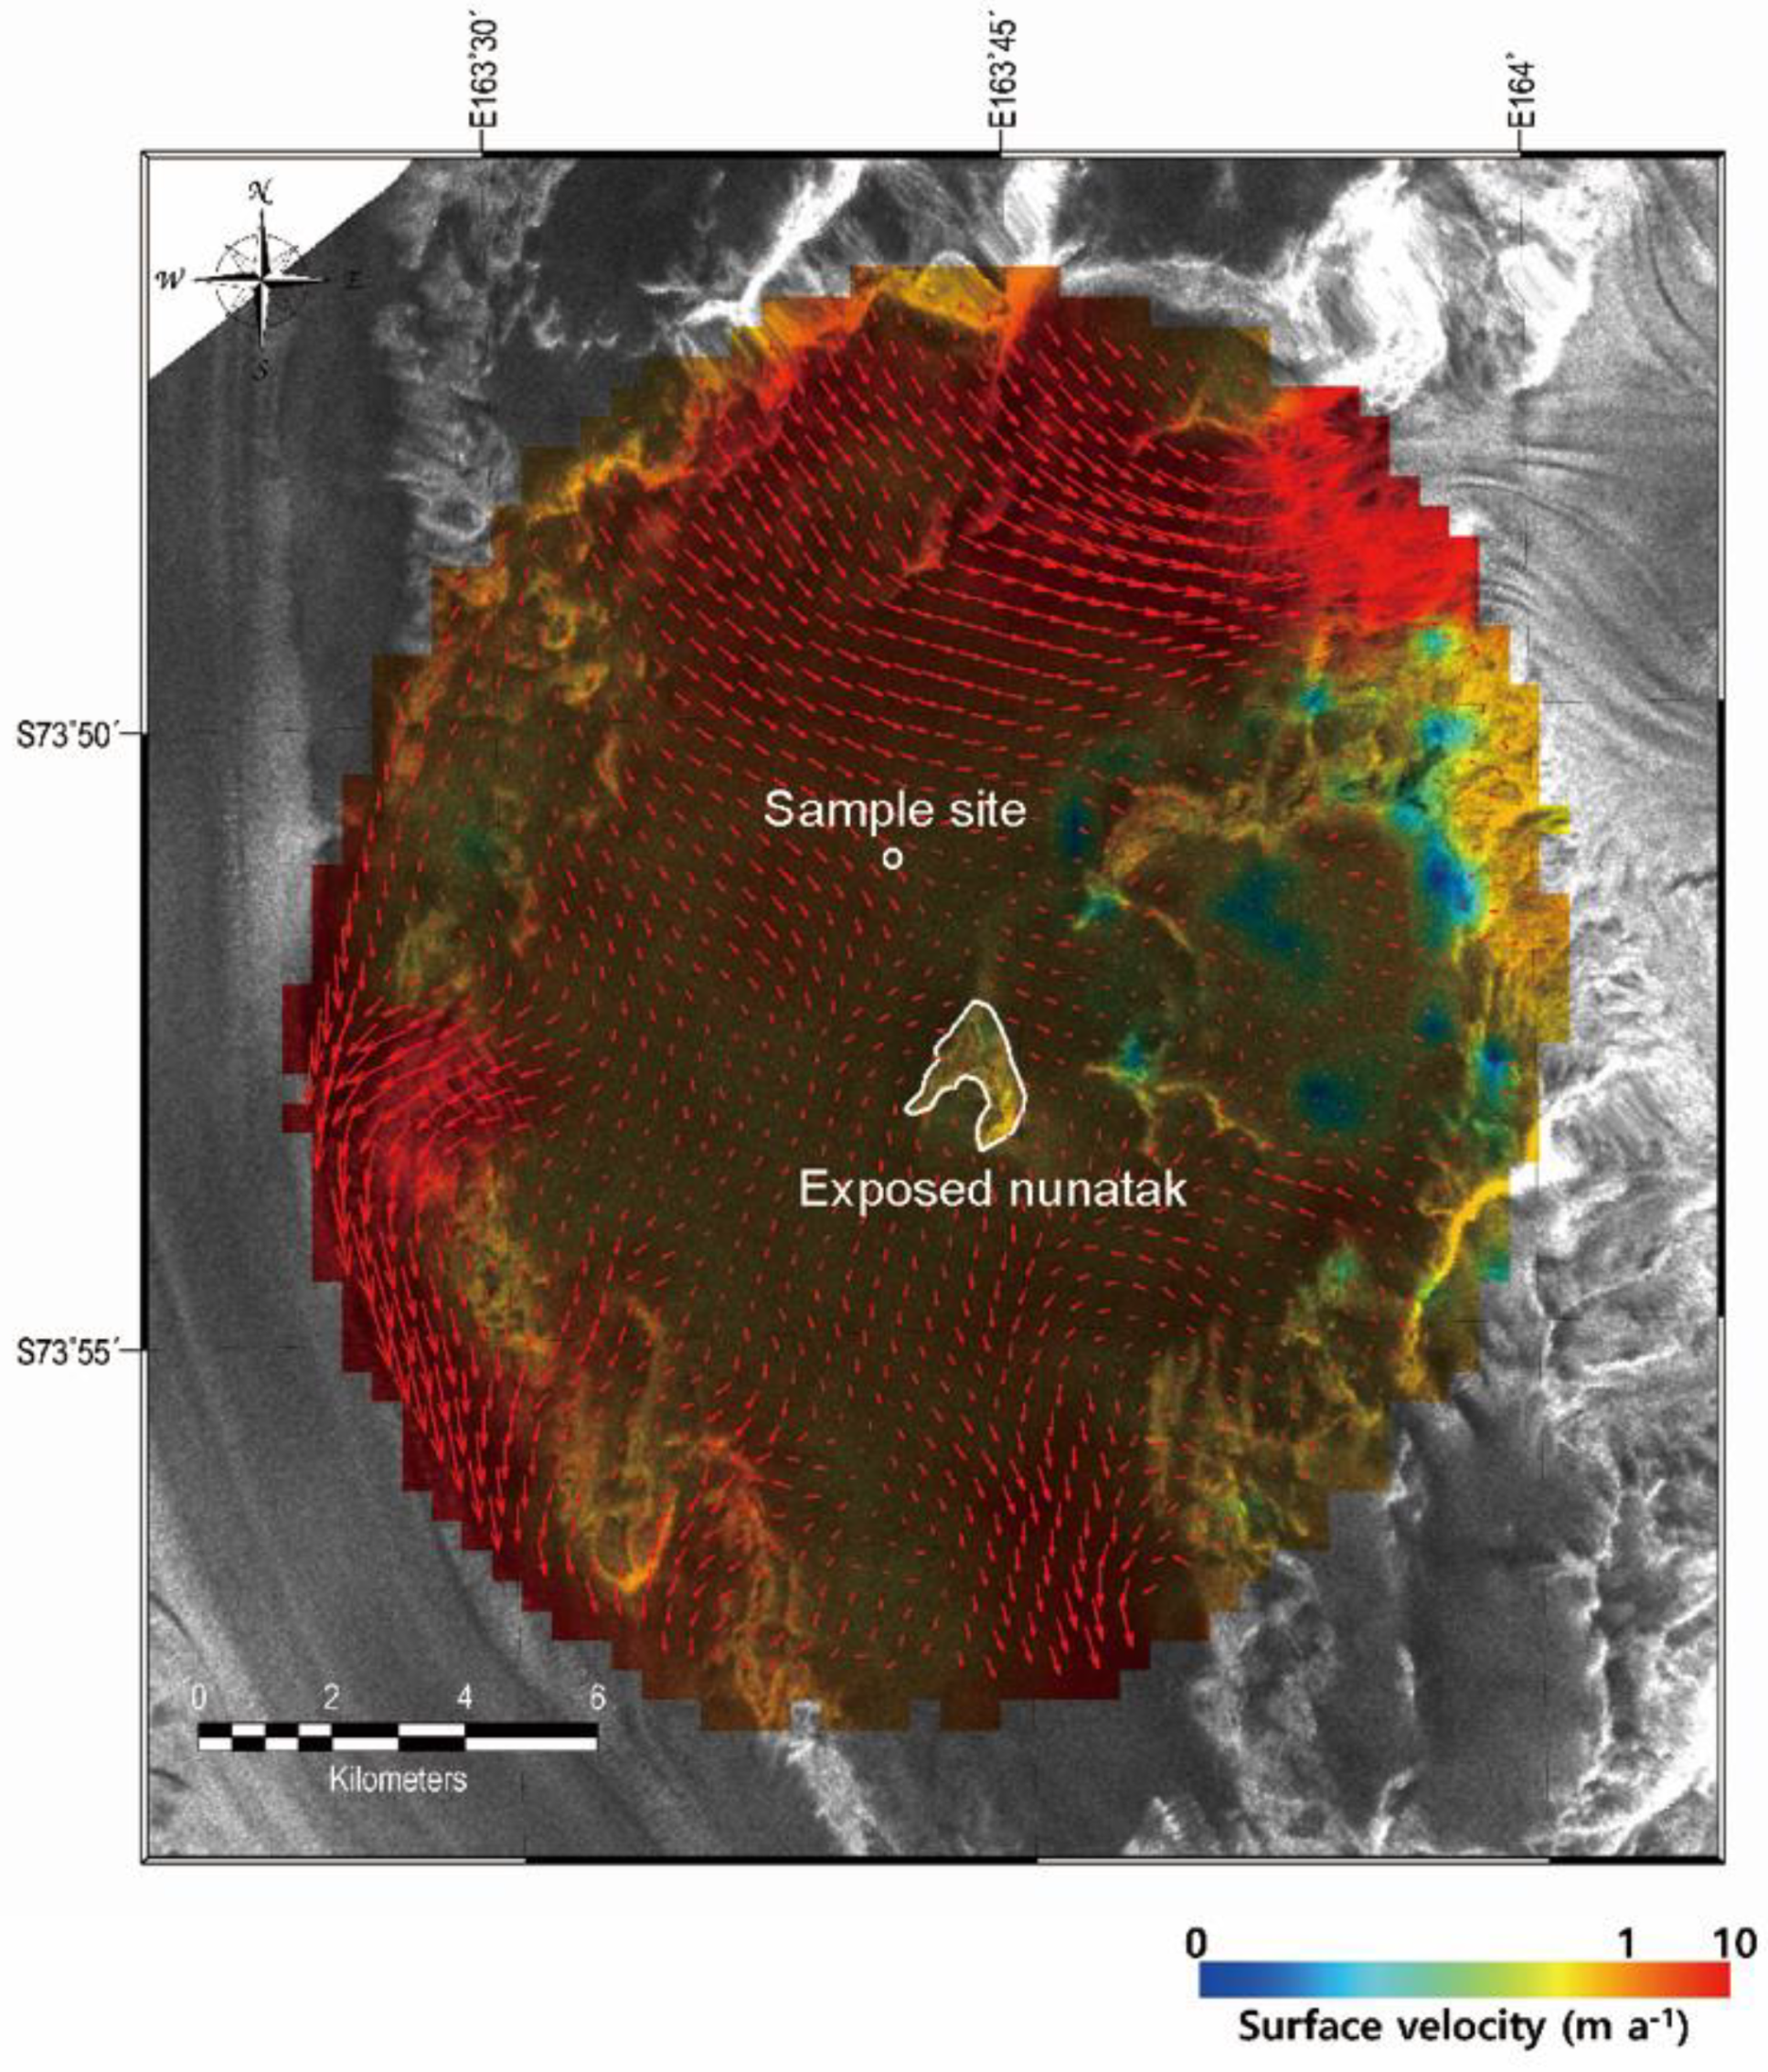
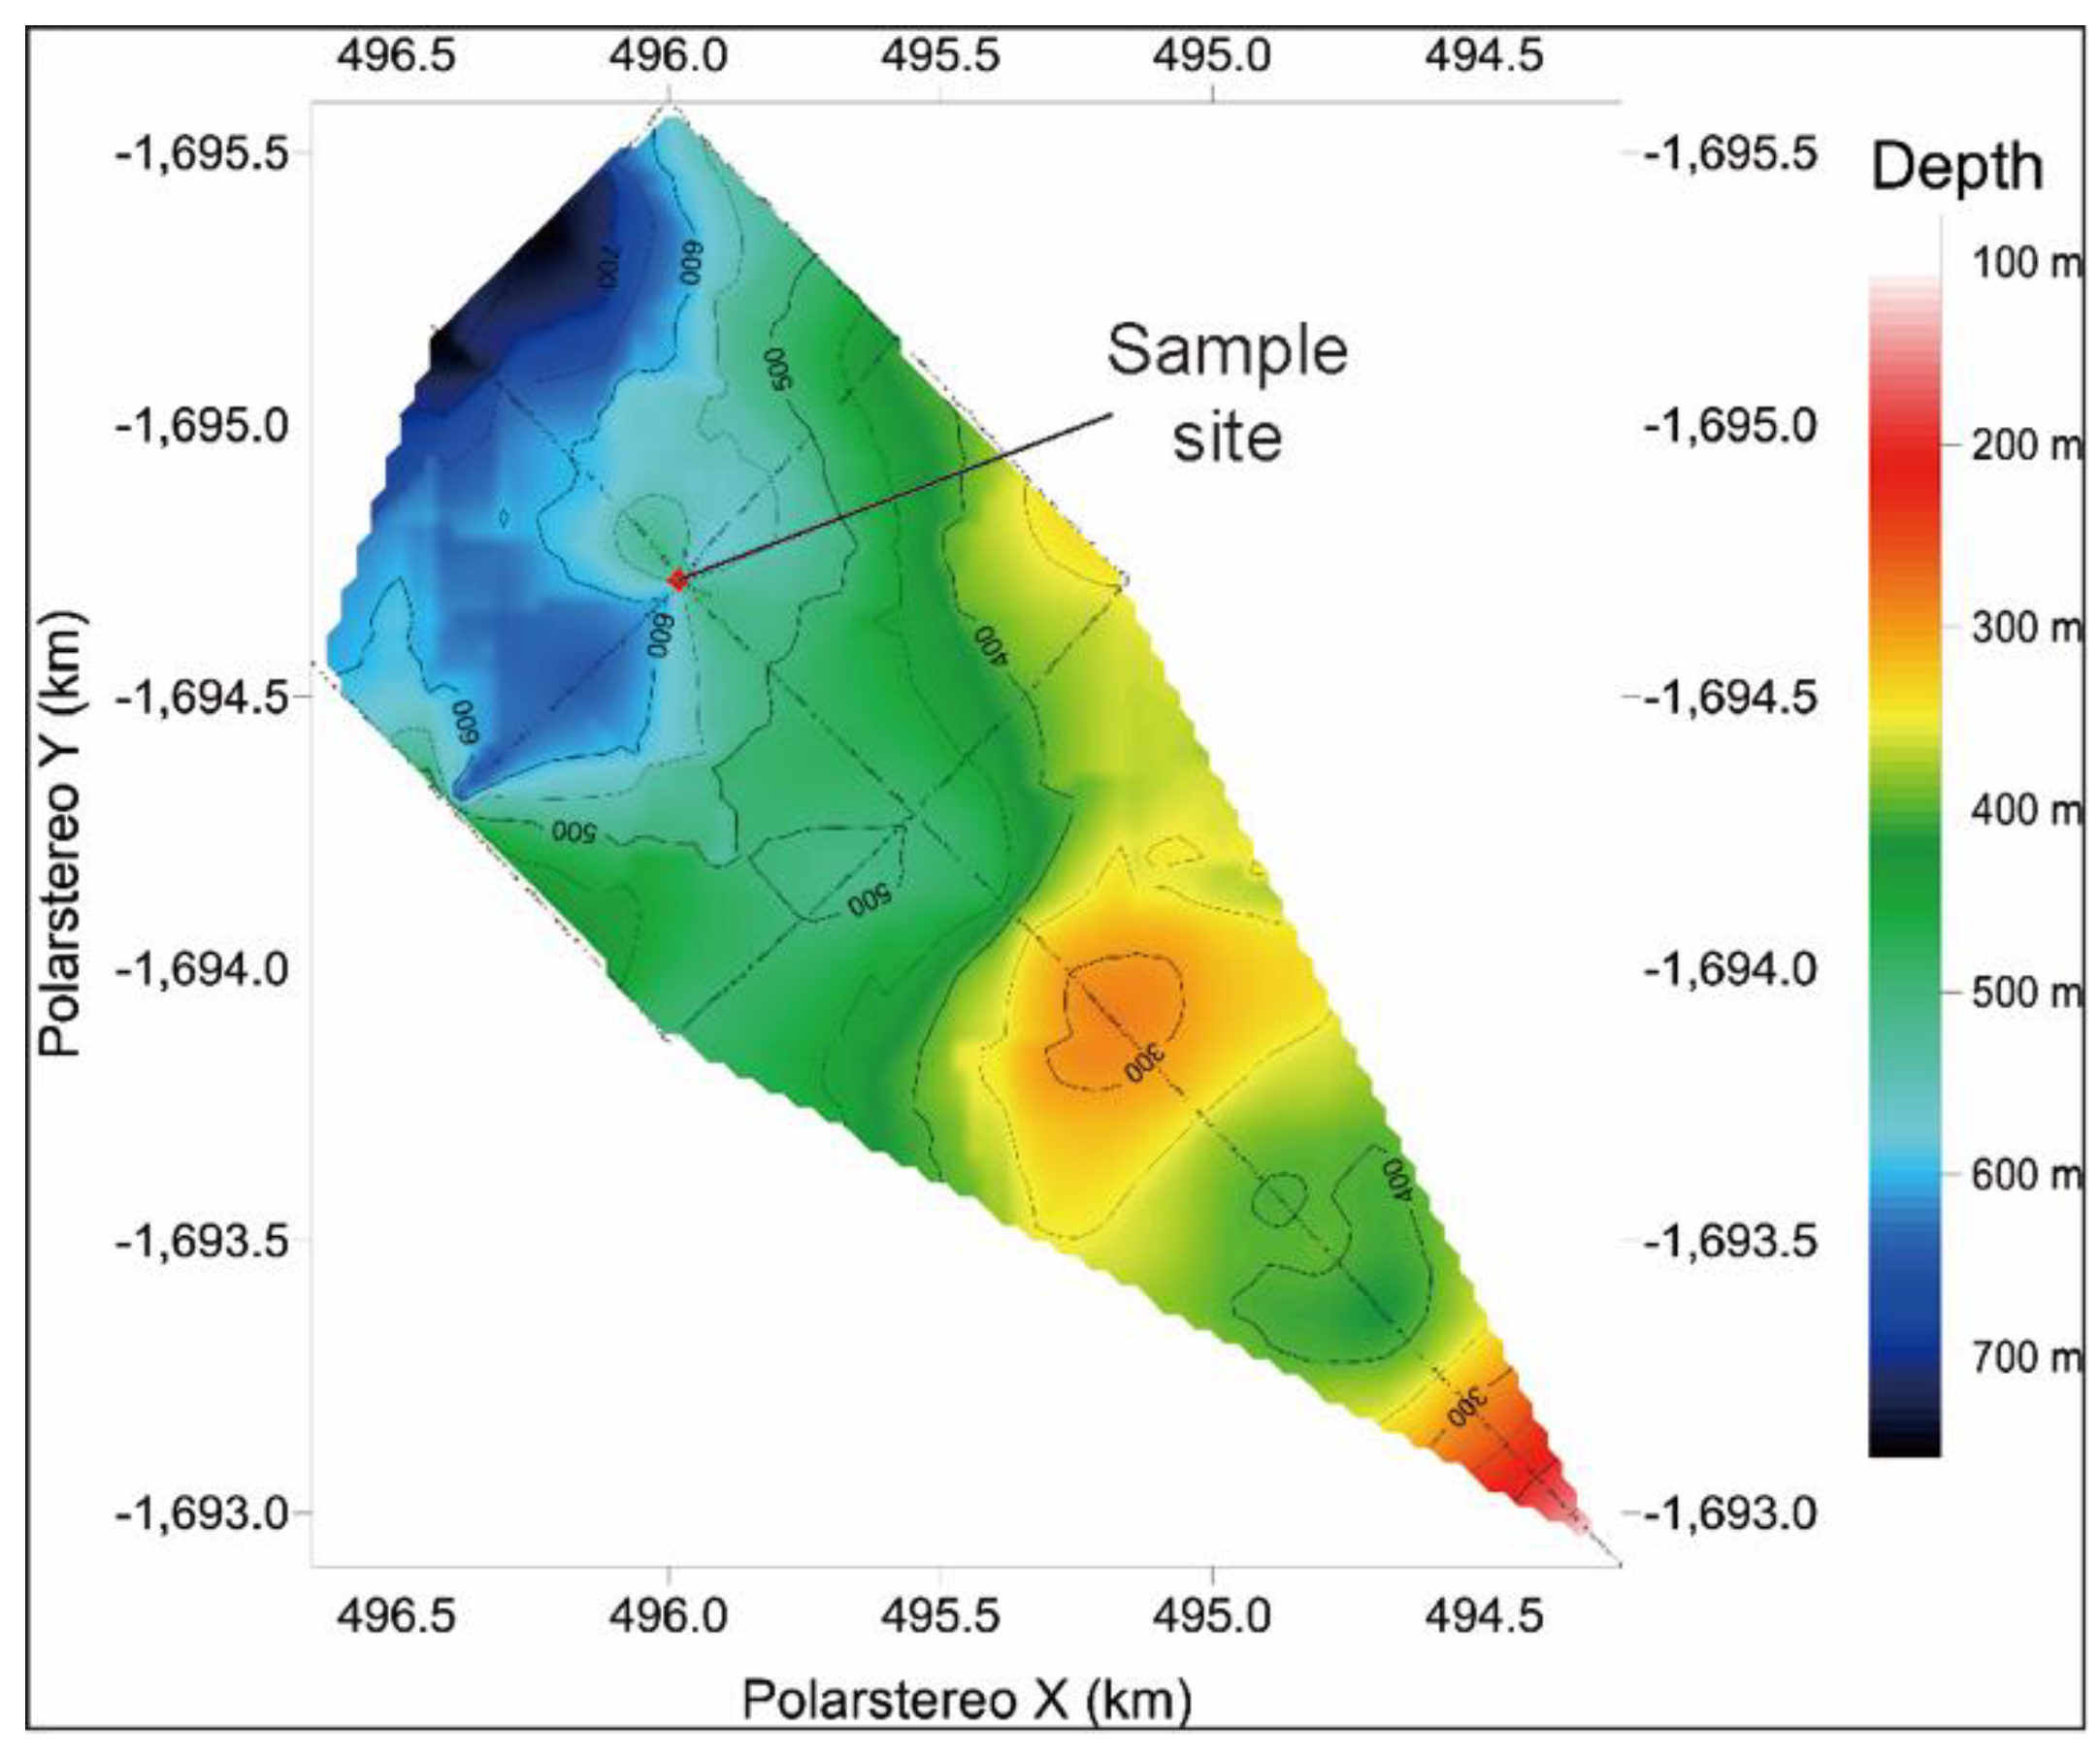
The Styx Glacier in northern Victoria Land lies along the western margin of the Ross Sea (Figure 1) and is a renowned site for snow accumulation that is minimally influenced by katabatic winds. Hence, several ice cores have been retrieved from the Styx Glacier in recent decades [35,36,37,38]. The Styx Glacier consists of a flat surface with a relief of <100 m over a total area of >100 km2. The velocity of its ice surface is ca. 2.3 m yr−1 [39], which was measured from multiple satellite (Sentinel-1) synthetic aperture radar interferometry data (InSAR) (Figure 2). As a part of the Korean Antarctic Research Program based at the Jang Bogo Station, a drilling program led by the Korea Polar Research Institute, was conducted at the Styx Glacier to obtain an ice core that developed during the past 2 kyr [40]. An ice core with a total depth of 210.5 m was collected from the Styx Glacier at 73°51.10′ S, 163°41.22′ E, at an elevation of 1623 m, during the 2014–2015 austral summer season. The ice base at the sample site was determined to be at 550 m depth by a ground-penetrating radar (GPR) investigation [41]. Bedrock signals in the GPR data confirmed the existence of a nunatak, located ~4 km southeast (SE) of the sample site. The presence of the nunatak is consistent with the reduction in ice flow velocity and divergent change of the ice flow direction, observed from the satellite data (Figure 2 and Figure 3), as ice flows past the site in the south-southeast (SSE) direction.
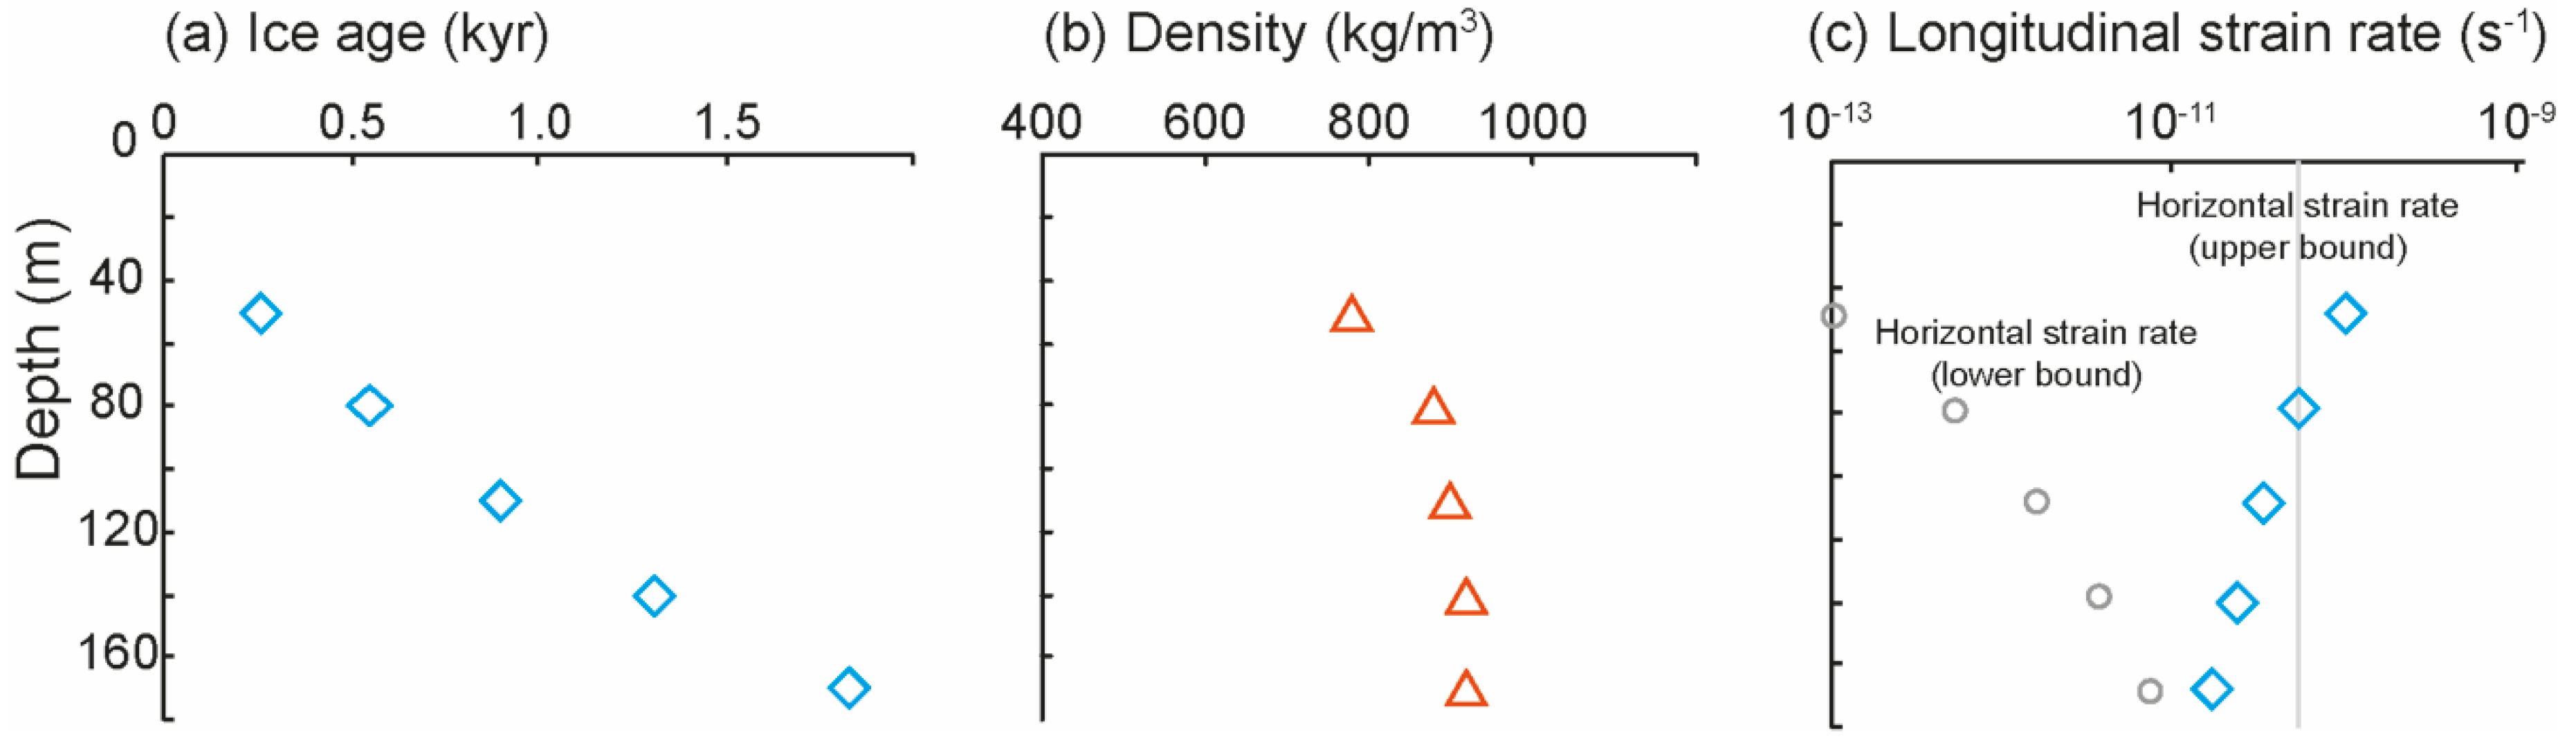
Due to low densities at <40 m and rich in cracks at >180 m depth, samples of the ice core were selected from depths of about 50, 80, 110, 140, and 170 m, labeled as SG_50, _80, _110, _140, and _170, respectively [40]. The samples were stored at ca. –25 °C for preserving the fabric (e.g., [42]). Characteristics of the cores are summarized in Table 1. The ages were estimated to be 0.26 to 1.83 kyr, based on a combined approach of an empirical firn densification model [43] and the CH4 gas age with the correction for the difference between the gas and ice ages of ~0.3 kyr [44]; densities ranged from 780 to 920 kg/m3 (Figure 4a,b). The borehole temperature, measured 2 y after the drilling, was –31.7 °C at a depth of 15 m and −28.3 °C at the base of the hole (210 m). A model calculation reported a mean annual temperature of −32.5 °C, and a basal temperature of −20.5 °C at 550 m [44]. Snow accumulation rate is reported as 203 kg m−2 yr−1 [38].
Vertical longitudinal strain rates can be estimated by assuming that finite longitudinal strain is accommodated by density increase from the surface. The strain rate separating the sample and the surface is calculated by dividing the natural log of the change in ice density (Δ ρice) by the age of the sample, with shortening being positive. The age is derived from the depth-age scale [44] (Table 1). Initial density of 350 kg/m3 was assumed at the surface. Finite longitudinal strain increases to 0.97 at 170 m depth. Longitudinal strain rate decreases from 10−10 s−1 at shallow depths to 2 × 10⁻¹¹ s−1 at 170 m depth (Figure 4c). An upper bound horizontal shear strain rate is estimated by assuming a linear decrease in velocity from the surface to the base of the ice: a horizontal shear strain rate of ~10−10 has been calculated by dividing the ice flow velocity, 2.3 m year−1, by thickness, 550 m (Table 1). A lower bound shear strain rate estimate was made by assuming the driving force for horizontal shear strain is at a maximum at the base of the glacier (550 m) and reduces linearly to zero at the surface. Shear strain rate at any depth is proportional to depth to the power of n, where n is the stress exponent in the flow law. Using this relationship and the fact that the average of shear strain rates for all depths must correspond to the average shear strain rate averaged across the entire ice thickness (2.3 m yr−1/550 m) allows the shear strain rate and shear strain at any given depth to be calculated. A similar approach can be used to account for the warmer temperatures at the base of the glacier using Q = 60 kJmol−1. Using an n value of 3 (appropriate for low strains), lower bound horizontal shear strain rate increases from 10−13 at 50 m to 7 × 10⁻¹² at 170 m depth (Table 1).
Figure 1.
Maps of the drilling site, modified from Han et al. [40]. (a) The Styx Glacier in northern Victoria Land lies along the western margin of the Ross Sea. The sample locations of Udisti [45], Stenni et al. [38] and Kwak et al. [36] in (b) are marked for comparison. (c) The site where samples were collected, showing the various tents during the 2014–2015 summer expedition. GPR: ground-penetrating radar; AMOS: automatic meteorological observation system. (d) Investigation lines for ground penetrating radar (GPR). Details of the measurements and results will be presented in Figure 3.

Figure 2.
Ice surface velocity and flow direction (red arrows) around the drilling site, derived from satellite radar interferometry data [39]. The background is Sentinel-1 synthetic aperture radar image acquired on 17 June 2017.
Figure 2.
Ice surface velocity and flow direction (red arrows) around the drilling site, derived from satellite radar interferometry data [39]. The background is Sentinel-1 synthetic aperture radar image acquired on 17 June 2017.

Figure 3.
Ground-penetrating radar (GPR) data plotted using the program Surfer. The GPR data were acquired using a MALÅ Rough Terrain Antenna (RTA) system. The control unit linked to global positioning system (GPS) receiver measured signals with 25 MHz center frequency, 4.4 m transmitter-receiver separation, 1 trace s−1 record, 13,000 ns time window, and 8 stacks. The raw data were post-processed by background removal, gain, and Kirchhoff migration using the program Reflexw. The radio wave velocity was employed as 0.20 m ns−1 for snow (0–20 m depth), 0.19 m ns−1 for firn (20–50 m depth), and 0.17 m ns−1 for ice (>50 m depth) [46].

Figure 4.
Plots of (a) ice age, (b) density, and (c) longitudinal strain rate as a factor of increasing depth. (a) The ice age of the core was derived from Yang et al. [44]. (b) Density is computed from the measured weight of the core divided by volume. (c) Longitudinal strain rate is calculated from density divided by time. Upper and lower bound horizontal strain rates are presented as a grey line.

2.2. Analytical Methods
The microstructural features of rocks are usually observed in sections cut perpendicular to the foliation and parallel to the lineation (e.g., [47]). The foliation (bedding) of ice, in this setting, can be considered as the plane parallel to the surface, which forms due to the annual snow accumulation and densification during burial. Lineation cannot usually be observed owing to the transparency of ice. Azimuthal orientations are not normally preserved in rotary coring and for this study we cut an arbitrary vertical (normal to foliation) observation plane. The samples were cut by a ring blade (a circular saw) in a cold room at −15 to −20 °C, and mounted on a copper ingot at ~5 °C, thus, producing a bond between the sample and the ingot by melting and re-freezing a thin layer. As soon as a bond was formed, the ingot and the sample were cooled rapidly. To strengthen the bond, water droplets at 0 °C were added into the holes at the back of the ingot which froze onto the bottom of the sample. We used a microtome to cut the samples to thickness of ~1 cm in a freezer at −15 to −20 °C. The final polishing was achieved by using sandpaper (1500 mesh) attached to a polishing plate sit 1–2 cm above liquid nitrogen at the base of a polystyrene box, so that the plate was about −20 to −30 °C (for further details, see [48]).
To study the microstructures of ice, high-quality crystallographic orientation maps were acquired by indexing the Kikuchi bands (diffraction patterns) using an Oxford Instruments EBSD camera on a Zeiss Sigma variable-pressure, field-emission, scanning electron microscope (FE–SEM), housed at the University of Otago, Dunedin, New Zealand. Each polished sample (ca. 30 × 45 mm) was transferred through a nitrogen-filled glove box into the SEM to minimize condensation. After the sample was inserted to the cold stage in the SEM chamber at ≤−80 °C, the chamber was evacuated to a high vacuum and the sample was cooled to ≤−100 °C. A sublimation process was then carried out by bringing the chamber pressure to the atmospheric pressure and warming the sample to approximately −80 °C to remove frost and flatten the surface of the sample, and then the chamber was evacuated again to a high vacuum and the sample was cooled again to less than −100 °C. The orientation maps were generated with an accelerating voltage of 30 kV, a working distance of ~20 mm, a beam current of ~10 nA, and a step size of 30–50 µm with ~10 Pa nitrogen gas pressure to prevent charging (for further details of the process, see [48]). The raw data thus obtained, were processed using the software Channel 5 and the MATLAB-based toolbox MTEX [49]. Contoured pole figures of [0001], <11–20> and <10–10> were generated from all indexed pixels using MTEX. The J- and M-indices were determined [50,51,52] as measure of fabric strength using MTEX. Eigenvalues for calculating shape factor, K, were computed using the MTEX [53].
3. Results
All results from our microstructural analyses are summarized in Table 2. As illustrated in Figure 4, the age and density of the ice increases, and the longitudinal strain rate decreases with increasing depth. In this section, we describe the microstructures, CPOs, and related data.
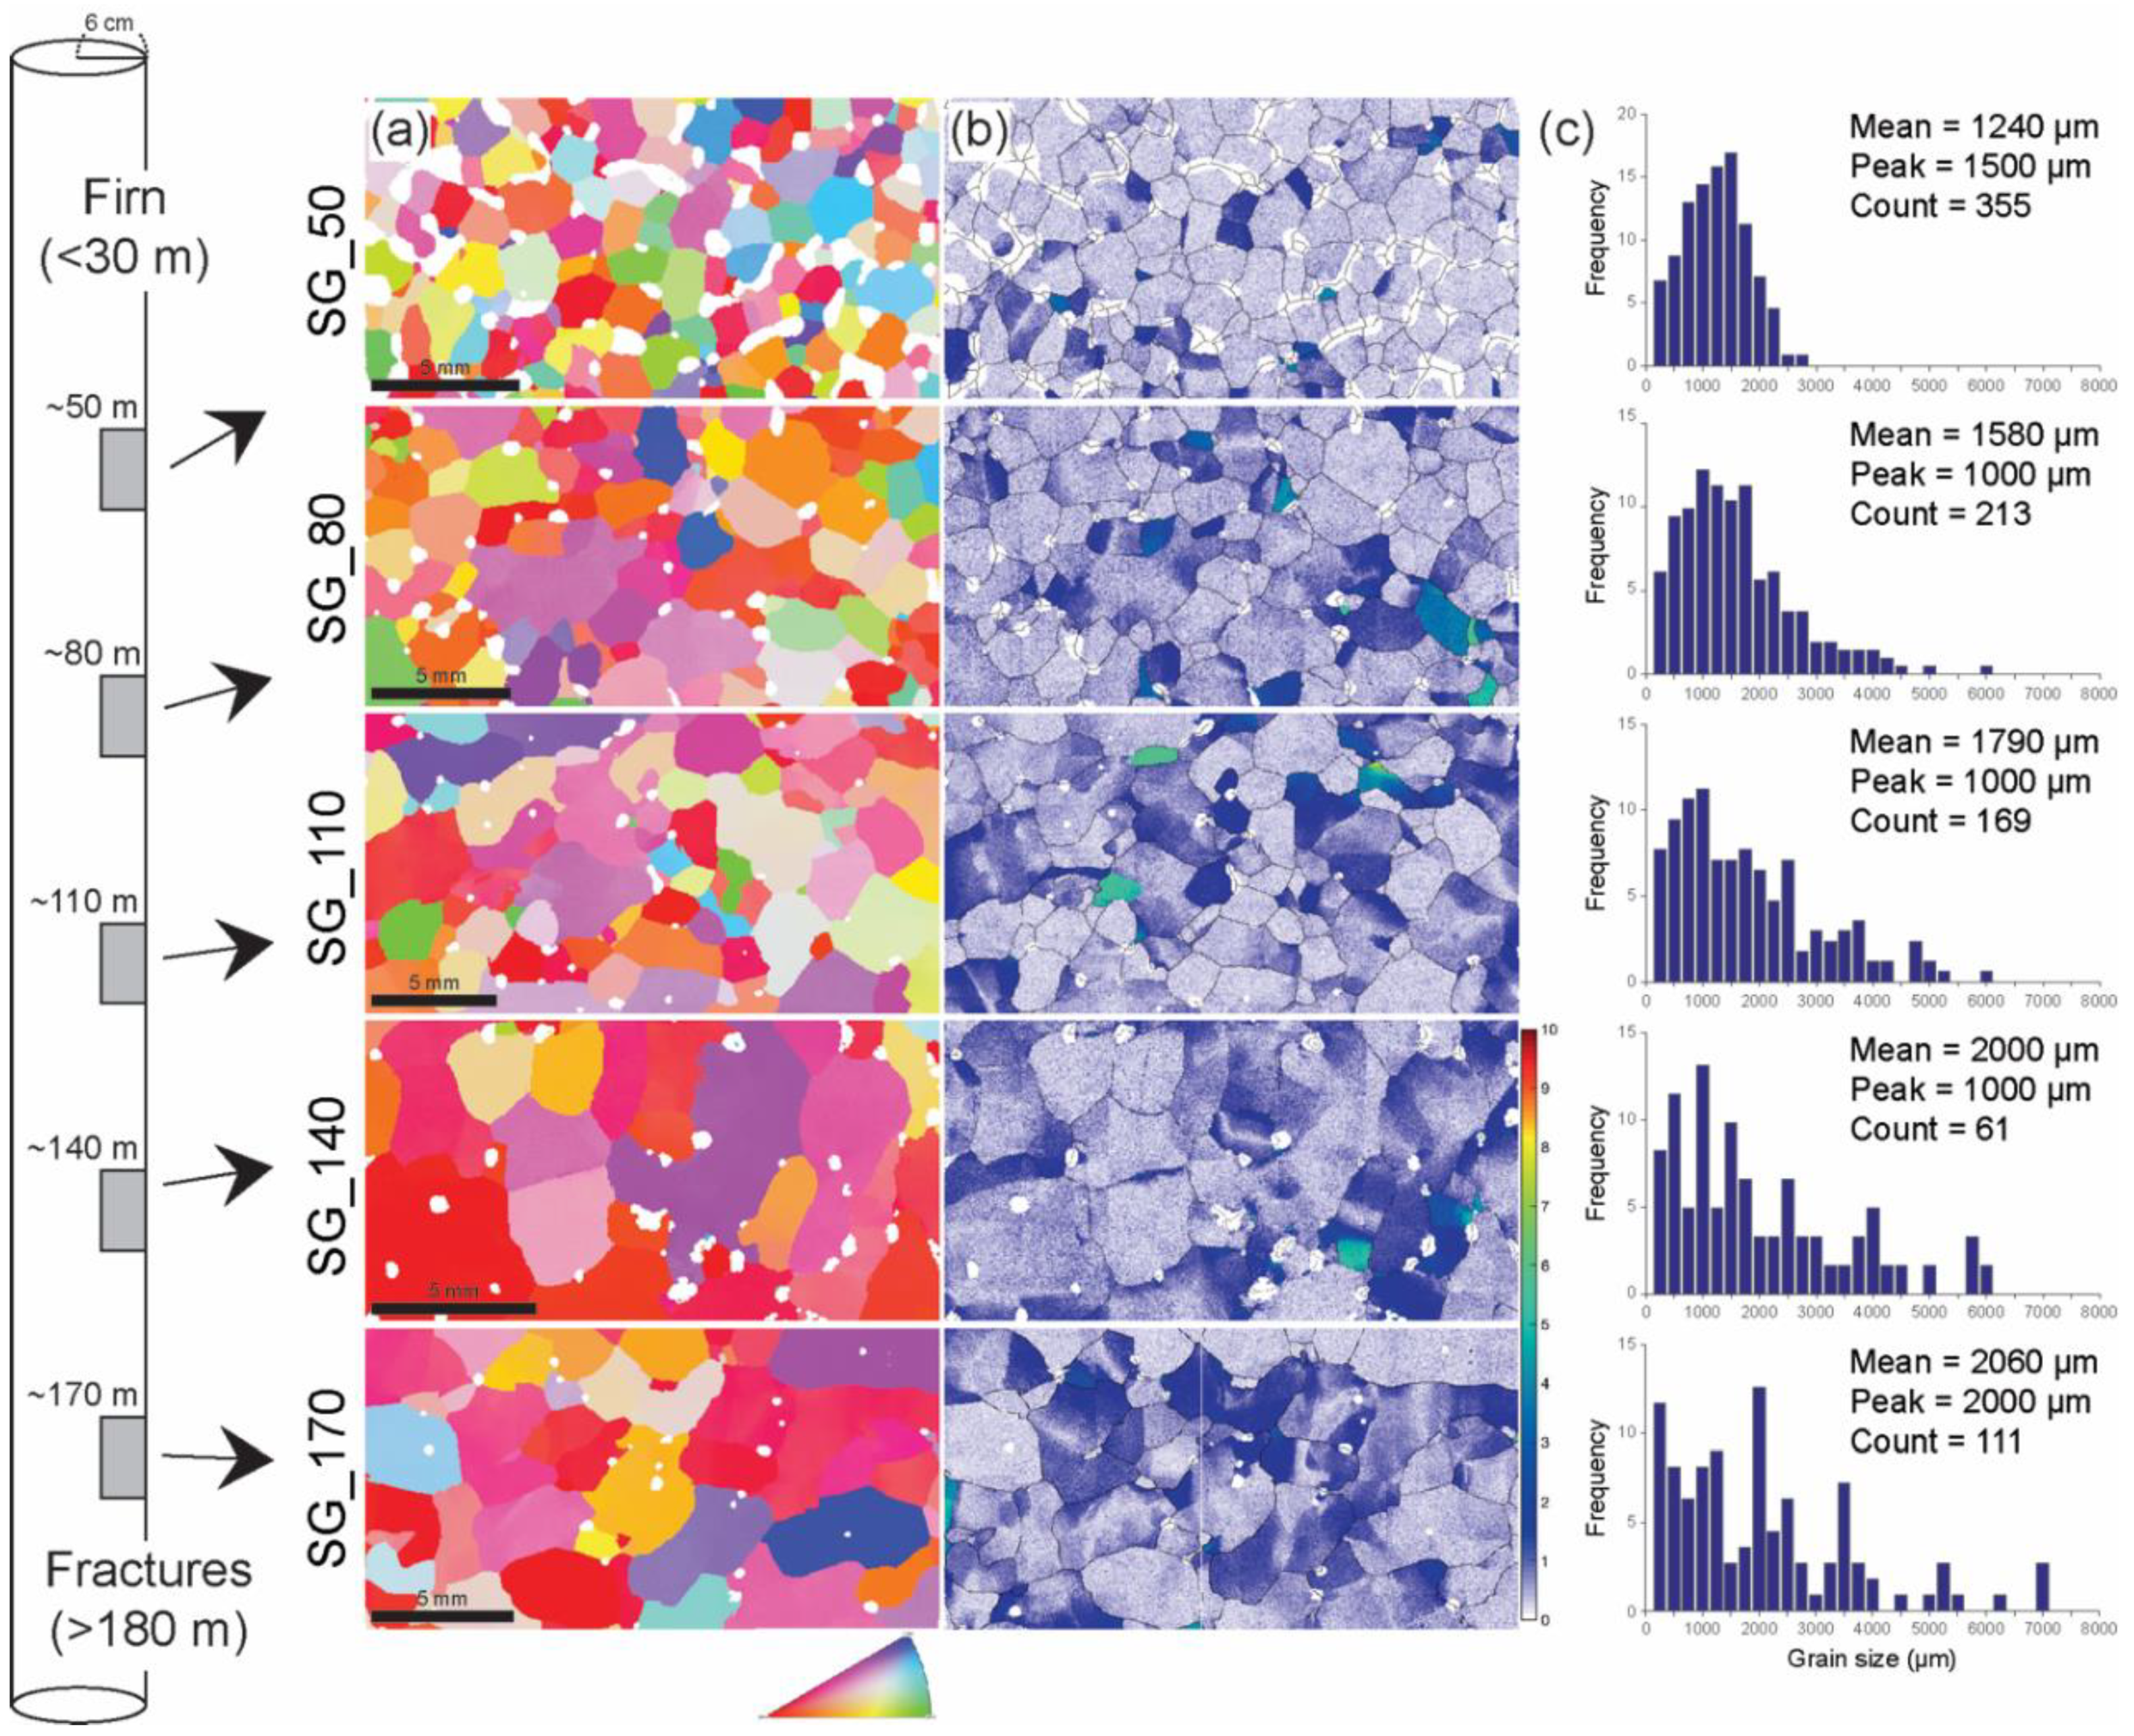
The high-quality EBSD maps, figures for misorientation between each pixel and the mean orientation of the parent grain (mis2mean), and the grain-size distributions are displayed in Figure 5a–c, respectively, for intracrystalline and intercrystalline deformation features. Analyzed sections have different arbitrary azimuthal orientations as azimuthal information was lost in coring. Sample SG_50 contains a large number of air bubbles. The ice crystals in this sample are characterized by relatively small and uniform grain size, equigranular shapes, and straight grain boundaries (Figure 5a,b). Samples from greater depths have; a lower fraction of bubbles, larger grain size, larger variations in grain size, and more angular and irregular grain boundaries. The figures for mis2mean indicate that a few areas with high misorientations are distributed along the grain boundaries, particularly near the triple junctions (Figure 5b). Mean grain size increases with depth and the peak distribution ranged between 1000–2000 µm (Figure 5c). Grain size at the peak frequency of the distribution is about 1.5 mm at 50 m and decreases to ~1 mm at 80 and 110 m.
The crystallographic orientations are shown in a reference frame where the vertical is in the center of the stereonets and the data are rotated around the vertical axis so that the a-axis maxima lie in the east–west (E–W) direction. This approach facilitated a better comparison of data from different depths, but the reader is reminded that the azimuthal orientation is arbitrary (the direction of the a-axis maxima is unknown). The c-axes become more concentrated with increasing depths (Figure 6a). The CPOs are characterized by a vertical cluster of c-axes with weak secondary maxima at ≤110 m. The strong cluster of c-axes lies within a broad vertical girdle at depths ≥140 m (Figure 6b). The girdle is partial at 140 m and almost complete at 170 m. The vertical girdle of c-axes lies perpendicular to the a-axis maxima. The a-axes and poles to m-planes lie sub-horizontally. Weaker a-axis sub-maxima lie at ±60 degrees to the main maximum (normal to c-axis girdle). Maxima in the poles to m-planes lie at ±30 degrees and at 90 degrees to the a-axis maxima: those at ±30 degrees are strongest.
The J- and M-indices, mean grain size and the shape factor, K, of each sample are displayed in Figure 7. Fabric indices (J = 1.46–2.11 and M = 0.04–0.09) are weak at depths ≤110 m, remarkably high at the depth of 140 m (J = 5.08 and M = 0.30), and decrease again at 170 m (J = 4.25 and M = 0.23) (Figure 7a and Table 2). Mean grain size and standard deviation increase slightly, corresponding to increasing density, with increasing depth (Figure 7b and Table 2). The shape factor, K, computed from eigenvalues of the c-axis distribution [53] provides quantitative identification of c-axes being more clustered at 50–110 m depth and more girdle-like at 140–170 m.
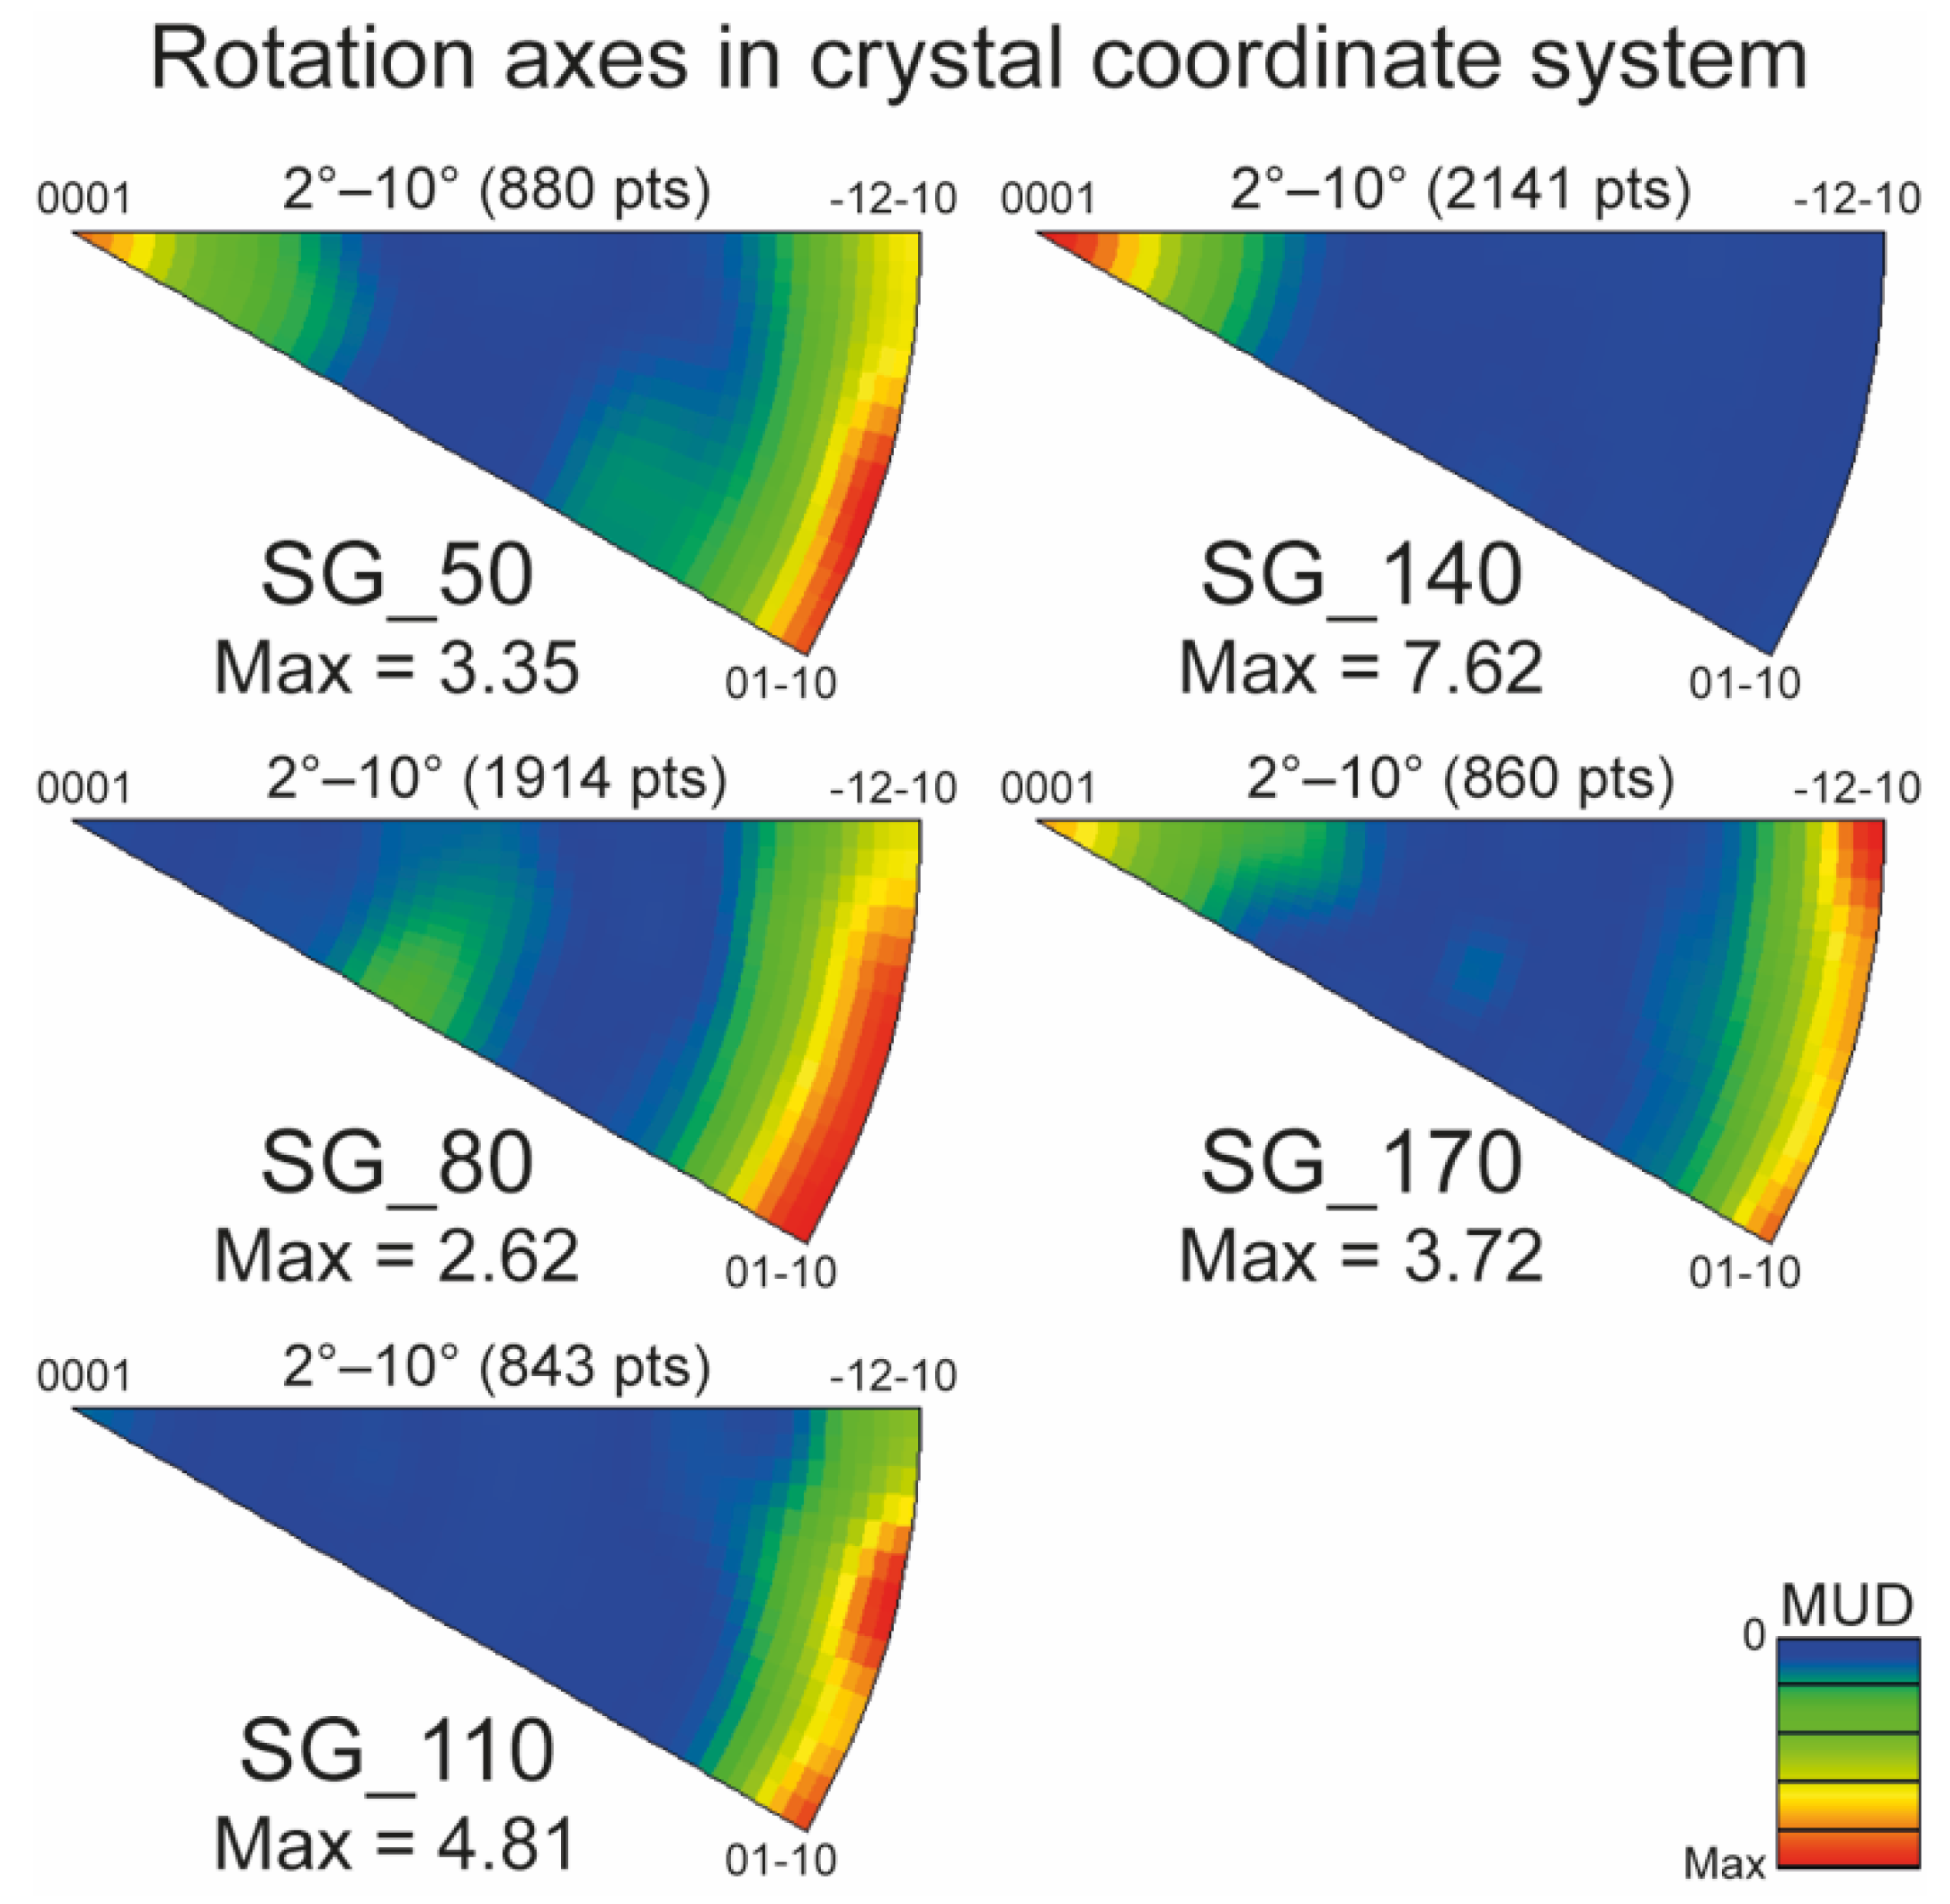
Rotation axes (misorientation axes) of low-angle boundaries (2°–10°) in our samples were analyzed in inverse pole figures (Figure 8). The rotation axes of ice were found to be generally distributed along the basal plane, and/or parallel to c-axes. Strong intensity parallel to the c-axes is activated strongly at 140 m, and more weakly at 50 and 170 m, while intensity along the basal plane is clear in most samples, except the sample from 140 m.
4. Discussion
4.1. Stress Regimes and CPO Development
Deformation features can be identified from intracrystalline microstructures, such as the CPOs (e.g., [54,55,56,57]). (Table 1). In terms of density, sample SG_50 is classified as firn–ice transition, and the other samples are defined as ice [58,59]. Deformation temperatures between −29.1 to −31.2 °C estimated from the measurements of the bore hole, are colder than the vast majority of published deformation experiments for which CPO and microstructural data have been presented, but are at a similar temperature to −30 °C experiments presented by [17,26,29].
The CPOs of natural ice could be attributed to both vertical shortening and horizontal shear. The upper bounds of the estimated rate of horizontal shear is equivalent or greater than the calculated rate of finite longitudinal shortening at 80–170 m (Table 1). Lower bound estimations of horizontal shear strain at 140–170 m (>0.05) could induce a strong CPO [60]. The weak central cluster with or without multiple maxima of c-axes and weak fabric strengths (Figure 6 and Figure 7a) at depths of ≤110 m, can be ascribed to low strains [20,60,61,62,63]. Higher longitudinal strain rate than horizontal shear strain rate at 50 m suggests that the single cluster of c-axes is related with the vertical compression under firn-ice transition condition (Figure 4c) [18]. The single cluster with multiple maxima of ice c-axes from 80–110 m can be attributed to a dominant activation of the horizontal shear, as estimated upper bound horizontal strain rates are higher than estimated vertical strain rates in all samples below the 50 m sample (Figure 4c). All samples have estimated shear strains that are significant, given that strong CPOs are well developed by shear strains of ~0.2 [29]. Similar CPOs have been reported as products of deformation due to recrystallization under a simple shear regime by numerical models [29,64]. Therefore, we infer that the CPOs formed at ≤110 m are influenced by both the finite longitudinal and horizontal shear regimes.
In contrast, the c-axes of deeper samples (≥140 m) show a strong cluster with weak maxima aligned vertically (a girdle) with an abrupt increase in fabric indices, followed by more girdle-like (K < 1) shape factors, and longitudinal strain rates that are about one to two orders of magnitude lower than the horizontal strain rates (Figure 4c, Figure 7a,c and Table 1). The girdle for c-axes is often ascribed to the development of a horizontal extension, based on the orientation of the vertical girdle that intersects the single cluster [19,22,23,65,66,67]. We suggest that horizontal extension may become important, probably in addition to vertical compression and horizontal shear. The strong alignment a-axis at 140–170 m depths may lend support for the horizontal extension origin of the girdle CPOs. Slip on basal planes to facilitate extension would lead to the slip direction aligning with extension direction. The lower J-index at 170 m rather than at 140 m, may be attributed to the ‘countervailing effect’ of the stronger girdle against the presence of a strong cluster or a small number of analyzed crystals at 140 m. The J- and M-indices are scalars and they become less useful for comparing CPO strengths when CPO symmetry changes. The occurrence of tephra at depths of 97.01, 99.18, and 165.37 m indicates that the change in CPO may be irrelevant with impurities in the ice [40].
4.2. Recrystallization Processes and Slip Systems
The flow of ice can be influenced significantly by microstructural changes, particularly those attributed to recrystallization by grain boundary migration (GBM) and/or by lattice rotation including associated recovery, polygonization, and subgrain rotation (e.g., [28,29,68]). Recrystallization by GBM is driven by reduction in the mean intragranular distortion of the polycrystals. GBM alone results in an increase in grain size as no new orientation (nuclei) are created. Recrystallization by lattice rotations is accompanied by a substantial reduction as defects and associated distortion become localized in subgrain boundaries greating cells that may evolve to become new grains (nuclei) [22,69].
Sample SG_50, representing the firn–ice transition [58,59], shows straight grain boundaries, a relatively uniform grain size, triple junctions of ~120°, weak fabrics, and a very weak single cluster of c-axes (Table 1, Figure 5 and Figure 6), which is typically regarded as a product of polygonization in shallower ice with compression [18]. Scarcity of small domains with a high misorientation suggests that the numerous air bubbles, in or near grain boundaries, may play an important role in generating fabrics at 50 m (Figure 5b). Between 80–110 m, the analyzed ice samples displayed a steady increase in grain size and fabric strength, and a minor change in grain shape (Figure 5a,b and Figure 7b). At depths between 110 m and 140 m, the ice samples exhibited an abrupt increase in fabric strength. This change corresponds to a more diverse grain size distribution (high standard deviation), and the appearance of lobate grain boundaries (Figure 5), thus indicating recrystallization involves GBM. Small domains with high misorientation, 120° triple junctions, and straight grain boundaries are distributed at all depths, suggesting the formation of new grains and the occurrence of recovery and subgrain rotation and recovery among the analyzed samples (Figure 5). The evidence suggests, therefore, that recrystallization at depths ≥140 m is dominated by GBM accompanied by recovery and subgrain rotation.
Analysis of low angle boundaries is often useful for delineating the dominant slip systems in ice (e.g., [64,70]). The rotation axes of the analyzed samples, shown in Figure 8, can be classified into two types: one parallel to the c-axes that is activated at the depths of 50, 140, and 170 m, and another along the basal plane that has been highlighted at all depths except at 140 m. Assuming that only the basal slip system is active, rotation axes parallel to the c-axis can be related to twist walls (screw dislocations) of the basal slip system, while rotation axes along the basal plane can be related to tilt walls (edge dislocations) of the basal slip system. Statistically significant data sets from experiments identify both of these rotation axes [26,71] and subgrain boundary trace analyses, and weighted burgers vector analyses [72] of these same samples (Sheng Fan, personal communication) indicate that the rotation axes in basal plane are clearly related to basal plane dislocations. Other studies have constrained the operation of non-basal dislocations in both experimental [73,74] and natural [70,75] ice and further work is needed to determine the contribution of non-basal dislocations in these samples.
There is clearly a change in misorientation axes between 110 and 140 m, corresponding to the change in CPO. Thus we infer that the changes in deformation kinematics that cause the change in CPOs is probably also responsible for the change in misorientation axes. Whether this in turn relates to a redistribution of slip from tilt walls to twist walls or a changing involvement of non-basal dislocations needs further analysis.
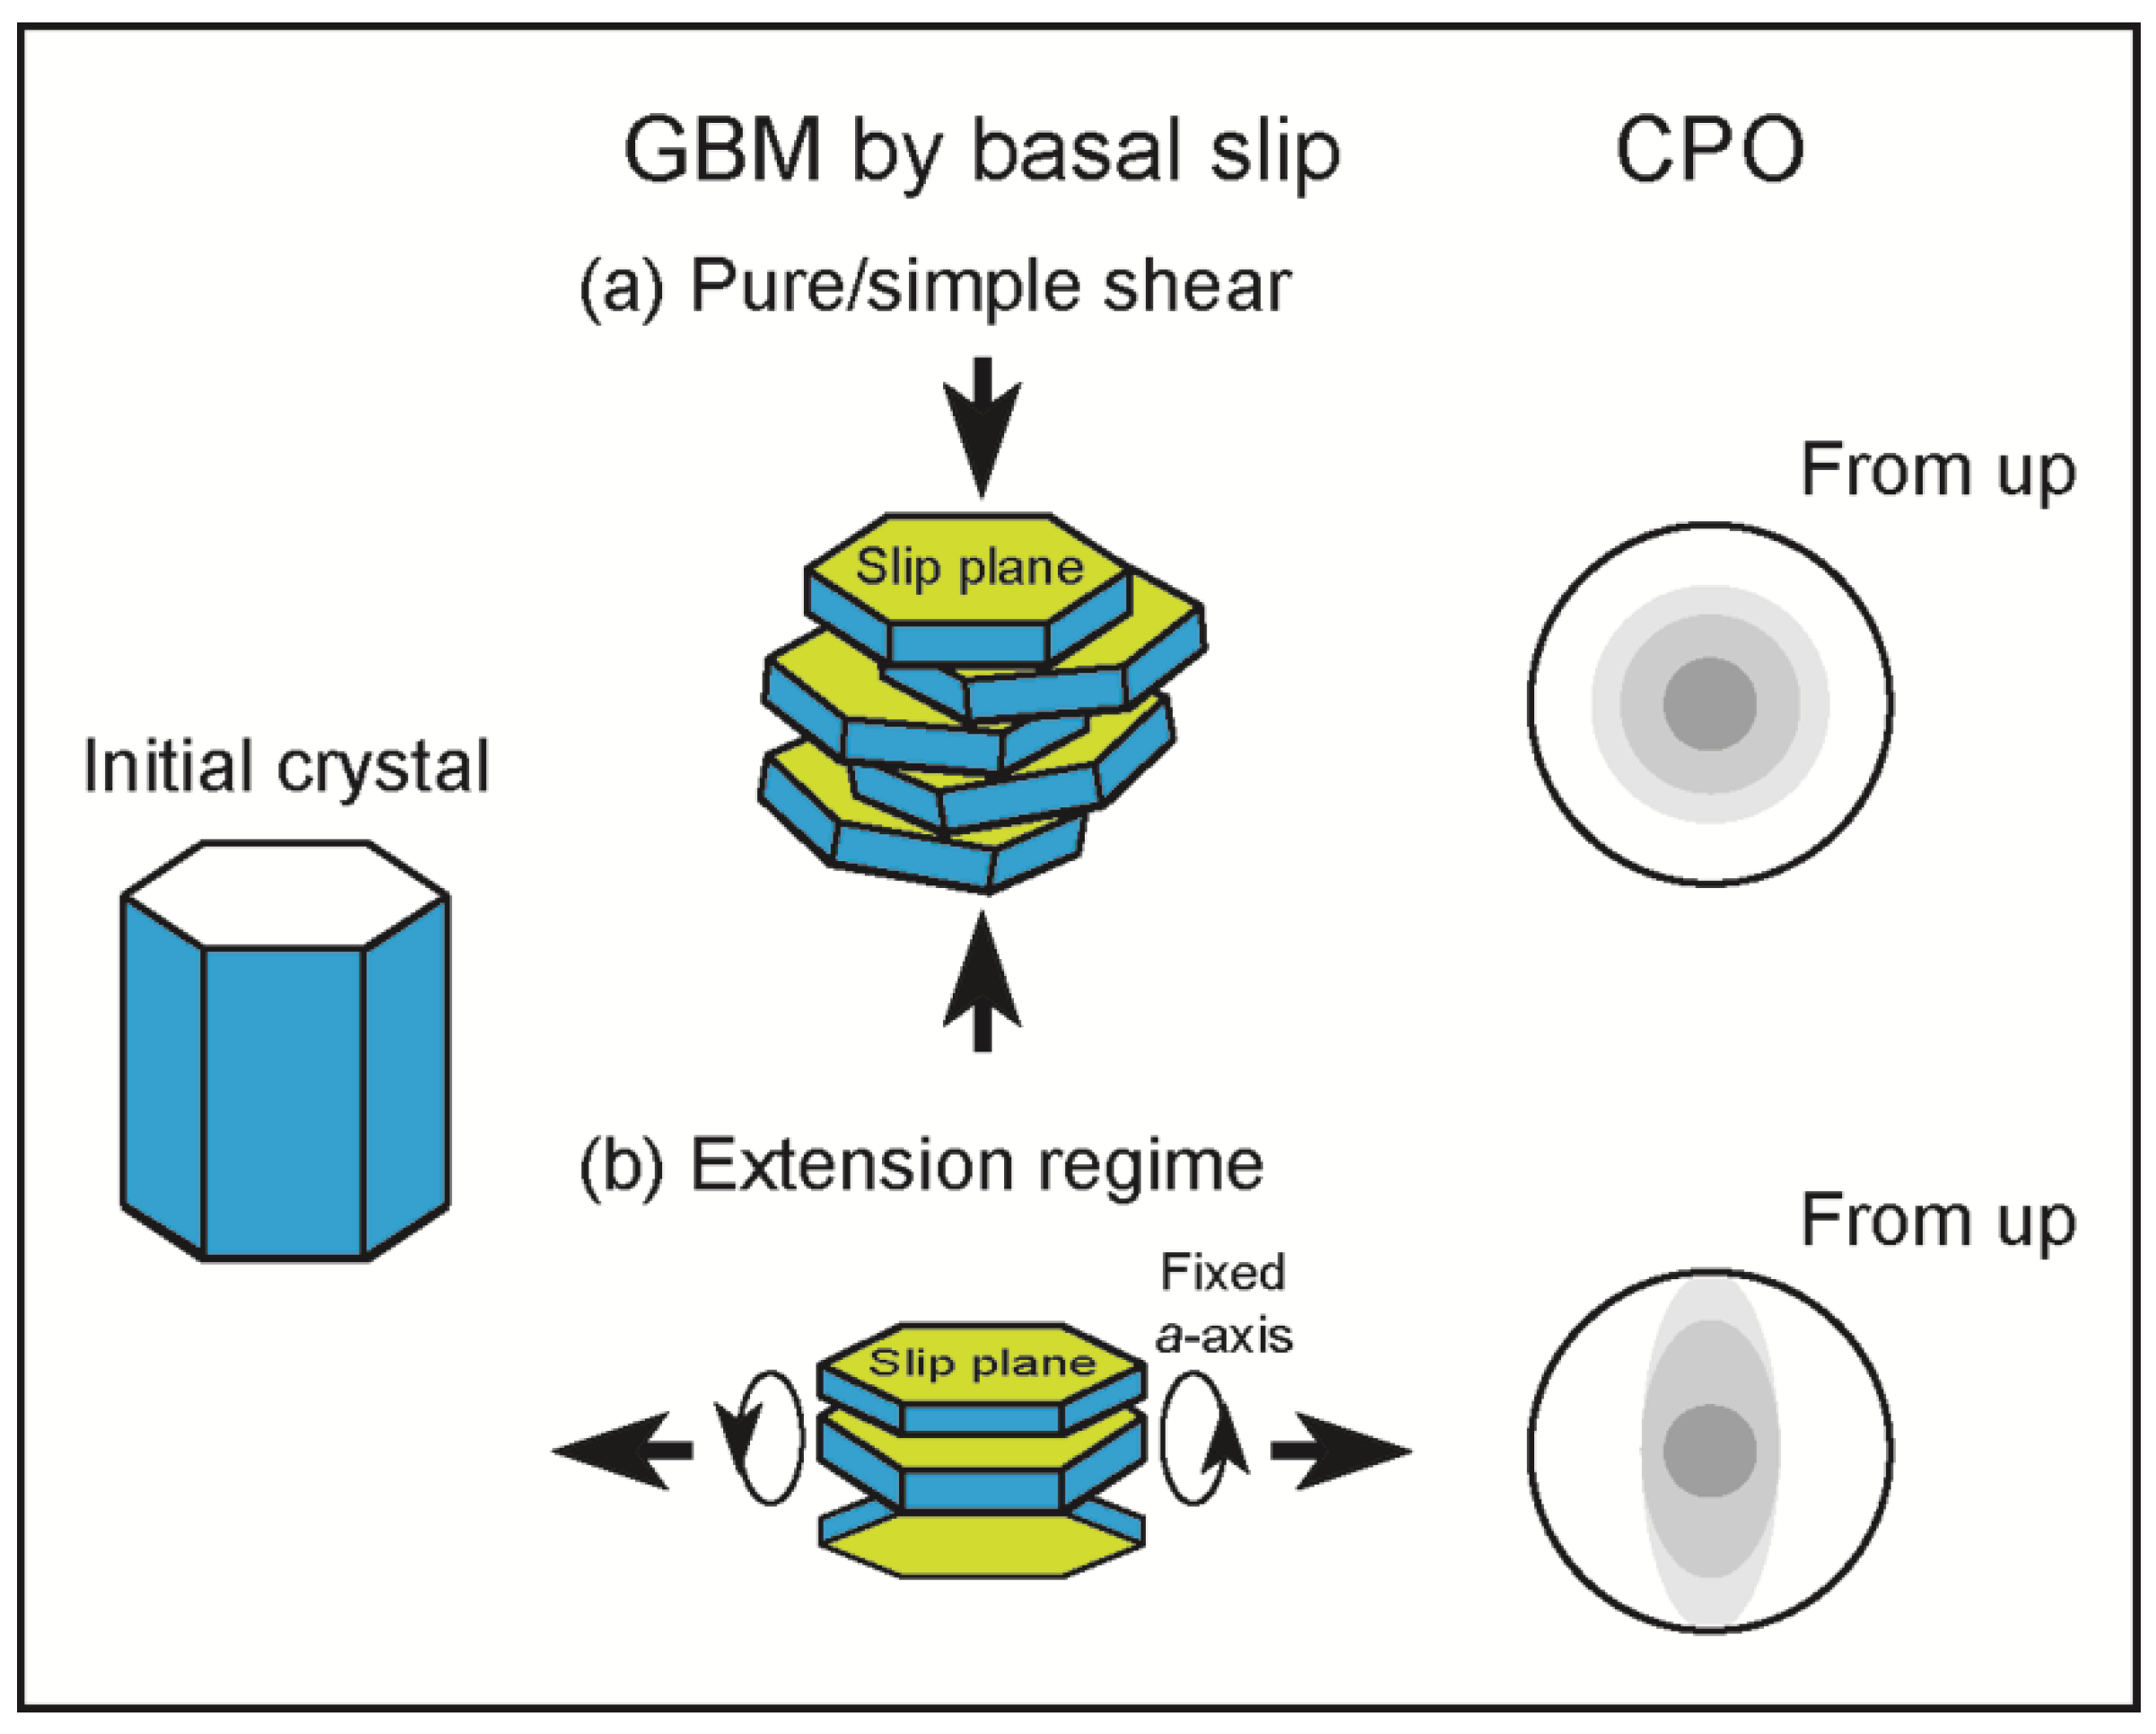
In the finite longitudinal/horizontal shear stress regimes, the operation of the basal slip could explain the formation of a single cluster with weak maxima of c-axes at depths ≤110 m and with a girdle at 140–170 m. Under a compressional (and/or a simple shear) stress regime at 50–110 m, slip occurs along the basal plane and the c-axes align around grains in high Schmid factor orientations at the expense of grains in the low Schmid factor orientations (Figure 9a). Under an extension regime, at 140–170 m, slip occurs along the basal plane and the c-axes disperse to rotate to form a girdle, with fixed a-axes along the tensile direction (Figure 9b). These processes can explain the formation of distinctive CPOs under different stress regimes.
4.3. Origin of Extensional Stress Regime and Implications for Ice Sheet Dynamics
Antarctic ice forms by recurrent patterns of snow accumulation, densification, and transformation through firn to ice [38,58,76,77,78]. The Styx Glacier is a renowned site of snow accumulation; hence, the c-axes of ice crystals can be expected to be aligned perpendicular to the surface. The results from the microstructural investigations in this study, however, demonstrate the CPO evolution with depth from a single cluster of c-axes to a single cluster with a girdle. The ice in the study area flows and meets a nunatak within ~4 km to the SE. The topography may generate an extensional stress regime that may be responsible for the weak girdle of c-axes at depths ≥140 m (Figure 10a). Our GPR data suggest that the bedrock becomes shallower from the sample location towards the nunatak (Figure 3). Additionally, a small bedrock peak corresponds to the core site and may contribute to an extensional stress regime at the sample location (Figure 10b,c).
We have compared our results to conventional ice-flow models that regard ice as a viscoelastic material. Conventional numerical models of ice flow [76,79] are characterized by a low velocity at the base due to a high friction with the bedrock, and a logarithmic increase in speed toward the surface. In the study area, the evolution of the CPO from a single cluster of c-axes to a single cluster with a girdle, can be attributed to the kinematic control of the underlying bedrock. Although we have concluded that the structure of the bedrock is the most likely cause for the generation of the CPO evolution, other environmental factors, such as the concentration of air bubbles, gas or volcanic tephra due to variations in annual snow accumulation, need to be tested [32,33,34]. Therefore, we suggest that the microstructural analyses of various ice cores should be explored extensively by sampling from kinematically distinct locations within ice sheets. This process is crucial for a thorough review of the conventional ice flow models. Moreover, new techniques must be devised to facilitate preservation of the azimuthal orientations of cored ice samples.
5. Conclusions
We conducted a microstructural study of five natural ice samples taken at intervals of ~30 m from depths of 50–170 m by a core drilled in the Styx Glacier, located in northern Victoria Land, Antarctica. Our interpretations of the microstructures, based on high-quality EBSD maps combined with GPR, can be summarized as follows:
- With increasing depth, the analyzed samples show a systematic change from a weak single cluster of c-axes at 50 m, to a single cluster with weak multi-maxima between 80–110 m, and to a single cluster with a girdle between 140–170 m. An a-axis cluster occurs normal to the c-axis girdle. The formation of the girdle that accompanied the strong single cluster is characterized by an abrupt increase in fabric indices, and a decrease in the shape factor; thus, suggesting the extension began to occur at the depth of <140 m.
- Straight grain boundaries, relatively uniform grain size, triple junction of ~120°, and a weak single cluster of c-axes at 50 m (Figure 4 and Figure 6) are typically regarded as products of polygonization under compression, mainly due to bubble extraction. With an increased depth of burial, grain size increased, fabric strengthened, and the irregularity increased in grain shape (Figure 5 and Figure 6). At the depth of 140 m, highly curved grain shapes, abrupt increase of fabric indices, and the occurrence of a girdled c-axes (K < 1) suggest dynamic recrystallization dominated by GBM.
- The ice generally flows at ca. 2.3 m yr−1 from the northwest (NW) to the SE, dominated under the finite longitudinal and horizontal shear regimes. The presence of a nunatak located ~4 km far from the sample location in the SE direction, and a low surface velocity of ice, allowed the appearance of a girdle of c-axes between 140–170 m. The girdle was the result of an extensional stress regime generated at that depths. These results suggest the occurrence of changeable stress regimes as a response to diverse environments, such as an abrupt appearance of a small peak in the bedrock.
Author Contributions
D.K., D.J.P., and Y.H. collaboratively designed the project and wrote the manuscript. D.K., D.J.P., and C.Q. conducted EBSD analysis, and H.H. and H.T.J. provided satellite and GPR data, respectively. All authors contributed to correct the initial version of the manuscript. All authors have read and agreed to the published version of the manuscript.
Funding
This research was funded by a KOPRI project PE20030.
Acknowledgments
This work was originally designed by D.K., Y.H., and Jin-Han Ree (Korea University). Soon Do Hur and Sang-Bum Hong (KOPRI) provided the ice core samples collected during the 2014–2015 austral summer season. Chun-Ki Lee (KOPRI) contributed toward discussions about satellite data. Lisa Craw (University of Tasmania), Kat Lilly, and Pat Langhorne (University of Otago) supported data collection. The authors appreciate the fruitful and constructive reviews by three anonymous reviewers and the careful editorial work by Haemyeong Jung.
Conflicts of Interest
The authors declare no conflict of interest.
References
- Fahnestock, M.; Abdalati, W.; Joughin, I.; Brozena, J.; Gogineni, P. High Geothermal Heat Flow, Basal Melt, and the Origin of Rapid Ice Flow in Central Greenland. Science 2001, 294, 2338. [Google Scholar] [CrossRef] [PubMed] [Green Version]
- MacGregor, J.A.; Fahnestock, M.A.; Catania, G.A.; Aschwanden, A.; Clow, G.D.; Colgan, W.T.; Gogineni, S.P.; Morlighem, M.; Nowicki, S.M.J.; Paden, J.D.; et al. A synthesis of the basal thermal state of the Greenland Ice Sheet. J. Geophys. Res. Earth Surf. 2016, 121, 1328–1350. [Google Scholar] [CrossRef] [PubMed] [Green Version]
- Rignot, E.; Mouginot, J. Ice flow in Greenland for the International Polar Year 2008–2009. Geophys. Res. Lett. 2012, 39. [Google Scholar] [CrossRef] [Green Version]
- Bell, R.E.; Tinto, K.; Das, I.; Wolovick, M.; Chu, W.; Creyts, T.T.; Frearson, N.; Abdi, A.; Paden, J.D. Deformation, warming and softening of Greenland’s ice by refreezing meltwater. Nat. Geosci. 2014, 7, 497. [Google Scholar] [CrossRef]
- Wolovick, M.J.; Creyts, T.T.; Buck, W.R.; Bell, R.E. Traveling slippery patches produce thickness-scale folds in ice sheets. Geophys. Res. Lett. 2014, 41, 8895–8901. [Google Scholar] [CrossRef] [Green Version]
- Hewitt, I.J. Seasonal changes in ice sheet motion due to melt water lubrication. Earth Planet. Sci. Lett. 2013, 371–372, 16–25. [Google Scholar] [CrossRef]
- Stokes, C.R.; Clark, C.D.; Lian, O.B.; Tulaczyk, S. Ice stream sticky spots: A review of their identification and influence beneath contemporary and palaeo-ice streams. Earth Sci. Rev. 2007, 81, 217–249. [Google Scholar] [CrossRef]
- Sergienko, O.V.; Creyts, T.T.; Hindmarsh, R.C.A. Similarity of organized patterns in driving and basal stresses of Antarctic and Greenland ice sheets beneath extensive areas of basal sliding. Geophys. Res. Lett. 2014, 41, 3925–3932. [Google Scholar] [CrossRef] [Green Version]
- Glen, J.W. Experiments on the Deformation of Ice. J. Glaciol. 1952, 2, 111–114. [Google Scholar] [CrossRef] [Green Version]
- Glen, J.W.; Perutz, M.F. The creep of polycrystalline ice. Proc. R. Soc. Lond. Ser. A Math. Phys. Sci. 1955, 228, 519–538. [Google Scholar] [CrossRef]
- Durham, W.B.; Heard, H.C.; Kirby, S.H. Experimental deformation of polycrystalline H2O ice at high pressure and low temperature: Preliminary results. J. Geophys. Res. 1983, 88. [Google Scholar] [CrossRef]
- Weertman, J. Creep of deformation of ice. Annu. Rev. Earth Planet. Sci. 1983, 11, 215–240. [Google Scholar] [CrossRef] [Green Version]
- Budd, W.F.; Jacka, T.H. A review of ice rheology for ice sheet modelling. Cold Reg. Sci. Technol. 1989, 16, 107–144. [Google Scholar] [CrossRef]
- Treverrow, A.; Budd, W.F.; Jacka, T.H.; Warner, R.C. The tertiary creep of polycrystalline ice: Experimental evidence for stress-dependent levels of strain-rate enhancement. J. Glaciol. 2012, 58, 301–314. [Google Scholar] [CrossRef] [Green Version]
- Goldsby, D.L.; Kohlstedt, D.L. Superplastic deformation of ice: Experimental observations. J. Geophys. Res. Solid Earth 2001, 106, 11017–11030. [Google Scholar] [CrossRef]
- Alley, R.B.; Joughin, I. Modeling Ice-Sheet Flow. Science 2012, 336, 551. [Google Scholar] [CrossRef]
- Craw, L.; Qi, C.; Prior, D.J.; Goldsby, D.L.; Kim, D. Mechanics and microstructure of deformed natural anisotropic ice. J. Struct. Geol. 2018, 115, 152–166. [Google Scholar] [CrossRef]
- Alley, R.B. Flow-law hypotheses for ice-sheet modeling. J. Glaciol. 1992, 38, 245–256. [Google Scholar] [CrossRef] [Green Version]
- Faria, S.H.; Weikusat, I.; Azuma, N. The microstructure of polar ice. Part II: State of the art. J. Struct. Geol. 2014, 61, 21–49. [Google Scholar] [CrossRef] [Green Version]
- Hudleston, P.J. Progressive Deformation and Development of Fabric Across Zones of Shear in Glacial Ice. In Energetics of Geological Processes: Hans Ramberg on His 60th Birthday; Saxena, S.K., Bhattacharji, S., Annersten, H., Stephansson, O., Eds.; Springer: Berlin/Heidelberg, Germany, 1977; pp. 121–150. [Google Scholar] [CrossRef]
- Thorsteinsson, T.; Kipfstuhl, J.; Miller, H. Textures and fabrics in the GRIP ice core. J. Geophys. Res. Ocean. 1997, 102, 26583–26599. [Google Scholar] [CrossRef] [Green Version]
- Lipenkov, V.Y.; Barkov, N.I.; Duval, P.; Pimienta, P. Crystalline Texture of the 2083 m Ice Core at Vostok Station, Antarctica. J. Glaciol. 1989, 35, 392–398. [Google Scholar] [CrossRef] [Green Version]
- Wang, Y.; Thorsteinsson, T.; Kipfstuhl, J.; Miller, H.; Dahl-Jensen, D.; Shoji, H. A vertical girdle fabric in the NorthGRIP deep ice core, North Greenland. Ann. Glaciol. 2002, 35, 515–520. [Google Scholar] [CrossRef] [Green Version]
- Weikusat, I.; Kipfstuhl, S.; Faria, S.H.; Azuma, N.; Miyamoto, A. Subgrain boundaries and related microstructural features in EDML (Antarctica) deep ice core. J. Glaciol. 2009, 55, 461–472. [Google Scholar] [CrossRef] [Green Version]
- Hudleston, P.J. Structures and fabrics in glacial ice: A review. J. Struct. Geol. 2015, 81, 1–27. [Google Scholar] [CrossRef] [Green Version]
- Fan, S.; Hager, T.; Prior, D.J.; Cross, A.J.; Goldsby, D.L.; Qi, C.; Negrini, M.; Wheeler, J. Temperature and strain controls on ice deformation mechanisms: Insights from the microstructures of samples deformed to progressively higher strains at −10, −20 and −30°C. Cryosphere Discuss 2020, 2020, 1–43. [Google Scholar] [CrossRef] [Green Version]
- Piazolo, S.; Wilson, C.J.L.; Luzin, V.; Brouzet, C.; Peternell, M. Dynamics of ice mass deformation: Linking processes to rheology, texture, and microstructure. Geochem. Geophys. Geosyst. 2013, 14, 4185–4194. [Google Scholar] [CrossRef]
- Qi, C.; Goldsby, D.L.; Prior, D.J. The down-stress transition from cluster to cone fabrics in experimentally deformed ice. Earth Planet. Sci. Lett. 2017, 471, 136–147. [Google Scholar] [CrossRef]
- Qi, C.; Prior, D.J.; Craw, L.; Fan, S.; Llorens, M.G.; Griera, A.; Negrini, M.; Bons, P.D.; Goldsby, D.L. Crystallographic preferred orientations of ice deformed in direct-shear experiments at low temperatures. Cryosphere 2019, 13, 351–371. [Google Scholar] [CrossRef] [Green Version]
- Journaux, B.; Chauve, T.; Montagnat, M.; Tommasi, A.; Barou, F.; Mainprice, D.; Gest, L. Recrystallization processes, microstructure and crystallographic preferred orientation evolution in polycrystalline ice during high-temperature simple shear. Cryosphere 2019, 13, 1495–1511. [Google Scholar] [CrossRef] [Green Version]
- Bouchez, J.L.; Lister, G.S.; Nicolas, A. Fabric asymmetry and shear sense in movement zones. Geol. Rundsch. 1983, 72, 401–419. [Google Scholar] [CrossRef]
- Pälli, A.; Kohler, J.C.; Isaksson, E.; Moore, J.C.; Pinglot, J.F.; Pohjola, V.A.; Samuelsson, H. Spatial and temporal variability of snow accumulation using ground-penetrating radar and ice cores on a Svalbard glacier. J. Glaciol. 2002, 48, 417–424. [Google Scholar] [CrossRef] [Green Version]
- Anschütz, H.; Eisen, O.; Oerter, H.; Steinhage, D.; Scheinert, M. Investigating small-scale variations of the recent accumulation rate in coastal Dronning Maud Land, East Antarctica. Ann. Glaciol. 2007, 46, 14–21. [Google Scholar] [CrossRef] [Green Version]
- Bons, P.D.; Jansen, D.; Mundel, F.; Bauer, C.C.; Binder, T.; Eisen, O.; Jessell, M.W.; Llorens, M.-G.; Steinbach, F.; Steinhage, D.; et al. Converging flow and anisotropy cause large-scale folding in Greenland’s ice sheet. Nat. Commun. 2016, 7, 11427. [Google Scholar] [CrossRef] [PubMed] [Green Version]
- Udisti, R.; Barbante, C.; Castellano, E.; Vermigli, S.; Traversi, R.; Capodaglio, G.; Piccardi, G. Chemical characterisation of a volcanic event (about AD 1500) at Styx Glacier plateau, northern Victoria Land, Antarctica. Ann. Glaciol. 1999, 29, 113–120. [Google Scholar] [CrossRef] [Green Version]
- Kwak, H.; Kang, J.-H.; Hong, S.-B.; Lee, J.; Chang, C.; Hur, S.D.; Hong, S. A Study on High-Resolution Seasonal Variations of Major Ionic Species in Recent Snow Near the Antarctic Jang Bogo Station. Ocean. Polar Res. 2015, 37, 127–140. [Google Scholar] [CrossRef] [Green Version]
- Van de Velde, K.; Vallelonga, P.; Candelone, J.P.; Rosman, K.J.R.; Gaspari, V.; Cozzi, G.; Barbante, C.; Udisti, R.; Cescon, P.; Boutron, C.F. Pb isotope record over one century in snow from Victoria Land, Antarctica. Earth Planet. Sci. Lett. 2005, 232, 95–108. [Google Scholar] [CrossRef]
- Stenni, B.; Serra, F.; Frezzotti, M.; Maggi, V.; Traversi, R.; Becagli, S.; Udisti, R. Snow accumulation rates in northern Victoria Land, Antarctica, by firn-core analysis. J. Glaciol 2000, 46, 541–552. [Google Scholar] [CrossRef] [Green Version]
- Rignot, E.; Mouginot, J.; Scheuchl, B. MEaSUREs InSAR-Based Antarctica Ice Velocity Map, Version 2; NASA National Snow and Ice Data Center Distributed Active Archive Center: Boulder, CO, USA, 2017. [Google Scholar] [CrossRef]
- Han, Y.; Jun, S.J.; Miyahara, M.; Lee, H.-G.; Ahn, J.; Chung, J.W.; Hur, S.D.; Hong, S.B. Shallow ice-core drilling on Styx glacier, northern Victoria Land, Antarctica in the 2014-2015 summer. J. Geol. Soc. Korea 2015, 51. [Google Scholar] [CrossRef]
- Kim, S.-J. Investigation of Climate Change Mechanism by Observation and Simulation of Polar Climate for the Past and Present (Rep. BSPE16010–146–12); Korea Polar Research Institute: Incheon, Korea, 2017. [Google Scholar]
- Llorens, M.-G.; Griera, A.; Bons, P.D.; Roessiger, J.; Lebensohn, R.; Evans, L.; Weikusat, I. Dynamic recrystallisation of ice aggregates during co-axial viscoplastic deformation: A numerical approach. J. Glaciol. 2016, 62, 359–377. [Google Scholar] [CrossRef] [Green Version]
- Herron, M.M.; Langway, C.C. Firn Densification: An Empirical Model. J. Glaciol. 1980, 25, 373–385. [Google Scholar] [CrossRef]
- Yang, J.-W.; Han, Y.; Orsi, A.J.; Kim, S.-J.; Han, H.; Ryu, Y.; Jang, Y.; Moon, J.; Choi, T.; Hur, S.D.; et al. Surface Temperature in Twentieth Century at the Styx Glacier, Northern Victoria Land, Antarctica, From Borehole Thermometry. Geophys. Res. Lett. 2018, 45, 9834–9842. [Google Scholar] [CrossRef]
- Udisti, R. Multiparametric Approach for Chemical Dating of Snow Layers from Antarctica. Int. J. Environ. Anal. Chem. 1996, 63, 225–244. [Google Scholar] [CrossRef]
- Kovacs, A.; Gow, A.J.; Morey, R.M. The in-situ dielectric constant of polar firn revisited. Cold Reg. Sci. Technol. 1995, 23, 245–256. [Google Scholar] [CrossRef]
- Kim, D.; Wallis, S.; Endo, S.; Ree, J.-H. Seismic properties of lawsonite eclogites from the southern Motagua fault zone, Guatemala. Tectonophysics 2016, 677–678, 88–98. [Google Scholar] [CrossRef]
- Prior, D.J.; Lilly, K.; Seidemann, M.; Vaughan, M.; Becroft, L.; Easingwood, R.; Diebold, S.; Obbard, R.; Daghlian, C.; Baker, I.; et al. Making EBSD on water ice routine. J. Microsc. 2015, 259, 237–256. [Google Scholar] [CrossRef]
- Mainprice, D.; Hielscher, R.; Schaeben, H. Calculating anisotropic physical properties from texture data using the MTEX open-source package. Geol. Soc. Lond. Spec. Publ. 2011, 360, 175. [Google Scholar] [CrossRef] [Green Version]
- Mainprice, D.; Silver, P.G. Interpretation of SKS-waves using samples from the subcontinental lithosphere. Phys. Earth Planet. Inter. 1993, 78, 257–280. [Google Scholar] [CrossRef]
- Bunge, H.J. Texture Analysis in Materials Science: Mathematical Methods; Butterworths: London, UK, 1982. [Google Scholar] [CrossRef]
- Skemer, P.; Katayama, I.; Jiang, Z.; Karato, S.-I. The misorientation index: Development of a new method for calculating the strength of lattice-preferred orientation. Tectonophysics 2005, 411, 157–167. [Google Scholar] [CrossRef]
- Vollmer, F.W. An application of eigenvalue methods to structural domain analysis. GSA Bull. 1990, 102, 786–791. [Google Scholar] [CrossRef]
- Jung, H.; Karato, S. Water-induced fabric transitions in olivine. Science 2001, 293, 1460–1463. [Google Scholar] [CrossRef] [Green Version]
- Obbard, R.; Baker, I.; Sieg, K. Using electron backscatter diffraction patterns to examine recrystallization in polar ice sheets. J. Glaciol. 2006, 52, 546–557. [Google Scholar] [CrossRef] [Green Version]
- Hansen, L.N.; Zhao, Y.-H.; Zimmerman, M.E.; Kohlstedt, D.L. Protracted fabric evolution in olivine: Implications for the relationship among strain, crystallographic fabric, and seismic anisotropy. Earth Planet. Sci. Lett. 2014, 387, 157–168. [Google Scholar] [CrossRef]
- Kim, D.; Katayama, I.; Wallis, S.; Michibayashi, K.; Miyake, A.; Seto, Y.; Azuma, S. Deformation microstructures of glaucophane and lawsonite in experimentally deformed blueschists: Implications for intermediate-depth intraplate earthquakes. J. Geophys. Res. Solid Earth 2015, 120, 1229–1242. [Google Scholar] [CrossRef]
- Kipfstuhl, S.; Faria, S.H.; Azuma, N.; Freitag, J.; Hamann, I.; Kaufmann, P.; Miller, H.; Weiler, K.; Wilhelms, F. Evidence of dynamic recrystallization in polar firn. J. Geophys. Res. Solid Earth 2009, 114. [Google Scholar] [CrossRef] [Green Version]
- Ligtenberg, S.R.M.; Helsen, M.M.; van den Broeke, M.R. An improved semi-empirical model for the densification of Antarctic firn. Cryosphere 2011, 5, 809–819. [Google Scholar] [CrossRef] [Green Version]
- Kamb, B. Experimental Recrystallization of Ice Under Stress. Flow Fract. Rocks 1972, 211–241. [Google Scholar] [CrossRef]
- Gow, A.J.; Williamson, T. Rheological implications of the internal structure and crystal fabrics of the West Antarctic ice sheet as revealed by deep core drilling at Byrd Station. GSA Bull. 1976, 87, 1665–1677. [Google Scholar] [CrossRef] [Green Version]
- Kamb, W.B. Ice petrofabric observations from Blue Glacier, Washington, in relation to theory and experiment. J. Geophys. Res. (1896–1977) 1959, 64, 1891–1909. [Google Scholar] [CrossRef]
- Wilson, C.J.L.; Peternell, M. Ice deformed in compression and simple shear: Control of temperature and initial fabric. J. Glaciol. 2012, 58, 11–22. [Google Scholar] [CrossRef] [Green Version]
- Llorens, M.-G.; Griera, A.; Steinbach, F.; Bons, P.D.; Gomez-Rivas, E.; Jansen, D.; Roessiger, J.; Lebensohn, R.A.; Weikusat, I. Dynamic recrystallization during deformation of polycrystalline ice: Insights from numerical simulations. Philos. Trans. R. Soc. A Math. Phys. Eng. Sci. 2017, 375, 20150346. [Google Scholar] [CrossRef]
- Gow, A.J.; Meese, D. Physical properties, crystalline textures and c-axis fabrics of the Siple Dome (Antarctica) ice core. J. Glaciol. 2007, 53, 573–584. [Google Scholar] [CrossRef] [Green Version]
- Obbard, R.; Baker, I. The microstructure of meteoric ice from Vostok, Antarctica. J. Glaciol. 2007, 53, 41–62. [Google Scholar] [CrossRef] [Green Version]
- Montagnat, M.; Azuma, N.; Dahl-Jensen, D.; Eichler, J.; Fujita, S.; Gillet-Chaulet, F.; Kipfstuhl, S.; Samyn, D.; Svensson, A.; Weikusat, I. Fabric along the NEEM ice core, Greenland, and its comparison with GRIP and NGRIP ice cores. Cryosphere 2014, 8, 1129–1138. [Google Scholar] [CrossRef] [Green Version]
- Esedoḡlu, S. Grain size distribution under simultaneous grain boundary migration and grain rotation in two dimensions. Comput. Mater. Sci. 2016, 121, 209–216. [Google Scholar] [CrossRef] [Green Version]
- Doherty, R.D.; Hughes, D.A.; Humphreys, F.J.; Jonas, J.J.; Jensen, D.J.; Kassner, M.E.; King, W.E.; McNelley, T.R.; McQueen, H.J.; Rollett, A.D. Current issues in recrystallization: A review. Mater. Sci. Eng. A 1997, 238, 219–274. [Google Scholar] [CrossRef] [Green Version]
- Weikusat, I.; DA, D.E.W.; Pennock, G.M.; Hayles, M.; Schneijdenberg, C.T.; Drury, M.R. Cryogenic EBSD on ice: Preserving a stable surface in a low pressure SEM. J. Microsc. 2011, 242, 295–310. [Google Scholar] [CrossRef] [Green Version]
- Seidemann, M.; Prior, D.J.; Golding, N.; Durham, W.B.; Lilly, K.; Vaughan, M.J. The role of kink boundaries in the deformation and recrystallisation of polycrystalline ice. J. Struct. Geol. 2020, 136, 104010. [Google Scholar] [CrossRef]
- Wheeler, J.; Mariani, E.; Piazolo, S.; Prior, D.J.; Trimby, P.; Drury, M.R. The weighted Burgers vector: A new quantity for constraining dislocation densities and types using electron backscatter diffraction on 2D sections through crystalline materials. J. Microsc. 2009, 233, 482–494. [Google Scholar] [CrossRef]
- Chauve, T.; Montagnat, M.; Barou, F.; Hidas, K.; Tommasi, A.; Mainprice, D. Investigation of nucleation processes during dynamic recrystallization of ice using cryo-EBSD. Philos. Trans. Math. Phys. Eng. Sci. 2017, 375. [Google Scholar] [CrossRef] [Green Version]
- Wei, Y.; Dempsey, J.P. The motion of non-basal dislocations in ice crystals. Philos. Mag. 1994, 69, 1–10. [Google Scholar] [CrossRef]
- Weikusat, I.; Kuiper, E.-J.N.; Pennock, G.M.; Kipfstuhl, S.; Drury, M.R. EBSD analysis of subgrain boundaries and dislocation slip systems in Antarctic and Greenland ice. Solid Earth 2017, 8, 883–898. [Google Scholar] [CrossRef] [Green Version]
- Kirchner, N.; Hutter, K.; Jakobsson, M.; Gyllencreutz, R. Capabilities and limitations of numerical ice sheet models: A discussion for Earth-scientists and modelers. Quat. Sci. Rev. 2011, 30, 3691–3704. [Google Scholar] [CrossRef]
- Maeno, N.; Ebinuma, T. Pressure sintering of ice and its implication to the densification of snow at polar glaciers and ice sheets. J. Phys. Chem. 1983, 87, 4103–4110. [Google Scholar] [CrossRef]
- Spaulding, N.E.; Meese, D.A.; Baker, I. Advanced microstructural characterization of four East Antarctic firn/ice cores. J. Glaciol. 2011, 57, 796–810. [Google Scholar] [CrossRef] [Green Version]
- Winkelmann, R.; Levermann, A.; Martin, M.A.; Frieler, K. Increased future ice discharge from Antarctica owing to higher snowfall. Nature 2012, 492, 239. [Google Scholar] [CrossRef]
Figure 5.
High-quality electron backscatter diffraction (EBSD) data showing (a) orientation (Euler angle), (b) mis2mean maps, and (c) grain sizes of the analyzed samples from the Styx Glacier. The locations of samples in the drilled core are shown to the left of (a). White areas in (a) and (b) present the existence of air bubbles. Color indices for (a) and (b) are located in the lower right of each. The maps in (b) show grain boundaries (>10°) as black lines. The MATLAB toolbox MTEX is employed for all figures.

Figure 6.
Rotated crystallographic preferred orientations of the ice samples using (a) 2000 random points and (b) full pixels data. The small cylinder at the top right shows the orientation of the plotted pole figures. The crystallographic data are plotted using the MATLAB-based toolbox MTEX as poles on upper-hemisphere equal-area projections with contours in multiples of uniform distribution. P = Number of pixels; J = J-index; M = M-index; N = Number of grains.

Figure 7.
Plots of (a) J-index, (b) mean grain size, and (c) shape factor, K, as a factor of increasing depth. The range presented as black arrows and a blue arrow and in (b) denote the standard deviation and peak grain size, respectively. The shape factor is calculated from eigenvalues [53].
Figure 7.
Plots of (a) J-index, (b) mean grain size, and (c) shape factor, K, as a factor of increasing depth. The range presented as black arrows and a blue arrow and in (b) denote the standard deviation and peak grain size, respectively. The shape factor is calculated from eigenvalues [53].

Figure 8.
Rotation axes of the analyzed samples computed using the program Channel 5. The term “Max” denotes the maximum of mean uniform density. These are upper hemisphere plots, contoured with a half width of 10°.
Figure 8.
Rotation axes of the analyzed samples computed using the program Channel 5. The term “Max” denotes the maximum of mean uniform density. These are upper hemisphere plots, contoured with a half width of 10°.

Figure 9.
Schematic model to show formation of a single cluster with (a) weak maxima around the cluster under a compressional (pure/simple shear) regime, and (b) the weak aligned maxima (a girdle) under an extension regime.
Figure 9.
Schematic model to show formation of a single cluster with (a) weak maxima around the cluster under a compressional (pure/simple shear) regime, and (b) the weak aligned maxima (a girdle) under an extension regime.

Figure 10.
Schematic views of (a) sample location with flow of ice, (b) a cross section of a–b (marked as the orange line) in (a), and (c) a cross section (presented as the green line) of c–d in (a). The diverse stress regimes at different depths may be the results of the low velocity of ice flow, and a nunatak located ~4 km to the southease (SE) from the study area.


Table 1.
Sample descriptions.
| Sample Numbers | Location (Latitude, Longitude) | Depth (m) | Density (kg/m3) a | Age (kyr) b | Temperature (°C) c | Finite Longitudinal Strain d | Longitudinal Strain Rate (s−1) | Upper Bound Horizontal Shear Strain Rate (s−1) e | Lower Bound Horizontal Shear Strain Rate (s−1) f | Lower Bound Horizontal Shear Strain |
|---|---|---|---|---|---|---|---|---|---|---|
| SG_50 | Styx Glacier (73° 51′ 6.0″S, 163° 41′ 13.2″E) | 50.03–50.08 | 783 | 0.26 | −31.2 | 0.81 | 9.82 × 10⁻¹¹ | 1.3 × 10⁻¹⁰ | 1.02 × 10⁻¹³ | 0.00 |
| SG_80 | 79.97–80.02 | 884 | 0.55 | −30.8 | 0.93 | 5.34 × 10⁻¹¹ | 5.10 × 10⁻¹³ | 0.01 | ||
| SG_110 | 109.91–109.96 | 900 | 0.90 | −30.3 | 0.94 | 3.33 × 10⁻¹¹ | 1.52 × 10⁻¹² | 0.04 | ||
| SG_140 | 140.47–140.52 | 917 | 1.31 | −29.8 | 0.96 | 2.33 × 10⁻¹¹ | 3.49 × 10⁻¹² | 0.14 | ||
| SG_170 | 170.19–170.24 | 922 | 1.83 | −28.9 | 0.97 | 1.68 × 10⁻¹¹ | 6.90 × 10⁻¹² | 0.40 |
a Density is measured using cored ice masses in a range of 0.4~0.8 m length. b Ice ages were derived from Yang et al. (2018). c Borehole temperature was measured twice with 1 m interval, in November 2016, 2 years after drilling. d Finite longitudinal strain was calculated as ln(Δ ρice) where Δ ρice is the difference between the density of the surface and the density of the sample. e Upper bound horizontal shear strain rate was calculated by ice flow velocity (2.3 m/year) divided by thickness (550 m). f Lower bound horizontal shear strain rate was estimated with an assumption that the driving force for horizontal shear strain is at a maximum at the base of the glacier and reduces linearly to zero at the surface.
Table 2.
Results of EBSD analysis.
| Sample Numbers | Step Size (μm) | Success Rate (%) a | Mean Grain Size with std. dev. (μm) | Fabric Strength | Seismic Anisotropy (%) | Number of Crystals | Number of Indexed Pixels | ||
|---|---|---|---|---|---|---|---|---|---|
| J-index | M-index | AVP | AVS | ||||||
| SG_50 | 40 | 84.46 | 1240 ± 550 | 1.4618 | 0.0372 | 0.7 | 1.92 | 385 | 257,290 |
| SG_80 | 40 | 93.46 | 1580 ± 970 | 1.9663 | 0.0725 | 1 | 2.68 | 242 | 349,756 |
| SG_110 | 40 | 96.21 | 1790 ± 1200 | 2.1067 | 0.0853 | 0.7 | 2.07 | 185 | 373,586 |
| SG_140 | 40 | 93.12 | 2000 ± 1280 | 5.0772 | 0.3009 | 2.8 | 6.87 | 101 | 159,714 |
| SG_170 | 40 | 97.40 | 2060 ± 1400 | 4.2485 | 0.2327 | 2.2 | 5.77 | 129 | 343,550 |
a Success rate represents the initial number of indexed grains divided by all the analyzed samples before noise reduction, and zero solution includes the space represented by the bubbles and cracks; therefore, the number is underestimated.
© 2020 by the authors. Licensee MDPI, Basel, Switzerland. This article is an open access article distributed under the terms and conditions of the Creative Commons Attribution (CC BY) license (http://creativecommons.org/licenses/by/4.0/).
Share and Cite
MDPI and ACS Style
Kim, D.; Prior, D.J.; Han, Y.; Qi, C.; Han, H.; Ju, H.T. Microstructures and Fabric Transitions of Natural Ice from the Styx Glacier, Northern Victoria Land, Antarctica. Minerals 2020, 10, 892. https://doi.org/10.3390/min10100892
AMA Style
Kim D, Prior DJ, Han Y, Qi C, Han H, Ju HT. Microstructures and Fabric Transitions of Natural Ice from the Styx Glacier, Northern Victoria Land, Antarctica. Minerals. 2020; 10(10):892. https://doi.org/10.3390/min10100892
Chicago/Turabian StyleKim, Daeyeong, David J. Prior, Yeongcheol Han, Chao Qi, Hyangsun Han, and Hyeon Tae Ju. 2020. "Microstructures and Fabric Transitions of Natural Ice from the Styx Glacier, Northern Victoria Land, Antarctica" Minerals 10, no. 10: 892. https://doi.org/10.3390/min10100892
Note that from the first issue of 2016, this journal uses article numbers instead of page numbers. See further details here.