1. Introduction
In contrast to synthetic diamonds, diamond substitutes or ‘simulants’ are other materials that resemble diamonds by eye, and may exhibit similar properties, e.g., high refractive index and hardness and a “good colour” (near-colourless to colourless). Some simulants occur in nature, while others are man-made. Common simulants include cubic zirconia (ZrO
2), zircon (ZrSiO
4), strontium titanate (SrTiO
3), yttrium aluminium garnet (Y
3Al
5O
12) (known as YAG), synthetic moissanite (SiC), gadolinium gallium garnet (Gd
3Ga
5O
12, or GGG), synthetic rutile (TiO
2), glass (SiO
2), synthetic spinel (MgAl
2O
4) and synthetic sapphire (α-Al
2O
3). Unlike diamonds, simulants do not attract high values at retail, making it clearly desirable from a commercial perspective to provide a reliable means of identifying and sorting them from natural diamonds. The separation of common simulants from diamonds can be very straightforward and there are effective traditional tools and analytical procedures known for some decades to sort simulants from diamonds [
1,
2,
3,
4,
5,
6]. More recently, commercial instruments have become available to automatically sort cubic zirconia from large batches of small diamonds [
7,
8,
9]. As reported in the press [
10], natural diamond verification for very small diamonds, especially in set jewellery is not obvious, however, recent advances in new measurement technologies harnessing the power of time-gated imaging have made this a much less onerous task [
11,
12,
13,
14].
Cubic Zirconia (CZ)
CZ, the synthetic crystal form of ZrO
2, is an excellent simulant because of its high brilliance, hardness, chemical inertness, low dispersion, isotropic crystal structure, high transparency and flawlessness and its high band gap, hence near-colourless appearance. The pioneering work of several groups to develop the skull melting process [
15] has established CZ as a very low-cost synthetic stone [
16,
17], retailing wholesale for as little as USD 2 for an equivalent-sized 1 carat round brilliant diamond. Thought initially to be an issue for diamond commercially, early studies in the 1980s showed that retail of CZ and other simulants were less than 1% of total diamond sales by value [
1]. Thankfully, to the diamantaire’s trained eye, it is possible to discern differences between CZ and diamond. In the trade, over the years, several instances of CZ and other substitutes have been identified trying to pass for the real thing, for example, in imitation rough [
18,
19] and polished diamond parcels [
20]. Well established verification methodologies include specific gravity, optical isotropy, thermal conductivity, wetting contact-angle, reflectivity, refractometry, UV-Vis-IR absorption, UV luminescence and of course Raman spectroscopy. However, these methods have their drawbacks, in that they usually measure a stone in isolation and become more difficult to employ when many stones are screened simultaneously in situ or require expensive, sophisticated-instrumentation and analysis. Moreover, it becomes increasingly difficult and time consuming for the diamantaire to discriminate CZ from diamond in large parcels and mounted jewellery when stones are very small (<0.01 ct, where 1 ct = 2 × 10
−4 kg).
In the skull melting process, monoclinic powdered ZrO
2 is heated at high temperatures to transition it to tetragonal form at 1100 °C, and finally to the cubic structure of CZ at >2000 °C. Unfortunately, if left to cool on its own, the above monoclinic-tetragonal-cubic transition sequence is reversible. To overcome this problem and block the reversibility of the melt, manufacturers add stabilisers, including CaO, MgO and Y
2O
3 (yttrium [Y
3+] oxide). For colourless CZ, Y
2O
3 is used most and added in the range 1–10 wt.% [
17], in what is called yttrium-stabilised zirconia (YSZ) [
21]. Furthermore, often lanthanide ions such as praseodymium (Pr
3+) and neodymium (Nd
3+) are added to enhance or change their colour [
1]. The latter ion is known to have a strong absorption in the yellow-green region of the spectrum thus producing purple colour in larger stones [
22], has a strong near-infrared emission [
23,
24], and used as a dopant in YSZ [
25] and YAG [
26] laser crystals.
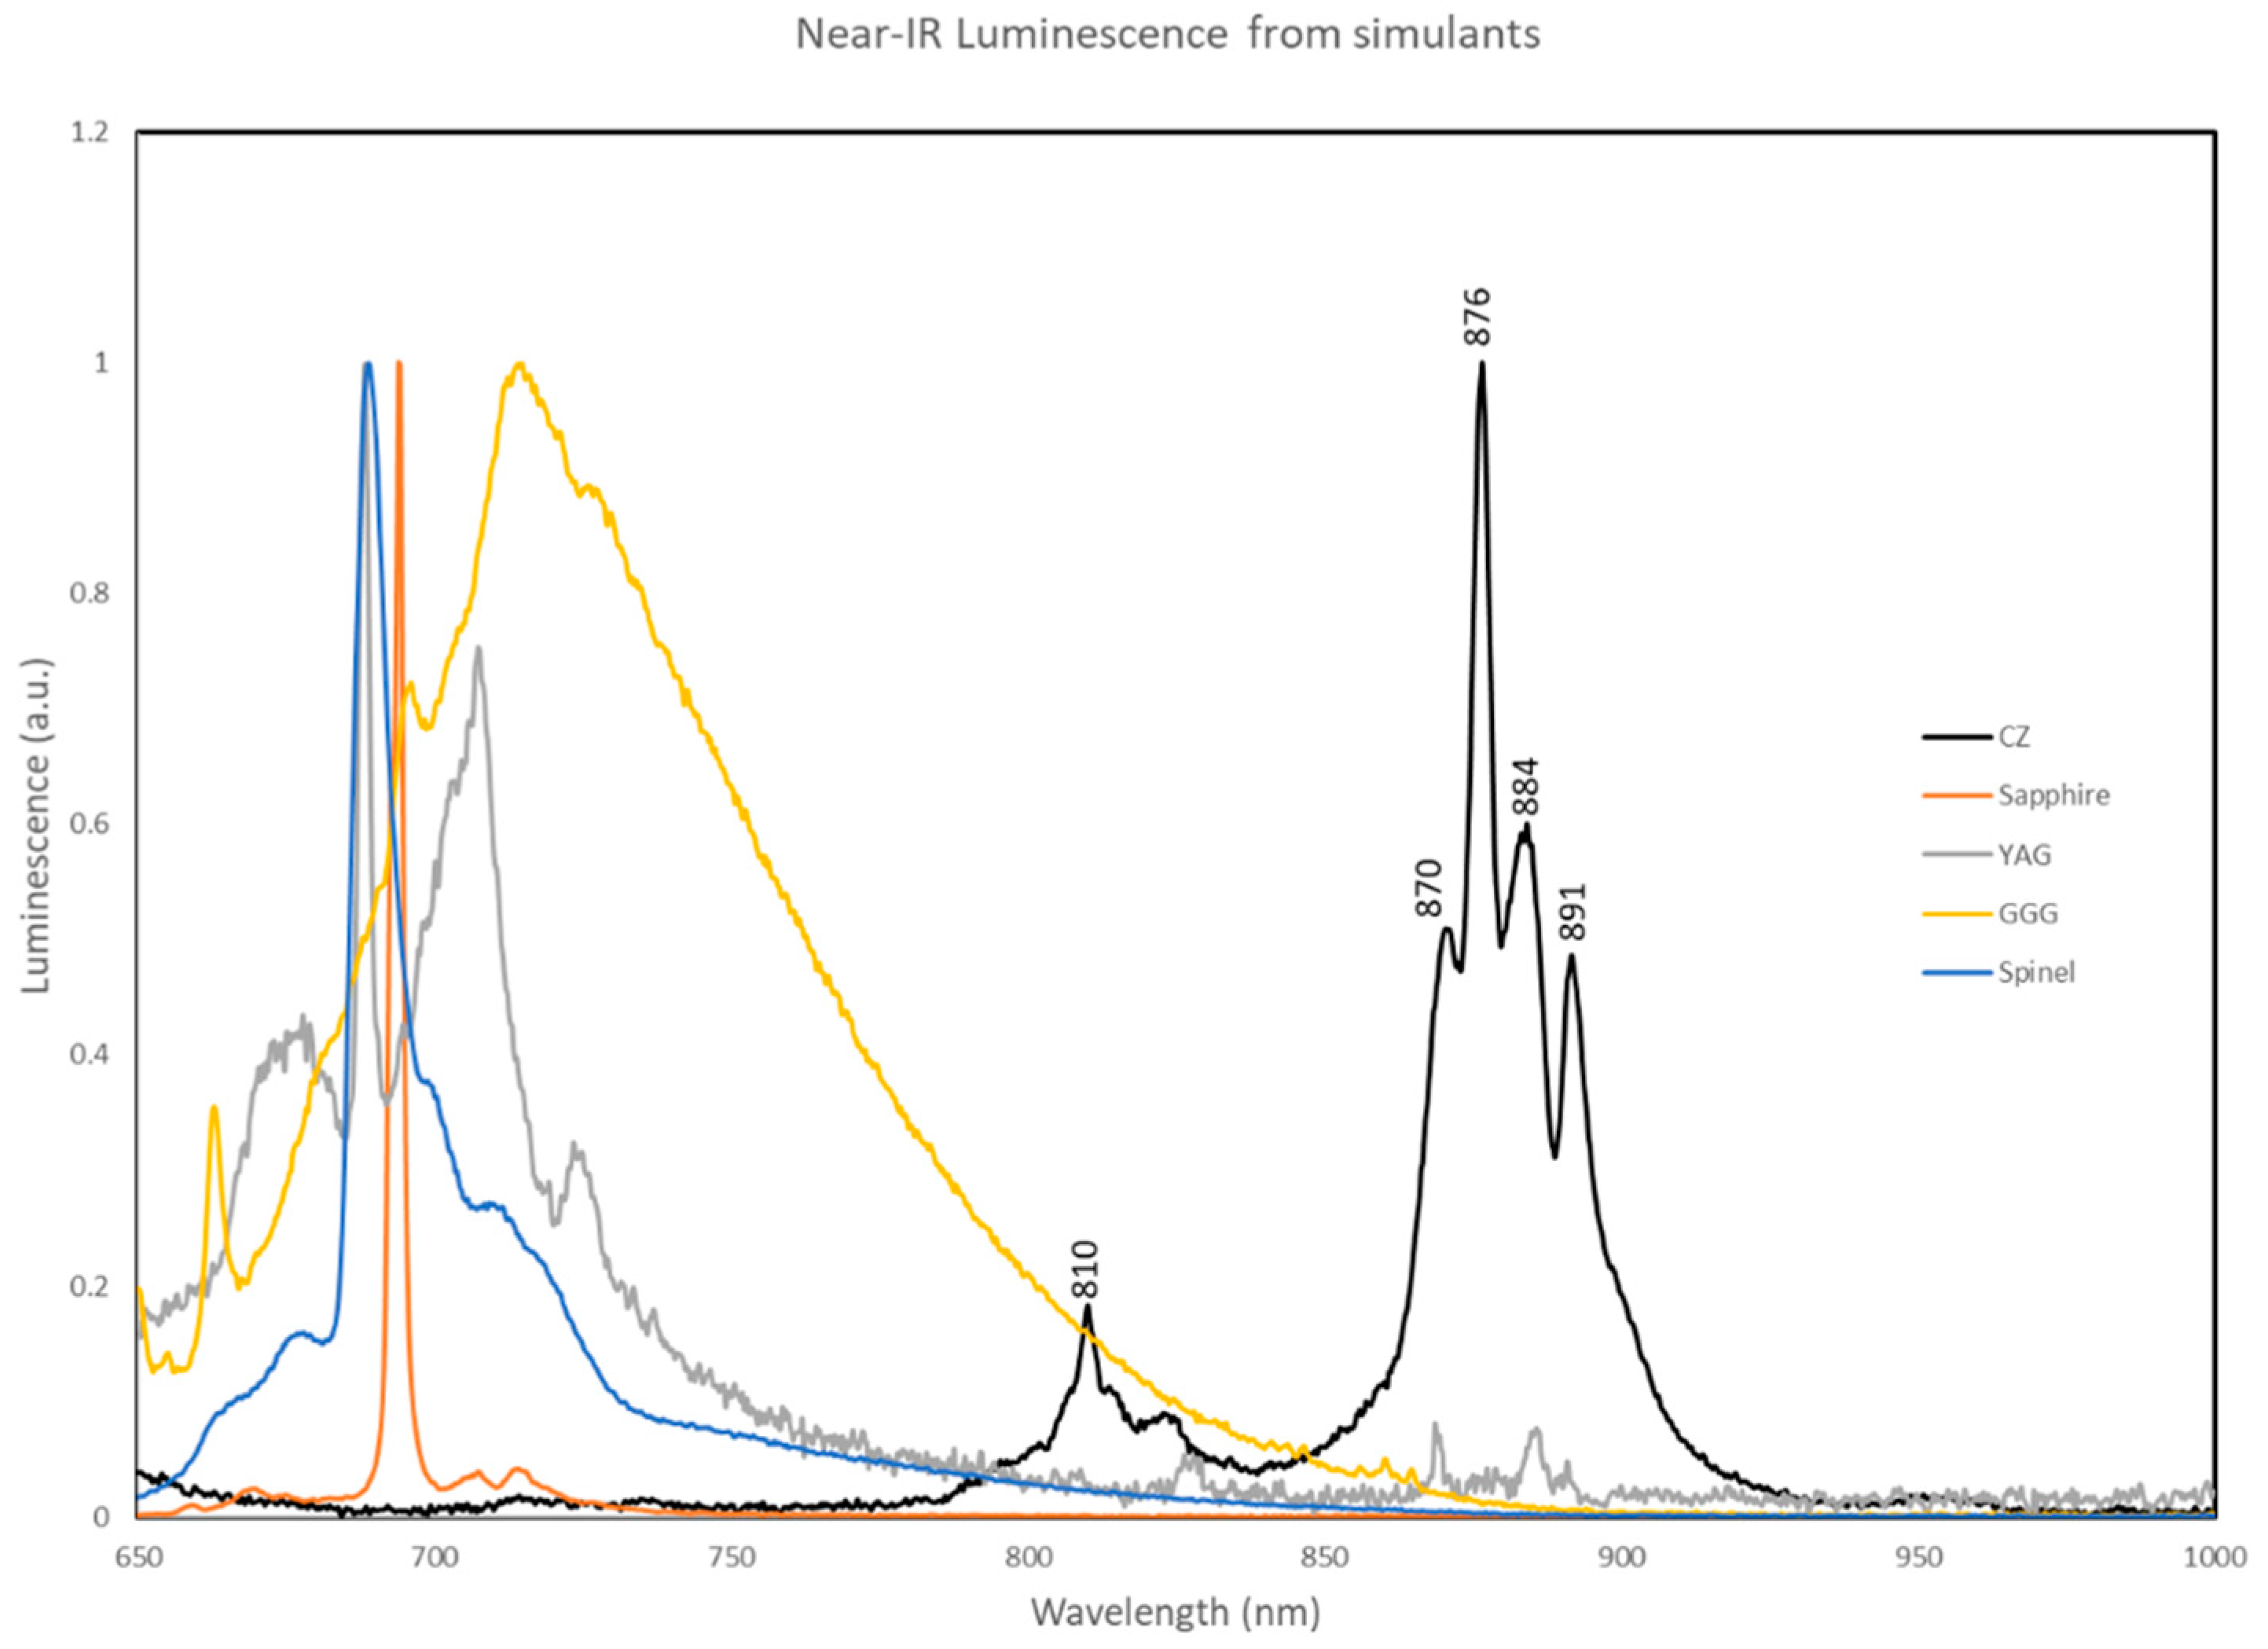
Figure 1 shows several near-infrared emission spectra from common simulants, together with an example of a CZ synthetic stone produced with this infrared feature. Referring to
Figure 1, it is believed that trace amounts of Nd
3+ and other lanthanides in colourless YSZ generated the near-infrared luminescence spectroscopically measured and rapidly imaged in our system.
2. Materials and Methods
Over 1000 commercially available colourless CZ stones varying in size from 1 mm to 5 mm were tested from several manufacturers: Swarovski (Wattens, Austria), Pandora (Copenhagen, Denmark), Messi Gems (Wuzhou, China), Ceres Crystal US (New York, US) and Rough Synthetic Stones Co., Ltd (Bangkok, Thailand).
Spectral data were collected by an Andor iStar DH320T-18U-E3 intensified CCD camera via a Horiba iHR-320 spectrometer (Horiba, Kyoto, Japan). The broad band excitation source used was a Hamamatsu Photonics L7685 xenon flash lamp spectrally filtered to 550 ± 25 nm output with temporal pulse width of ~3 μs at full width half maximum. Synchronisation with the flash lamp and camera was supplied by two externally generated TTL signals, with the lamp signal offset by 11 μs with respect to the camera signal to account for the difference in latency between the two devices. Delayed luminescence was recorded with a 1 s exposure time and accumulated for 40 averages resulting in a 40 s total acquisition time. Photon counting time-resolved decay data was collected by a Horiba Jobin Yvon IBH TBX-04 thermoelectrically cooled photomultiplier module via a Horiba iHR-320 spectrometer (Horiba, Kyoto, Japan) with excitation as above. Detector and flash lamp are triggered simultaneously with channels recording excitation pulses rejected and strobe operation at 30 Hz.
Sub-millisecond time-gated imaging of near-infrared luminescence was carried out using a Teledyne Dalsa Genie Nano M2050 monochrome area scan CMOS camera (Teledyne Technologies, Thousand Oaks, CA, USA), with IR-cut filter replaced with a glass window. Camera and green LEDs (LUMILED Luxeon Z colour line LXZ1-PM01 520–540 nm) were synchronised using the camera’s internal trigger, with the green LEDs offset pulse delay and duration set to 2.1 ms and 2 ms respectively, with camera exposure time set to 2 ms. Camera and white LEDs (LUMILED Luxeon Z ES LXZ2-6570) were synchronised as above, using the camera’s second internal trigger line with 0 ms offset pulse delay; pulse duration and camera acquisition time set to 10 ms.
Monochrome 8-bit images of 1296 × 1296 pixels were captured in real-time then transferred to a PC. All software was written in C# referencing the Teledyne Sapera LT SDK libraries, with a GUI built on Windows Presentation Foundation (WPF), to configure capture conditions and display images.
The optics layout for image capture of near-infrared luminescence from CZ comprised of mainly off the shelf optical components and mechanics and is shown in
Figure 2; the total cost is approximately 1000 Euros in parts. The imaging system allowed for sequential white-light and near-infrared luminescence imaging of CZ and natural diamond with a 25 mm diameter field of view. Variable aperture setting on the camera lens allowed the manipulation of depth of field for jewellery testing. The resolution of the system was tested at F#1.4 using a United States Air Force (USAF) resolution chart and Group 4 elements (16–28 cyc/mm) were visible throughout taking advantage of the aperture stop position to control astigmatism, leaving coma and field curvature aberrations to dominate towards the field edges. A combined custom green and white LED ring illuminator was employed for exciting near-infrared luminescence and for pseudo dark-field imaging respectively, the latter serving as a viewfinder to conveniently locate stones in the field of view. The use of white LEDs here was improvised, and in fact, an infrared LED ring illuminator would have been optimum to provide transmission through the long pass filter. The ring illuminator comprised of an inner ring of 34 mm diameter with 14 green LEDs, driven in series at approx. 1 A and an outer ring of 75 mm diameter with 24 white LEDs, in four parallel strings of 6 LEDs, each driven at approx. 300 mA, resulting in 1200 mA total drive current; in both cases, LEDs were equally spaced around their respective circumferences and positioned along the optical axis approximately 35 mm from the sample tray.
3. Results
3.1. Near Infrared Time-Resolved Decay Measurements
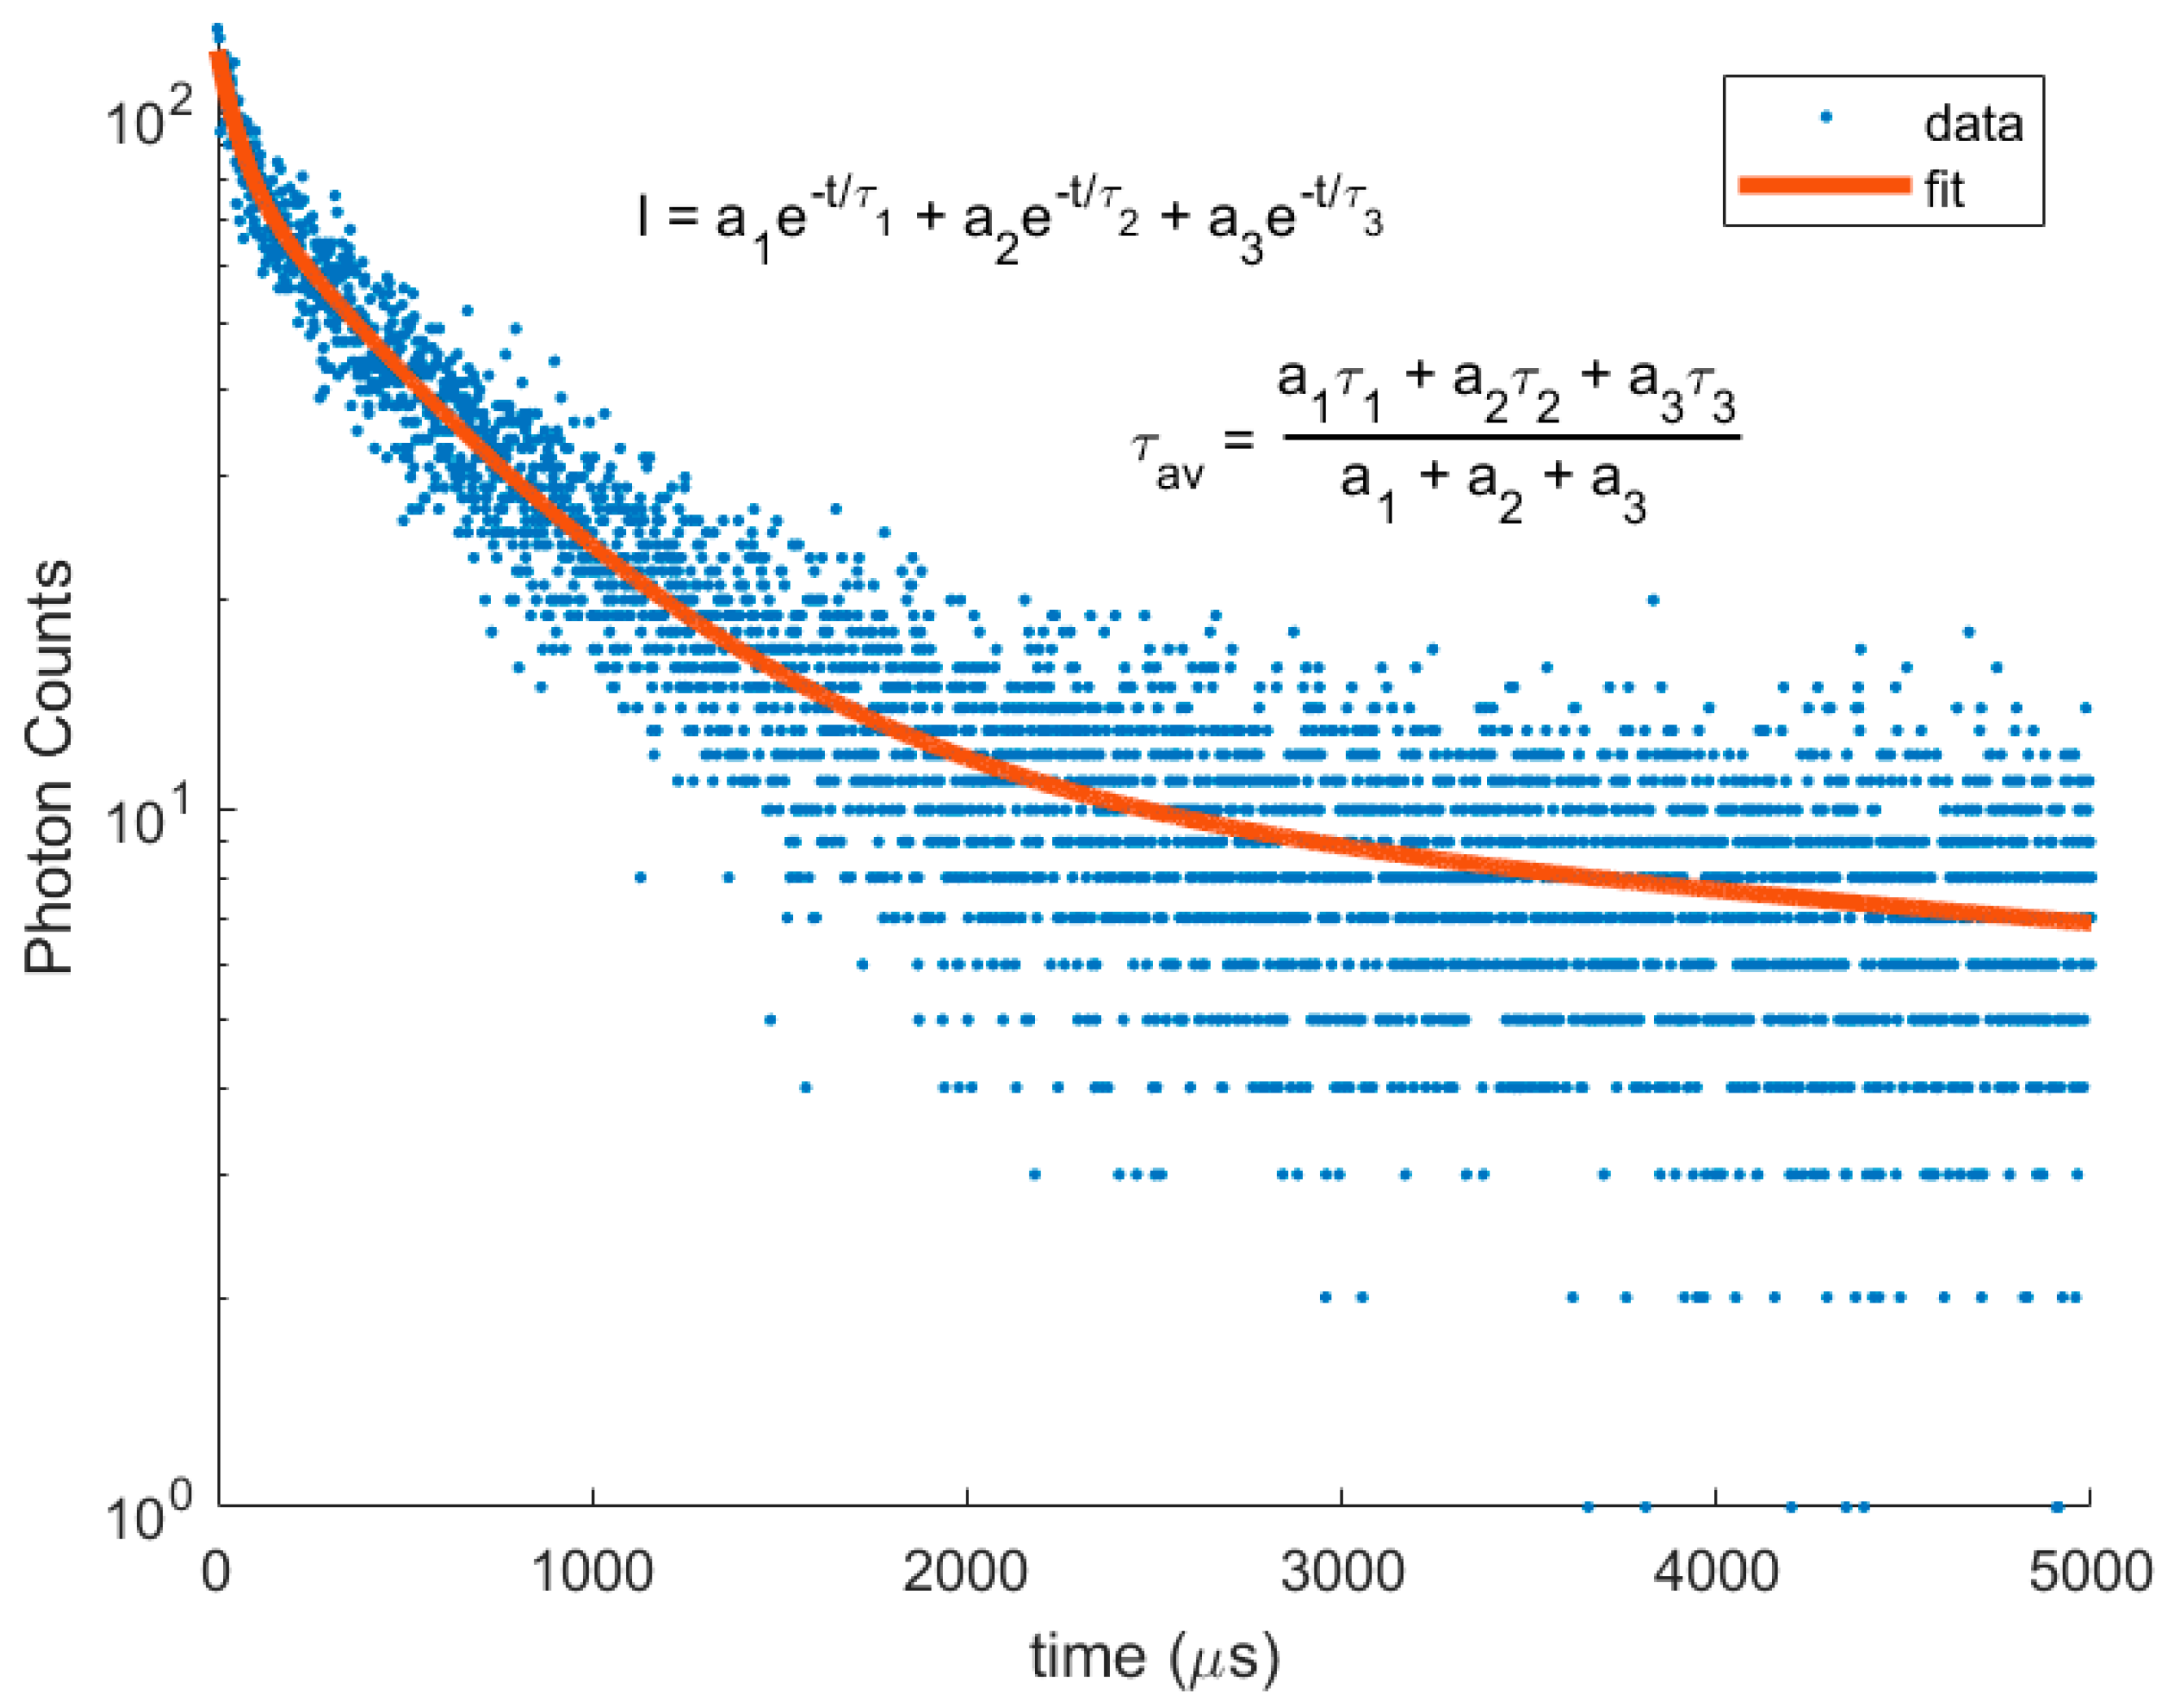
To determine optimum capture conditions for CZ near-infrared luminescence, we captured time-resolved decay data with spectral emission centred at 876 nm. A typical example of this luminescence decay for CZ, which is built up as a histogram of photon arrival times after excitation from a narrow pulse is shown in
Figure 3 (see materials and methods for details). The decay could be adequately fit to a decay model of three exponentials with lifetimes (τ) of τ
1 = 60 μs, τ
2 = 600 μs and τ
3 =10 ms respectively and weighted average lifetime τ
av = 950 μs with reduced chi
2 = 1.02. The data gave an indication that most of the luminescence from CZ (>70%) decayed within 2 ms after excitation, thus setting the acquisition time for our imaging system.
3.2. Near Infrared Time-Gated Imaging of Loose and Mounted CZ and Natural Diamonds
The start time for image capture, on the other hand, can be determined for example, by observing the typical emission characteristics of common colour centres in natural diamond, e.g., Nitrogen Vacancy in the negative charge state (NV
−). NV
− has a Zero Phonon Line at 637 nm and ‘fluorescence’ emission that extends into the near-infrared region of the spectrum overlapping with that of CZ. As the definition of fluorescence here is the signal produced concurrently with the excitation source, a lower limit on the exposure delay for CZ can be set after the LED pulse duration has ended. The combination of exposure delay and exposure time can, therefore, be optimised for CZ, with NV
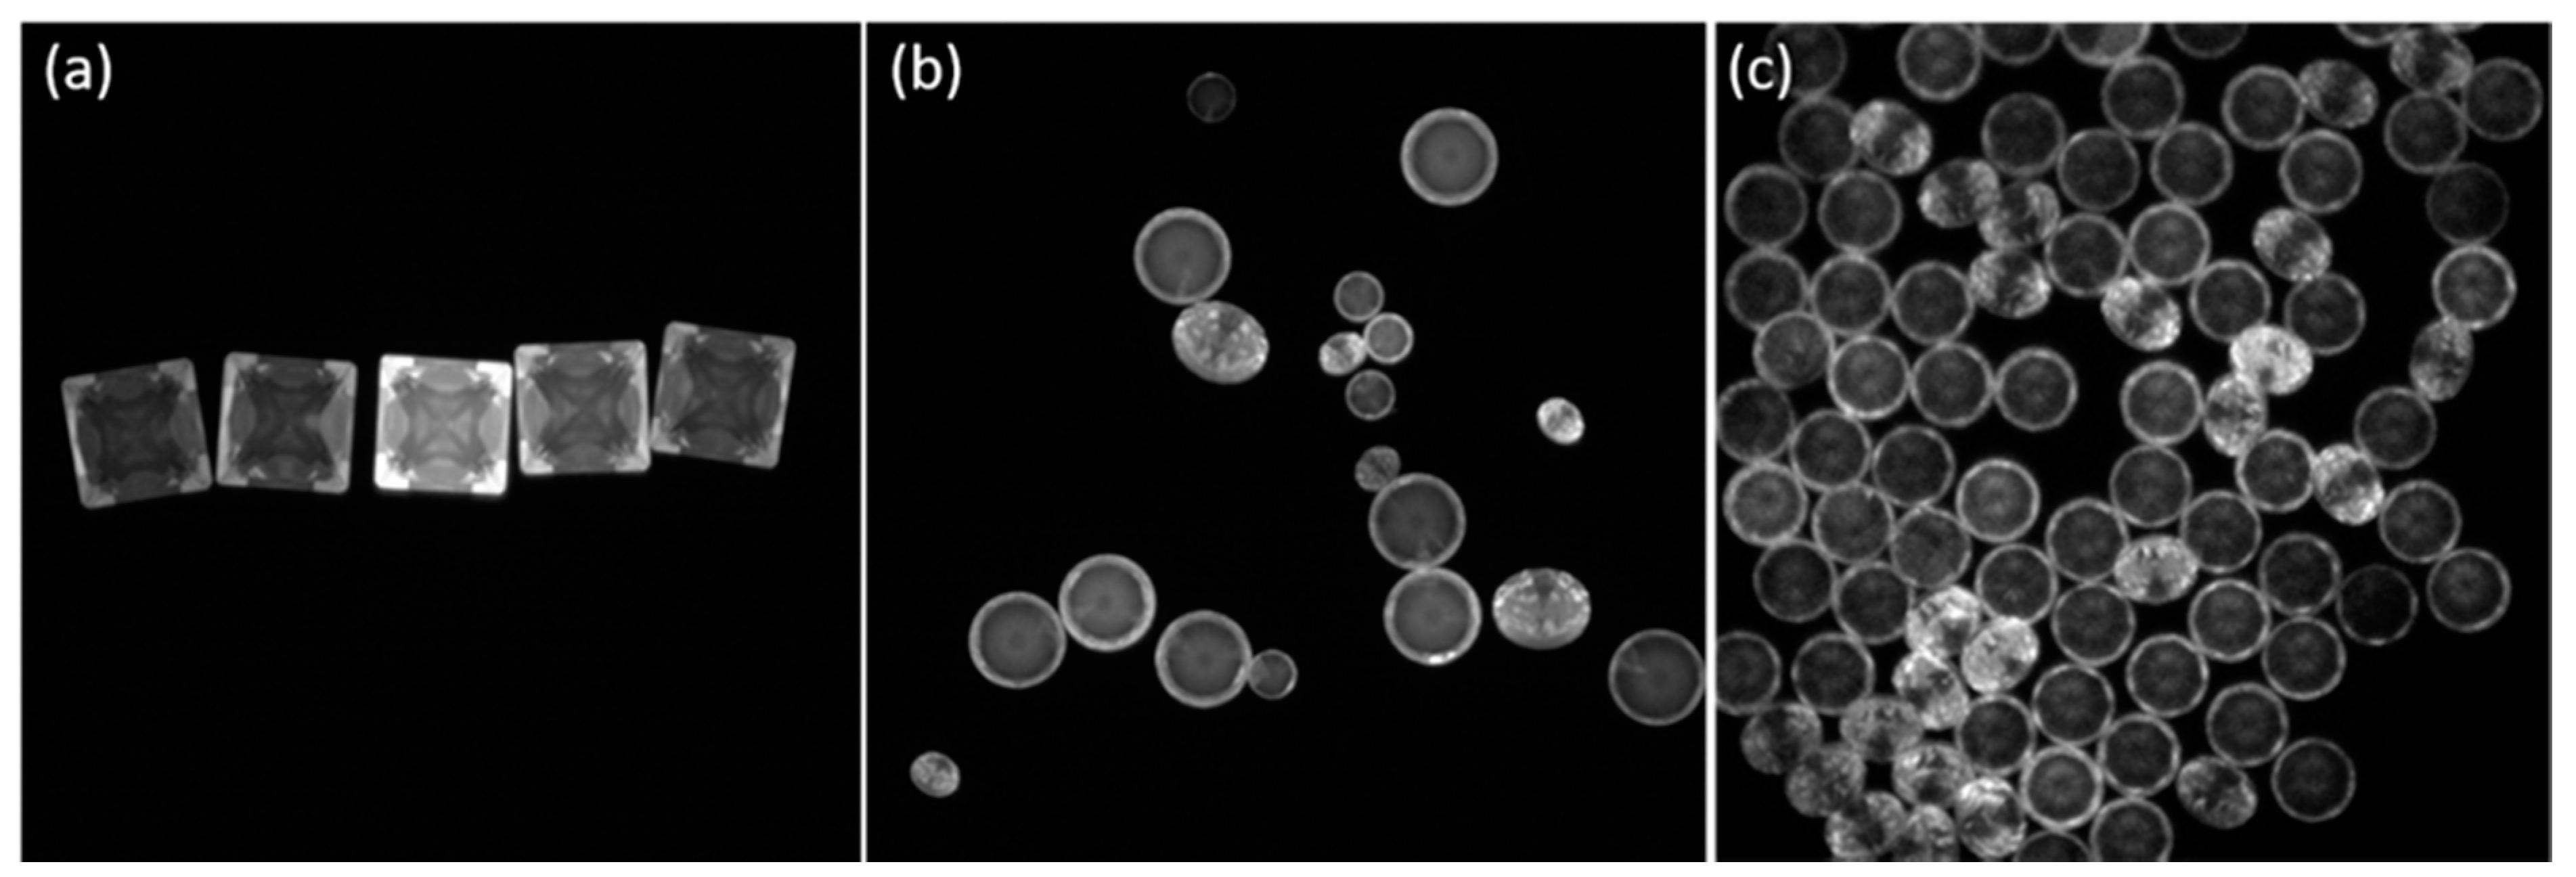
– signal conveniently filtered out in time as well as spectrally. Example real time infrared images of cut CZ with the delay before the imaging of 2.1 ms used to exclude near-infrared emission from diamonds and the image was captured over the next 2 ms, to efficiently capture the emission from the CZ stones, shown in
Figure 4 for three different sizes.
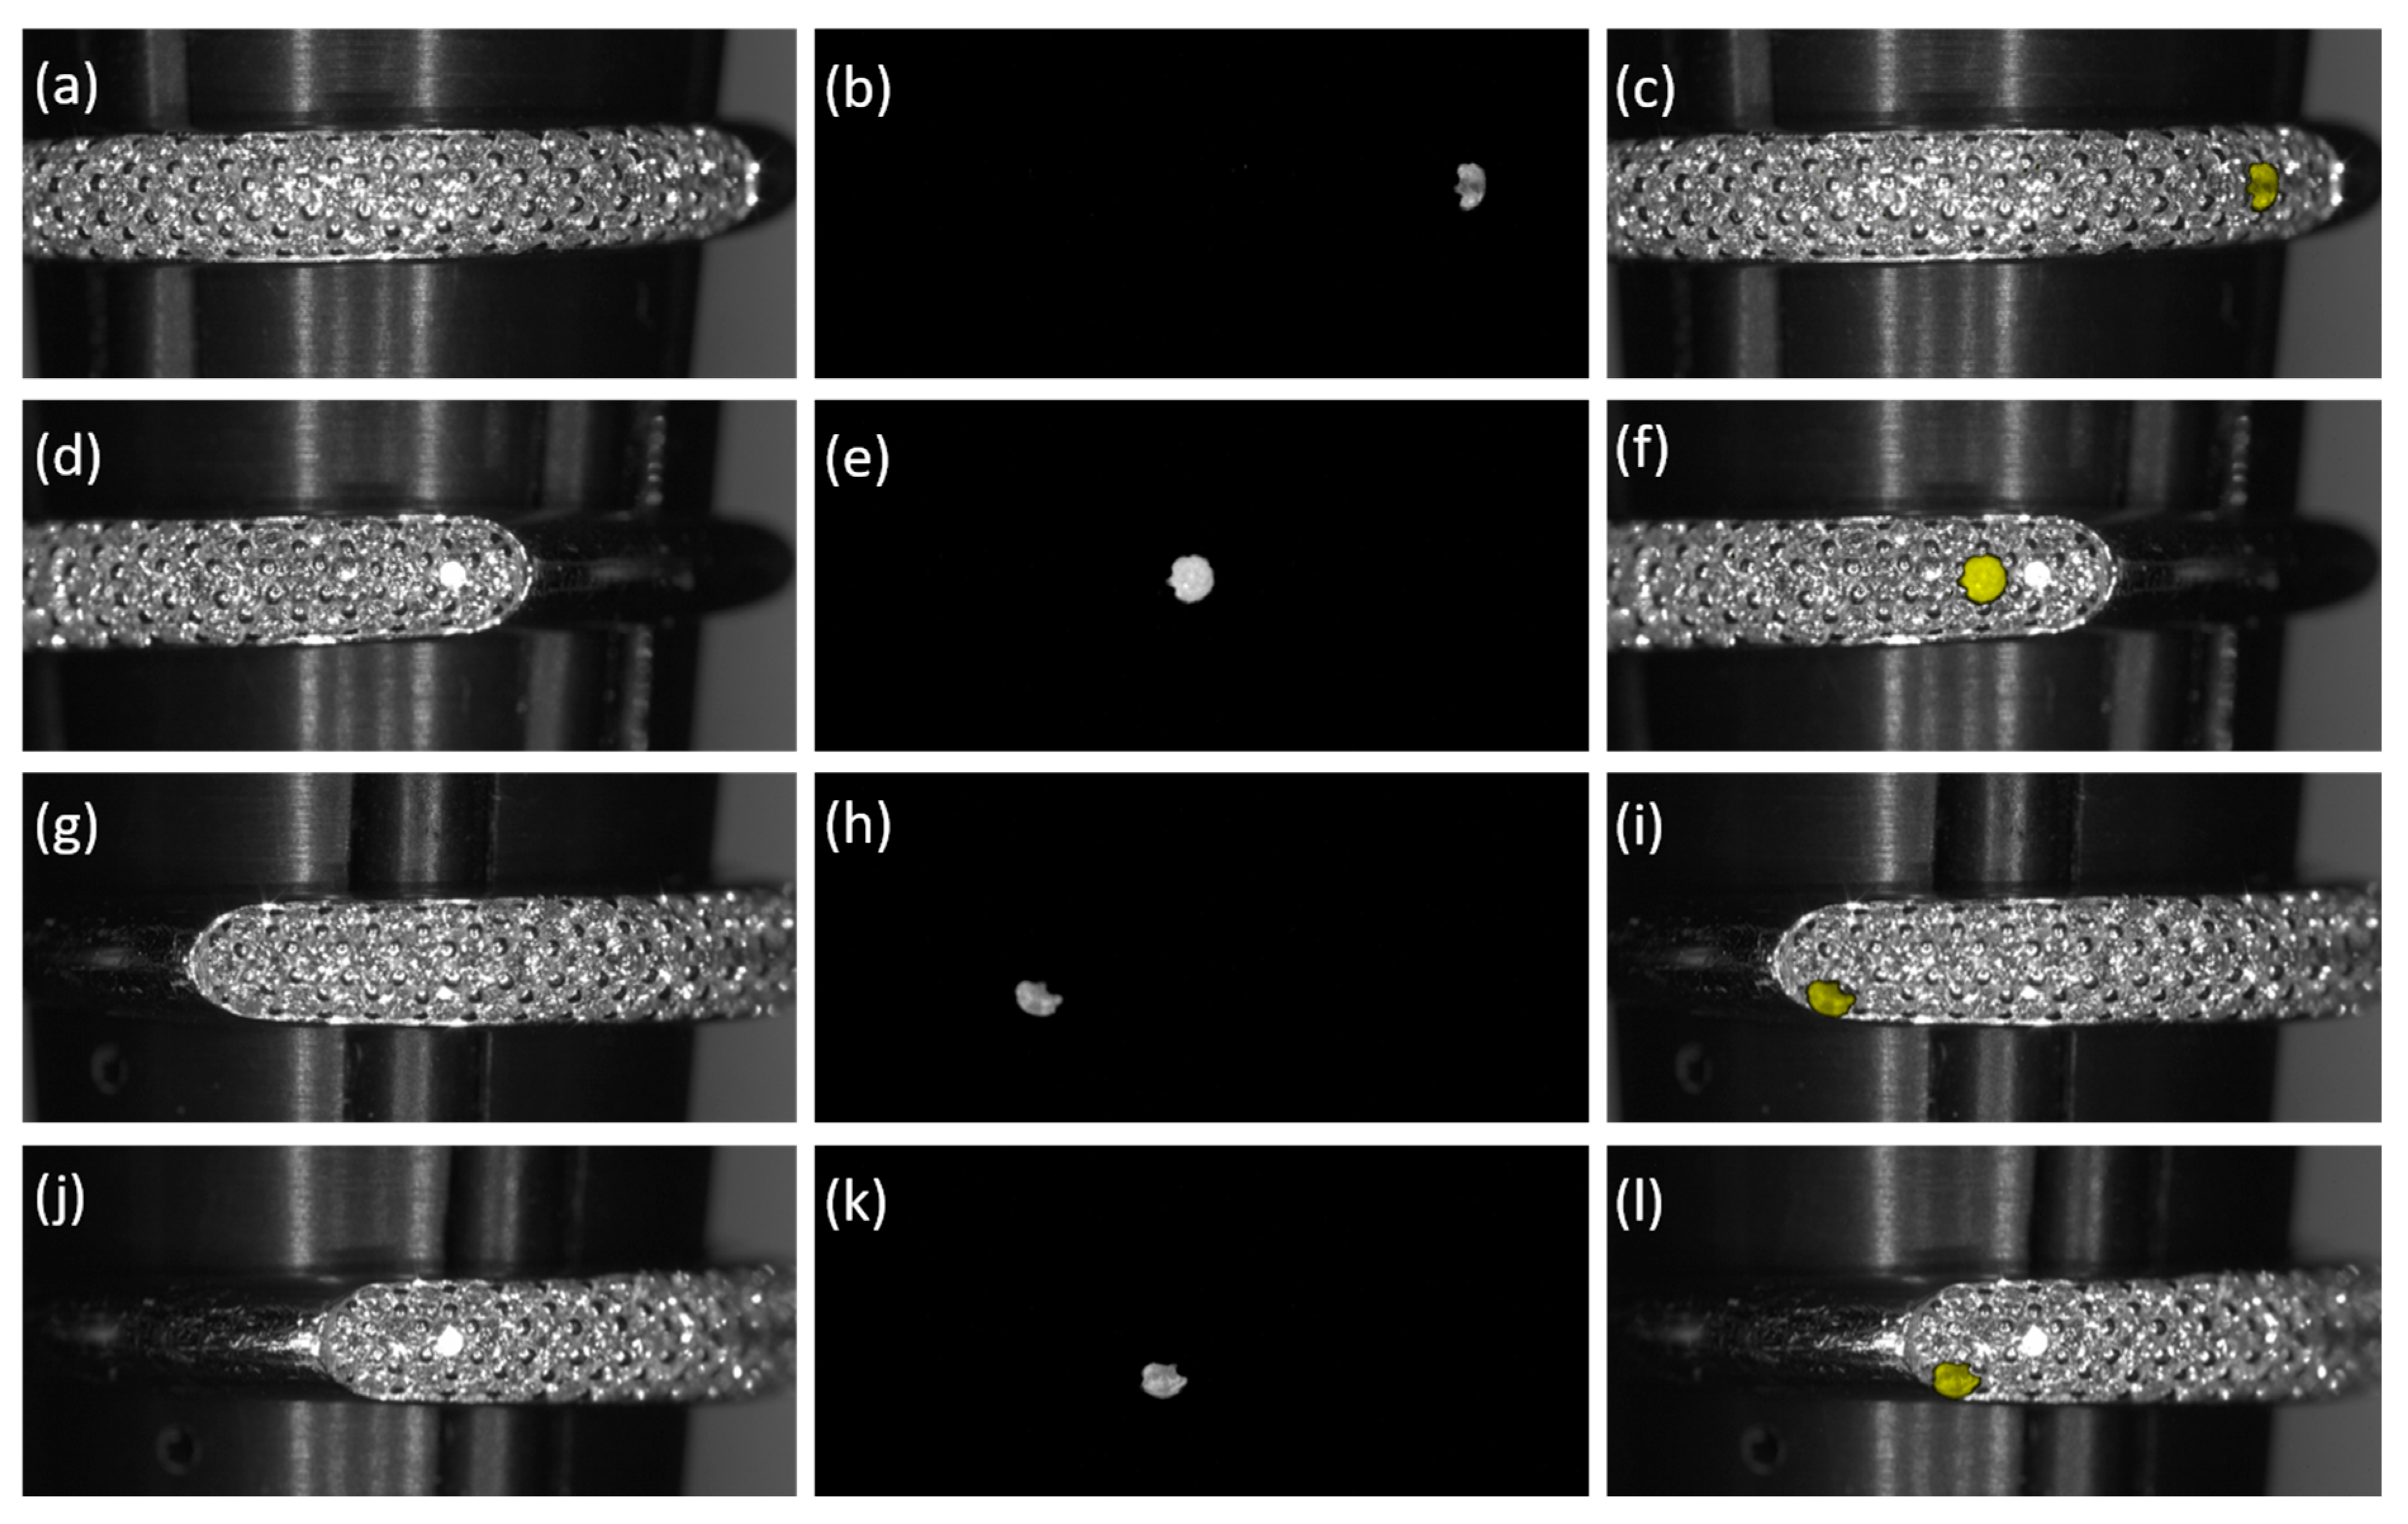
Real time measurements were also made on a diamond encrusted band adorned with ~0.01 ct diamonds and two CZ synthetic stones. In this situation, under normal white-light imaging, it is more challenging to pick out CZ from neighbouring diamonds, as shown in
Figure 5a,d,g,j.
However, with the infrared luminescence channel, it is more straightforward to ascertain that the band contains CZ as shown in
Figure 5b,e,h,k and for greater clarity in yellow false colour overlays to pinpoint its location within the piece, as shown in
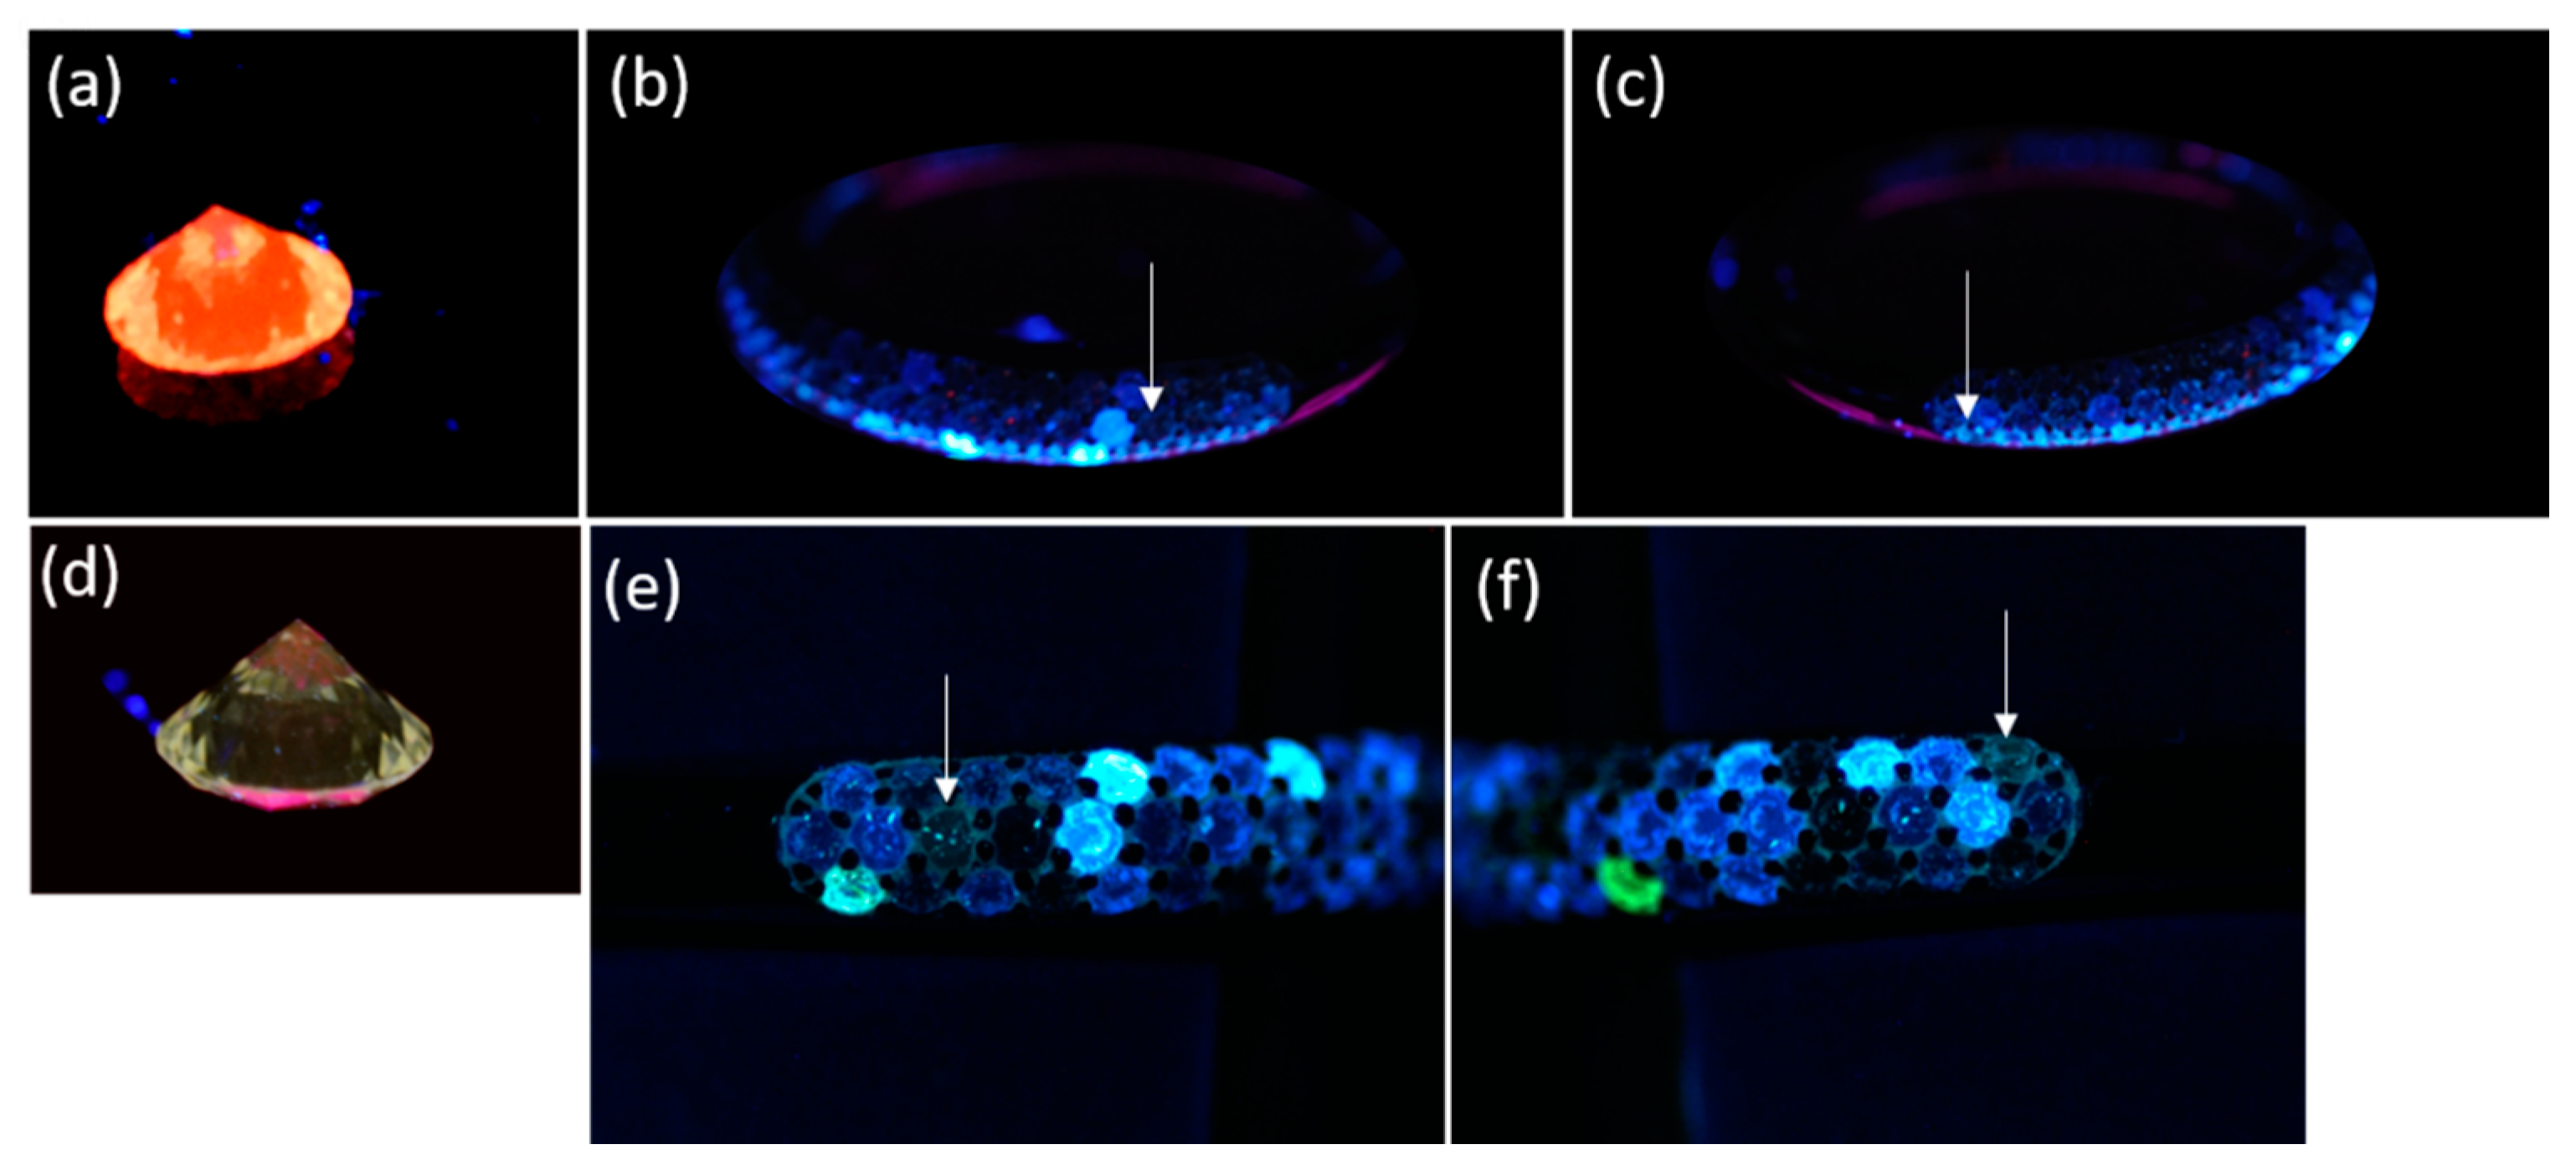
Figure 5c,f,i,l. A comparison of results of the same ring obtained with a typical gemmological LWUV (366 nm) lamp is shown in
Figure 6, together with a natural stone containing NV
- showing strong characteristic orange luminescence and loose CZ showing weak yellow luminescence. This shows the challenge of finding CZ in this band and the potential overlap emission from natural diamonds with emission from colour centres, such as NV
−, and thus require good spectral and temporal separation of these signals with the signature from CZ. In addition SWUV (<240 nm) illumination as shown in
Figure 6e,f produces week blue-grey luminescence, which is difficult to interpret against the background of both inert and strong-blue luminescence originating from the natural diamonds.
Furthermore, real time image capture with 2 ms exposure time is shown in
Figure 7 and strong colour centre emission NV
− and any residual excitation bleed through is effectively gated-out by the instrument leaving just the infrared emission from CZ after 2.1 ms exposure delay.
4. Discussion
Here, we have shown the application of a novel system based upon time-resolved, near-infrared luminescence imaging, that exploits the observed temporal and spectral characteristics of trace impurities in YSZ. It is believed that there was contribution to the near-infrared emission due to trace Nd3+ and other rare earth elements present in stabilised crystals including YSZ and YAG. Furthermore, the spectral and temporal approach to imaging means that the emission from colour centres present in natural diamond most prominently NV– can be more effectively blocked, thus reducing incorrect non-diamond referrals during the (automated) screening of large batches of small diamonds. It is advised, therefore, that any stone with strong infrared delayed emission should be treated with caution, when screening diamond parcels.
The imaging system was constructed from low cost instrumentation, ~1K Euros in parts: machine vision cameras and relatively skin and eye-safe LED lighting; with all synchronisation carried out by the camera’s internal trigger, negating the use of additional complex circuitry.
We believe one of the great advantages of this system is in its potential capability to rapidly screen and therefore differentiate CZ in jewellery containing very small diamonds (≤0.01 ct). In this case, spotting CZ by loupe and SWUV gemmological lamp to observe weak blue-grey luminescence is far more challenging, and more sophisticated conventional means of detection tend to be more expensive, impractical or time consuming to implement.
5. Concluding Remarks
In this study, it must be made clear that the colourless CZ used was arbitrarily purchased from several different suppliers and in many cases, it was not straightforward to obtain information on the melt composition from the producer of the raw material. Of the producers of the raw material that did divulge the stabiliser used, it was invariably Y2O3, which was verified by 25 kV accelerating voltage and 10 nA probe current EVO50 Scanning Electron Microscopy (Carl Zeiss AG, Jena, Germany) with INCA Energy Dispersive (X-ray) Spectrometer (Oxford instruments, High Wycombe, UK). Therefore, the method described therein will be sensitive to at least YSZ, which is fortunately the main bulk of production of colourless CZ, yielding high quality material well suited for imitation diamond. Furthermore, there is evidence that the strong infrared luminescence also had contribution from trace dopants in the melt i.e., heavy rare earth elements such as Nd3+, as measured from the emission spectrum.
A clear limitation of this method is its inability to screen out all simulants, although this might seem a very significant drawback, the extremely low value of CZ and its optical properties make it make it one the most attractive diamond simulants on the market. As shown in the results from our studies, the method described can be more effective than traditional methods using UV gemmological lamps for detecting CZ, particularly in jewellery with very small diamonds. Therefore, such a technique could be used to complement conventional screening techniques and existing commercial verification instrumentation, perhaps as a quick pre-screen to check for CZ first.
Lastly, in the context of the present-day market, the focus of natural diamond verification instruments is to screen out synthetic diamonds, which is seen as, by far, the largest threat to the industry. Although this is the case, many of the larger jewellery manufacturers still see simulants as a significant threat (again particularly in the small sizes) in their pipeline, as in a lot of cases, CZ is deliberately used in jewellery modelling as a substitute for diamond to test settings etc. CZ has insignificant market value as compared to diamonds, and therefore it is deemed necessary to work in quality control measures, such as those described here into our processes, in order to maintain and sustain a high level of confidence in the industry.

 and
and 


