


Abstract
We use a stacking method to study the radial light profiles of luminous red galaxies (LRGs) at redshift ∼0.62 and ∼0.25, out to a radial range of 200 kpc. We do not find noticeable evolution of the profiles at the two redshifts. The LRG profiles appear to be well approximated by a single Sérsic profile, although some excess light can be seen outside 60 kpc. We quantify the excess light by measuring the integrated flux and find that the excess is about 10%—a non-dominant but still nonnegligible component.
Export citation and abstract BibTeX RIS
1. Introduction
Studies have found evidence that there exists a diffuse envelope of stars which surrounds both early and late type galaxies (e.g., Sackett et al. 1994; Zibetti et al. 2004; Ibata et al. 2007; Tal & van Dokkum 2011; Trujillo & Bakos 2013; D'Souza et al. 2014; Duc et al. 2015), and, to a greater extent, the central galaxies of galaxy clusters (e.g., Schombert 1986; Zibetti et al. 2005; Burke et al. 2015; Zhang et al. 2019). These diffuse stellar envelopes provide clues to how frequently galaxies interact, and how the galaxy interactions affect the galaxy stellar distribution (Font et al. 2011; Cooper et al. 2013; Elias et al. 2018). Unfortunately, their faintness and the effect of the observational point-spread function (PSF) mean that it is often difficult to quantify these diffuse stellar distributions accurately (de Jong 2008; Zackrisson et al. 2012; Sandin 2014, 2015), and their detection sparked debates.
We assess the diffuse stellar extent of luminous red galaxies (LRGs) and examine its redshift evolution between redshift ∼0.25 and ∼0.625. We use a stacking method with optical images (Zhang et al. 2019) from the Dark Energy Survey (DES) to acquire high signal-to-noise LRG Surface Brightness (SB) measurements out to a radius of 200 kpc. We do not notice significant differences in the LRG profiles between redshift ∼0.25 and ∼0.625. This analysis assumes a ΛCDM cosmology model with the Hubble parameter h = 0.7 and the matter density parameter Ωm = 0.3.
2. Data and Methods
The LRG sample used in the analysis is selected from DES Year 1 data by the redMagic algorithm (Rozo et al. 2016), which is based on comparing galaxy colors to spectroscopic LRG samples. The algorithm delivers excellent galaxy photometric redshift estimation with a median scatter of 0.017(1 + z), and provides the fiducial sample for the DES galaxy clustering analysis (Elvin-Poole et al. 2018). We study the LRGs in a low redshift range with photometric redshifts between 0.24 and 0.26 (z ∼ 0.25), and in a high redshift range between 0.62 and 0.63 (z ∼ 0.625). We analyze the r band SB profile of the z ∼ 0.25 LRG sample, and the i profile of the z ∼ 0.625 sample. The redshifting from ∼0.25 to ∼0.625 places the DES r band at a similar rest-frame wavelength range with the i band, and thus eliminates any need to perform K-corrections when examining redshift evolution.
Our methods of preparing LRG images from DES Year1 to 3 observations and measuring their SB profiles closely follow the procedures in Zhang et al. (2019). In total, we stack 201 LRGs at z ∼ 0.25, and 1381 LRGs at z ∼ 0.625. To reduce noise in the measurements, we also eliminate those LRGs close to bright stars or nearby galaxies as described in Zhang et al. (2019). The measured LRG SB profiles are fitted to Sérsic models (Sérsic 1963) considering the stacked, extended DECam PSF averaged over DES Y3 observations. Figure 1 shows the stacked LRG r-band SB profile at z ∼ 0.25 and the i-band profile at z ∼ 0.625. The latter is corrected to z ∼ 0.25 by the differences in luminosity distance moduli and angular-to-physical distance conversion.
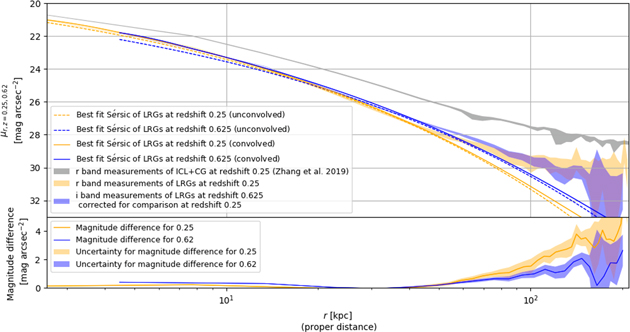
Figure 1. The upper panel shows the measured LRG SB profiles at redshift ∼0.25 and ∼0.625. The blue and red shaded regions indicate the corresponding uncertainties. The solid and dotted lines show the same best-fit Sérsic models with and without including the effect of PSF. The lower panel shows the residual between the data and the best-fit models. For comparison, we also overplot the intra-cluster light and central galaxy (ICL+CG) measurements at z ∼ 0.25 in Zhang et al. (2019) as the gray shaded region.
Download figure:
Standard image High-resolution image
3. Results
We measure the LRG SB profiles with high S/N up to 200 kpc at both z ∼ 0.25 and z ∼ 0.625, and we do not notice significant evolution of the profiles between these redshifts, as they are consistent within 2σ. We fit a single Sérsic model, although the data only seem to follow this model within ∼60 kpc, and less well at z ∼ 0.625. At z ∼ 0.25, the LRG SB profile is fitted by a Sérsic model with index  and effective radius
  kpc. At z ∼ 0.625, the fitted Sérsic model has an index of
  and an effective radius of
  kpc. The model fitting results are not sensitive to PSF convolution. Beyond 60 kpc, both the z ∼ 0.25 and z ∼ 0.625 LRGs show an excess of light above the Sérsic models.
We derive the integrated LRG fluxes within 200 kpc, which are similar at z ∼ 0.25 and z ∼ 0.625 (corrected to the observer frame at z ∼ 0.25) with values of 17.96 ± 0.07 mag and 17.93 ± 0.03 mag respectively. The integrated flux in the annulus between radius 60 and 200 kpc makes up 11.6% of the total LRG flux within 200 kpc at z ∼ 0.25 , or 9.7% of the total flux at z ∼ 0.625. In terms of the best-fitting Sérsic models, the fluxes contained in the actual measurements but not in the models make up 10.0% and 5.8% of the total fluxes within 200 kpc at z ∼ 0.25 and z ∼ 0.625 respectively. We conclude that the extended light beyond 60 kpc, or the excess light not modeled by a single Sérsic model, is not dominant but nevertheless still a nonnegligible LRG component.
A similar stacking analysis of LRGs was reported by Tal & van Dokkum (2011) using SDSS data. They find that a Sérsic model with n = 5.8 and re = 13.6 kpc fits the LRG profile well at z ∼ 0.34 to ∼100 kpc, which is different from our results. We suspect that the image processing methods, especially in terms of sky background estimations (Blanton et al. 2011; Bernstein et al. 2017), may have played a role. We also consider how our LRG measurements differ from the intra-cluster light and central galaxy (ICL+CG) measurements at z ∼ 0.25 in Zhang et al. (2019). Unsurprisingly, the ICL+CG profile is brighter and its shape is more extented than the LRGs, as anticipated by the inside-out galaxy formation scenario in which CG starts out as a luminous compact galaxy and grows by merging in its peripheral regions (e.g., Laporte et al. 2013; Ragone-Figueroa et al. 2018). We have also analyzed the LRG g − r (z ∼ 0.25) and r − i (z ∼ 0.625) colors in our analysis, but unfortunately do not have enough signal-to-noise outside 20 kpc to draw robust conclusions.
This note is prepared under the DES publication guidelines. 41 A standard DES acknowledgment applies.