Permeability and Adsorption–Desorption Behavior of Rare Earth in Laboratory Leaching Tests
by
Xiaojun Wang
1,2, 
Hao Wang
1,2,
Can Sui
1,2,
Lingbo Zhou
1,2,
Xiao Feng
1,2,*,
Chengguang Huang
1,2,
Kui Zhao
1,2,
Wen Zhong
1,2 and
Kaijian Hu
1,2,* 1
Jiangxi Key Laboratory of Mining Engineering, Jiangxi University of Science and Technology, Ganzhou 341000, China
2
School of Resources and Environment Engineering, Jiangxi University of Science and Technology, Ganzhou 341000, China
*
Authors to whom correspondence should be addressed.
Minerals 2020, 10(10), 889; https://doi.org/10.3390/min10100889
Submission received: 4 August 2020
/
Revised: 3 October 2020
/
Accepted: 5 October 2020
/
Published: 7 October 2020
(This article belongs to the Special Issue Interactions of Chemical Reagents with Clay Minerals)
Abstract
:In order to investigate the influence of the ion exchange process on the permeability of rare earth ore bodies in the leaching process, a laboratory-scale comparative experiment with ammonium sulfate solution and deionized (DI) water as leaching solutions is conducted. Compared with the DI water leaching test, the permeability coefficient of the rare earth ore sample leached by the ammonium sulfate solution gradually decreases at the beginning and then increases with the completion of leaching. The physical and morphological evolutions of rare earth ore samples in this comparative experiment are also monitored by nuclear magnetic resonance and scanning electron microscopy. It is concluded that the change in the permeability coefficient arises from the adsorption–desorption of a large number of clay microparticles, resulting in a dynamic evolution of pore structures. Further mechanism analysis suggests that the change in internal ionic strength caused by ion exchange and leaching solution seepage promotes the adsorption–desorption behavior of clay microparticles.
1. Introduction
The ion-adsorption type rare earth deposit is a unique type of heavy rare earth element deposit. This type of deposit is formed by granite or volcanic rock after years of weathering, and it is mainly composed of clay minerals, quartz sand, feldspar, etc. [1,2]. Since rare earth ions are mainly adsorbed on clay minerals, such as halloysite, kaolinite and montmorillonite in the deposit, chemical technology is the only method for extraction of rare earth elements from the ion-adsorption type rare earth deposit [3,4]. At present, in situ leaching is the main mining method for this type of rare earth deposit for its great advantages in terms of mining costs and environmental protection [5]. However, there is a low recovery yield of rare earth and long leaching time when employing the in situ leaching method [6]. To enhance the leaching efficiency, the study of the permeability of the ion-adsorption type rare earth deposit has received much attention from researchers.
According to the sieving experiment and theoretical analysis, Wu, et al. proposed that ion-adsorption rare earth mineral particles have the characteristic of a B-type structure [7]. Thus, they believed that when the hydraulic gradient reaches a critical value, fine particles inside the ore body can be driven to migrate and may cause pore blockage [8]. On the above basis, Yin et al. [9] conducted a permeability comparison test by controlling the proportion of clay particles and found that the content of clay particles has a great influence on the permeability of ion-adsorption type ore samples. Based on the test data, they established a modified model of the permeability coefficient of rare earth ore bodies. Luo et al. [10] investigated the permeability of rare earth ore samples with a home-made variable water head infiltration setup and suggested the migration of microparticles under the hydraulic gradient causes the change in the permeability coefficient of ore bodies. The above experiments prove the correctness of the theoretical research of Wu et al. But Zuo et al. [11] proposed using an electric field to enhance the seepage capacity of leaching solutions and proved that the permeability of the deposit is proportional to the strength of the electric field. This fully shows that the factors affecting permeability are not limited to the physical properties of the deposit, and we can also consider how the permeability of the deposit is affected from multiple aspects [12].
These studies mentioned above mainly focus on the influence of external physical parameters, such as hydraulic gradient, particle migration and electric field, on the permeability of rare earth deposits. However, during the leaching process, a large amount of ion adsorption and desorption results in the transition of ion valence and the fluctuation of ionic concentration, which may change the permeability of the ore body. Liu et al. [13] reported that, once adsorbed by a clay liner, lead and cadmium cations form poorly soluble precipitates, hindering the solution seepage in the clay medium. Tang et al. [14] studied the permeability of Cu2+-adsorbed silt clay, indicating that the permeability increased with an increase in ion concentration of the solution. Yong et al. [15] also proved that the ion concentration is the main factor affecting the permeability of the material through a leaching test by using mixtures of Cu(NO3)2 and Na2CO3 as leaching solutions. Li et al. [16] observed the effect of K+ on the permeability coefficient exceeds Ca2+ through flexible-wall permeameter tests. Zhang et al. [17] studied the permeability of clay saturated by heavy metal cations and concluded that the permeability of the clay increases in proportion to the increase in ion concentration in the permeant fluid. These studies have shown that the ion concentration and valence transition have a significant effect on the permeability of clay.
When employing the in situ leaching method to extract ion-adsorbed rare earths in the deposit, the injection of active cations and deportation and migration of rare earth cations cannot be avoided. However, the influence of the leaching of the ion-adsorption type rare earth ore on the permeability of rare earth ore bodies and its mechanism has not been reported. In this paper, a comparative experiment was designed to reveal the effect of the leaching process on the permeability of rare earth ore bodies. The mechanism of changes in the permeability coefficient was also discussed. The objectives are to improve the leaching ability of ion-adsorption type rare earth ore bodies, shorten the leaching time, and increase the recovery rate of the rare earth.
2. Methodology
2.1. Sample Preparation
2.1.1. Experimental Materials
The undisturbed ore sample was obtained from Zudong mine (located in Longnan County, Jiangxi Province, China) by drilling. According to the needs of experimental research, the undisturbed sample was tested and analyzed. An X-ray fluorescence spectrometer (Axios max. PANalytical B.V., Almelo, Netherlands) was used to determine the elemental composition of the ore powder, and the result is shown in Supplementary Table S1. In order to separate coarse and fine particles in the undisturbed sample, use a 200-mesh standard sieve and wash the fine particles with water. The separated coarse particles were dried in an oven at 65 °C for 24 h, then, sieving them into fractions with different particle sizes (>5 mm, 1~5 mm, 0.5~1 mm, 0.1~0.5 mm, 0.075~0.1 mm), the particles less than 75 μm were analyzed by a Winner 2000 laser particle size analyzer (Jinan Winner Instruments Co., Ltd., Jinan, China). The results are summarized in Table 1. The physical parameters of the raw ore sample including density, moisture content, void ratio, and specific gravity were measured, and these are listed in Table 2.
2.1.2. Sample Remodeling
In order to keep the physical properties and chemical composition of the remolded ore sample consistent with the undisturbed ore sample, the rare earth ore samples used in this study were prepared with the following steps: Step 1: according to the particle size distribution of the undisturbed ore sample, the dry ore samples of different particle sizes that have been sieved were weighed and mixed evenly. Step 2: the calculated amount of water was added to the mixed dry sample obtained in the previous step to ensure that the difference in moisture content between the remodeling ore sample and the undisturbed ore is less than ±1%. Step 3: After that, the mixed ore sample containing water was filled into a cylinder mold with inner diameters of 50 mm and then punched to reach the required height and density. According to the requirements of the column leaching setup and the nuclear magnetic resonance (NMR) used in this study, the remodeled rare earth ore cylinder samples were shaped into two different heights: 100 mm and 60 mm. Two pieces of 100 mm tall samples and eighteen pieces of 60 mm tall samples were prepared. Samples with a height of 100 mm were used in permeability coefficient analysis, and the other type of samples was used in NMR analysis, rare earth oxide (REO) content analysis, and scanning electron microscopy (SEM) analysis. The physical parameters of remodeled rare earth samples were also measured; these are listed in Table 3.
2.2. Experimental Apparatus
2.2.1. Column Leaching Test
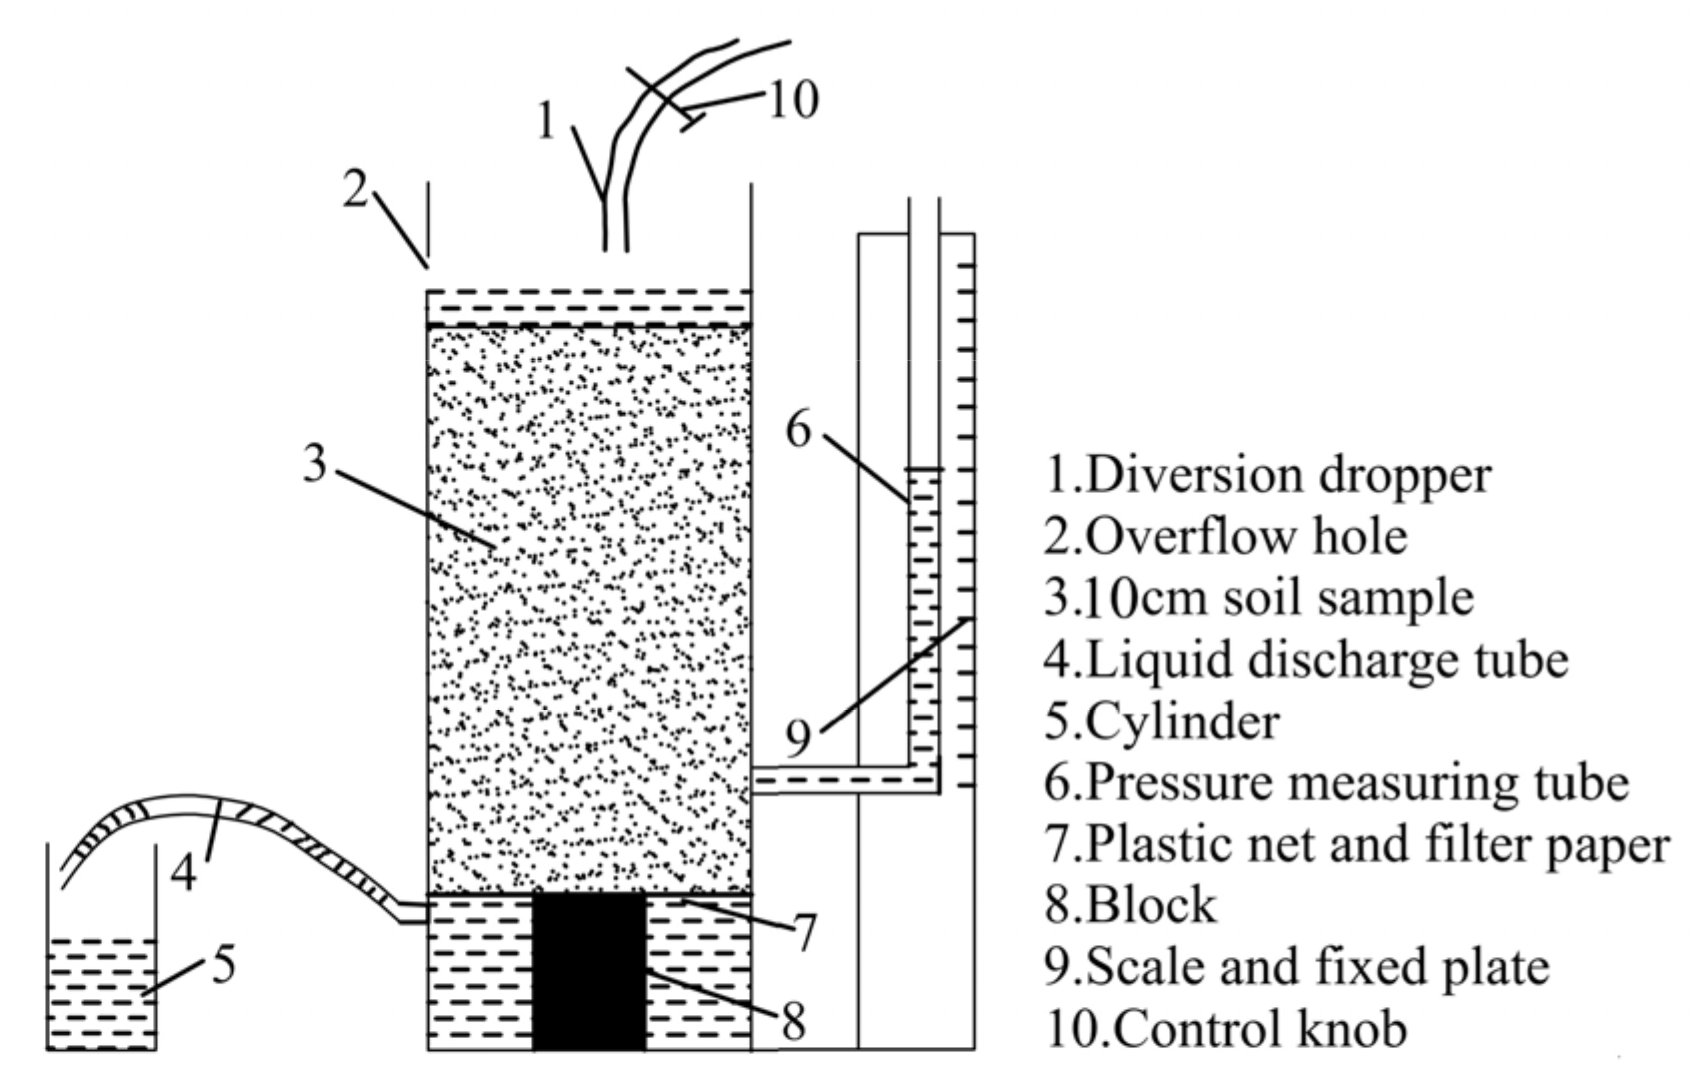
Since rare earth ions are mainly adsorbed on the surface of clay minerals in the form of hydrated ions or hydroxyl hydrated ions, many electrolytes can be selected as leaching reagents, but water cannot [1]. Considering the cost and efficiency of leaching, most ion-adsorption type rare earth mines currently use (NH4)2SO4 solution with a concentration of 2% by weight (w/w) to leach [18]. With the aim of investigating the effect of ion exchange and migration in the leaching process on the permeability of the rare earth ore, a comparative experiment with DI water and 2% w/w (NH4)2SO4 solution as the leaching solution was conducted. As DI water does not contain active cations, there is no ion exchange in its leaching process. Contrarily, the (NH4)2SO4 leaching solution has NH4+ cations, which can exchange rare earth cations (RE3+) adsorbed in the rare earth ore. The experiment apparatus is shown in Figure 1. As shown in Figure 1, an overflow hole is placed at 2 cm above the sample to ensure a constant level of the leaching solution, while a pressure measurement tube and a discharge tube are located in the lower part of the device. All the experiments were carried out at the same room temperature of 25 °C, and the initial pH values of DI water and (NH4)2SO4 solution employed in the experiments were 6.92 and 5.16, respectively. Two samples (100 mm in height) with the closest physical parameter among these prepared samples were selected for the column leaching test. Firstly, the selected samples were saturated by DI water for 6 h. After that, sample 1 was kept leaching by DI water, and sample 2 was leached with 2% w/w (NH4)2SO4 solution. The pressure, volume and pH value of the collected solution were measured every hour, and the corresponding permeability coefficient was calculated according to Darcy’s law.
2.2.2. NMR Analysis
In this study, pore structure evolutions of rare earth ore samples during the leaching tests were monitored by a PQ-OO1-type Mini-NMR (Suzhou Niumai Analytical Instrument Corporation, China) with a magnetic field intensity of 0.52 T and an error within 1%, as shown in Figure S1. The effective testing area was 60 mm × 60 mm. The temperature of permanent magnets in the NMR was maintained at 32.00 ± 0.01 °C to ensure the stability and uniformity of the magnetic field. Similar to the column leaching test, two sets of remodeled rare earth ore samples (60 mm in height) were firstly saturated by DI water and then leached by DI water and the 2% w/w (NH4)2SO4 solution, respectively. During the leaching process, the pore structure of a sample from each leaching test was measured by the NMR with 30-min intervals until the end of the experiment (3 h). The pore radius distribution can be obtained from the T2 spectrum of every NMR test. The inversion images, projections of pores in a 10 mm-thick cross-sectional layer in the middle of the samples, were also calculated from obtained NMR data (Figure S2) by the NMR imaging software (Figure S3).
2.2.3. Inductively Coupled Plasma Mass Spectrometer (ICP-MS) Analysis
The change in total REO content of the rare earth ore during (NH4)2SO4 leaching test was analyzed using an Agilent 8800 ICP-MS (Agilent, Santa Clara, California, USA) [19]. More specifically, six samples (50 mm in diameter and 60 mm in height) were firstly saturated by DI water and then leached by the (NH4)2SO4 solution at the same time. Starting from leaching with (NH4)2SO4 solution, every half an hour, one sample was removed from the leaching test, while the remaining samples continued to be leached until the end of the test (3 h). Each of the six samples removed out was dried in a 65 °C oven for 24 h and then divided into upper, middle and lower parts (Figure S4). Each aliquot was ground to powder and dissolved for ICP-MS testing. Dissolution step 1: 0.10 g (accurate to 0.0001 g) of the powder was weighed and added to a 200 mL polytetrafluoroethylene (PTFE) beaker. Step 2: 5.0 mL of nitric acid and 5.0 mL of hydrofluoric acid were slowly added into the beaker, which was heated a hot plate to completely dissolve the powder. After adding 10.0 mL of perchloric acid, the beaker was continuously heated to evaporate it until salt crystallization appeared in the beaker. Step 3: after cooling, 5.0 mL nitric acid was added to dissolve the salt crystallization; then, the solution was transferred to a 250 mL volumetric flask, and the volume was adjusted to 250 mL with ultrapure water. Nitric acid, hydrofluoric acid and perchloric acid were guaranteed grade chemicals purchased from Sinopharm Chemical Reagent Co., Ltd. (Shanghai, China). Ultrapure water was produced by a water purification system.
2.2.4. SEM and Energy Dispersive X-ray Spectroscopy (EDS) Analysis
SEM (XL30W/TMP, Philips, Amsterdam, The Netherlands) was used to observe the changes in the microscopic morphology of the ore sample during the leaching process, while EDS assembled on SEM was used to analyze the composition and content of the fine particles. In this experiment, six samples (60 mm in height) were prepared, and the leaching process was the same as that described in the “ICP-MS Analysis” section. Each of the six samples removed in this experiment needed to be air-dried naturally; then, using a saw, the center part from the sample was carefully separated to make it a cube with a side length of 1 cm × 1 cm × 0.5 cm. The specimens for SEM imaging were collected from the center of the rare earth ore samples in the (NH4)2SO4 leaching test at different leaching time of 0.5 h, 1 h, and 2 h, as shown in Figure S5. Before conducting SEM and EDS testing, it is necessary to coat the observation surface with a gold film, which can improve the clarity of the observation image.
3. Results
3.1. Permeability Coefficient Analysis
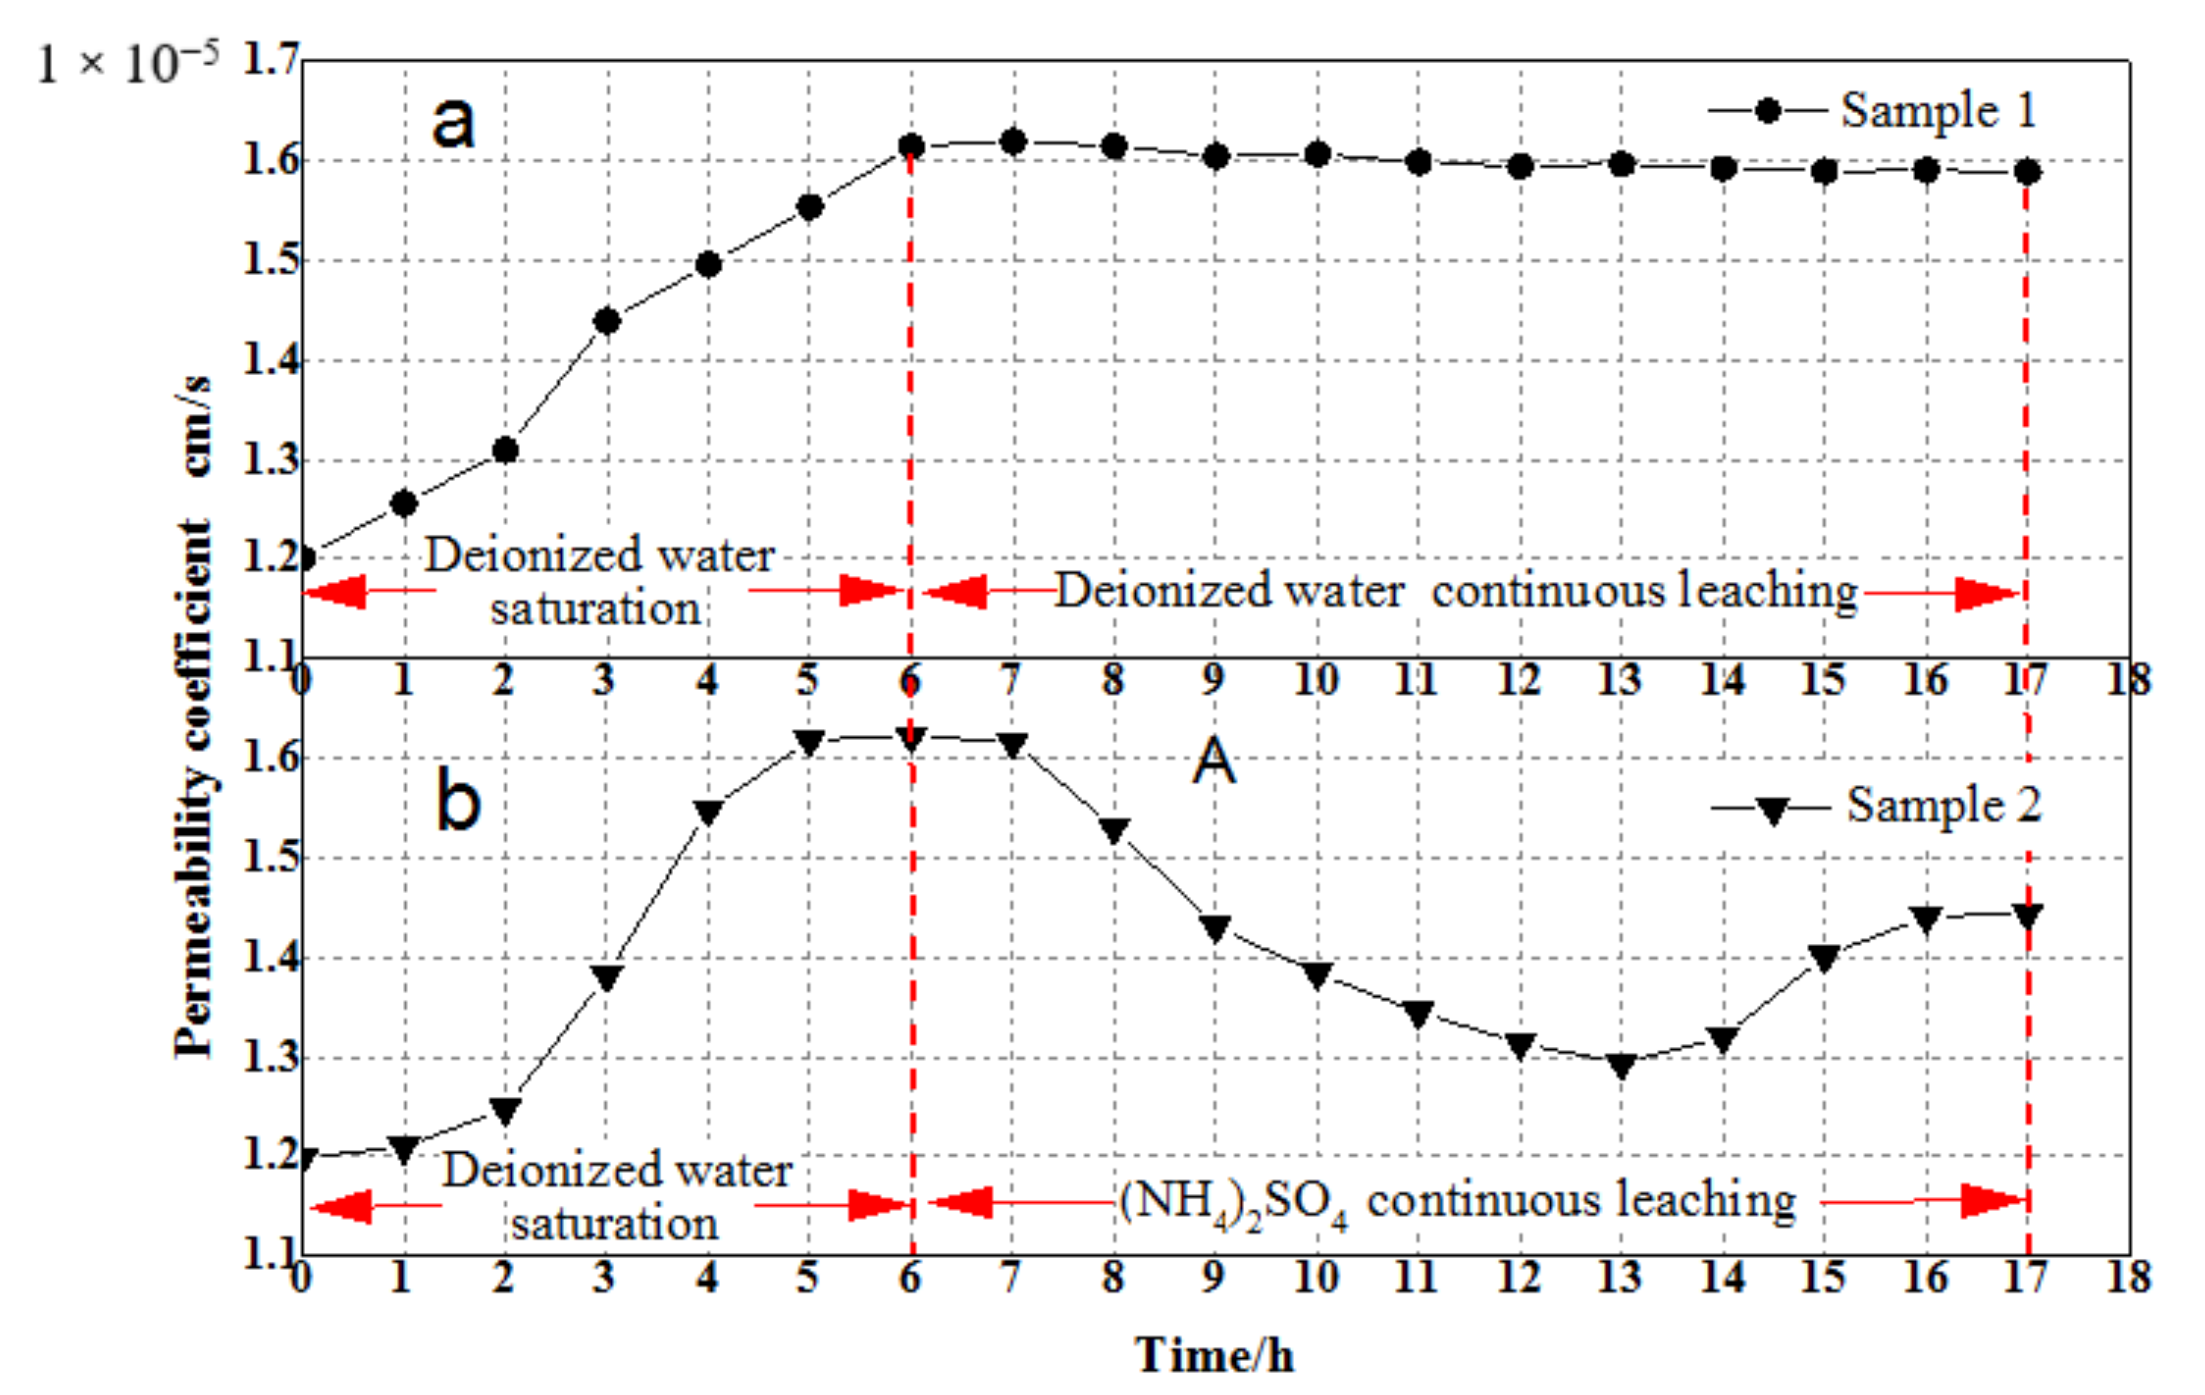
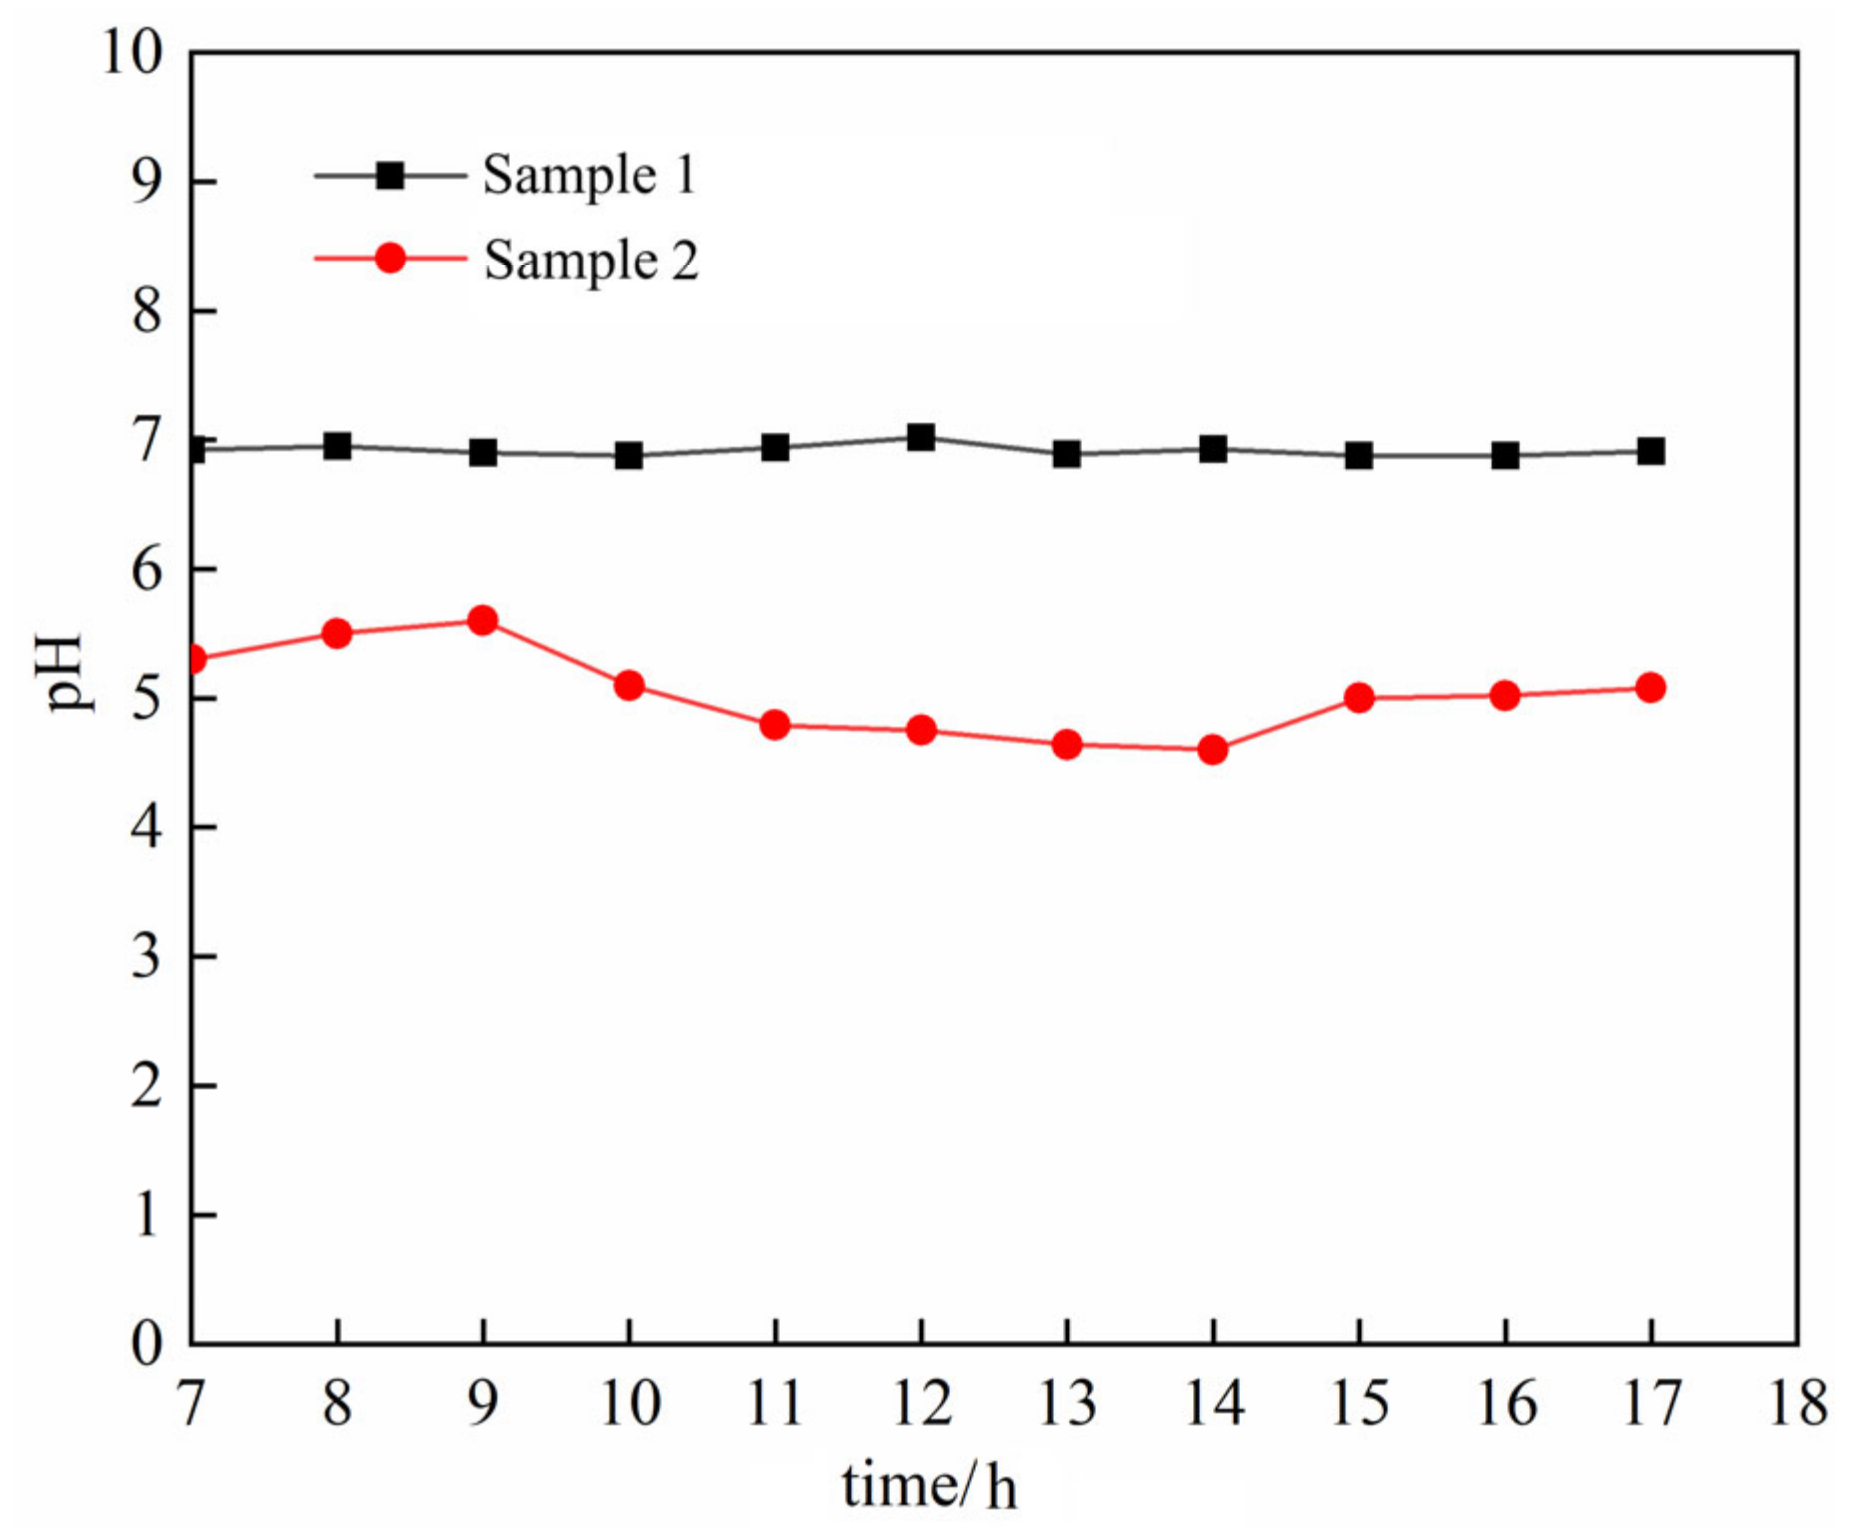
The physical properties of remodeled rare earth ore samples used in this experiment were identical. In addition, the seepage of DI water and 2% w/w (NH4)2SO4 solution were also maintained at the same rate. Since the weight percentage of (NH4)2SO4 in the leaching solution is only 2%, the viscosity difference between these two leaching solutions can be neglected. Hence, the seeping effects of DI water and the (NH4)2SO4 solution have the same influence on the ore particles. The experiment was started with saturating two rare earth ore samples (denoted as sample 1 and sample 2) with DI water. Six hours later, the amount of added leaching solution was equal to the amount of the collected solution, indicating that these samples were saturated. During this process, the permeability coefficients and pH value of sample 1 and sample 2 were calculated at one-hour intervals. As shown in Figure 2, the permeability coefficients of both samples increase during the saturating process and reach a plateau at 6 h when samples are fully saturated. After that, sample 1 continued to be leached by DI water, and sample 2 was leached by the 2% w/w (NH4)2SO4 solution. The permeability coefficient was kept monitored every 1 h. During this process, the permeability coefficient of sample 1 remained constant. The permeability coefficient of sample 2, however, showed a downward trend from 6 h to 13 h and an upward trend from 13 h to 17 h, as shown in Figure 2b. After 17 h, the permeability coefficient reached another plateau. As shown in Figure 3, the pH of the collected solution obtained from sample 1 is exactly the same as the pH of DI water, indicating that the DI water has no effect on the pH of the ore sample. When ammonium sulfate was used for leaching, the pH of the collected solution of sample 2 had a small fluctuation around 5. Considering that the initial pH of (NH4)2SO4 is 5.16, this means that leaching with 2% (NH4)2SO4 has almost no effect on the pH of the ore sample. Thus, the pH values of DI water and 2% (NH4)2SO4 will not lead to the leaching profile in Figure 2b. Compared with the leaching profile of sample 1 (Figure 2a), the fluctuation of the permeability coefficient of sample 2 during the continuous leaching period is induced by exchanging RE3+ in the rare earth ore against NH4+ in the leaching solution. Hence, ion exchange and migration show a significant influence on the permeability of the rare earth ore body.
3.2. Pore Structure Characterization
3.2.1. Inversion Image Analysis
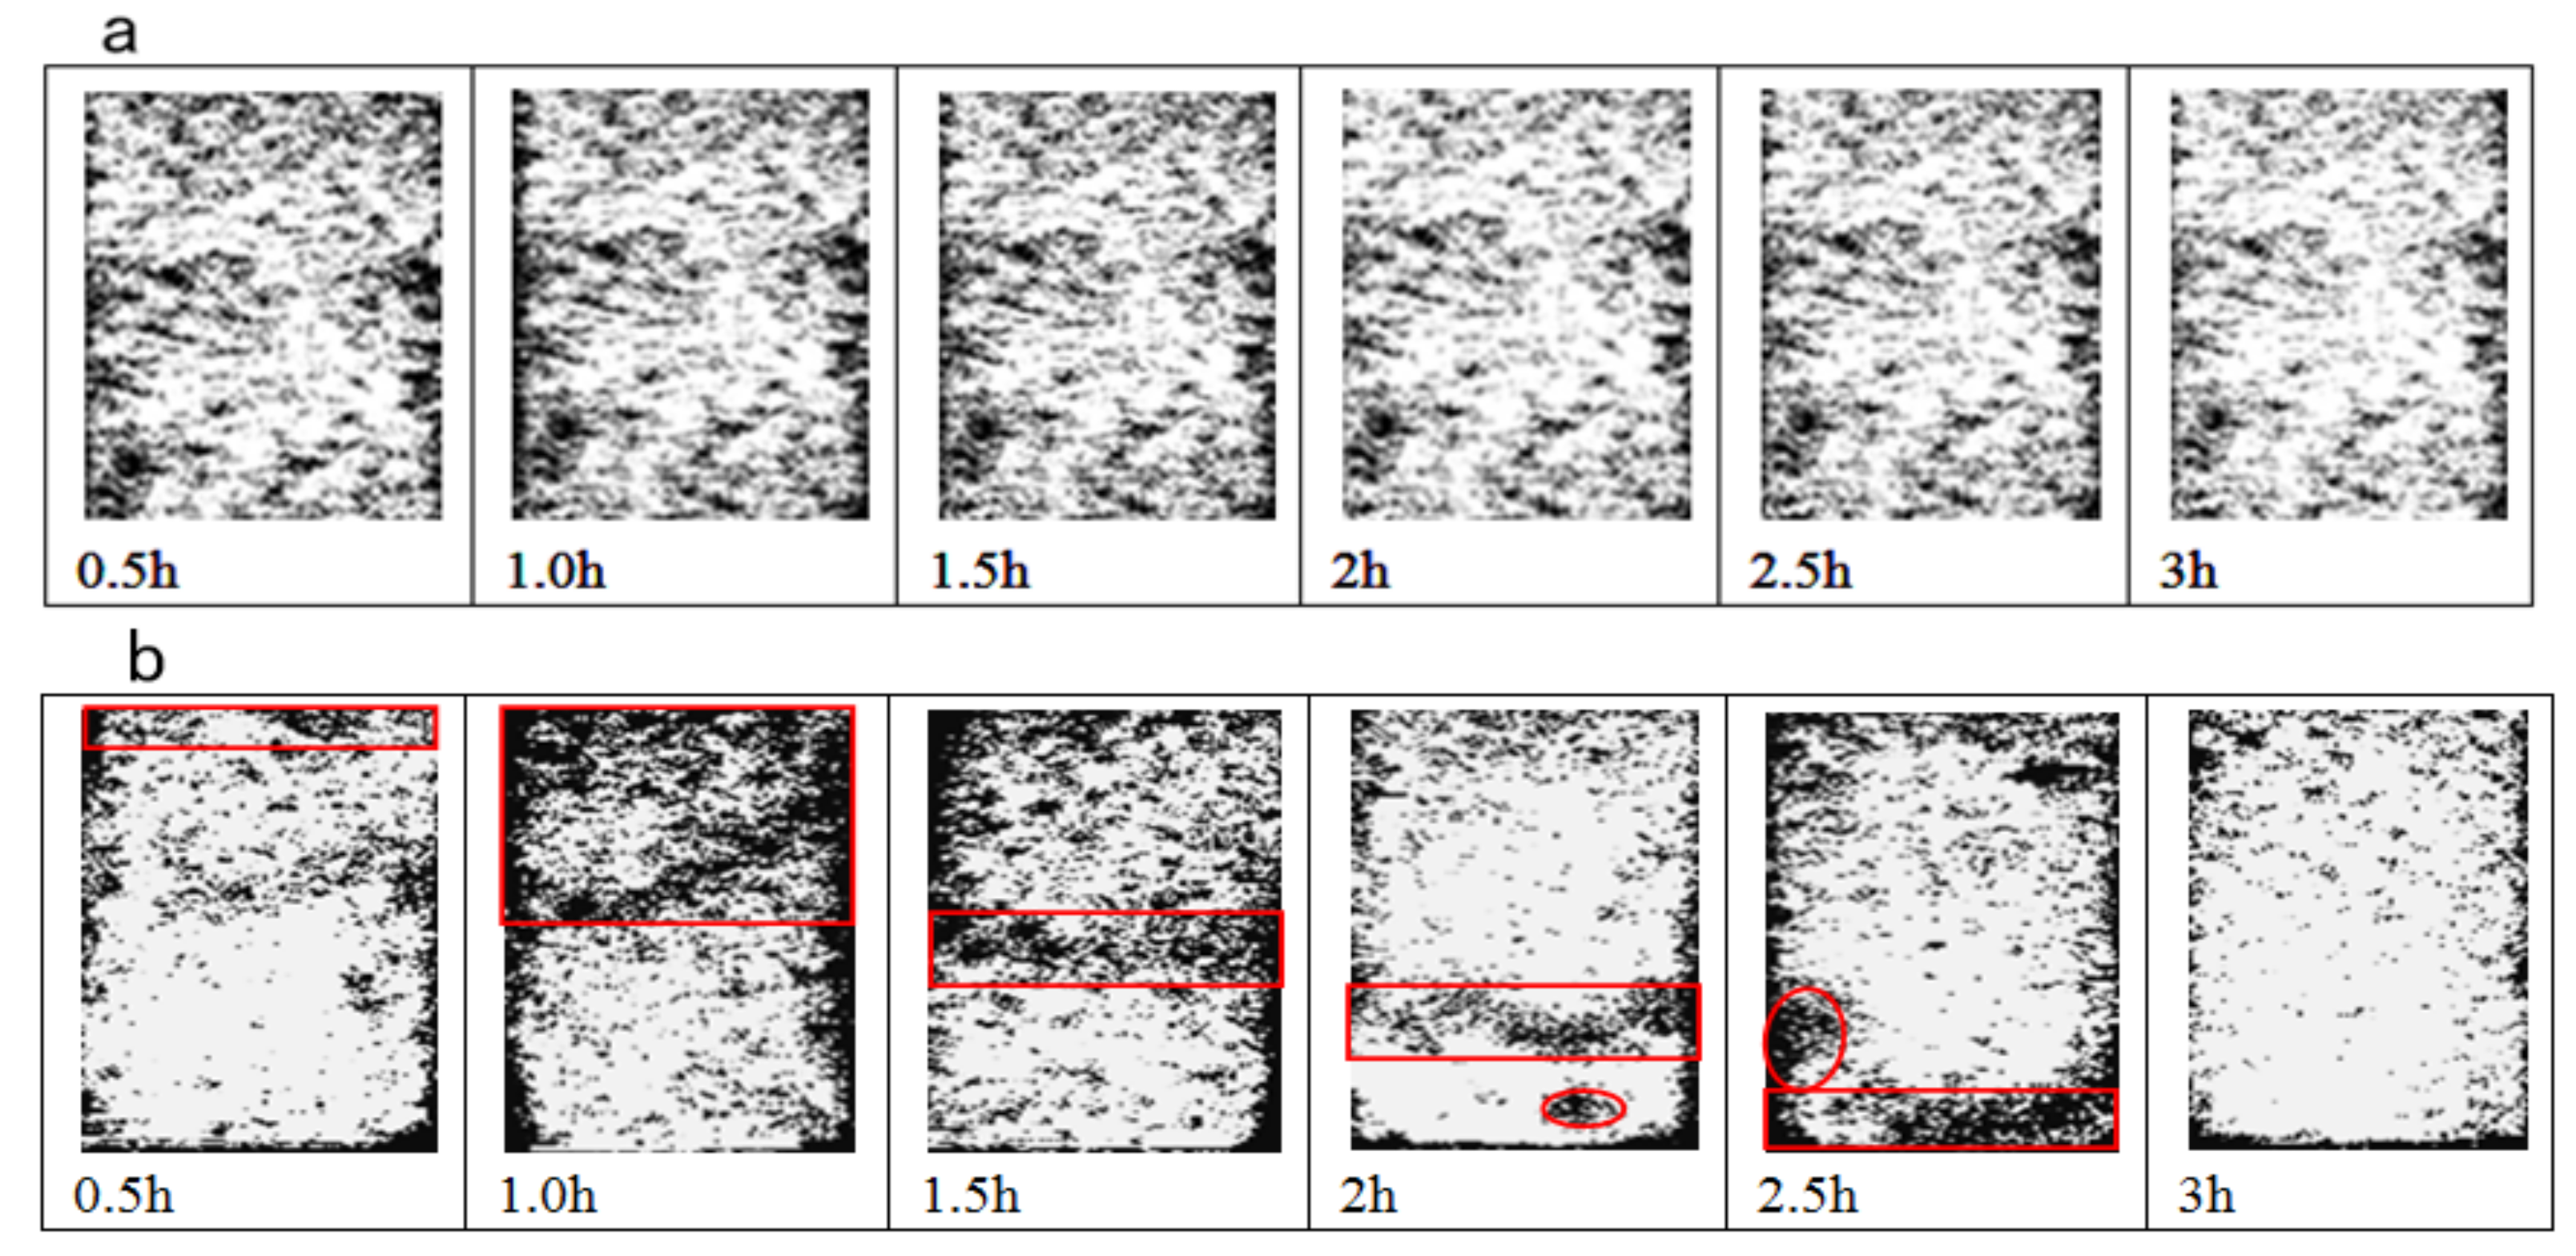
The fluctuation of the permeability coefficient of rare earth ore bodies during the leaching process is closely related to the pore structures [20,21]. To investigate the influence of the ion exchange process on the pore structure of the rare earth ore, another comparative experiment was carried out, and the result is shown in Figure 4. In Figure 4a, the inversion images of the DI water-leached sample shows no significant change during the whole leaching process. However, for the sample leached by the 2% w/w (NH4)2SO4 solution, a black area appeared in the inversion image at the beginning of the leaching process which gradually moved downward to the bottom part of the inversion image during the leaching process (highlighted by red boxes and ellipsoids in Figure 4b). Specifically, the black area appears at the top of the part of the inversion image at 0.5 h of leaching. Then, the size of the black area increases and covers the top half of the inversion image, as shown in the second image of Figure 4b. After 1.5 h of leaching, the black area appears at the middle of the inversion image and the top part turns white again. Then, the black area gradually moves downward from 1.5 h to 2.5 h and disappears after 3 h of leaching. Based on the principle of NMR, black represents the high-density area, while white indicates the high-porosity area. It can be concluded that the ion exchange reaction between the (NH4)2SO4 solution and rare earth ore sample induced the aggregation and downward migration of solid matters during the leaching process.
3.2.2. Pore Size Distribution Analysis
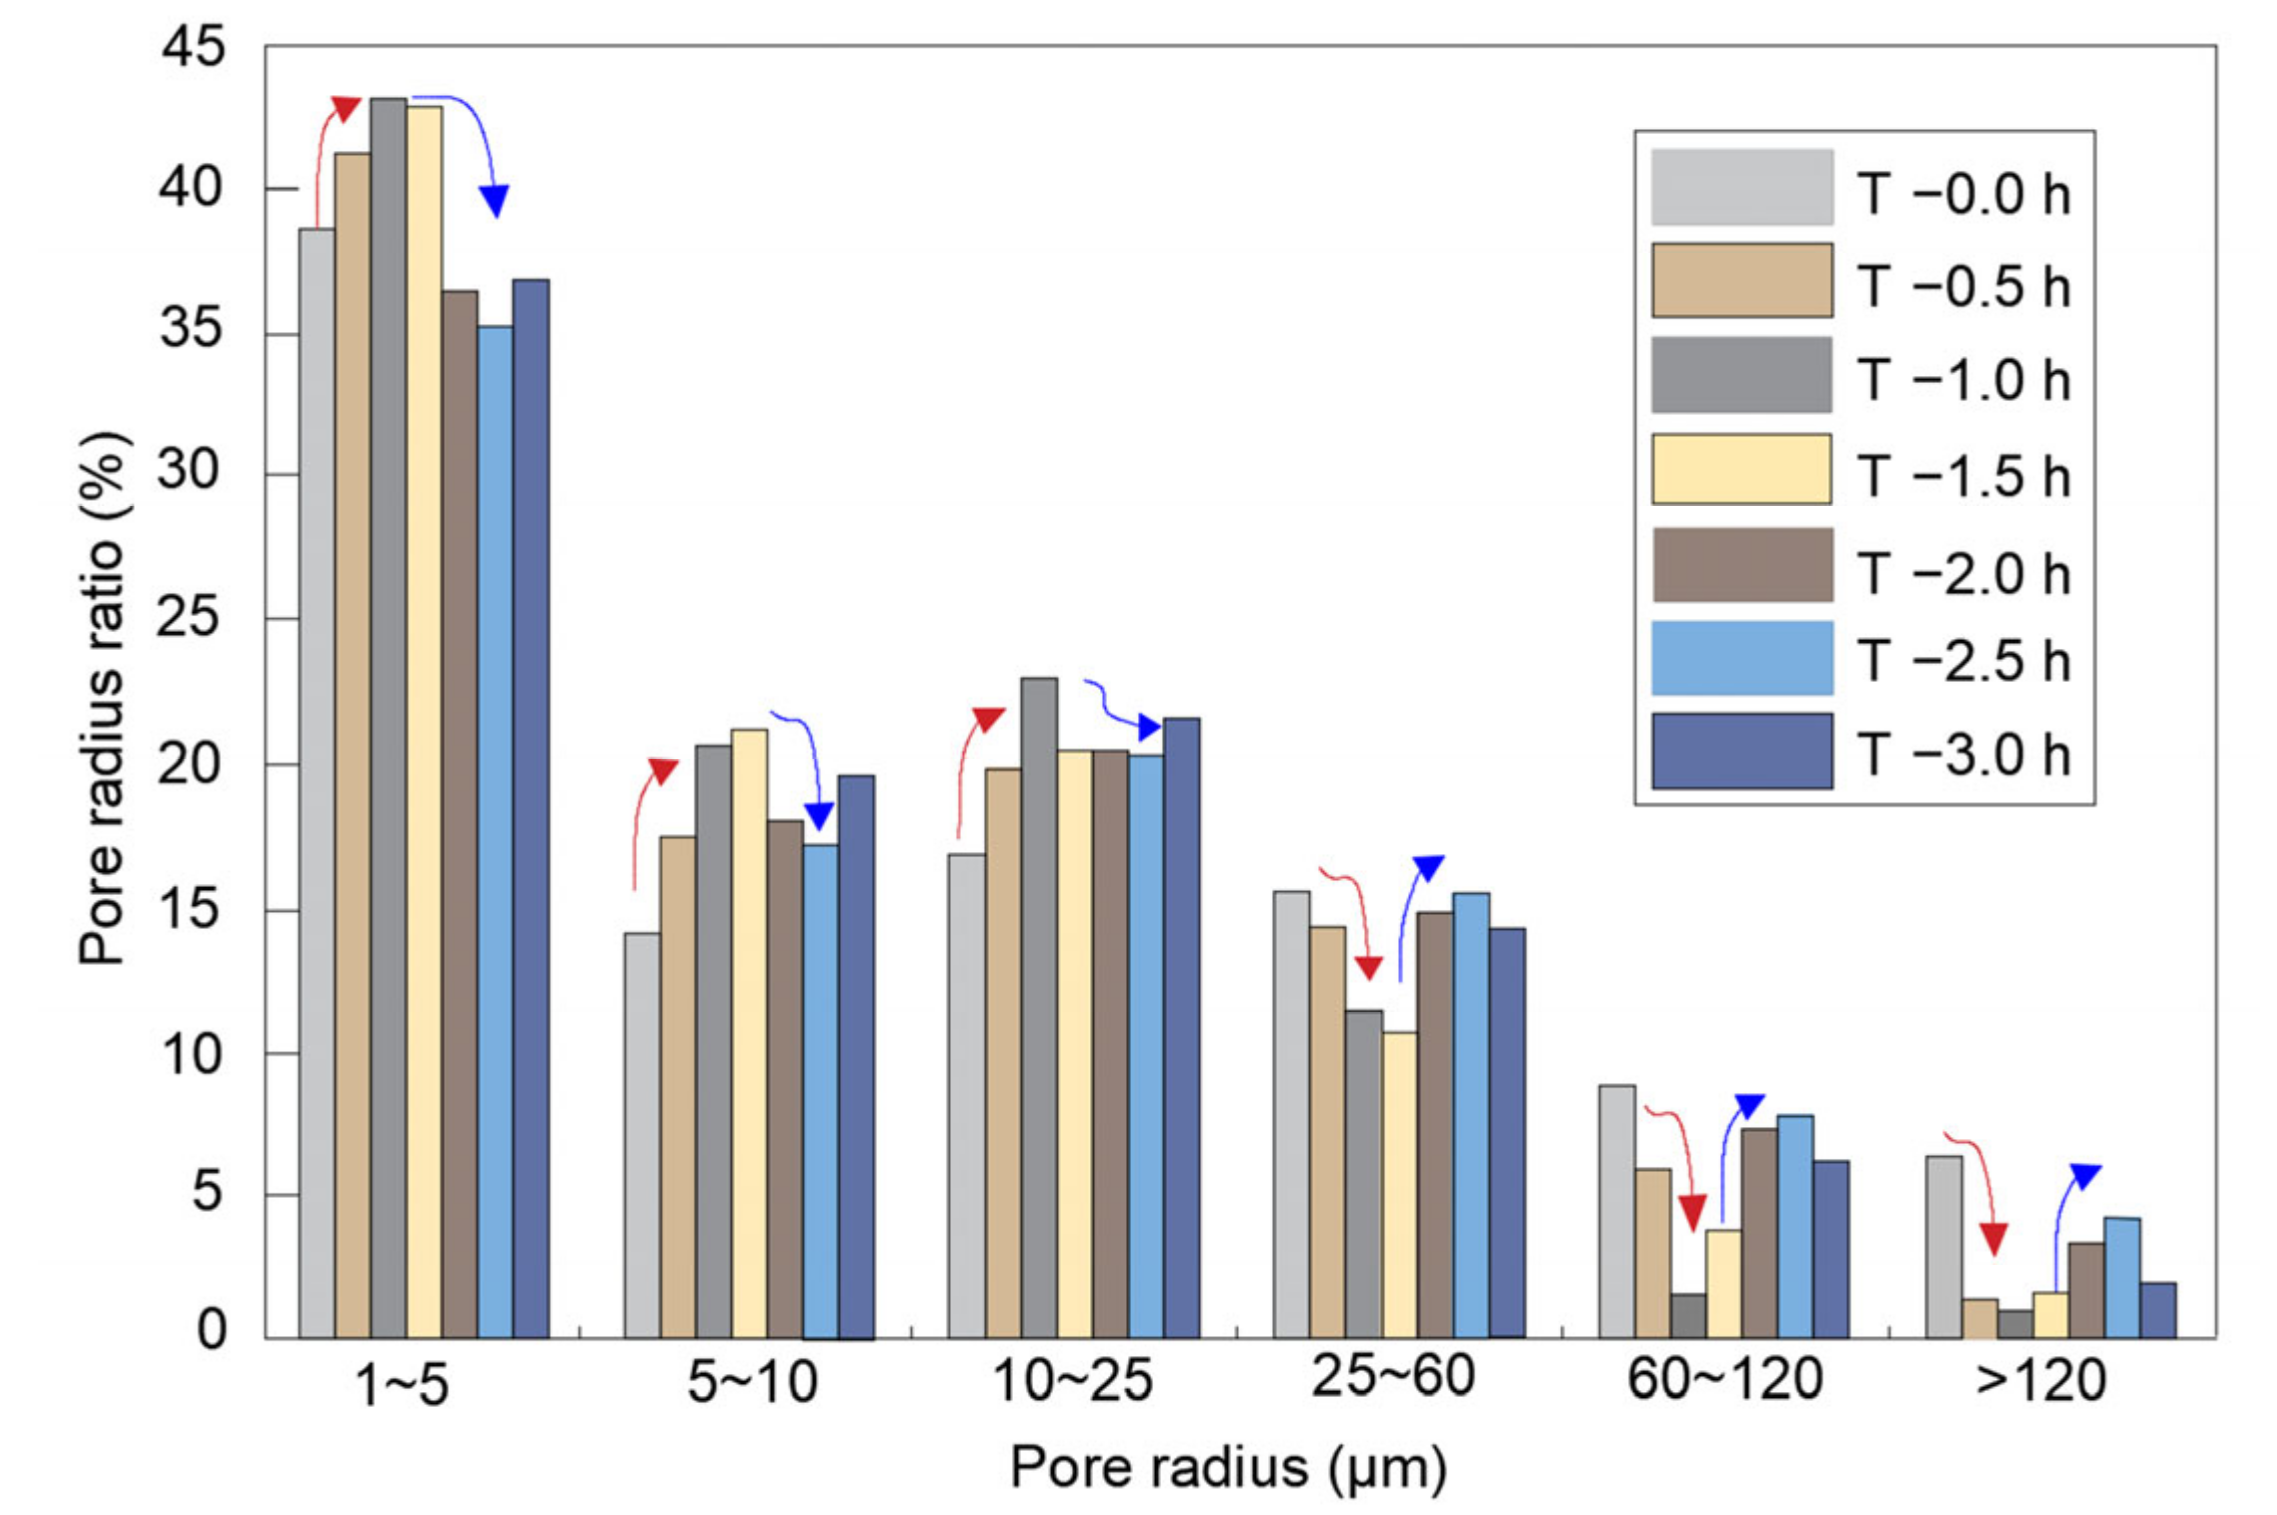
To further investigate the abnormal phenomenon in the inversion images of the sample leached with the (NH4)2SO4 solution, the pore size distribution of the sample was measured with 0.5 h intervals throughout the leaching process, and the result is summarized in Figure 5. As shown in Figure 5, the ore sample is mainly occupied by small pores and medium pores. The volume percentage of small pores (1~5 μm) is over 35% of the total pore volume in the sample, whereas mega pores (>120 μm) only account for 10%. In the first hour of the (NH4)2SO4 leaching process, the volume percentage of small pores and medium pores (1~5 μm, 5~10 μm, and 10~25 μm) gradually increased, while the volume percentage of large pores and mega pores (25–60 μm, 60–120 μm, and >120 μm) shows a downward trend. After 1.5 h of leaching, the pore size evolution of the sample shows the opposite trend. Compared to Figure 4b, after 1–1.5 h of leaching, a large black area appears at the upper-middle part of inversion images, indicating accumulation of a large amount of solid matter. After 1.5 h of leaching, the black area gradually decreases, and a downward movement appears. In other word, the accumulated solid matter gradually disappears after 1.5 h, and the area of the accumulated solid matter is much smaller. Hence, during the (NH4)2SO4 leaching process, the evolution of the pore structure has a strong correlation with the accumulation and disappearance of solid matters that directly induce the change in the permeability coefficient during the leaching process.
3.3. REO Content Analysis
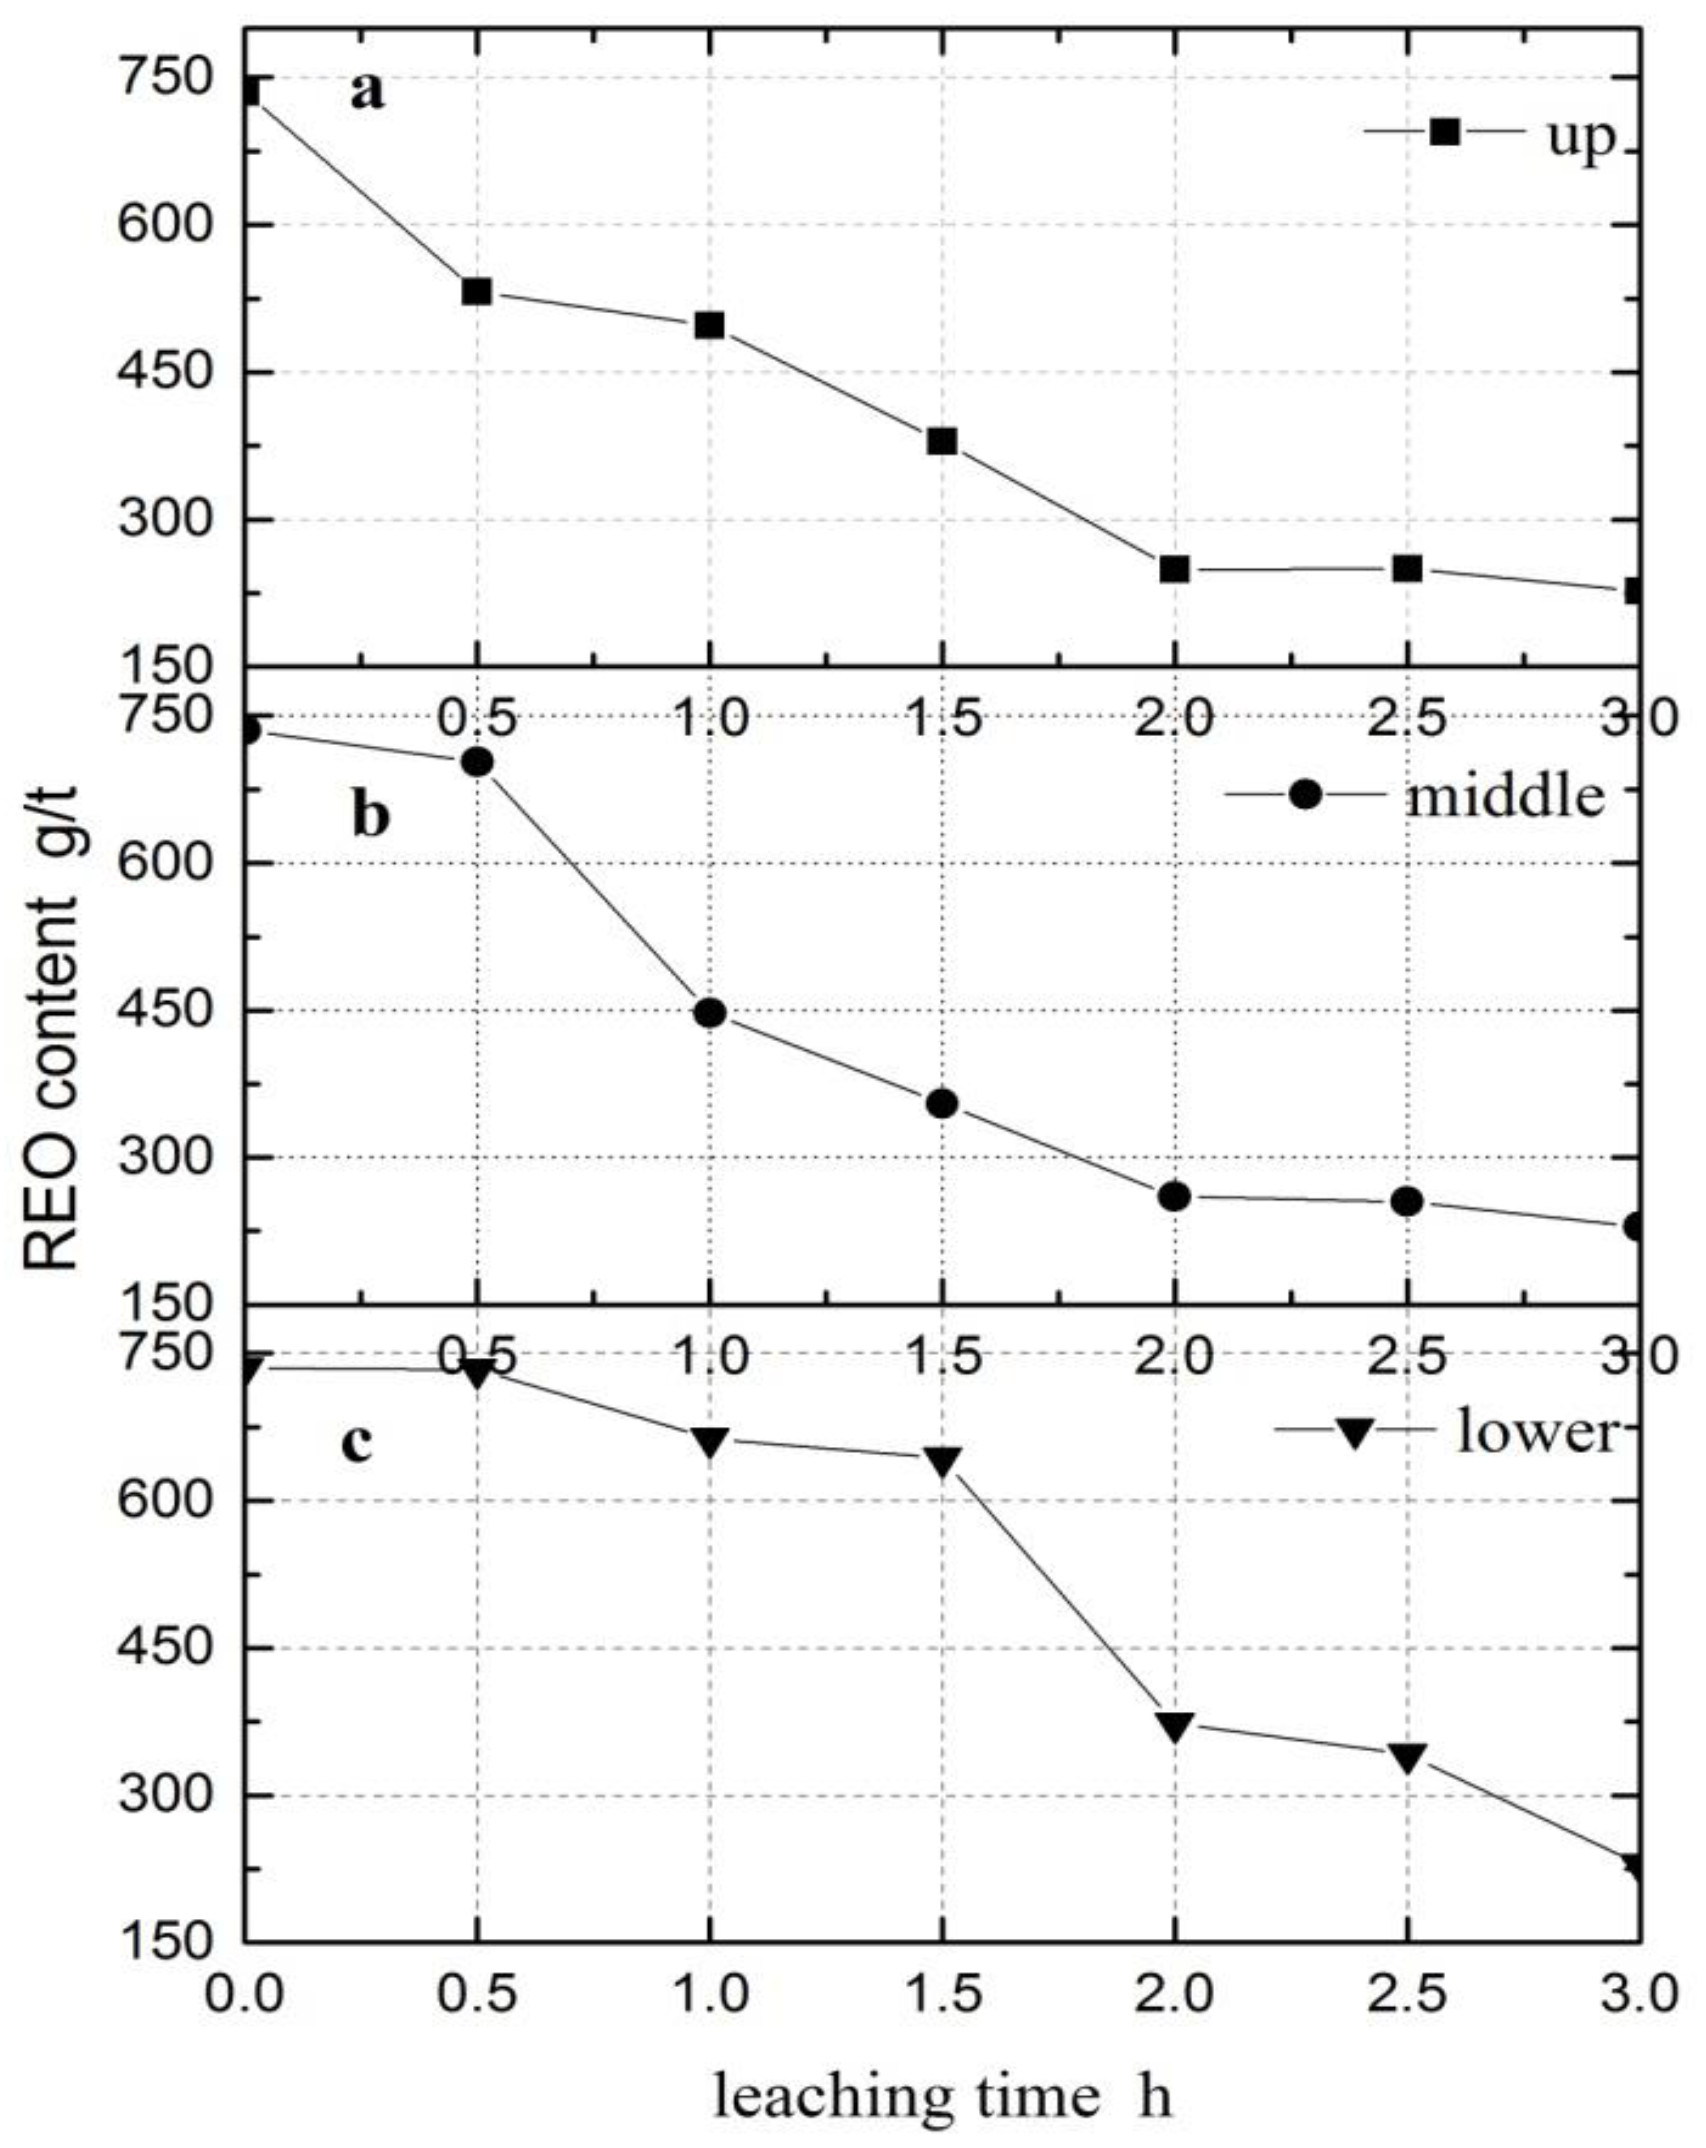
To investigate the relationship between the accumulation and disappearance phenomenon of solid matters and the ion exchange reaction, the REO content was monitored during the (NH4)2SO4 leaching process. The data are summarized in Table 4 and Figure 6. As shown in Figure 6, during the first 1.5 h of leaching, the REO content decreases dramatically in the upper and middle parts of the rare earth ore sample, while the REO content in the lower part only shows a slight decline. This trend indicates that the ion exchange reaction mainly takes place in the upper and middle parts of the sample. After 1.5 h of leaching, the REO content in the lower part of the sample shows a sharp decline, implying the main area of the ion exchange reaction is moving toward the lower part of the sample. In this period, the ion exchange reaction in the upper and middle parts of the sample is still in progress at a much slower rate. After 2 h of leaching, the REO content in the upper and middle part of the sample remains constant, whereas the REO content in the lower part of the sample is still decreasing. This observation suggests that with the seepage of the leaching solution, the main area of the ion exchange reaction has fully transferred from the upper and middle parts to the lower part of the sample. The trend of the REO content variation in the rare earth ore sample during the (NH4)2SO4 leaching process is in good agreement with the movement of the black area in the inversion images and the fluctuation of pore size distribution discussed earlier in the manuscript. Hence, it can be concluded that the ion exchange reaction promotes the accumulation of solid matters, leading to an increase in the volume percentage of small and medium pores and a decrease in the volume percentage of large and mega pores. With the completion of the ion exchange reaction, the cumulated solid matters are released, and a reverse trend appears in the distribution of the pores in the rare earth ore sample.
3.4. Surface Morphology Characterization
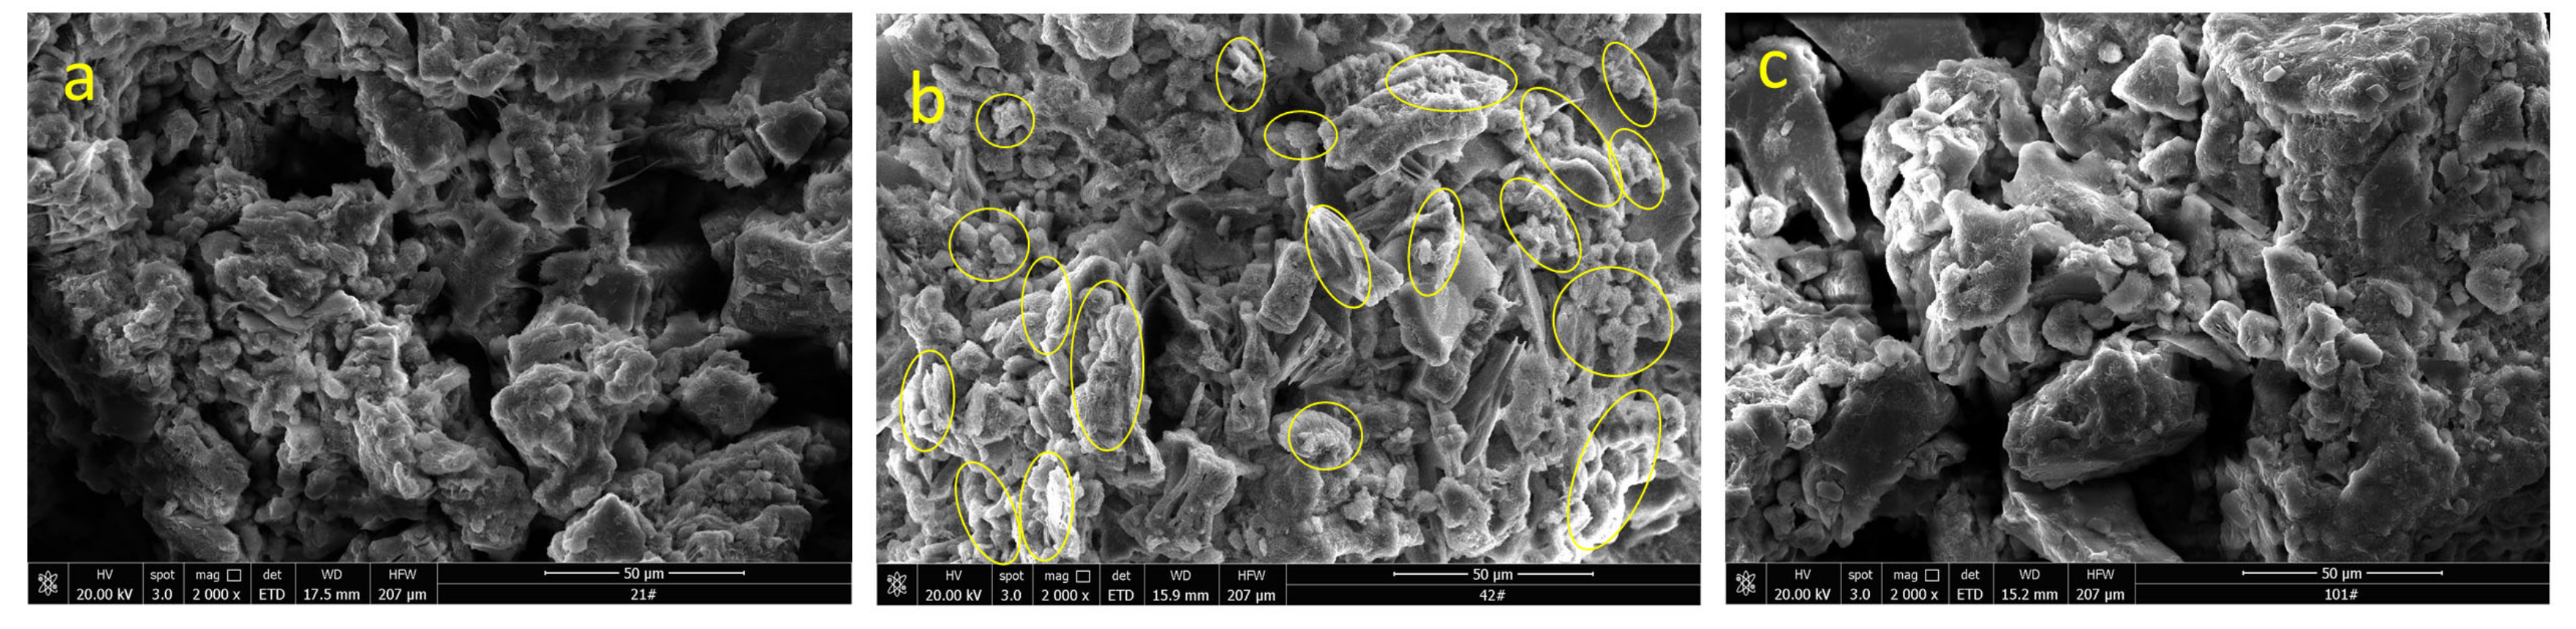
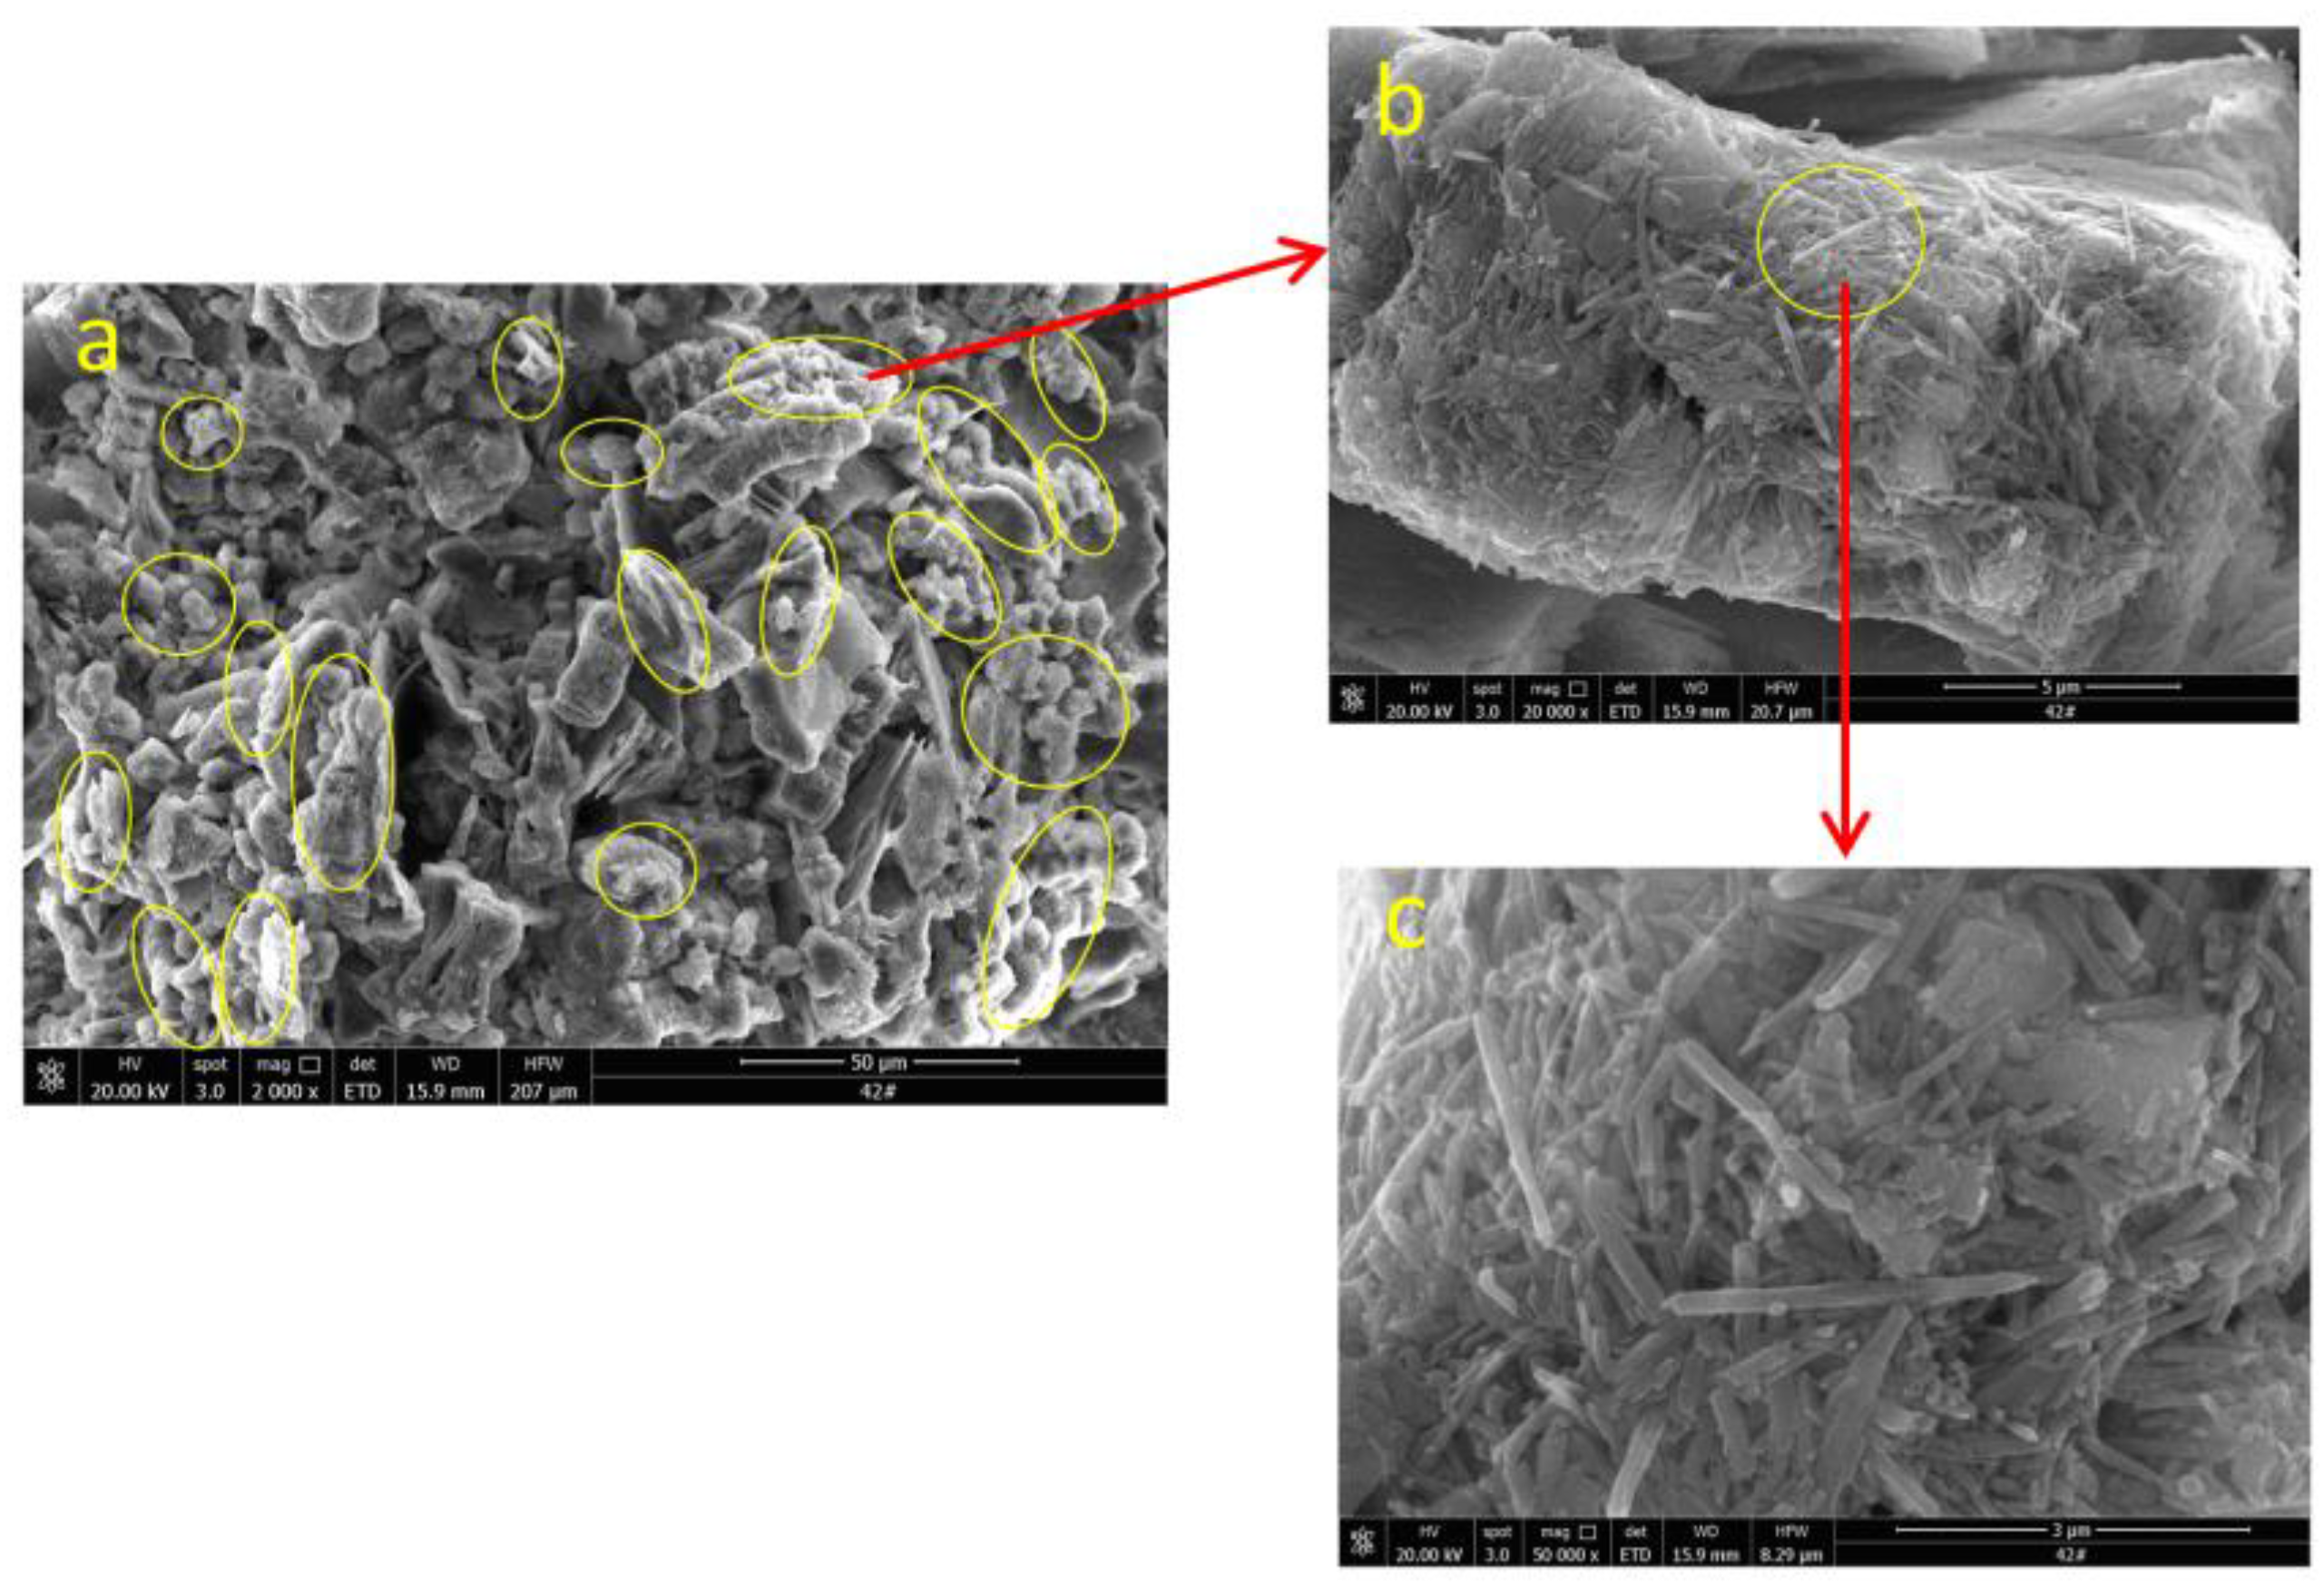
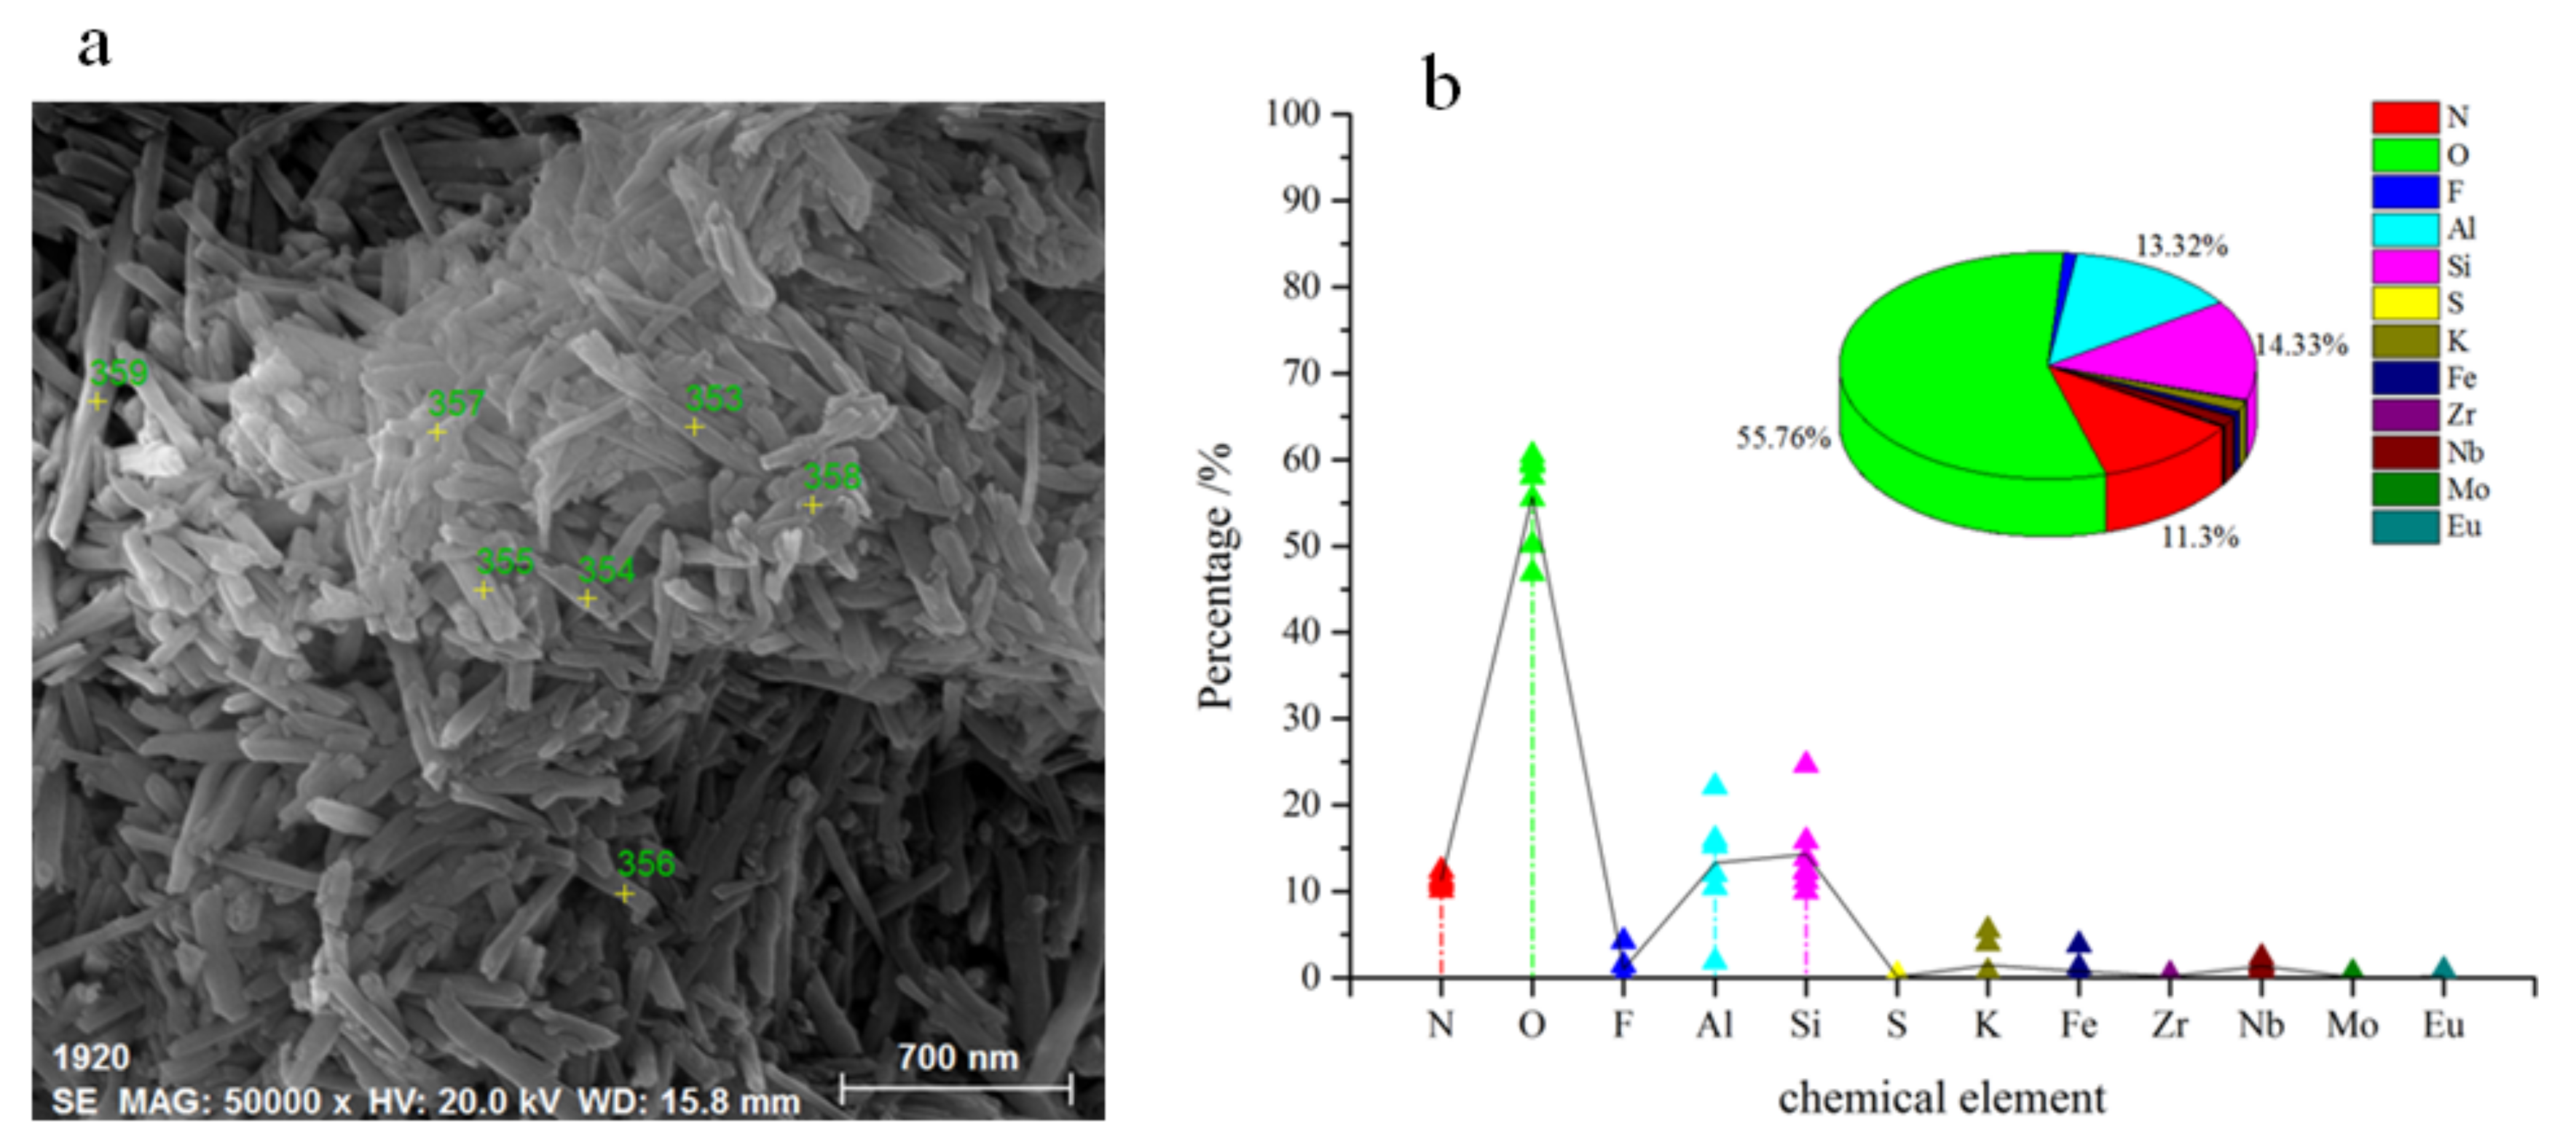
SEM was used in this study to further investigate the mechanism of the formation and the disappearance of the black areas in inversion images of the samples during the (NH4)2SO4 leaching test. Figure 7 shows SEM images of specimens obtained from the center of samples after 0.5 h, 1 h, and 2 h of leaching. After 0.5 h of leaching, the ion exchange takes place at the upper part of the sample (Figure 6 and Table 4), which can also be proved by the inversion image shown in Figure 4b. The SEM image (Figure 7a) reveals the rare earth ore particles and pore structures at the center part of this sample. Clearly, at this stage, the pore structure consists of a large number of small pores (<10 μm) and a small number of large pores (>30 μm). After 1 h of leaching, the center part of the sample is proved to be the main area of the ion exchange reaction (see Figure 6, Table 4, and Figure 4b). Its SEM image reveals a significant amount of microparticles accumulated on the rare earth ore body (Figure 7b). These microparticles aggregate into larger spherical particles with a diameter over 30 μm and distribute evenly across the field of view of the SEM image, blocking large pores with a diameter over 30 μm. After 2 h of leaching, the ion exchange reaction is completed (Figure 6, Table 4 and Figure 4b). As shown in the SEM image (Figure 7c), the number of microparticles decreased dramatically, and the large pores (>30 μm) are revealed. High-magnification SEM images (20,000× and 50,000×) are shown in Figure 8. As seen in Figure 8b,c, these microparticles have a needle-like shape with 0.1 um in diameter and 1–3 μm in length, which is similar to the characteristics of clay particles. Although the infrared spectra of the ion-adsorption type rare earth ore and the leaching residue showed that no new substances were generated [22], in order to draw a more cautious conclusion, EDS was used to analyze the microparticles. The EDS data were obtained at seven different locations on the specimen (Table 5 and Figure 9). These microparticles are mainly made from 12 different elements, including N, O, F, Al, Si, S, K, Fe, Zr, Nb, Mo, and Eu, among which, O, Al, and Si account for over 80% of the mass. The SEM image and EDS data (Figure 10) perfectly show that the microparticles are the classic halloysite nano tube structures (Al2Si2O5(OH)4·nH2O.) [23], not a new compound produced during the ion exchange reaction. Due to the strong adsorption capacity of halloysite nano tube structures [24], the high-N content (11.3%) is attributed to the NH4+ cations adsorbed on the clay particles. In summary, the ion exchange reaction between the leaching solution and the rare earth ore induces the accumulation of clay microparticles on the pore structures of the sample, blocking the original pore structures and causing the reduction of the permeability coefficient. With the completion of the ion exchange reaction, these microparticles are released again, exposing the original pore structures. As a result, the permeability coefficient is also recovered. In addition, since the diameters of clay microparticles are smaller than those of most pores in the sample, they should have migrated freely through the pores. Thus, the adsorption–desorption behavior of clay microparticles on the sample pore structures is caused by the change in a force during the leaching process.
4. Discussion
The permeability coefficient of the rare earth ore sample is influenced by the adsorption–desorption behavior of a large number of clay microparticles, which is induced by the ion exchange reaction between NH4+ in the leaching solution and RE3+ in the rare earth ore sample. These clay microparticles can be considered as colloids in the saturated porous media due to their small particle size (<3 μm). Owning to the electric double layer structure, clay microparticles can form stable suspensions or can be adsorbed on surfaces in different conditions [25,26,27]. Moreover, clay microparticles are immobile in normal groundwater conditions [28,29]. It has been reported that colloidal particles can be released from the soil matrix into the soil solution and can also be adsorbed by the soil matrix with the change in hydrodynamic forces and/or chemical conditions [30,31,32,33,34]. The hydrodynamic forces come from the movement of the liquid phase in the soil. When the flow rate reaches a critical level, the hydrodynamic forces are strong enough to induce sliding and rolling of colloids and can eventually release colloids into the soil solution [35,36]. The chemical conditions mainly include ionic strength and pH. It has been shown in experiments that the reduction of ionic strength contributes to the desorption of colloids [37,38], and the increase in ionic strength leads to the adsorption of colloids [39,40,41]. In addition, the increase in the pH value of the solution promotes the desorption of colloids [42].
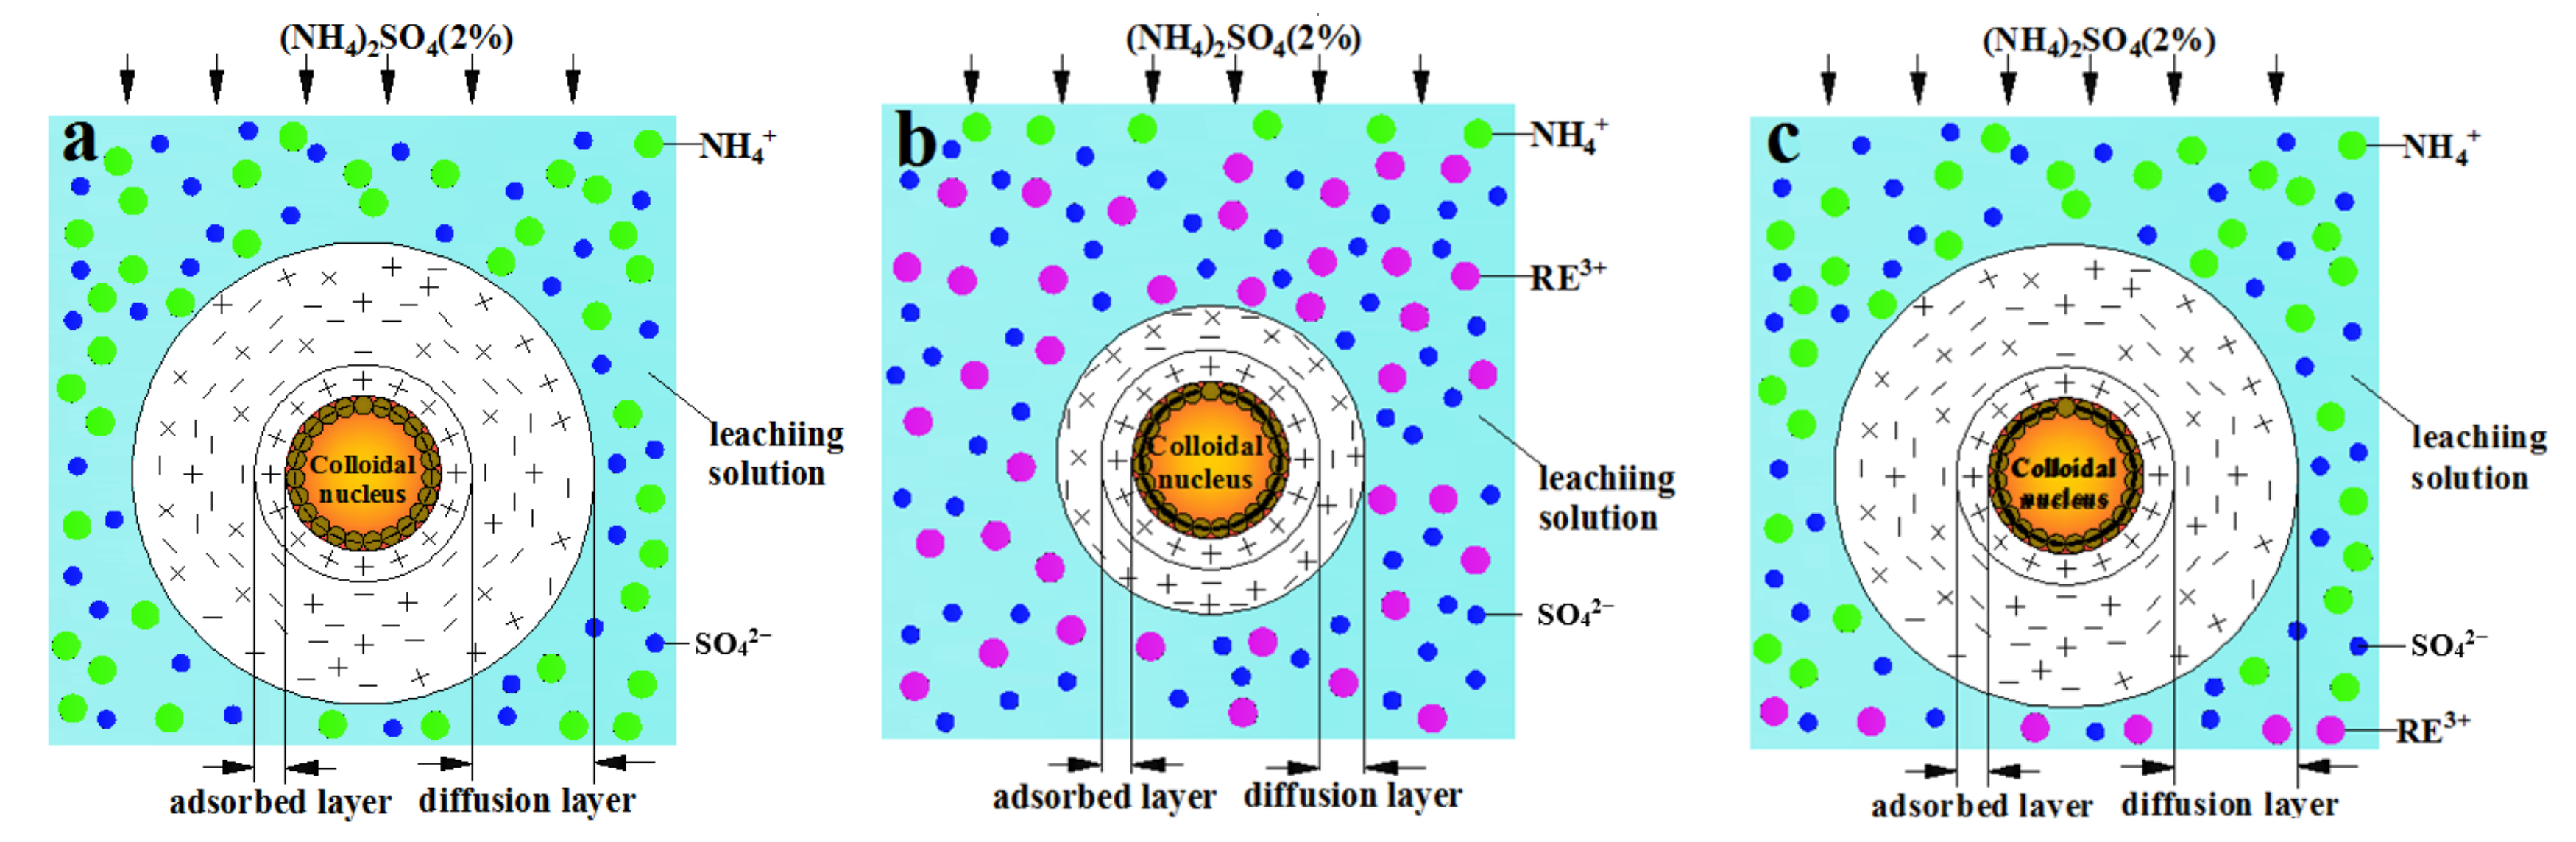
During the leaching process, the injection rates of leaching solutions remained constant. The concentration and pH of leaching solutions were all unchanged. In addition, no noticeable change was detected in the pH of the collected solutions. Therefore, throughout the leaching process, the hydrodynamic forces and chemical conditions of the leaching solution remain constant. Through a comparative experiment, it is confirmed that the (NH4)2SO4 leaching solution contributes to the adsorption and desorption of colloidal clay particles, which is induced by the ion exchange reaction. In this process, the three-to-one exchange ratio between NH4+ cations and RE3+ cations and the difference of their valences cause the change in the ionic strength of the leaching solution. According to the Derjaguin–Landan–Verwey–Overbeek (DLVO) theory, the electric double layer structure of the colloidal clay particle is influenced by the van der Waals force and the electrostatic repulsion [43]. As shown in Figure 10a, at the beginning of the leaching process, the leaching solution consists of NH4+ cations and SO42− anions. With the ion exchange reaction, NH4+ cations in the leaching solution are gradually replaced by RE3+ cations, leading to an increase in ionic strength of the leaching solution. Hence, the diffusion layer in the electric double layer of the colloidal clay particle is compressed (Figure 10b), which causes the reduction of the distance between the colloidal clay particle and the porous media, leading to the reduction of the electrostatic repulsion and the increase in the van der Waals force. As a result, a large number of colloidal clay particles adsorb to the internal surface of the sample. With the completion of ion exchange reaction, under the seepage of the (NH4)2SO4 leaching solution, the RE3+ cations around the colloidal clay particle were gradually replaced by NH4+, as shown in Figure 10c, resulting in a reduction in the ionic strength of the solution. The thickness of the electric double layer of the colloidal clay particle increase with the decrease in ionic strength. Hence, the electrostatic repulsion exceeds the van der Waals force, promoting the desorption of a large number of colloidal clay particles from the ore surface. In addition, this mechanism can also be used to explain the downward movement of the black area and the alternating change between black and white color in inversion images during the (NH4)2SO4 leaching process.
In summary, in the leaching process of the ore sample, the combined action of leaching liquid flow and ion exchange causes alternating changes in the ionic strength in the solution, which, in turn, triggers adsorption and desorption of the clay colloidal particles inside the sample and affects the permeability of the sample. Although the pH and viscosity of the solution are both important factors that affect the seepage rate [44,45], they are not discussed in detail in this article, as the pH and viscosity of the (NH4)2SO4 solution used in the column leaching test in this study are consistent, and they will be mainly analyzed in future studies.
5. Conclusions
- By comparing the data obtained from the comparative experiment, it can be concluded that the ion exchange reaction between the leaching solution and the rare earth ore promotes a decrease in the permeability coefficient of the sample. With the completion of the ion exchange reaction, the permeability coefficient begins to recover.
- The ion exchange reaction between NH4+ in the leaching solution and RE3+ adsorbed in the rare earth ore leads to the adsorption of a large number of microparticles inside the sample. After the completion of the ion exchange reaction, the microparticles deposited on the ore body are released under the continuous seepage of the leaching solution. The chemical composition analysis suggests that the microparticles are colloidal clay particles. Their adsorption and desorption phenomenon is closely related to the ion exchange reaction during the leaching process.
- The ion exchange reaction during the leaching process leads to the exchange of NH4+ against RE3+, which causes the rise of the ionic strength of the leaching solution, resulting in a large amount of adsorption of colloidal clay particles. With the completion of the ion exchange reaction, RE3+ in the leaching solution is gradually replaced by NH4+ due to the seepage of the (NH4)2SO4 leaching solution, which induces the reduction of the ionic strength of the leaching solution, leading to the desorption of the clay colloidal particles. This process promotes the dynamic change in the pore structure inside the sample, leading to the fluctuation of the permeability coefficient of the ore sample during the (NH4)2SO4 leaching test.
- The fluctuation of the permeability coefficient is observed on the remodeled ore samples. Through the sample remodeling process, it can be found that the remodeled ore samples have similar physical properties and the same chemical composition as the undisturbed ore sample. Therefore, the observed effect in the laboratory leaching tests has certain applicability to the undisturbed ore sample.
Supplementary Materials
The following are available online at https://www.mdpi.com/2075-163X/10/10/889/s1, Figure S1: Schematic diagram of NMR; Figure S2: The inversion image was calculated from obtained NMR data; Figure S3: NMR imaging software operation interface; Figure S4: Preparation of ore samples for ICP-MS analysis; Figure S5: Preparation of ore samples for SEM analysis; Table S1: Contents of elements in rare earth ore powder samples; Table S2: Total amount and weight percentage of rare earth elements in rare earth ore powder samples.
Author Contributions
Conceptualization, X.W., X.F. and K.H.; methodology, X.W., H.W. and C.S.; software, L.Z.; validation, C.S., C.H. and L.Z.; formal analysis, X.W., H.W. and K.H; investigation, X.F., C.H., K.Z. and W.Z.; resources, X.W.; data curation, H.W., C.S. and K.H.; writing—Original draft preparation, X.W.; writing—Review and editing, H.W., X.F. and K.H.; supervision, K.Z. and W.Z.; project administration, X.W., X.F. and K.H.; funding acquisition, X.W.; K.Z.; W.Z. and K.H. All authors have read and agreed to the published version of the manuscript.
Funding
This research was funded by the National Natural Science Foundation of China (grants no. 51564012, 51874148, 51504102, 51764014 and 51904119); the Science and Technology Project (grant no. GJJ150653) funded by the Education Department of Jiangxi Province; the Program of Qingjiang Excellent Young Talents of Jiangxi University of Science and Technology; the National Key R&D Program of China (grant no. 2017YFC0804601); and the Young Jinggang Scholars Award Program in Jiangxi Province and the Natural Science Foundation of Jiangxi Province for Distinguished Young Scholars (grant no. 20192BCBL23010).
Acknowledgments
We thank Yu Wang and He Zhang for their assistance with the data collection. We also thank anonymous reviewers and editors for their insightful suggestions and careful reading.
Conflicts of Interest
The authors declare no conflict of interest.
References
- Zhang, P.; Tao, K.; Yang, Z. Study on material composition and REE-host forms of ion-type RE deposits in South China. J. Rare Earths 1995, 13, 37–41. [Google Scholar]
- Moldoveanu, G.A.; Papangelakis, V.G. An overview of rare-earth recovery by ion-exchange leaching from ion-adsorption clays of various origins. Mineral. Mag. 2016, 80, 63–76. [Google Scholar] [CrossRef] [Green Version]
- Georgiana, A.; Moldoveanu, G.A.; Papangelakis, V.G. Recovery of rare earth elements adsorbed on clay minerals: I. Desorption mechanism. Hydrometallurgy 2012, 117, 71–78. [Google Scholar] [CrossRef]
- Georgiana, A.; Moldoveanu, G.A.; Papangelakis, V.G. Recovery of rare earth elements adsorbed on clay minerals: II. Leaching with ammonium sulfate. Hydrometallurgy 2013, 131, 158–166. [Google Scholar] [CrossRef]
- Li, Y. Ion Adsorption Rare Earth Resources and Their Green Extraction; Chemical Industry Press: Beijing, China, 2014; 193p. [Google Scholar]
- Zhou, F.; Liu, Q.; Feng, J.; Su, J.; Liu, X.; Chi, R. Role of initial moisture content on the leaching process of weathered crust elution-deposited rare earth ores. Sep. Purif. Technol. 2019, 217, 24–30. [Google Scholar] [CrossRef]
- Aberg, B. Void ratio of noncohesive soils and similar materials. J. Geotech. Eng. 1992, 118, 1315–1334. [Google Scholar] [CrossRef]
- Wu, A.X.; Yin, S.H.; Li, J.F. Influential factors of permeability rule of leaching solution in ion-absorbed rare earth deposits with in-situ leaching. J. Cent. South. Univ. Sci. Technol. 2005, 36, 506–510. [Google Scholar] [CrossRef]
- Yin, S.H.; Qi, Y.; Xie, F.F.; Chen, X.; Wang, L.M. Permeability characteristic of weathered crust elution-deposited rare earth ores under different pore structures. Chin. J. Nonferrous Met. 2018, 28, 1043–1049. [Google Scholar] [CrossRef]
- Luo, S.H.; Huang, Q.Q.; Wang, G.S.; Shi-Li, H.U.; Hong, B.G. Permeability change rule of ion-adsorption rare-earth in ore leaching process. Nonferrous Met. Sci. Eng. 2014, 597, 95–99. [Google Scholar] [CrossRef]
- Zuo, H.; Wang, Y.; Jiang, H.; Chen, X. Seepage properties of leaching solution in ion-absorbed rare earth deposits under effect of electric field. J. Chin. Soc. Rare Earths 2007, 25, 80–84. [Google Scholar] [CrossRef]
- Xue, Z.; Gan, D.; Zhang, Y.; Liu, Z.; Duan, X.; Huang, M. Liquid spread mechanisms in high-temperature underground stope leaching. Miner. Eng. 2020, 156, 106497. [Google Scholar] [CrossRef]
- Liu, H.; Zheng, J.; Liu, Q. A study on infiltration, transportation and transformation of Pb and Cd in compacted clayliner. Res. Environ. Sci. 1997, 10, 56–60. [Google Scholar] [CrossRef]
- Tang, X.W.; Ying, F.; Kou, N.Y.; Wang, Z.Q. Effects of cation adsorption on properties of silt clay and mixed dredged soil. Rock Soil Mech. 2010, 31, 2519–2524. [Google Scholar] [CrossRef]
- Yong, R.N.; Ouhadi, V.R.; Goodarzi, A.R. Effect of Cu2+ ions and buffering capacity on smectite microstructure and performance. J. Geotech. Geoenvironmental Eng. 2009, 135, 1981–1985. [Google Scholar] [CrossRef]
- Li, Z.; Katsumi, T.; Inui, T. Hydraulic conductivity of kaolin permeated with salt solution. In Advances in Unsaturated Soil, Geo-Hazard, and Geo-Environmental Engineering, Proceedings of the GeoHunan International Conference 2011, Hunan, China, 9–11 June 2011; Bulut, R., Tsukamoto, Y., Deng, A., Katsumi, T., Kokusho, T., Eds.; ASCE: New York, NY, USA, 2011; pp. 34–41. [Google Scholar]
- Zhang, Z.H.; Li, H.Y.; Chen, J.Y.; Lei, Y. Permeability of saturated clay eroded by mixed heavy metal ions. Rock Soil Mech. 2016, 37, 2467–2476. [Google Scholar] [CrossRef]
- He, L.; Feng, T.; Fu, S.; Zhu, D. Study on extraction of rare earth from ion type rare earth ore by ammonium sulfate leaching. Chin. Rare Earths 1983, 3, 1–5. [Google Scholar] [CrossRef]
- Zhou, D.; Li, Z.; Luo, X.; Su, J. Leaching of rare earth elements from contaminated soils using saponin and rhamnolipid bio-surfactant. J. Rare Earths 2017, 35, 911–919. [Google Scholar] [CrossRef]
- Zhao, Z.; Zhou, X.P.; Qian, Q.H. Fracture characterization and permeability prediction by pore scale variables extracted from X-ray CT images of porous geomaterials. Sci. China Technol. Sci. 2020, 63, 755–767. [Google Scholar] [CrossRef]
- Wang, G.; Qin, Y.; Shen, J.; Chen, S.; Han, B.; Zhou, X. Dynamic-change laws of the porosity and permeability of low- to medium-rank coals under heating and pressurization treatments in the eastern Junggar Basin, China. J. Earth Sci. 2018, 29, 607–615. [Google Scholar] [CrossRef]
- Zhou, H.; Hu, J.; Luo, X.; Zhong, Z. Percolation leaching behavior of ion-adsorption-type rare earth ore. Chin. J. Rare Met. 2018, 35, 531–536. [Google Scholar] [CrossRef]
- Jing, Q.; Chai, L.; Huang, X.; Tang, C.; Guo, H.; Wang, W. Behavior of ammonium adsorption by clay mineral halloysite. Trans. Nonferrous Met. Soc. China 2017, 27, 1627–1635. [Google Scholar] [CrossRef]
- Wang, J.H.; Zhang, X.; Zhang, B.; Zhao, Y.; Zhai, R.; Liu, J.; Chen, R. Rapid adsorption of Cr (VI) on modified halloysite nanotubes. Desalination 2010, 259, 22–28. [Google Scholar] [CrossRef]
- de Jonge, L.W.; Kjaergaard, C.; Moldrup, P. Colloids and colloid-facilitated transport of contaminants in soils: An introduction. Vadose Zo. J. 2004, 3, 321–325. [Google Scholar] [CrossRef]
- Bekhit, H.M.; Hassan, A.E. Two-dimensional modeling of contaminant transport in porous media in the presence of colloids. Adv. Water Resour. 2005, 28, 1320–1335. [Google Scholar] [CrossRef]
- Stumm, W. Chemical interaction in particle separation. Environ. Sci. Technol. 1977, 11, 1066–1070. [Google Scholar] [CrossRef]
- McCarthy, J.F.; Zachara, J.M. ES&T Features: Subsurface Transport of Contaminants. Environ. Sci. Technol. 1989, 23, 496–502. [Google Scholar] [CrossRef]
- Roy, S.B.; Dzombak, D.A. Colloid release and transport processes in natural and model porous media. Colloids Surf. A Physicochem. Eng. Asp. 1996, 107, 245–262. [Google Scholar] [CrossRef]
- Sen, T.K.; Khilar, K.C. Review on subsurface colloids and colloid-associated contaminant transport in saturated porous media. Adv. Colloid Interface Sci. 2006, 119, 71–96. [Google Scholar] [CrossRef]
- McCarthy, J.F.; McKay, L.D. Colloid transport in the subsurface: Past, present, and future challenges. Vadose Zo. J. 2004, 3, 326–337. [Google Scholar] [CrossRef]
- Grolimund, D.; Borkovec, M. Long-term release kinetics of colloidal particles from natural porous media. Environ. Sci. Technol. 1999, 33, 4054–4060. [Google Scholar] [CrossRef]
- Saiers, J.E.; Hornberger, G.M. The influence of ionic strength on the facilitated transport of cesium by kaolinite colloids. Water Resour. Res. 1999, 35, 1713–1727. [Google Scholar] [CrossRef]
- McDowell-Boyer, L.M. Chemical mobilization of micron-sized particles in saturated porous media under steady flow conditions. Environ. Sci. Technol. 1992, 26, 586–593. [Google Scholar] [CrossRef]
- Bergendahl, J.; Grasso, D. Colloid generation during batch leaching tests: Mechanics of disaggregation. Colloids Surf. A Physicochem. Eng. Asp. 1998, 135, 193–205. [Google Scholar] [CrossRef]
- Bergendahl, J.; Grasso, D. Prediction of colloid detachment in a model porous media: Thermodynamics. AIChE J. 1999, 45, 475–484. [Google Scholar] [CrossRef]
- Wikiniyadhanee, R.; Chotpantarat, S.; Ong, S.K. Effects of kaolinite colloids on Cd2+ transport through saturated sand under varying ionic strength conditions: Column experiments and modeling approaches. J. Contam. Hydrol. 2015, 182, 146–156. [Google Scholar] [CrossRef]
- Nocito-Gobel, J.; Tobiason, J.E. Effects of ionic strength on colloid deposition and release. Colloids Surf. A Physicochem. Eng. Asp. 1996, 107, 223–231. [Google Scholar] [CrossRef]
- Grolimund, D.; Borkovec, M. Colloid-facilitated transport of strongly sorbing contaminants in natural porous media: Mathematical modeling and laboratory column experiments. Environ. Sci. Technol. 2005, 39, 6378–6386. [Google Scholar] [CrossRef]
- García-García, S.; Wold, S.; Jonsson, M. Effects of temperature on the stability of colloidal montmorillonite particles at different pH and ionic strength. Appl. Clay Sci. 2009, 43, 21–26. [Google Scholar] [CrossRef]
- Torkzaban, S.; Bradford, S.A.; Vanderzalm, J.L.; Patterson, B.M.; Harris, B.; Prommer, H. Colloid release and clogging in porous media: Effects of solution ionic strength and flow velocity. J. Contam. Hydrol. 2015, 181, 161–171. [Google Scholar] [CrossRef] [Green Version]
- Tang, X.Y.; Weisbrod, N. Colloid-facilitated transport of lead in natural discrete fractures. Environ. Pollut. 2009, 157, 2266–2274. [Google Scholar] [CrossRef]
- Hogg, R.; Healy, T.W.; Fuerstenau, D.W. Mutual coagulation of colloidal dispersions. Trans. Faraday Soc. 1966, 62, 1638–1651. [Google Scholar] [CrossRef]
- Machado, S.L.; da Silva-Paes-Cardoso, L.; de Oliveira, I.B.; de Faria-Mariz, D.; Karimpour-Fard, M. Modeling soil permeability when percolated by different soil. Transp. Porous Media 2016, 111, 763–793. [Google Scholar] [CrossRef]
- Ishiguro, M.; Nakaishi, K.; Nakajima, T. Saturated hydraulic conductivity of a volcanic ash soil affected by repulsive potential energy in a multivalent anionic system. Colloids Surf. A Physicochem. Eng. Asp. 2003, 230, 81–88. [Google Scholar] [CrossRef]
Figure 1.
A self-made column leaching device for the permeability test of the ore samples.

Figure 2.
Permeability coefficient profiles of samples in different leaching liquids. (a) Sample 1 was leached with deionized (DI) water; (b) sample 2 was leached with a (NH4)2SO4 solution.
Figure 2.
Permeability coefficient profiles of samples in different leaching liquids. (a) Sample 1 was leached with deionized (DI) water; (b) sample 2 was leached with a (NH4)2SO4 solution.

Figure 3.
pH in the collected solution during the leaching of ore samples with DI water (sample 1) and (NH4)2SO4 (sample2).
Figure 3.
pH in the collected solution during the leaching of ore samples with DI water (sample 1) and (NH4)2SO4 (sample2).

Figure 4.
Inversion images between samples leached with DI water (a) and (NH4)2SO4 solution (b) during the leaching period. The black areas in the image represent solid matter, and the white areas represent pores.
Figure 4.
Inversion images between samples leached with DI water (a) and (NH4)2SO4 solution (b) during the leaching period. The black areas in the image represent solid matter, and the white areas represent pores.

Figure 5.
Histogram of pore size distributions of a (NH4)2SO4 solution-leached sample. The pores of the sample are divided into six sections according to the pore radius (1~5 μm, 5~10 μm, 10~25 μm, 25~60 μm, 60~120 μm, and >120 μm). The data are acquired every 0.5 h, and the leaching time is 3 h.
Figure 5.
Histogram of pore size distributions of a (NH4)2SO4 solution-leached sample. The pores of the sample are divided into six sections according to the pore radius (1~5 μm, 5~10 μm, 10~25 μm, 25~60 μm, 60~120 μm, and >120 μm). The data are acquired every 0.5 h, and the leaching time is 3 h.

Figure 6.
Comparison of REO contents of the sample during the (NH4)2SO4 solution leaching test. (a–c): the REO content plot of the upper (a), middle (b) and lower (c) part of the sample.
Figure 6.
Comparison of REO contents of the sample during the (NH4)2SO4 solution leaching test. (a–c): the REO content plot of the upper (a), middle (b) and lower (c) part of the sample.

Figure 7.
SEM images of the center part of samples during the (NH4)2SO4 solution leaching process. (a–c): SEM images of the middle part of the samples with a leaching time of 0.5 h (a), 1 h (b) and 2 h (c).
Figure 7.
SEM images of the center part of samples during the (NH4)2SO4 solution leaching process. (a–c): SEM images of the middle part of the samples with a leaching time of 0.5 h (a), 1 h (b) and 2 h (c).

Figure 8.
High-magnification SEM analysis of the center part of the sample leached with (NH4)2SO4 solution for 1 h. (a–c): SEM images with 2000 (a), 20,000 (b) and 50,000 (c) magnifications.
Figure 8.
High-magnification SEM analysis of the center part of the sample leached with (NH4)2SO4 solution for 1 h. (a–c): SEM images with 2000 (a), 20,000 (b) and 50,000 (c) magnifications.

Figure 9.
The result of the EDS test on microparticles. (a) The locations of test points on the specimens, labeled from 353 to 359; (b) chemical compositions of microparticles.
Figure 9.
The result of the EDS test on microparticles. (a) The locations of test points on the specimens, labeled from 353 to 359; (b) chemical compositions of microparticles.

Figure 10.
Schematic diagram of the effect of ionic strength on the electric double layer on the surface of a colloid at the different stages during the leaching process. (a–c): the electric double layer before (a), during (b) and after (c) ion exchange.
Figure 10.
Schematic diagram of the effect of ionic strength on the electric double layer on the surface of a colloid at the different stages during the leaching process. (a–c): the electric double layer before (a), during (b) and after (c) ion exchange.


Table 1.
Particle size distribution of undisturbed rare earth sample.
| Size (mm) | >5 | 1–5 | 0.5–1 | 0.1–0.5 | 0.075–0.1 | 0.075–0.005 | <0.005 |
|---|---|---|---|---|---|---|---|
| Percentage (%) | 2.51 | 17.28 | 16.36 | 39.06 | 9.82 | 10.61 | 4.36 |
Table 2.
Parameters of undisturbed rare earth sample.
| Parameter | Density | Moisture Content | Void Ratio | Specific Gravity |
|---|---|---|---|---|
| (g/cm3) | (%) | (%) | ||
| Value | 1.75 | 13 | 51 | 2.675 |
Table 3.
Parameters of the remolded rare earth sample.
| Parameter | Density | Moisture Content | Void Ratio | Diameter | Height | REO Content |
|---|---|---|---|---|---|---|
| (g/cm3) | (%) | (%) | (mm) | (mm) | (g/t) | |
| Value | 1.75 | 13 | 48 | 50 | 100 | 700±30 |
Table 4.
REO contents in different parts of the sample during the (NH4)2SO4 leaching test.
| Leaching Time (h) | REO Content (Upper) (g/t) | REO Content (Middle) (g/t) | REO Content (Lower) (g/t) |
|---|---|---|---|
| 0 | 727 | 735 | 744 |
| 0.5 | 531.8 | 702.9 | 733.5 |
| 1 | 497.4 | 447.6 | 663.5 |
| 1.5 | 379.4 | 354.9 | 643 |
| 2 | 249.3 | 260 | 373 |
| 2.5 | 249.6 | 255.1 | 341.8 |
| 3 | 227 | 229.2 | 229.4 |
Table 5.
The weight percentages of elements contained in each test point.
| Test Point Number | N (%) | O (%) | F (%) | Al (%) | Si (%) | S (%) | K (%) | Fe (%) | Zr (%) | Nb (%) | Mo (%) | Eu (%) |
|---|---|---|---|---|---|---|---|---|---|---|---|---|
| 353 | 11.46 | 59.36 | 0 | 15.38 | 12.44 | 0.24 | 0.21 | 0.08 | 0 | 0.73 | 0 | 0.1 |
| 354 | 10.85 | 60.53 | 4.26 | 12.04 | 10 | 0.24 | 0.07 | 0.02 | 0.42 | 1.55 | 0 | 0.02 |
| 355 | 10.19 | 46.91 | 1.46 | 22.14 | 15.84 | 0 | 0.03 | 0.03 | 0.43 | 2.37 | 0.6 | 0 |
| 356 | 11.07 | 50.2 | 1.41 | 16.02 | 13.86 | 0 | 4.01 | 1.25 | 0.3 | 1.64 | 0.07 | 0.17 |
| 357 | 12.42 | 59.69 | 0 | 1.89 | 24.65 | 0.05 | 0 | 0.04 | 0 | 1.18 | 0 | 0.08 |
| 358 | 11.47 | 55.54 | 0 | 10.47 | 11.21 | 0.2 | 5.54 | 3.86 | 0 | 0.79 | 0 | 0.92 |
| 359 | 11.61 | 58.06 | 0 | 15.29 | 12.28 | 0.39 | 0.74 | 0.13 | 0.06 | 1.4 | 0 | 0.04 |
© 2020 by the authors. Licensee MDPI, Basel, Switzerland. This article is an open access article distributed under the terms and conditions of the Creative Commons Attribution (CC BY) license (http://creativecommons.org/licenses/by/4.0/).
Share and Cite
MDPI and ACS Style
Wang, X.; Wang, H.; Sui, C.; Zhou, L.; Feng, X.; Huang, C.; Zhao, K.; Zhong, W.; Hu, K. Permeability and Adsorption–Desorption Behavior of Rare Earth in Laboratory Leaching Tests. Minerals 2020, 10, 889. https://doi.org/10.3390/min10100889
AMA Style
Wang X, Wang H, Sui C, Zhou L, Feng X, Huang C, Zhao K, Zhong W, Hu K. Permeability and Adsorption–Desorption Behavior of Rare Earth in Laboratory Leaching Tests. Minerals. 2020; 10(10):889. https://doi.org/10.3390/min10100889
Chicago/Turabian StyleWang, Xiaojun, Hao Wang, Can Sui, Lingbo Zhou, Xiao Feng, Chengguang Huang, Kui Zhao, Wen Zhong, and Kaijian Hu. 2020. "Permeability and Adsorption–Desorption Behavior of Rare Earth in Laboratory Leaching Tests" Minerals 10, no. 10: 889. https://doi.org/10.3390/min10100889
Note that from the first issue of 2016, this journal uses article numbers instead of page numbers. See further details here.