Transformation-Induced Ductility of Reverse Austenite Evolved by Low-Temperature Tempering of Martensite


1
State Key Laboratory of Rolling and Automation, Northeastern University, Shenyang 110819, China
2
Department of Materials Physics and Chemistry, School of Materials Science and Engineering, Northeastern University, Shenyang 110819, China
3
Laboratory for Excellence in Advanced Steel Research, Department of Metallurgical, Materials and Biomedical Engineering, University of Texas at El Paso, 500 W. University Avenue, El Paso, TX 79968, USA
*
Author to whom correspondence should be addressed.
Metals 2020, 10(10), 1343; https://doi.org/10.3390/met10101343
Submission received: 11 September 2020
/
Revised: 30 September 2020
/
Accepted: 2 October 2020
/
Published: 7 October 2020
(This article belongs to the Special Issue Reversed Transformation in Iron-Based Alloys)
Abstract
:A novel steel combining the “quenching and tempering (Q&T)” process was exploited that can achieve the enhancement of austenite by interface migration during tempering the martensitic matrix mixed with films of austenite. A high uniform elongation (12%) combined with high yield tensile strength (1500 MPa) was obtained, which showed distinct advantages over all the other advanced high strength steels under development for a lightweight car body. Furthermore, the effect of austenite on enhancement of ductility in “Q&T” steels with a martensite matrix was elucidated, which suggested that the ductility was promoted by enhancing boundary sliding and delaying work hardening of the martensitic matrix.
1. Introduction
With continued demand for high strength steels, different processes are being developed. Moreover, the concept of providing a considerable fraction of retained austenite (fγ) is widely accepted to tailor the third-generation advanced high strength steels (AHSS) [1,2], such as medium Mn steels [3,4] and quenching and partitioning (Q&P) steels [5,6], which can achieve an excellent combination of strength and ductility by relying on the martensitic transformation of retained austenite, i.e., transformation induced plasticity (TRIP) effect. Medium-Mn steels are known for austenite-reverted transformation (ART-annealing) that generates a large amount of retained austenite during intercritical annealing [3]. However, the high ART-annealing temperature results in a large amount of reverted austenite and annealed martensite with low dislocation density. These aspects inevitably lower the yield strength in the ART-annealing medium-Mn steels. The yield strength is a critical parameter for crash safety, especially for anti-intrusion performance [7].
In the Q&P process, the steel is first quenched to a certain temperature (quenching temperature, QT) between the martensite start and the martensite finish temperatures. Next, carbon is partitioned from carbon-rich martensite into austenite at a relatively low temperature. Thus, more stabilized austenite is retained after final quenching to room temperature. Hence, the microstructure of Q&P steels consists of martensite with high dislocation density and carbon-rich austenite, which can provide high yield strength and high ductility. Studies on Q&P steels mainly focused on mechanical properties [6,8], carbon partitioning [5,9] and interface migration [9,10,11,12,13]. It is commonly agreed that the TRIP effect plays a critical role in improving ductility of Q&P steels, especially in 1500 MPa grade high strength Q&P steels [14]. In order to avoid the problems of the poor formability of AHSS, the integration of press hardening steels (PHS) and the Q&P concept (PHS-Q&P) has been developed to realize an increase in elongation by controlling QT [15,16]. Some studies focused on studying carbon partitioning and interface migration mechanisms through alloy designs in Q&P steels [9,12,13]. In the alloy designs, QT was set at ambient temperature, such that both the baseline values of fγ and the carbon content in the retained austenite () at QT could be quantified easily. After carbon partitioning, the migration of γ/α′ interface was ascertained by the changing of fγ. The interface migration that increases the fraction of austenite is related to the local equilibrium at the interface [17] and the crystallographic features [12]. A model based on local equilibrium at the interface was constructed and successfully used to predict interface migration [9,13]. However, to the best of our understanding, studies of the enhancement of elongation by taking advantage of austenite reversion during low temperature partitioning are rare.
Inspired by the concept of Q&P, a new strategy of increasing the fraction of austenite through a low temperature tempering process was developed in the process of quenching and tempering (QT&P), which showed great potential for the application in PHS and other processes. In the QT&P process, the austenite was retained at room temperature after quenching, and carbon partitioning into austenite was desired to be combined with increase of fγ by interface migration during the tempering processes. Microstructure evolution and its relationship with mechanical properties in the QT&P process were explored. Furthermore, the ductility improvement was discussed, based on the effect of austenite on delaying work hardening and enhancing boundary sliding during plastic deformation.
2. Materials and Methods
In previous alloy designs that focused on interface migration during the Q&P process, the carbon content in the alloy was generally high ~0.4–1.0 wt.% [9,12,13], so it could retain more austenite directly after initial quenching to room temperature and contribute to detecting the interface migration easily during the partitioning processes. However, a high-volume fraction of retained austenite is not favorable in the case of 1500 MPa grade high strength steels [18], as it may transform to large-size fresh martensite and result in low yield strength and low ductility [19]. Therefore, the fraction of austenite after initial quenching was designed to be ~10–15 vol.% in the study described here. Furthermore, from the perspective of performance in PHS lines and directly observing the increase of fγ, the QT was also set at ambient temperature. According to the Koistinen and Marburger equation [20], the ideal MS value in our study should be in the range of 170–210 °C. Based on the relationship between chemical composition and MS following [20]: MS = 539 − 423wC − 30.4wMn − 17.7wNi − 12.1wCr − 7.5wMo, where wi represents the weight percent of the element, a new medium manganese steel was developed. The carbon content in the alloy was reduced to 0.25 wt.% to ensure the ductility of martensite. A portion of 7.5 wt.% manganese was added to lower the MS temperature. The addition of 1 wt.% silicon was used to avoid cementite precipitation during tempering, and 0.1 wt.% vanadium was added for grain refinement. The actual chemical composition was 0.24C-7.5Mn-1.1Si-0.1V wt.%, which was cast as a 50 kg ingot by vacuum induction furnace. After homogenizing at 1200 °C for 5 h, the ingot was forged into 60 × 60 mm2 slabs. Then the slabs were homogenized at 1200 °C for 2 h and hot-rolled to 3 mm between 1200 °C and 900 °C, followed by air cooling. Before cold-rolling, the hot-rolled steel sheets were softened at 600 °C for 10 h. Finally, the hot-rolled plate was surface descaled and cold-rolled to 1.5 mm.
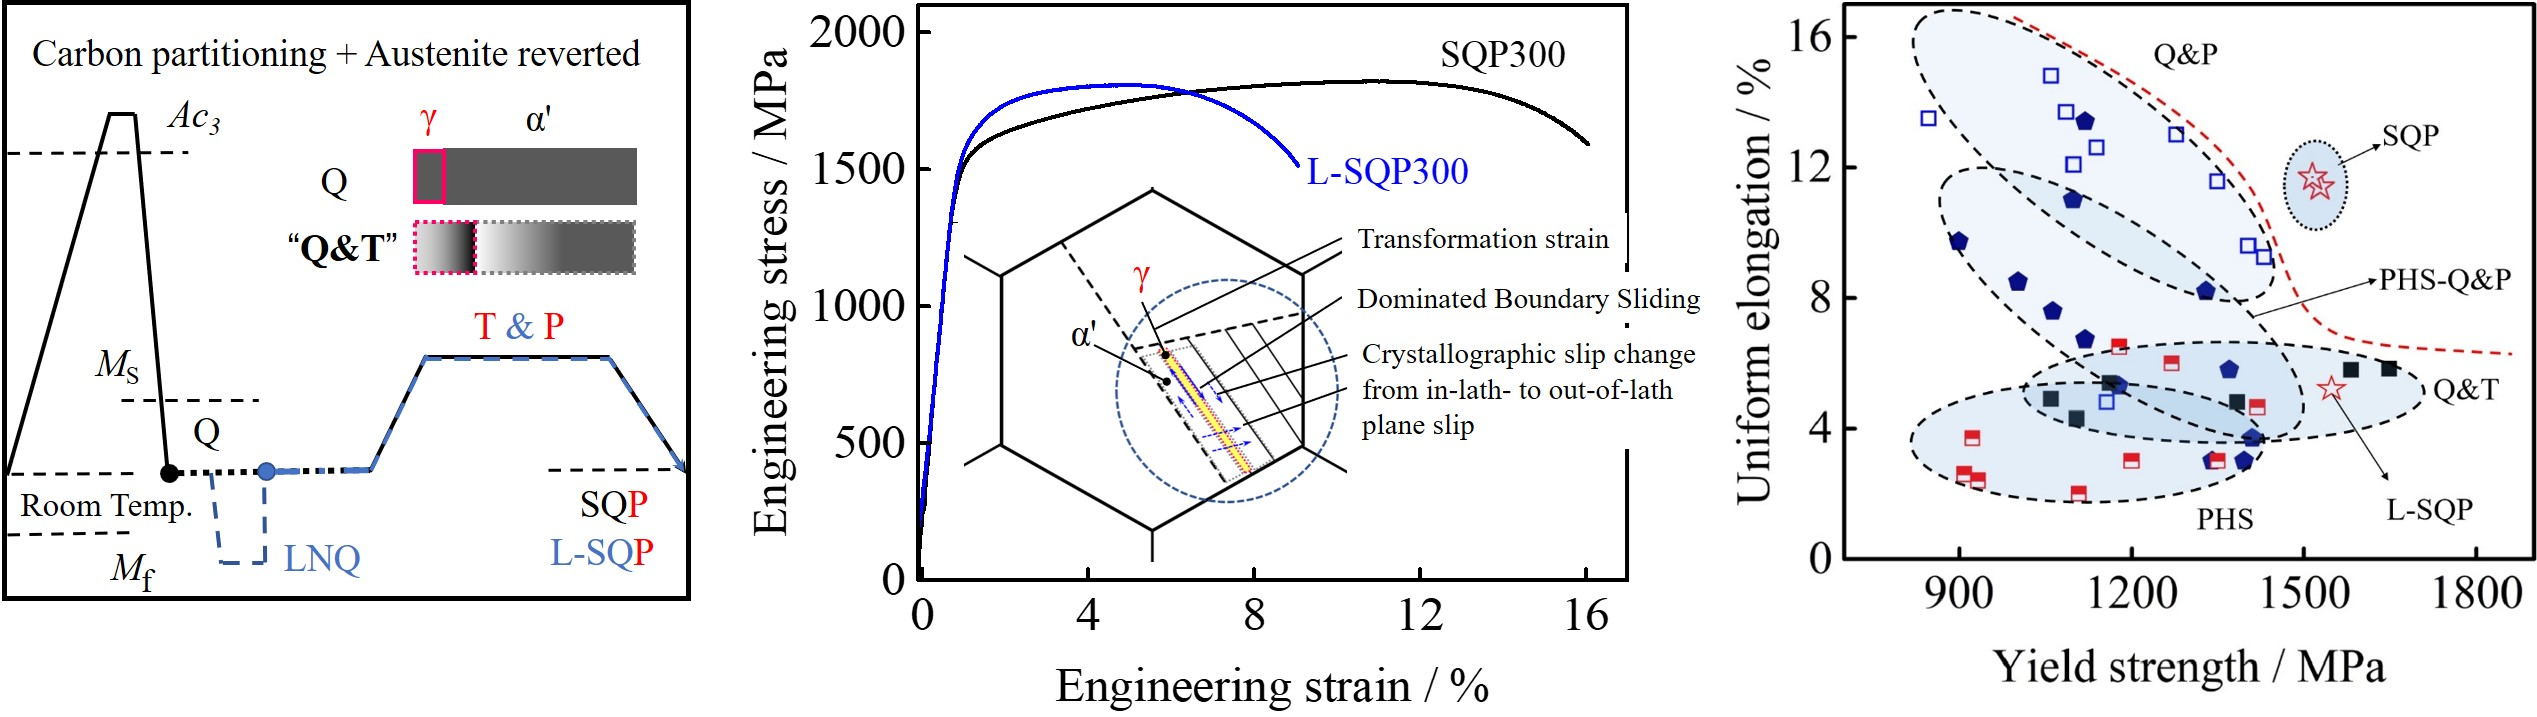
According to the dilatometry results presented in Figure 1a, the Ac1 and Ac3 temperatures were 647 °C and 757 °C, respectively. Martensite started to transform at about MS1 of ~220 °C and plenty of martensite formed at MS2 of ~130 °C. Figure 1b shows the schematic diagram of heat treatments. The heat treatment process for austenitization was carried out at 780 °C for 10 min, followed by water quenching to ambient temperature (W-Q), and the partitioning process (W-QT&P). For comparison, some samples were immersed in liquid nitrogen for 10 min to eliminate as much of the initially retained austenite as possible, a process referred to as L-Q. Then all the samples were tempered at 300 °C for 15 min and named W-QT&P300 and L-QT&P300, respectively.
X-ray diffraction (XRD) was used to measure the volume fraction of retained austenite and carbon concentration in retained austenite [21]. The XRD experiments were conducted using a D/max2400X-ray diffractometer (operated at 56 kV, 182 mA) with Cu Kα radiation at room temperature and the samples were scanned over a 2θ range from 40° to 100° with a step size of 2°/min that included ferrite and austenite peaks. The microstructure was characterized by transmission electron microscope (TEM) (Tecnai G2F20, FEI, Hillsboro, OR, USA). Both TEM images were acquired at an accelerating voltage of 200 kV. Electron backscatter diffraction (EBSD) (Symmetry, Oxford Instruments, Oxford, UK) maps were obtained at a step size of 0.05 μm and analyzed using the MTEX (version 5.28, Ralf Hielscher, Chemnitz, Germany) texture analysis MATLAB (version 2016b, MathWorks, Natick, MA, USA) toolbox [22]. Both TEM foils and EBSD samples were twin-jet polished (StruersTenuPol-5, Buehler, Lakbluff, IL, USA) at a voltage of 20 V in a solution containing 8% perchloric acid. Tensile test specimens were fabricated according to ASTM E8-08 (gauge: 25 mm) and tested at a strain rate of approximately 6.7 × 10⁻⁴·s−1. In situ EBSD experiments were performed on a tensile sample (gauge 2 mm), which was tested by Gatan Microtest 200E (GATAN, Pleasanton, CA, USA) at 0.03 mm/min.
3. Results and Discussion
3.1. Microstructure Evolution during the Quenching and Tempering Process
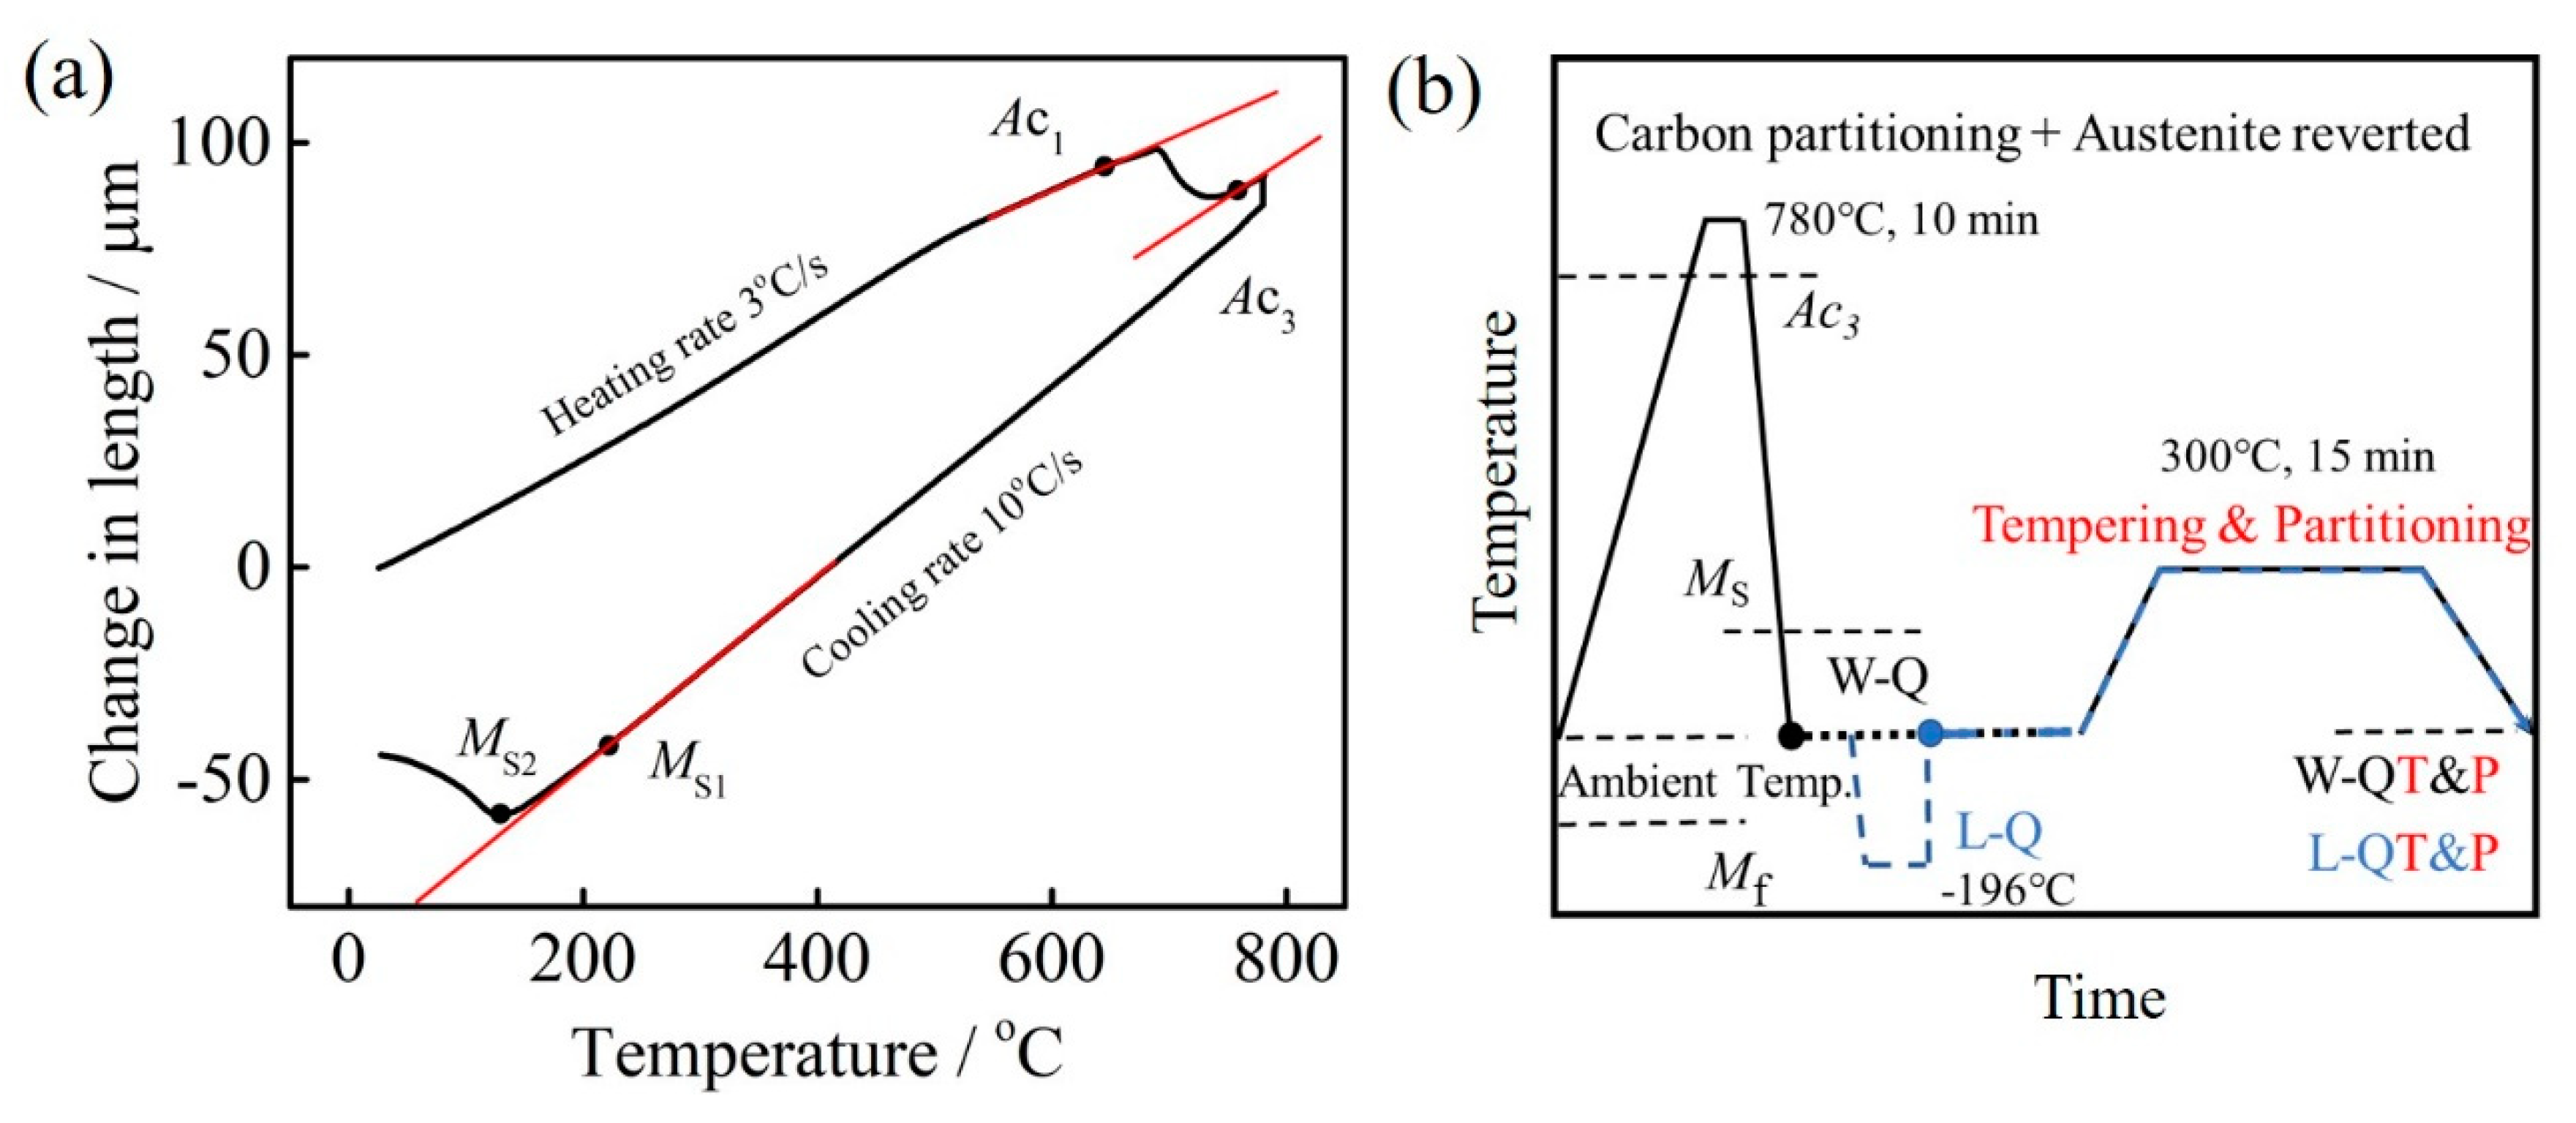
The volume fraction of retained austenite is the primary difference between QT&P steels and traditional Q&T steels. In QT&P steels, the martensitic transformation was not completed until ambient temperature, as observed in Figure 1a. This was further confirmed by the XRD results, and ~14 vol.% austenite was retained at ambient temperature. The microstructures after initial quenching of W-Q samples were characterized by TEM, as shown in Figure 2. Figure 2a shows that the microstructure comprised lath martensite with a high density of dislocations. Figure 2b,c,e,f show bright-field images and dark-field images of retained austenite, respectively. The selected area electron diffraction (SAED) patterns inserted in Figure 2b,e indicate that orientation relationships (OR) between γ/α′ are Kurdjumov–Sachs (K–S) OR. For coarse prior austenite grains (PAG) (Figure 2b,c), the majority of retained austenite was located at the interface of martensite laths with a width of 50–200 nm in W-Q&P steel, while for fine PAG, the austenite was primarily located at the boundaries of PAG (Figure 2e,f).
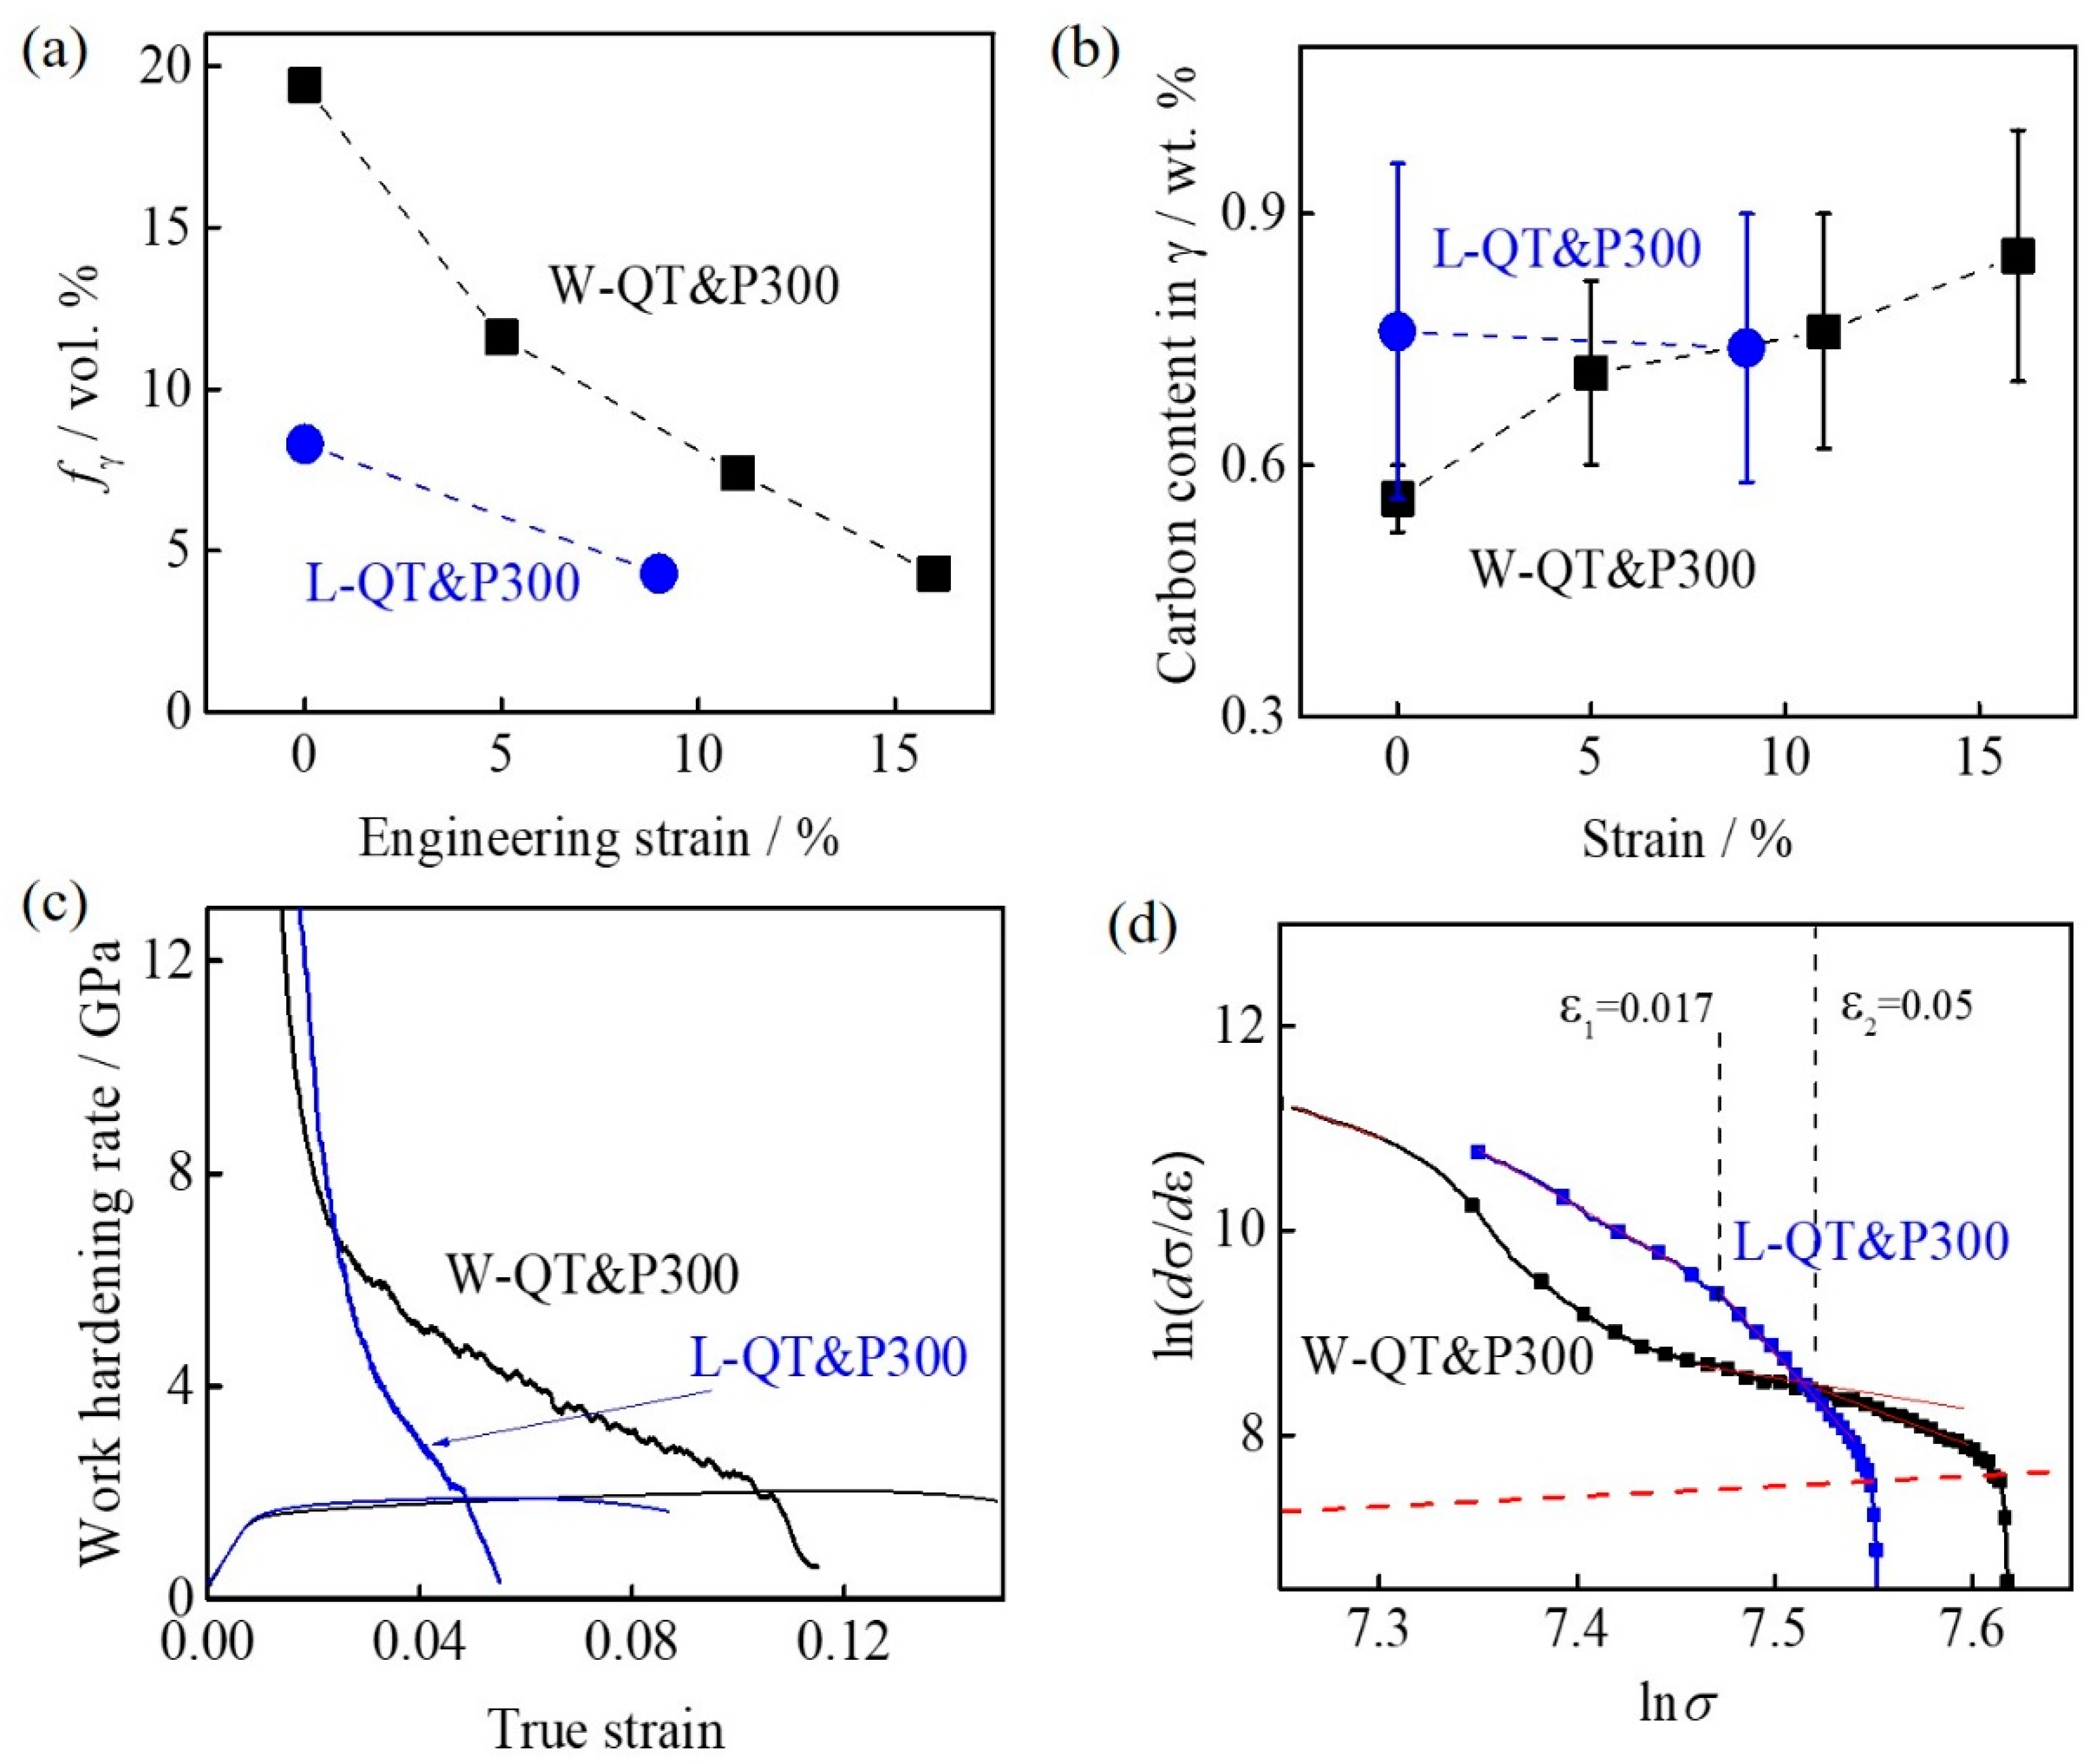
During tempering, the carbon partitioning through the γ/α′ interface was prominent, which confirmed the technical feasibility of QT&P. As shown in Figure 3a, both the volume fraction of retained austenite and average carbon content in retained austenite of QT&P steels was increased after tempering at 300 °C for 15 min. After tempering, the volume fraction of retained austenite was increased from ~14 to ~19 vol.% and the average carbon content in retained austenite increased from 0.41 ± 0.08 wt.% to 0.56 ± 0.03 wt.% simultaneously.
The increments of fγ were envisaged to be close to the migration of γ/α′ interface during tempering. Rong et al. [10] first reported the increment of fγ during partitioning through interface migration [11], which showed that the interface migration was significant and could occur in either direction. Based on the QP-LE (local equilibrium) and QP-PE (paraequilibrium) model, QT determines the initial austenite fraction and the direction of interface migration between martensite and austenite [14]. Figure 3b shows the evolution of austenite during tempering at 300 °C predicted by QP-PE models. This means that the QP-PE model can qualitatively explain the increase in the austenite content during the tempering process. During tempering, only two stages are predicted to occur: (1) PE-(α′→γ) transformation stage, during which carbon diffuses from martensite to austenite, and the interface moves into martensite; (2) the PE-(γ→α′), in which the carbon concentration in austenite reaches homogenization quickly and finally attains the PE state. The simulated object was austenite–martensite with a film-like morphology, the initial thickness of the austenite was assumed to be 70 nm and 30 nm for W-Q and L-Q, respectively, and the total thickness was assumed to be 500 nm. The PE boundaries below 500 °C were linearly extrapolated from those at elevated temperatures because of appropriate thermodynamic data at low temperature in Thermo-Calc [23].
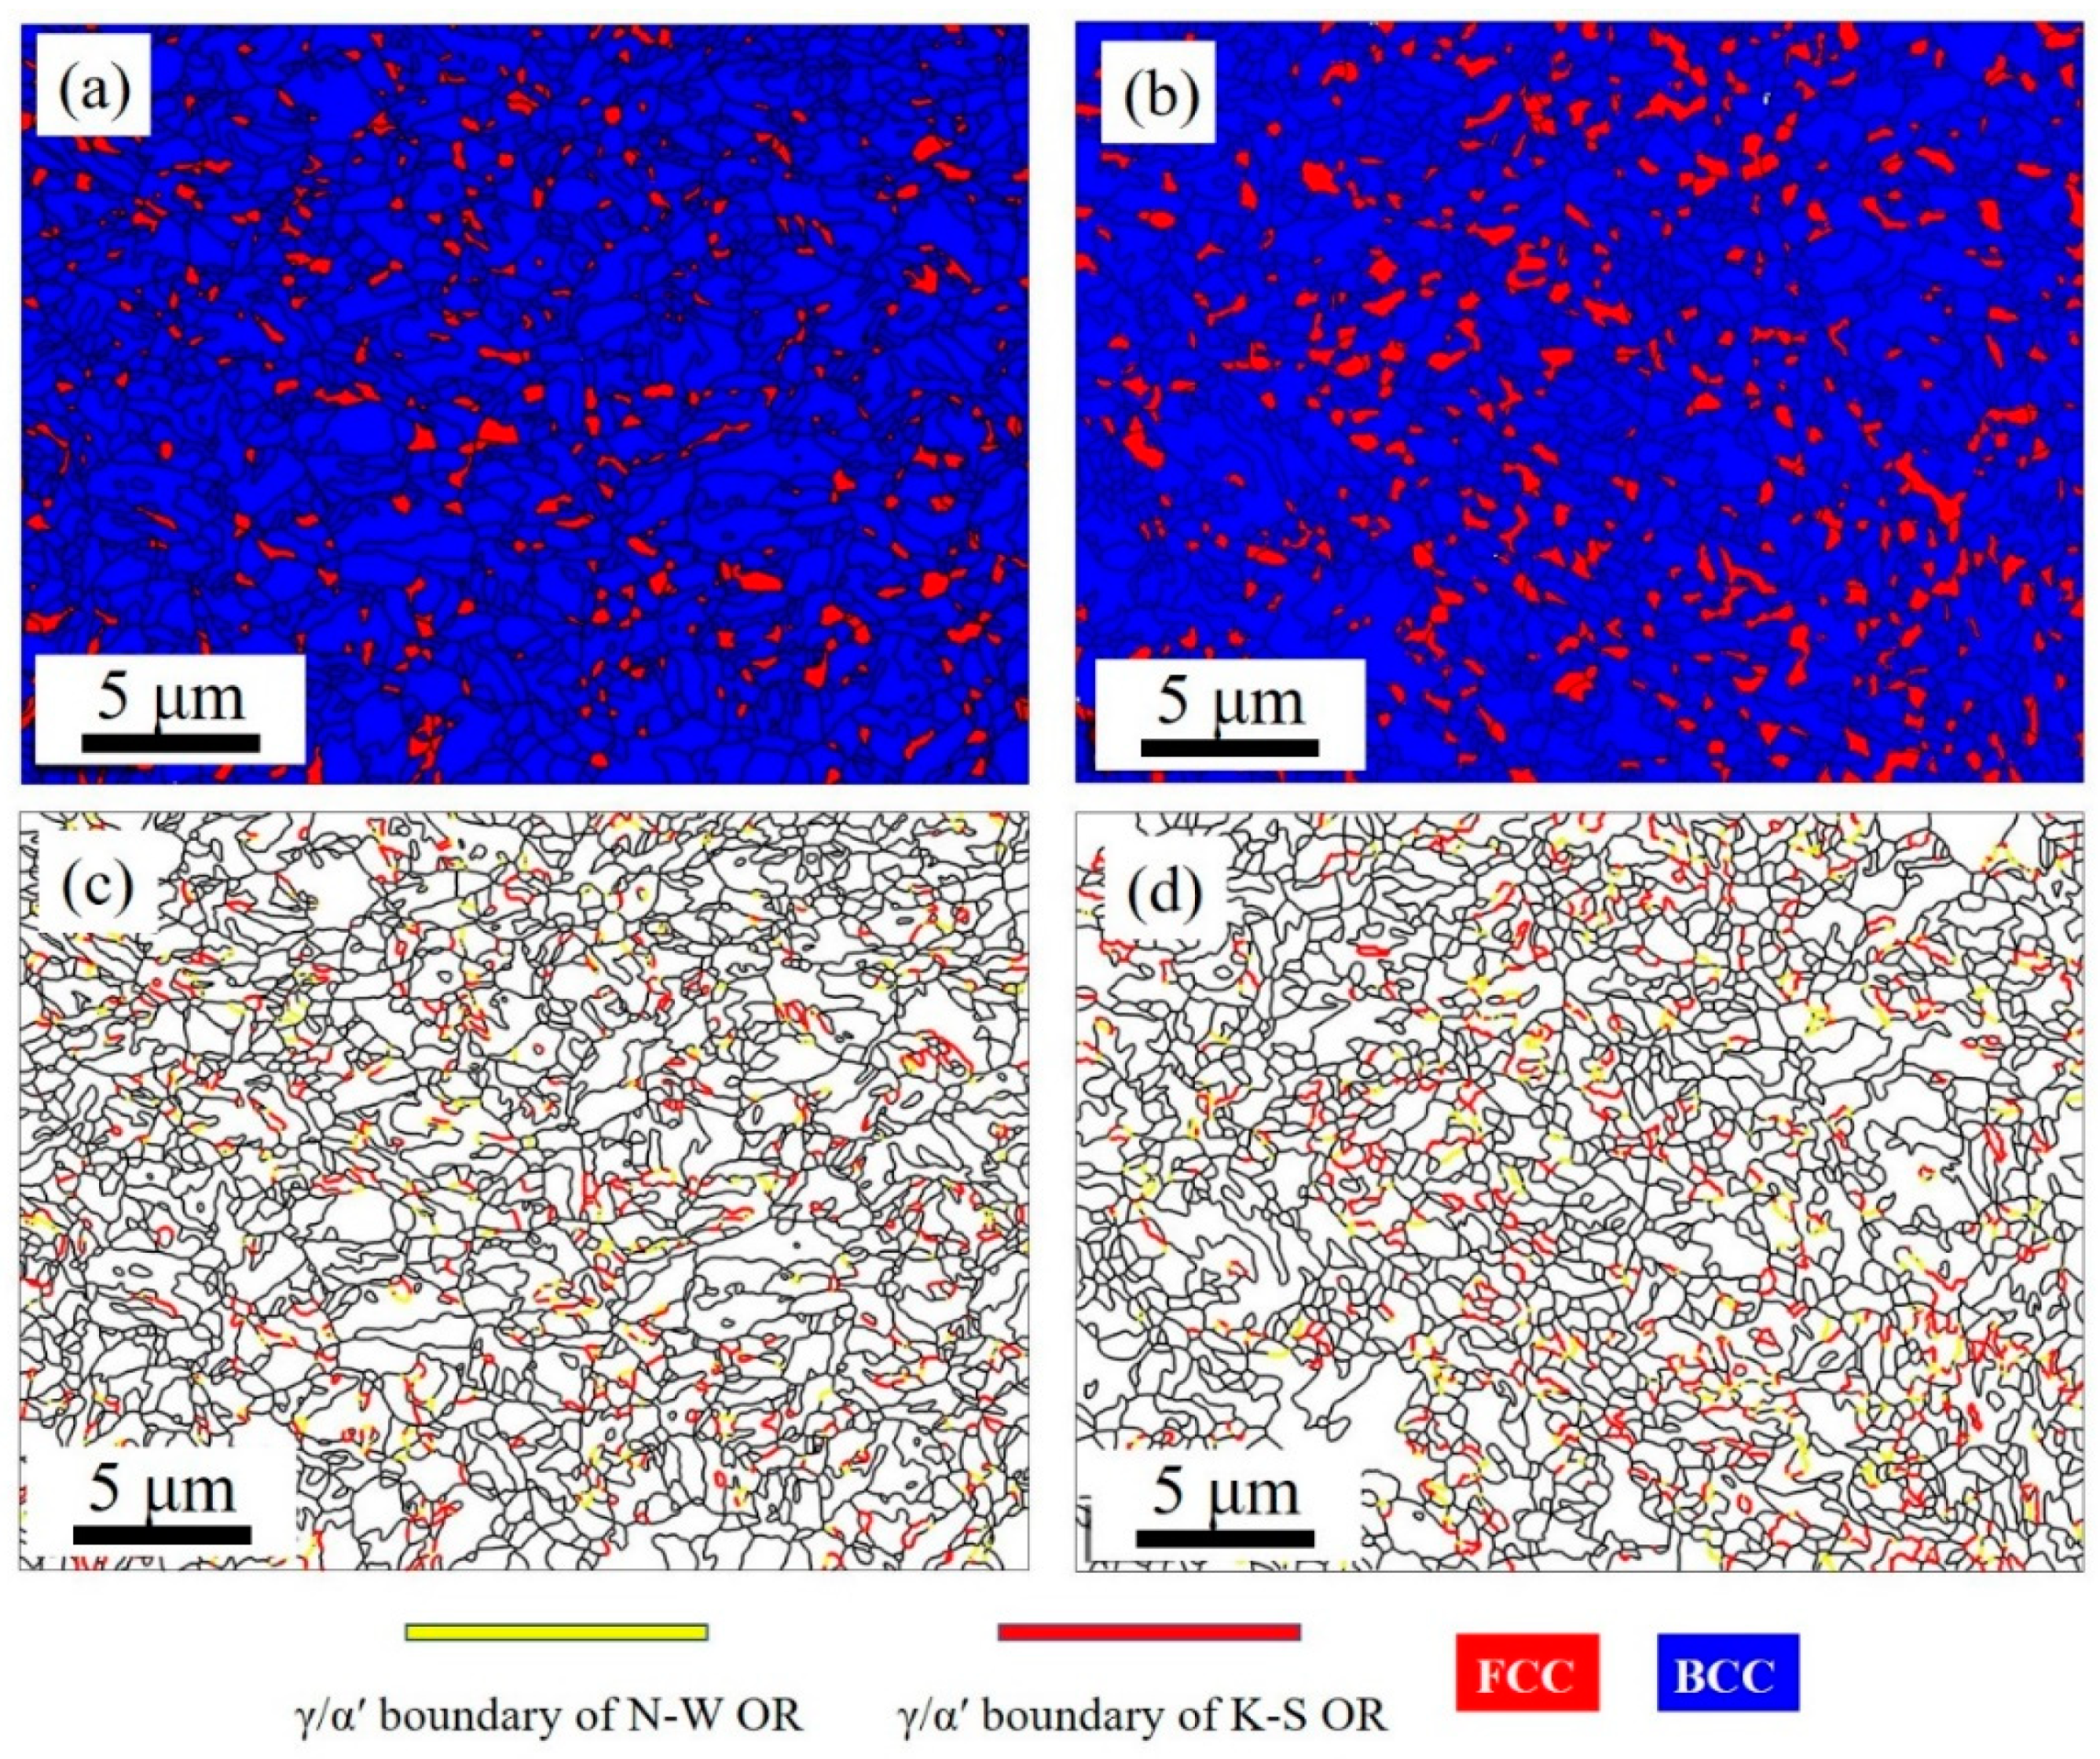
In addition to the effect of thermodynamics on interface migration, the crystallographic orientation relationships of the γ/α′ interface also played a key role. Figure 4 shows the EBSD results of W-Q and W-QT&P300. Compared with the XRD results, the EBSD results showed a lower fraction of austenite due to the limited scan step sizes. According to the EBSD results, after tempering at 300 °C, the fraction of austenite increased from ~7.21 vol.% (W-Q) to ~11.7 vol.% (W-QT&P300). The different characters of the phase boundaries were marked with different colors. K−S OR and Nishiyama−Wassermann (N−W) OR are two common ORs between austenite and martensite. The angular tolerance for this analysis is ±2.5°, which is based on 5.26° difference between K−S and N−W OR [12]. As shown in Figure 4c,d, the γ/α′ phase boundaries associated with the K−S and N−W OR are highlighted in red and yellow, respectively. The ratio of boundary-length of K−S/N−W was ~2.02:1 in W-Q, and after tempering at 300 °C, the ratio of boundary-length of K−S/N−W increased to ~2.38:1 in W-Q&P300. Both of them showed a high tendency to K−S OR, which is almost the same as the results obtained by Speer et al., who found that the γ/α′ interface towards K−S OR could be more mobile [12]. In the case of L-QT&P300, after treatment with liquid nitrogen, the fraction of austenite was significantly decreased, accompanied by the decrease in fraction of γ/α′ boundaries. Thus, the fraction of austenite in L-QT&P300 indicated only a slight increase after tempering.
3.2. Mechanical Properties and Work Hardening Behavior
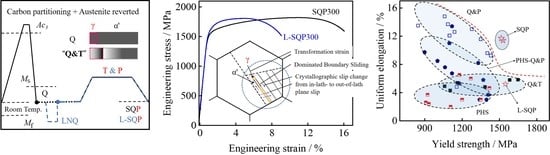
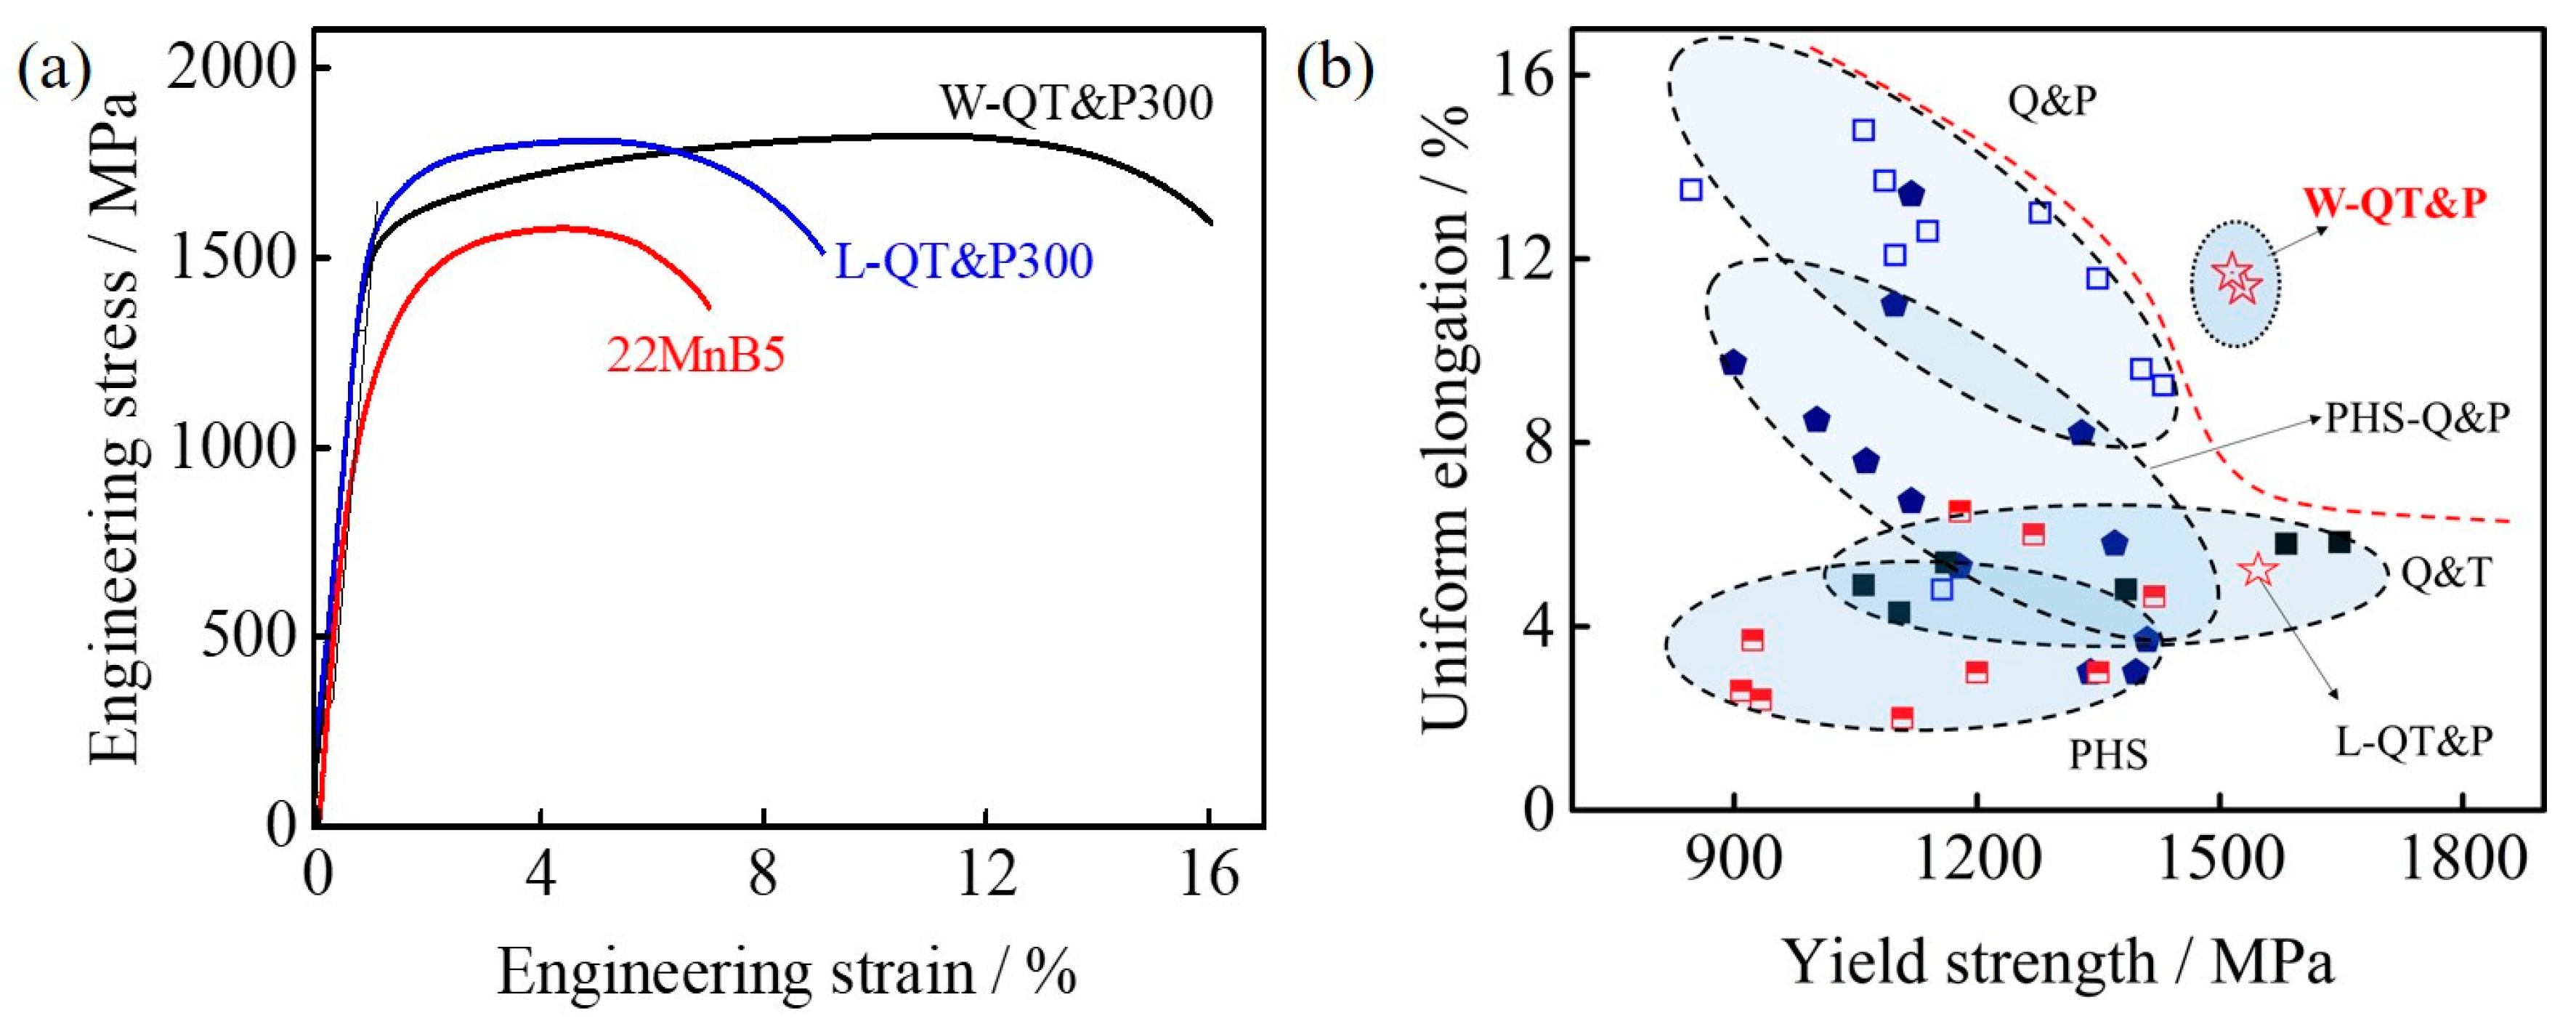
The engineering stress-strain curves of W-QT&P300 and L-QT&P300 are shown in Figure 5a. Both W-QT&P300 and L-QT&P300 exhibited similar tensile strength to 1800MPa, but the uniform elongation significantly decreased from 11.7% (W-QT&P300) to 4.4% (L-QT&P300). Due to the importance of yield stress for anti-intrusion performance, the balance between yield strength and uniform elongation was compared in Figure 5b. The W-QT&P300 steels exhibited obviously improved mechanical properties compared with other traditional quenching and tempering (Q&T) steels [24], PHS [25], Q&P steels [6,8], and PHS-Q&P steels [16,26,27]. Q&T and PHS are the most widely commercialized processes. However, the uniform elongation of less than 6% holds back their further development and application. Meanwhile, although Q&P steels and PHS-Q&P steels have the appropriate balance between uniform elongation and yield strength, the relatively complex processes prevented the finally transition of the technology to full commercialization. The W-QT&P steel is a special kind of Q&T steel and has distinct advantages over traditional Q&T steels with superior mechanical properties compared to other novel Q&P steels. In addition to higher solid solution strengthening by manganese, the lower austenitizing temperature resulted in finer PAG and refinement of the martensitic block size to ~0.42 μm, all of which increased the yield strength of W-QT&P steels compared to conventional Q&P steels. Furthermore, the lower QT in W-QT&P steels rendered higher dislocation density in martensite [28].
The improved uniform elongation in W-QT&P300 is closely related to the transformation of retained austenite. Figure 6a,b show the volume fraction of retained austenite and the average carbon content in retained austenite after different stages of engineering strain. The retained austenite of L-QT&P300 showed higher stability, and both the volume fraction of retained austenite and the average carbon content in retained austenite were almost unchanged during plastic deformation. The retained austenite in W-QT&P300 decreased significantly at low strains, and ~40% of retained austenite transformed to martensite after 5% strain. Meanwhile, the average carbon content in retained austenite increased after 5% strain, which meant the stability of retained austenite improved. After 5% strain, the amount of retained austenite in W-QT&P300 decreased gradually and transformed to hard fresh martensite with plastic deformation.
Figure 6c shows the work hardening rate (dσ/dε) curves of W-QT&P300 and L-QT&P300. According to the instability criterion for tensile deformation, the uniform elongation is closely related to the final dσ/dε and the decreasing rate of dσ/dε. It was obvious that the hard fresh martensite transforming from retained austenite during plastic deformation improved the final dσ/dε, which was responsible for the higher uniform elongation of W-QT&P300 than for that of L-QT&P300. Modified C−J analysis [29] was applied to analyze the work hardening behavior of W-QT&P300 and L-QT&P300, as shown in Figure 6d. Specific attention was given to the hard fresh martensite transformed from retained austenite, which increased the final work hardening rate directly. However, martensitic transformation itself can also influence the work hardening behavior of the martensitic matrix, particularly at low strains. As shown in Figure 6d, modified C−J analysis of L-QT&P300 displays a two-stage linear relationship between ln(dσ/dε) and ln(σ) over the range of uniform strain. In the first stage, the retained austenite with high stability (Figure 6a) deformed almost with no transformation. In the second stage, the main microstructure martensite deformed with decreasing work hardening rate and the ln(dσ/dε) vs. ln(σ) decreased with a constant slope.
In W-QT&P300, martensite was the major microstructural constituent, and it provided primary work hardening. The difference from L-QT&P300 was that a large amount of retained austenite transformed within 5% strain in W-QT&P300. When austenite started to transform to martensite at the beginning of deformation, the slope of ln(dσ/dε) vs. ln(σ) was large due to the martensite transformation contributing to strain without change of stress [30]. Next, the slopes decreased gradually until 0.05 true strain. Interestingly, the true strain, ε2 = 0.05, was the demarcation of different slopes of ln(dσ/dε) vs. ln(σ) for W-QT&P300, as shown in Figure 6d. After 0.05 true strain, the ln(dσ/dε) vs. ln(σ) decreased with a larger slope. It was suggested that the strains coming from retained austenite transforming compensated for some overall strains during initial plastic deformation, which could put off the work hardening of the martensitic matrix and lead to the gradual decrease of slope of ln(dσ/dε) vs. ln(σ).
3.3. The Effect of Retained Austenite on Improving Ductility
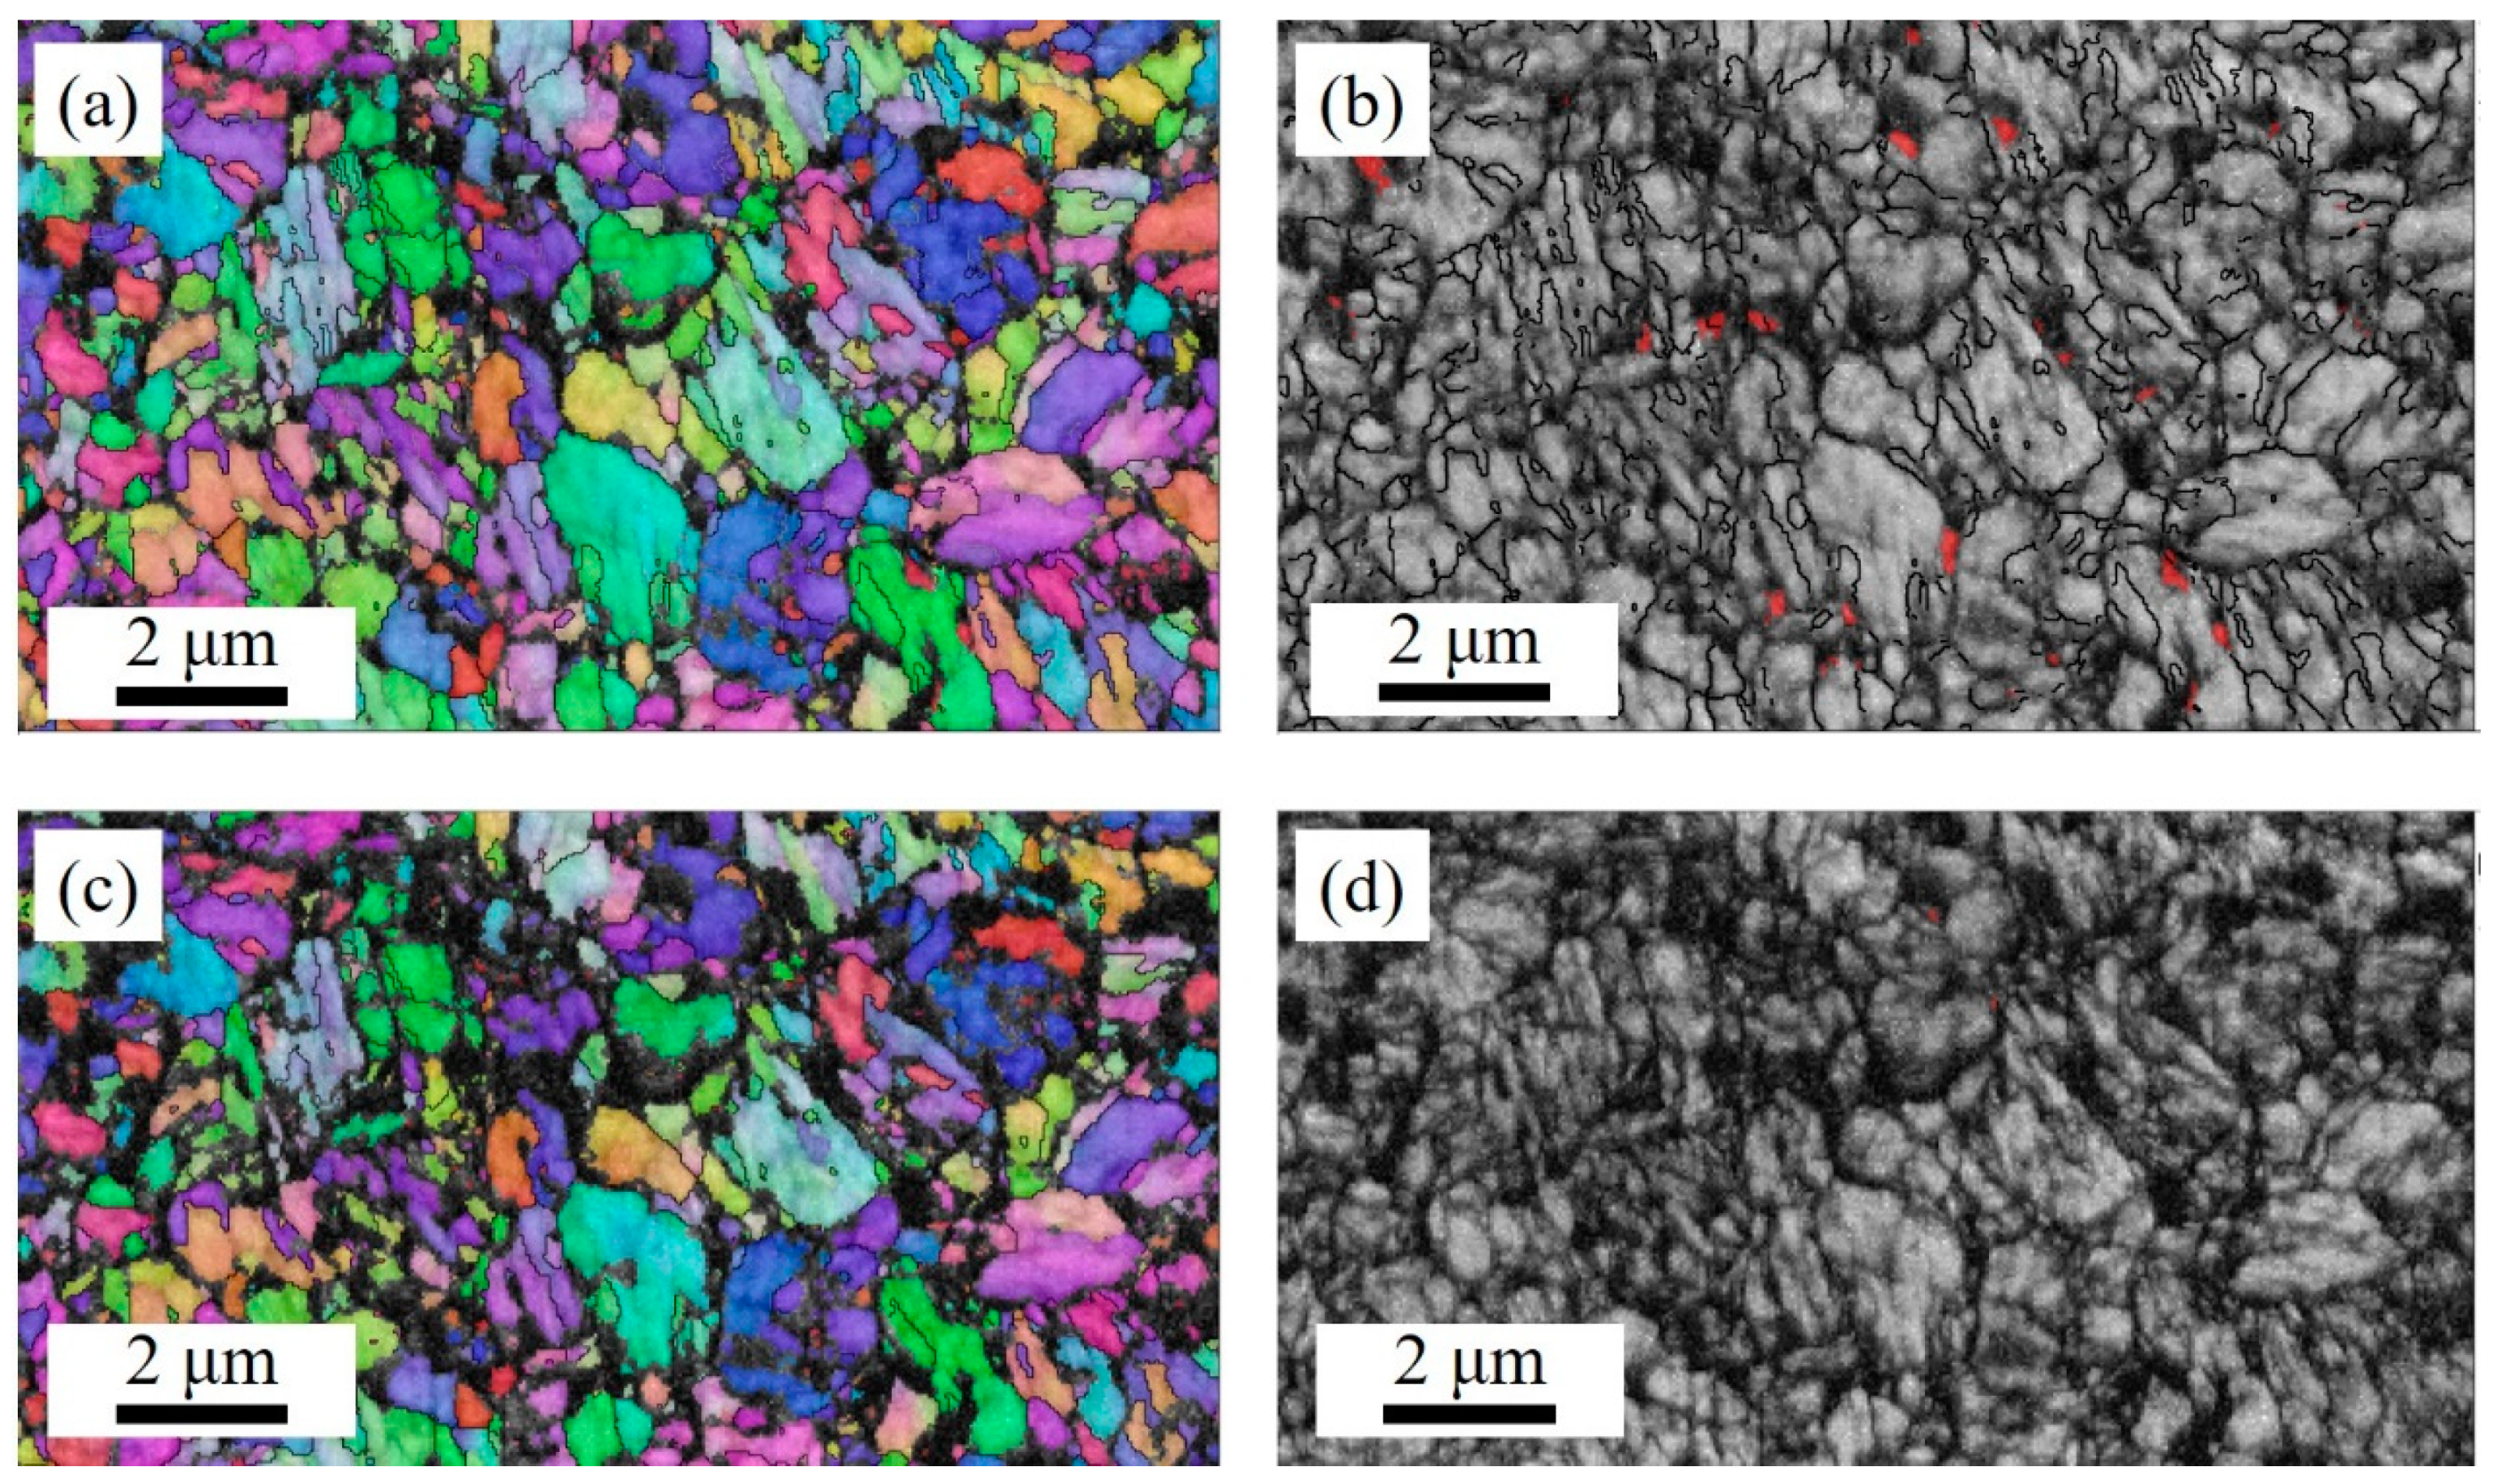
According to the multiple mechanisms of lath martensite plasticity, both grain boundary sliding and crystallographic slip occur [31], and local deformation at boundaries dominates at low strain [32]. Figure 7 shows in situ EBSD results before and after 3% engineering strain. As shown in Figure 7a and c, the crystallographic orientation of martensite blocks almost did not change after 3% strain, while the majority of the retained austenite located at the boundaries of the martensite blocks disappeared and transformed to martensite (Figure 7b,d). It indicated that the martensite blocks themselves did not deform through crystallographic slip, and the austenite transformation and boundary sliding mainly provided the initial 3% engineering strain in W-QT&P300. The effect of austenite transformation on deformation of martensite lath should be more pronounced at low strains during dynamic tensile deformation. It has been reported that abnormal lower strain hardening rate at low strains occurred in 1500 MPa grade Q&P steels [14]. During the dynamic tensile deformation of 1500 MPa grade Q&P steels, the higher rapid transformation of retained austenite provided transformation strain more efficiently at low strains and the dislocation density of martensite was lower than the martensite deformed during quasi-static tensile deformation. Therefore, it is concluded that austenite improves the deformation ability of martensitic steels through transformation strains and enhancing grain boundary sliding.
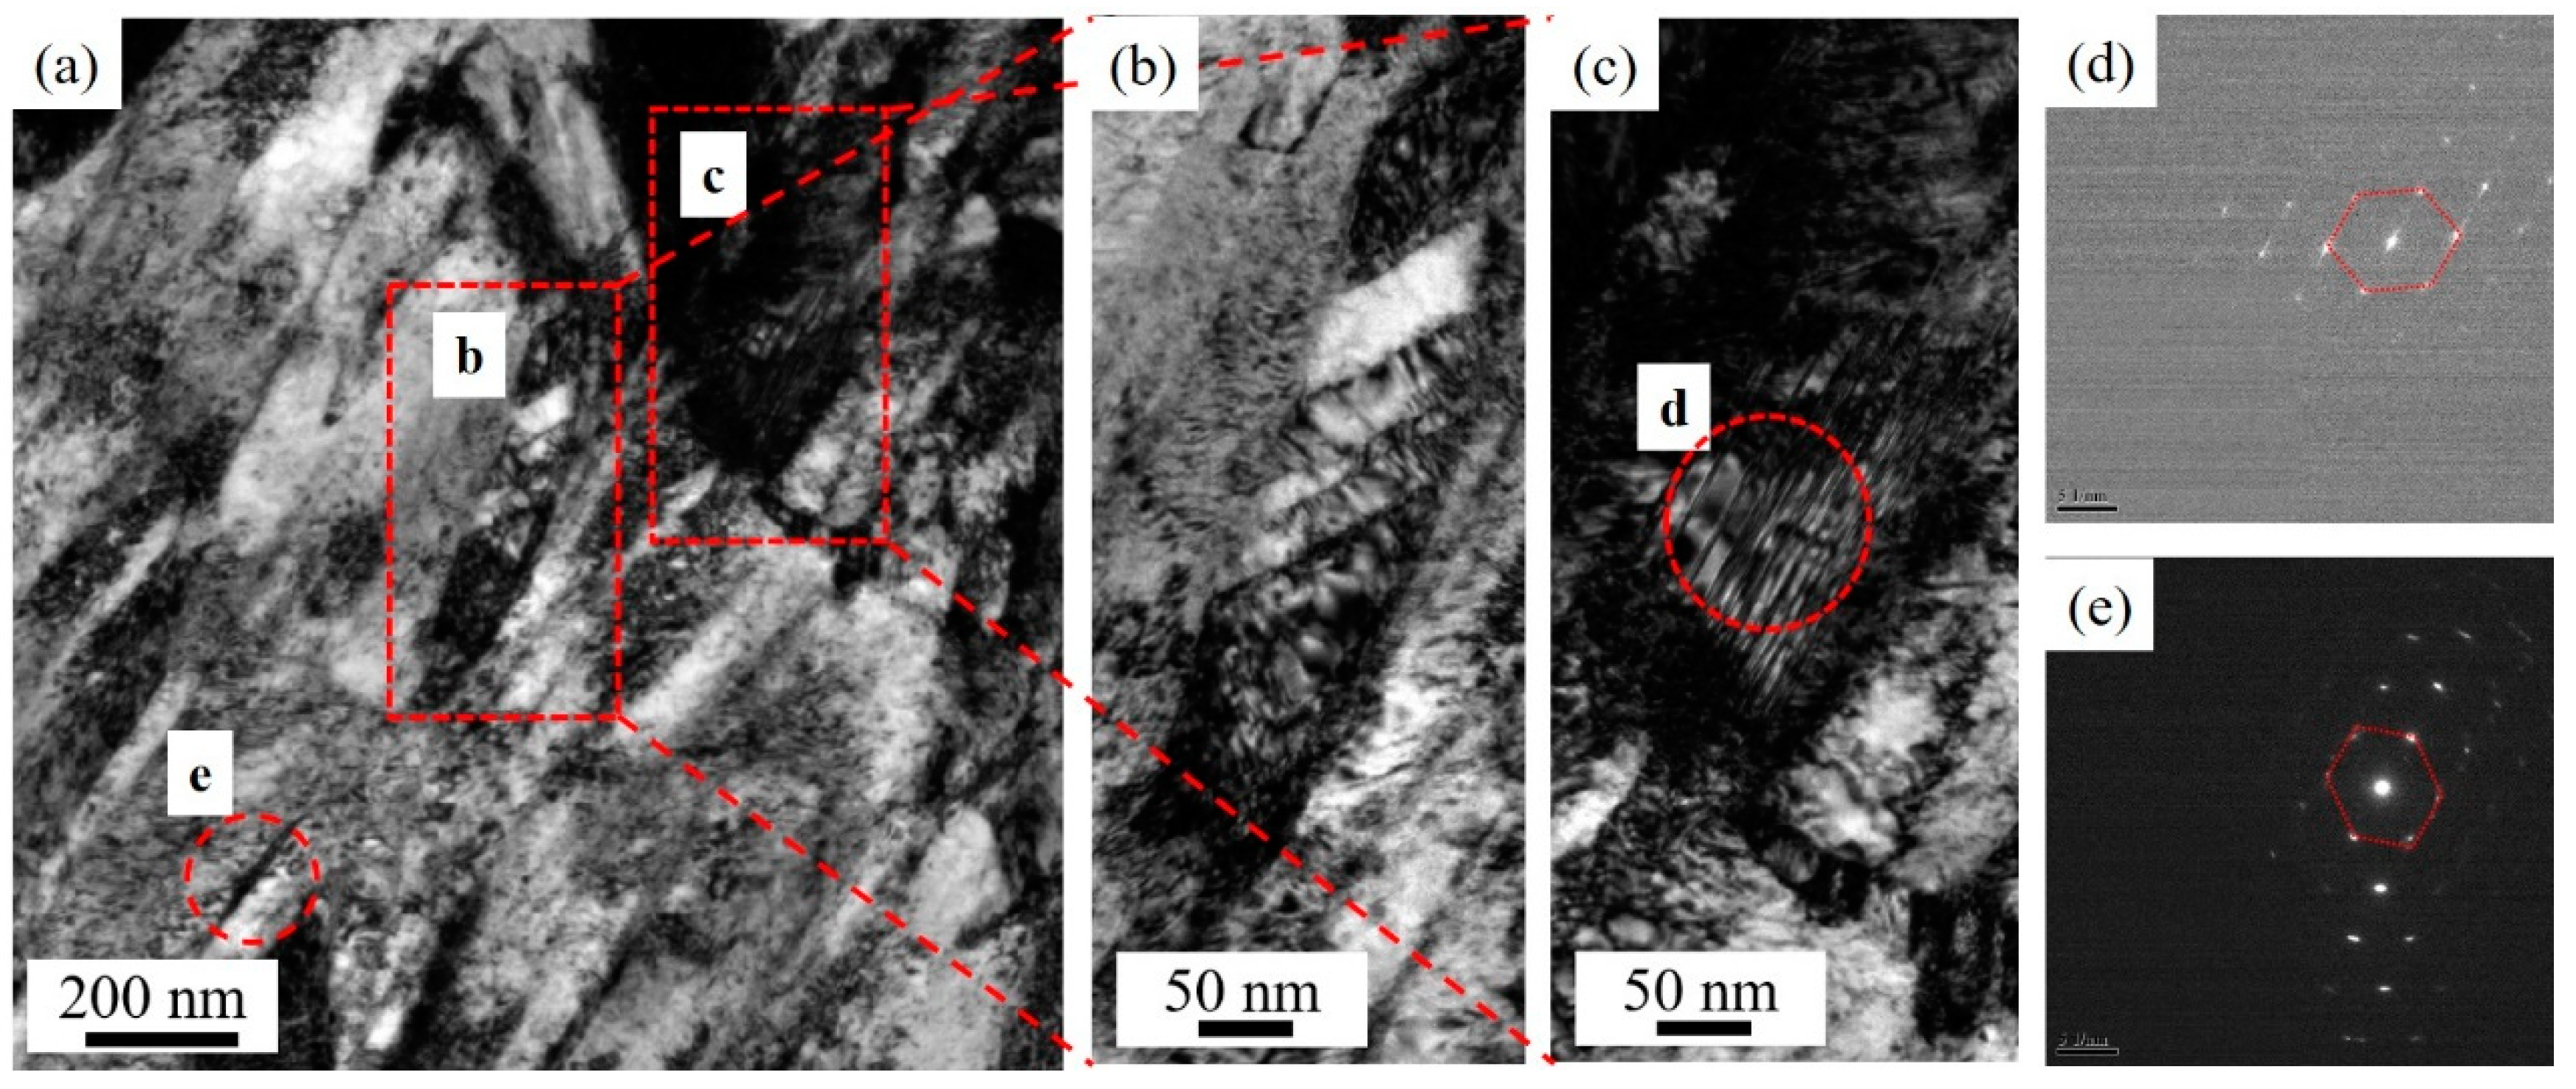
The effect of retained austenite on improving ductility was further discussed, based on TEM studies near fracture in W-QT&P300, as shown in Figure 8. SAED patterns presented in Figure 8d,e indicated that some thin-film austenite of ~10 nm and blocky austenite ~100 nm were retained after deformation. Although some austenite located at boundaries transformed to high-carbon fresh martensite during plastic deformation in W-QT&P300 (Figure 6a and Figure 7), it was suggested that high-carbon fresh martensite was not the origin of the final fracture [31]. Furthermore, the dislocations at high-angle block boundaries can be simply transferred and absorbed at grain boundaries by boundary sliding [33]. The retained “greasy” austenite near the fracture (Figure 8d,e) indicated that there was still some capacity to enhance the local deformation of martensite through grain boundary sliding. According to the crystallography slip mechanism of martensite lath, the Burgers vectors activated during uniaxial tensile deformation would change from the in-lath-plane slip system to the out-of-lath-plane slip system gradually, which always led to the multiplication of dislocation sources to obstruct dislocation motion and trigger damage nucleation [34]. As shown in Figure 8b, the transgranular bands in the deformed martensite lath clearly indicated that crystallographic slip in the martensite lath had activated the out-of-lath plane slip system and experienced multiple slip. Therefore, it was suggested that the limited deformation ability of martensite lath dominated the fracture of W-QT&P300.
4. Conclusions
A QT&P process was realized using the concept of Q&P and fγ was enhanced by the tempering process. Moreover, it was confirmed that carbon predominantly partitioned across γ/α′ interface and fγ increased via interface migration during the tempering process. The increase of fγ was closely related to the thermodynamics and K−S OR phase boundaries. The mechanical properties of W-QT&P300 had a distinct advantage over other processes, such as Q&T, PHS, Q&P, and PHS-Q&P, compared to L-QT&P300. The hard fresh martensite transformed from retained austenite in W-QT&P300 played a crucial role in enhancing the uniform elongation. Based on the discussion on work hardening behavior and microstructure evolution, it was concluded that the uniform elongation was also improved by delaying work hardening of martensite through transformation strains and increase in grain boundary gliding.
Author Contributions
P.D.: writing—original draft preparation and review; P.C.: writing—review and editing, D.K.M.: writing—review and editing and contributing to discussion; D.W.: project administration; H.Y.: Funding acquisition, supervision, project administration and writing-review and editing. All authors have read and agreed to the published version of the manuscript.
Funding
The research was financially supported by the National Natural Science Foundation of China (Grant Nos. 51722402 and U1560204), the Fundamental Research Funds for the Central Universities (Grant Nos. N2007012 and N170706003), the 111 Project (Grant No. B16009) and the Liaoning Revitalization Talents Program (No. XLYC1907128).
Acknowledgments
The authors at NEU appreciate to Z.B. Dai of Tsinghua University for meaningful discussion on interface migration in Q&P steels.
Conflicts of Interest
The authors declare no conflict of interest.
References
- Matlock, D.K.; Speer, J.G. Third Generation of AHSS: Microstructure Design Concepts, Microstructure and Texture in Steels; Springer: Berlin/Heidelberg, Germany, 2009; pp. 185–205. [Google Scholar]
- Sugimoto, K.I. Performance of Mechanical Properties of Ultrahigh-Strength Ferrous Steels Related to Strain-Induced Transformation. Metals 2020, 10, 875. [Google Scholar] [CrossRef]
- Shi, J.; Sun, X.; Wang, M.; Hui, W.; Dong, H.; Cao, W. Enhanced work-hardening behavior and mechanical properties in ultrafine-grained steels with large-fractioned metastable austenite. Sci. Mater. 2010, 63, 815–818. [Google Scholar] [CrossRef]
- Hu, B.; Luo, H.; Yang, F.; Dong, H. Recent progress in medium-Mn steels made with new designing strategies, a review. J. Mater. Sci. Technol. 2017, 33, 1457–1464. [Google Scholar] [CrossRef]
- Speer, J.; Matlock, D.K.; de Cooman, B.C.; Schroth, J.G. Carbon partitioning into austenite after martensite transformation. Acta Mater. 2003, 51, 2611–2622. [Google Scholar] [CrossRef]
- Seo, E.J.; Cho, L.; Estrin, Y.; de Cooman, B.C. Microstructure-mechanical properties relationships for quenching and partitioning (Q&P) processed steel. Acta Mater. 2016, 113, 124–139. [Google Scholar]
- Bouaziz, O.; Zurob, H.; Huang, M. Driving Force and Logic of Development of Advanced High Strength Steels for Automotive Applications. Steel Res. Int. 2013, 84, 937–947. [Google Scholar] [CrossRef]
- Zhang, K.; Liu, P.; Li, W.; Guo, Z.; Rong, Y. Ultrahigh strength-ductility steel treated by a novel quenching–partitioning–tempering process. Mater. Sci. Eng. A 2014, 619, 205–211. [Google Scholar] [CrossRef]
- Toji, Y.; Matsuda, H.; Herbig, M.; Choi, P.-P.; Raabe, D. Atomic-scale analysis of carbon partitioning between martensite and austenite by atom probe tomography and correlative transmission electron microscopy. Acta Mater. 2014, 65, 215–228. [Google Scholar] [CrossRef]
- Zhong, N.; Wang, X.; Rong, Y.; Wang, L. Interface migration between martensite and austenite during quenching and partitioning (Q&P) process. J. Mater. Sci. Technol. 2006, 22, 751–754. [Google Scholar]
- Santofimia, M.J.; Speer, J.G.; Clarke, A.J.; Zhao, L.; Sietsma, J. Influence of interface mobility on the evolution of austenite–martensite grain assemblies during annealing. Acta Mater. 2009, 57, 4548–4557. [Google Scholar] [CrossRef] [Green Version]
- Thomas, G.A.; Speer, J.G. Interface migration during partitioning of Q&P steel. Mater. Sci. Technol. 2014, 30, 998–1007. [Google Scholar]
- de Knijf, D.; Santofimia, M.J.; Shi, H.; Bliznuk, V.; Föjer, C.; Petrov, R.; Xu, W. In situ austenite–martensite interface mobility study during annealing. Acta Mater. 2015, 90, 161–168. [Google Scholar] [CrossRef]
- Wang, M.; Huang, M.X. Abnormal TRIP effect on the work hardening behavior of a quenching and partitioning steel at high strain rate. Acta Mater. 2020, 188, 551–559. [Google Scholar] [CrossRef]
- Liu, H.; Lu, X.; Jin, X.; Dong, H.; Shi, J. Enhanced mechanical properties of a hot stamped advanced high-strength steel treated by quenching and partitioning process. Sci. Mater. 2011, 64, 749–752. [Google Scholar] [CrossRef]
- Seo, E.J.; Cho, L.; de Cooman, B.C. Application of Quenching and Partitioning (Q&P) Processing to Press Hardening Steel. Metall. Mater. Trans. A 2014, 45, 4022–4037. [Google Scholar]
- Dai, Z.; Ding, R.; Yang, Z.; Zhang, C.; Chen, H. Elucidating the effect of Mn partitioning on interface migration and carbon partitioning during Quenching and Partitioning of the Fe-C-Mn-Si steels: Modeling and experiments. Acta Mater. 2018, 144, 666–678. [Google Scholar] [CrossRef]
- Arribas, M.; Gutiérrez, T.; Del Molino, E.; Arlazarov, A.; Diego-Calderón, D.; Martin, D.; De Caro, D.; Ayenampudi, S.; Santofimia, M.J. Austenite Reverse Transformation in a Q&P Route of Mn and Ni Added Steels. Metals 2020, 10, 862. [Google Scholar]
- Wang, M.M.; Hell, J.C.; Tasan, C.C. Martensite size effects on damage in quenching and partitioning steels. Sci. Mater. 2017, 138, 1–5. [Google Scholar] [CrossRef]
- Bhadeshia, H.; Honeycombe, R. Steels: Microstructure and Properties, 4th ed.; Butterworth-Heinemann: London, UK, 2017; pp. 148–151. [Google Scholar]
- Vandijk, N.; Butt, A.; Zhao, L.; Sietsma, J.; Offerman, S.; Wright, J.; Vanderzwaag, S. Thermal stability of retained austenite in TRIP steels studied by synchrotron X-ray diffraction during cooling. Acta Mater. 2005, 53, 5439–5447. [Google Scholar] [CrossRef]
- Bachmann, F.; Hielscher, R.; Schaeben, H. Texture Analysis with MTEX—Free and Open Source Software Toolbox. Solid State Phenom. 2010, 160, 62–68. [Google Scholar] [CrossRef] [Green Version]
- Dai, Z.; Wang, X.; He, J.; Yang, Z.; Zhang, C.; Chen, H. Effect of Interfacial Mn Partitioning on Carbon Partitioning and Interface Migration During the Quenching and Partitioning Process. Metall. Mater. Trans. A 2017, 48, 3168–3174. [Google Scholar] [CrossRef]
- Krauss, G. Tempering of Lath Martensite in Low and Medium Carbon Steels: Assessment and Challenges. Steel Res. Int. 2017, 88, 1700038. [Google Scholar] [CrossRef]
- Taylor, T.; Clough, A. Critical review of automotive hot-stamped sheet steel from an industrial perspective. Mater. Sci. Technol. 2018, 34, 809–861. [Google Scholar] [CrossRef]
- Liang, J.; Zhao, Z.; Sun, B.; Lu, H.; Liang, J.; He, Q.; Chen, W.; Tang, D. A novel ultra-strong hot stamping steel treated by quenching and partitioning process. Mater. Sci. Technol. 2018, 34, 2241–2249. [Google Scholar] [CrossRef]
- Seo, E.J.; Cho, L.; de Cooman, B.C. Application of Quenching and Partitioning Processing to Medium Mn Steel. Metall. Mater. Trans. A 2014, 46, 27–31. [Google Scholar] [CrossRef] [Green Version]
- Cai, M.; Huang, H.; Zuo, X.; Ding, H.; Stanford, N. Enhanced strength-ductility of medium Mn steel by quenching, partitioning and tempering. Mater. Sci. Technol. 2020, 36, 584–597. [Google Scholar] [CrossRef]
- Ramos, L.F.; Matlock, D.K.; Krauss, G. On the deformation behavior of dual-phase steels. Metall. Mater. Trans. A 1979, 10, 259–261. [Google Scholar] [CrossRef]
- Bhadeshia, H.K. TRIP-assisted steels? ISIJ Int. 2002, 42, 1059–1060. [Google Scholar] [CrossRef] [Green Version]
- Morsdorf, L.; Jeannin, O.; Barbier, D.; Mitsuhara, M.; Raabe, D.; Tasan, C.C. Multiple mechanisms of lath martensite plasticity. Acta Mater. 2016, 121, 202–214. [Google Scholar] [CrossRef]
- Du, C.; Hoefnagels, J.P.M.; Vaes, R.; Geers, M.G.D. Plasticity of lath martensite by sliding of substructure boundaries. Sci. Mater. 2016, 120, 37–40. [Google Scholar] [CrossRef]
- Ohmura, T.; Minor, A.M.; Stach, E.A.; Morris, J.W. Dislocation–grain boundary interactions in martensitic steel observed through in situ nanoindentation in a transmission electron microscope. J. Mater. Res. 2004, 19, 3626–3632. [Google Scholar] [CrossRef]
- Nambu, S.; Michiuchi, M.; Ishimoto, Y.; Asakura, K.; Inoue, J.; Koseki, T. Transition in deformation behavior of martensitic steel during large deformation under uniaxial tensile loading. Sci. Mater. 2009, 60, 221–224. [Google Scholar] [CrossRef]
Figure 1.
(a) Dilatometric curve of the experimental steel after thermal cycle. Ac1, Ac3, MS1 and MS2 are austenite-start temperature, austenite-finish temperature, martensite-start temperature, and massive martensite-start temperature, respectively, and (b) the schematic diagram of the heat treatments.

Figure 2.
The transmission electron microscopy microstructures of W-QT&P steel after the initial quenching process: (a,d) show lath martensite with high density dislocation and prior austenite with different grain size. TEM micrographs of bright-field image (b,d,e) and the dark-field image (c,f) of retained austenite. In (e) is the enlarged image of the rectangle in (d).

Figure 3.
(a) The volume fraction of retained austenite (fγ) and carbon content in γ at different stages of W-QT&P300 and L-QT&P300 processes. (b) The evolution of the austenite fraction during tempering at 300 °C with different initial austenite fractions predicted by QP-PE models.
Figure 3.
(a) The volume fraction of retained austenite (fγ) and carbon content in γ at different stages of W-QT&P300 and L-QT&P300 processes. (b) The evolution of the austenite fraction during tempering at 300 °C with different initial austenite fractions predicted by QP-PE models.

Figure 4.
Phase maps of W-Q (a) and W-QT&P300 (b). The grain boundary maps of W-Q (c) and W-QT&P300 (d). The phase boundaries of austenite and martensite that exhibit special orientation relationships are highlighted in red, Kurdjumov–Sachs orientation relationships (K−S OR) or yellow, Nishiyama−Wassermann (N−W OR).

Figure 5.
(a) Engineering stress-strain curves of W-QT&P300 and L-QT&P300 steels. (b) Comparison of W-QT&P steels with other novel advanced high strength steels, such as traditional Q&T steels, PHS, Q&P steels, and PHS-Q&P steels.
Figure 5.
(a) Engineering stress-strain curves of W-QT&P300 and L-QT&P300 steels. (b) Comparison of W-QT&P steels with other novel advanced high strength steels, such as traditional Q&T steels, PHS, Q&P steels, and PHS-Q&P steels.

Figure 6.
(a) The volume fraction of retained austenite and (b) average carbon content in γ after different engineering strains in W-QT&P300 and L-QT&P300 steels. (c) Variation of work hardening rate (dσ/dε) with true strain. (d) ln(dσ/dε) vs. lnσ curves of W-QT&P300 and L-QT&P300 with different slopes analyzed by a modified Crussard−Jaoul (C−J) analysis.

Figure 7.
Images (a,c) are EBSD IPF-Z map of martensite and retained austenite with angle boundaries (with misorientations > 10°) of W-QT&P300 before and after deformation, respectively. Images (b,d) are the overlay map of band contrast with retained austenite in red color before and after deformation, respectively.

Figure 8.
(a) TEM images of the microstructure near the fracture in W-QT&P300. (b) A typical deformed microstructure of martensite lath with transgranular bands. In (b,c) are enlarged images of the rectangles in (a). The SAED pattern (d,e) show the existence of both small blocky austenite and film austenite, respectively.

© 2020 by the authors. Licensee MDPI, Basel, Switzerland. This article is an open access article distributed under the terms and conditions of the Creative Commons Attribution (CC BY) license (http://creativecommons.org/licenses/by/4.0/).
Share and Cite
MDPI and ACS Style
Du, P.; Chen, P.; Misra, D.K.; Wu, D.; Yi, H. Transformation-Induced Ductility of Reverse Austenite Evolved by Low-Temperature Tempering of Martensite. Metals 2020, 10, 1343. https://doi.org/10.3390/met10101343
AMA Style
Du P, Chen P, Misra DK, Wu D, Yi H. Transformation-Induced Ductility of Reverse Austenite Evolved by Low-Temperature Tempering of Martensite. Metals. 2020; 10(10):1343. https://doi.org/10.3390/met10101343
Chicago/Turabian StyleDu, Pengju, Peng Chen, Devesh K. Misra, Di Wu, and Hongliang Yi. 2020. "Transformation-Induced Ductility of Reverse Austenite Evolved by Low-Temperature Tempering of Martensite" Metals 10, no. 10: 1343. https://doi.org/10.3390/met10101343
Note that from the first issue of 2016, this journal uses article numbers instead of page numbers. See further details here.