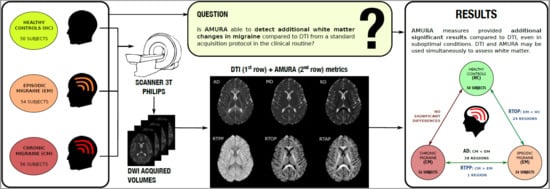
Alternative Microstructural Measures to Complement Diffusion Tensor Imaging in Migraine Studies with Standard MRI Acquisition

 , ,
, ,
Abstract
:
1. Introduction
2. Materials and Methods
2.1. Participants
2.2. MRI Acquisition
2.3. MRI Processing
2.3.1. Diffusion MRI Preprocessing
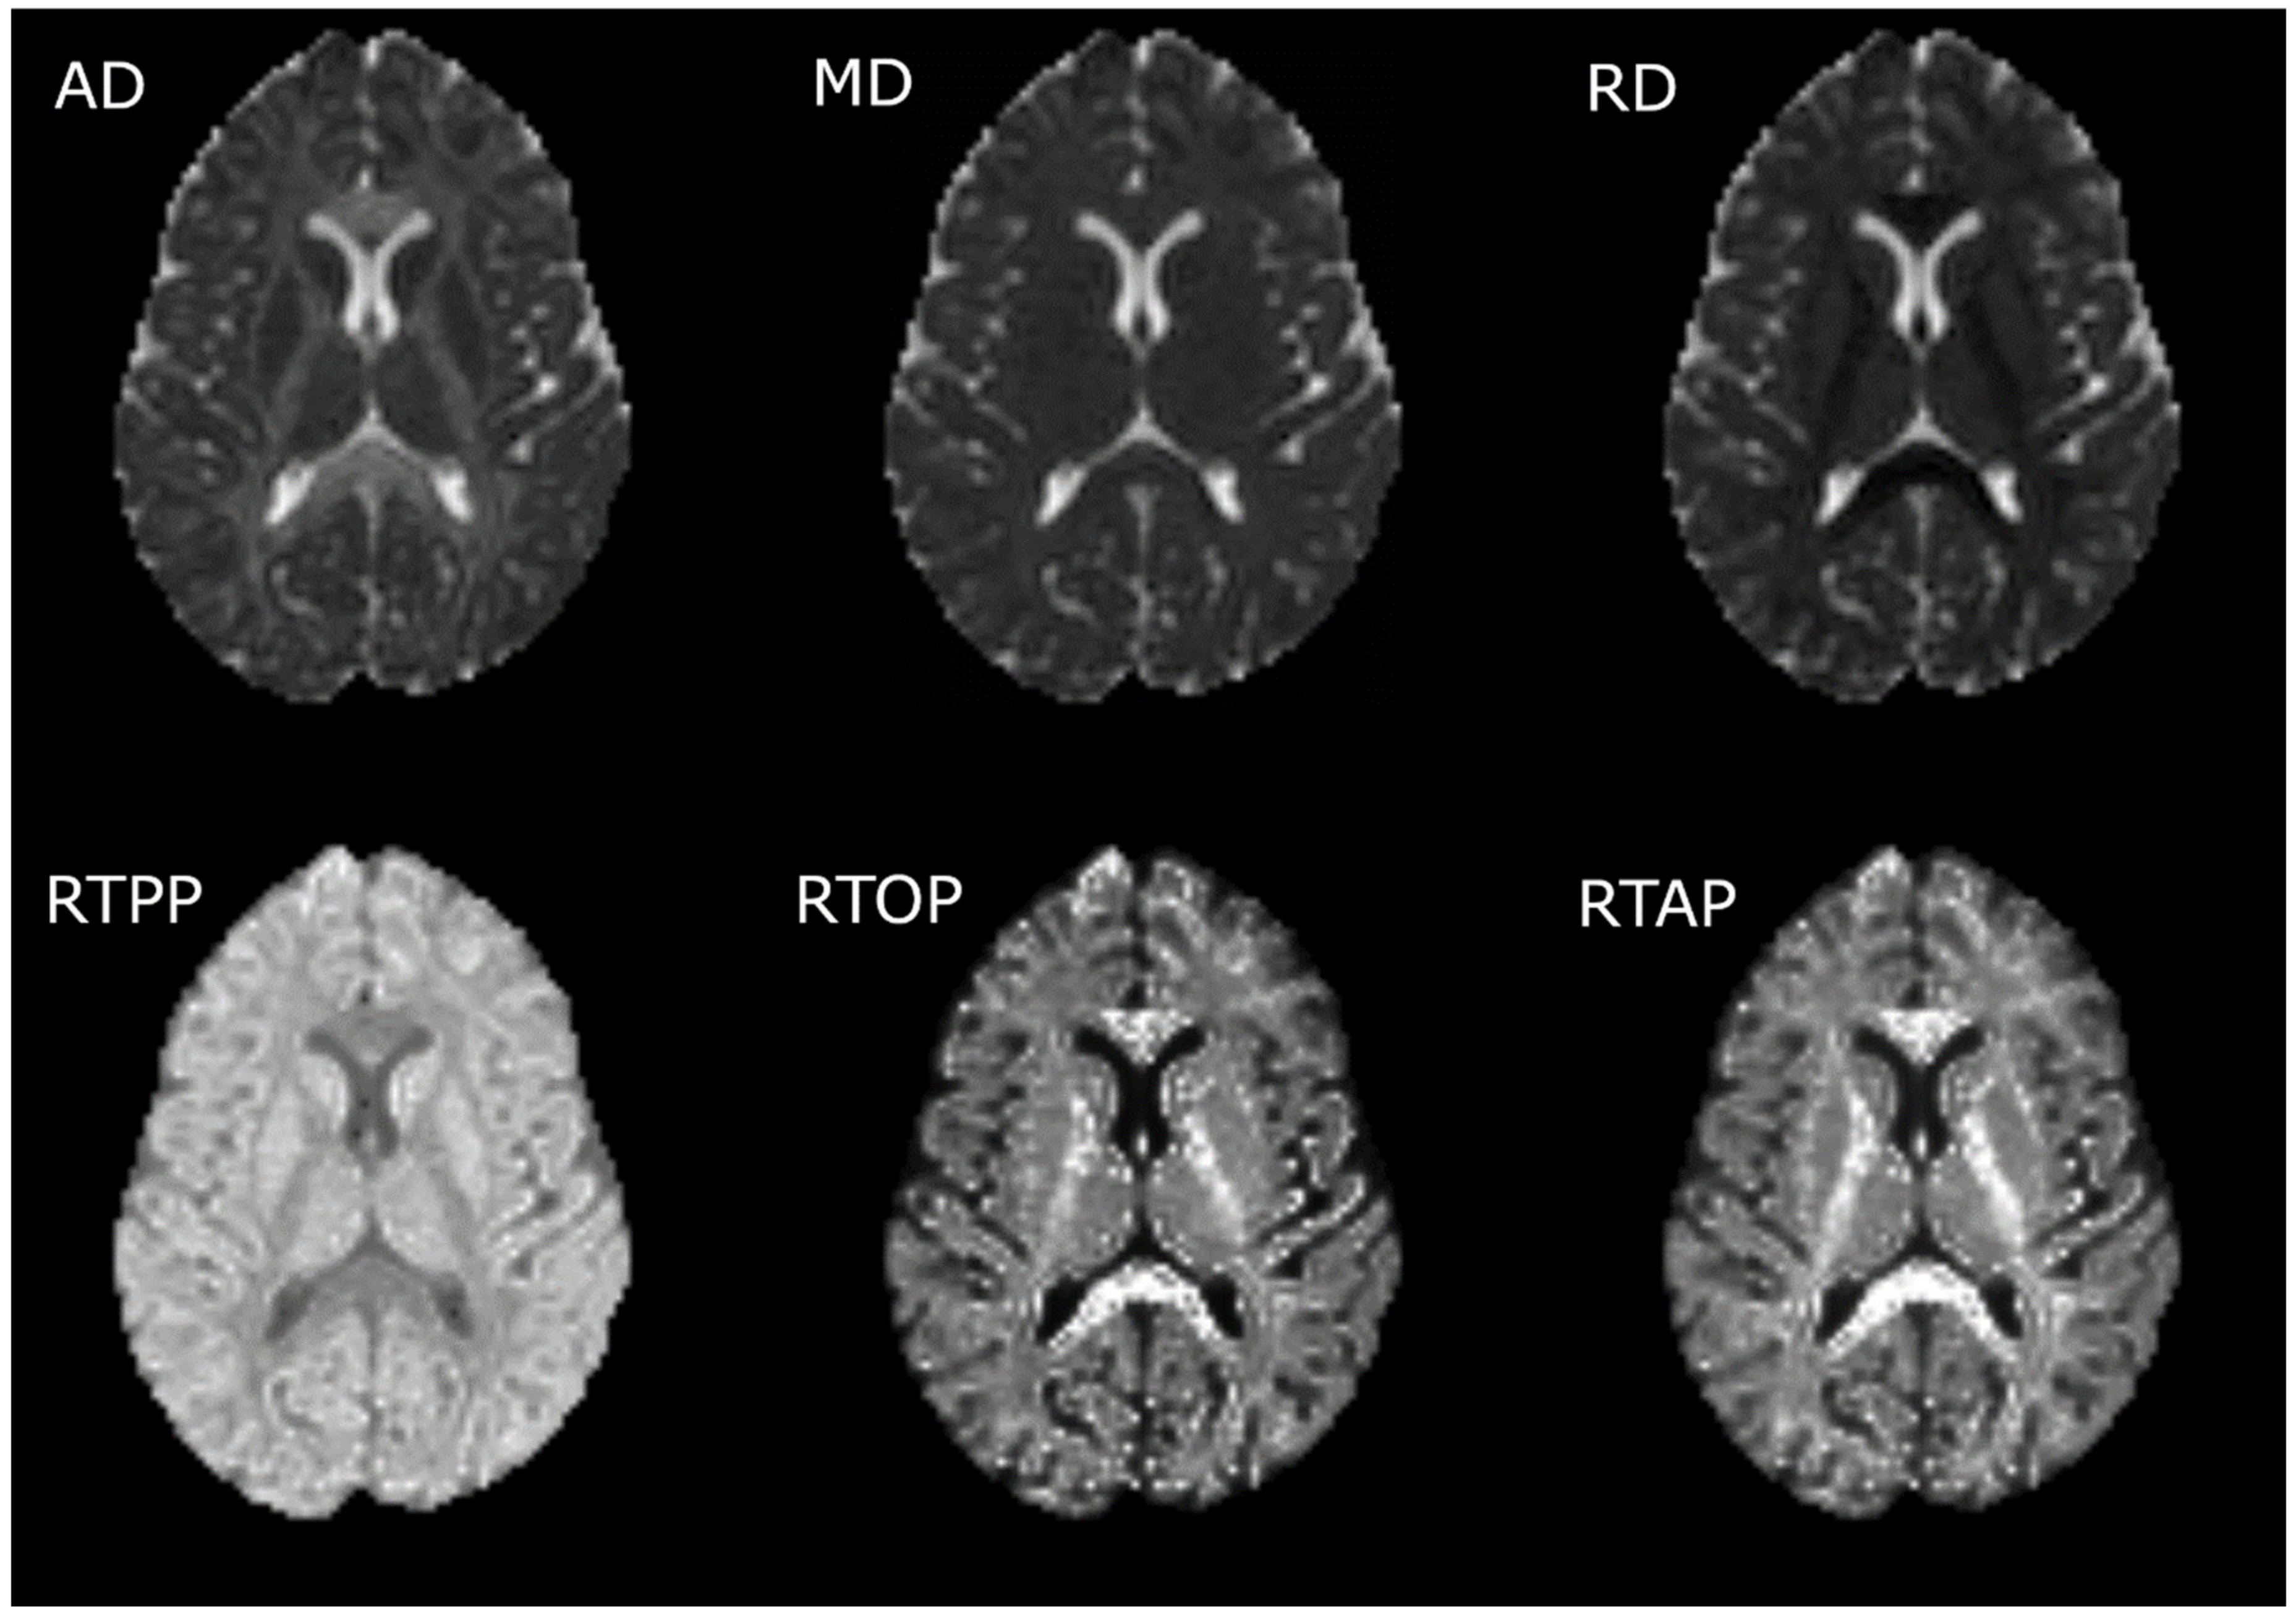
2.3.2. Calculation of the Diffusion Measures
2.3.3. Tract-Based Spatial Statistics (TBSS)
2.4. Statistical Analysis
3. Results
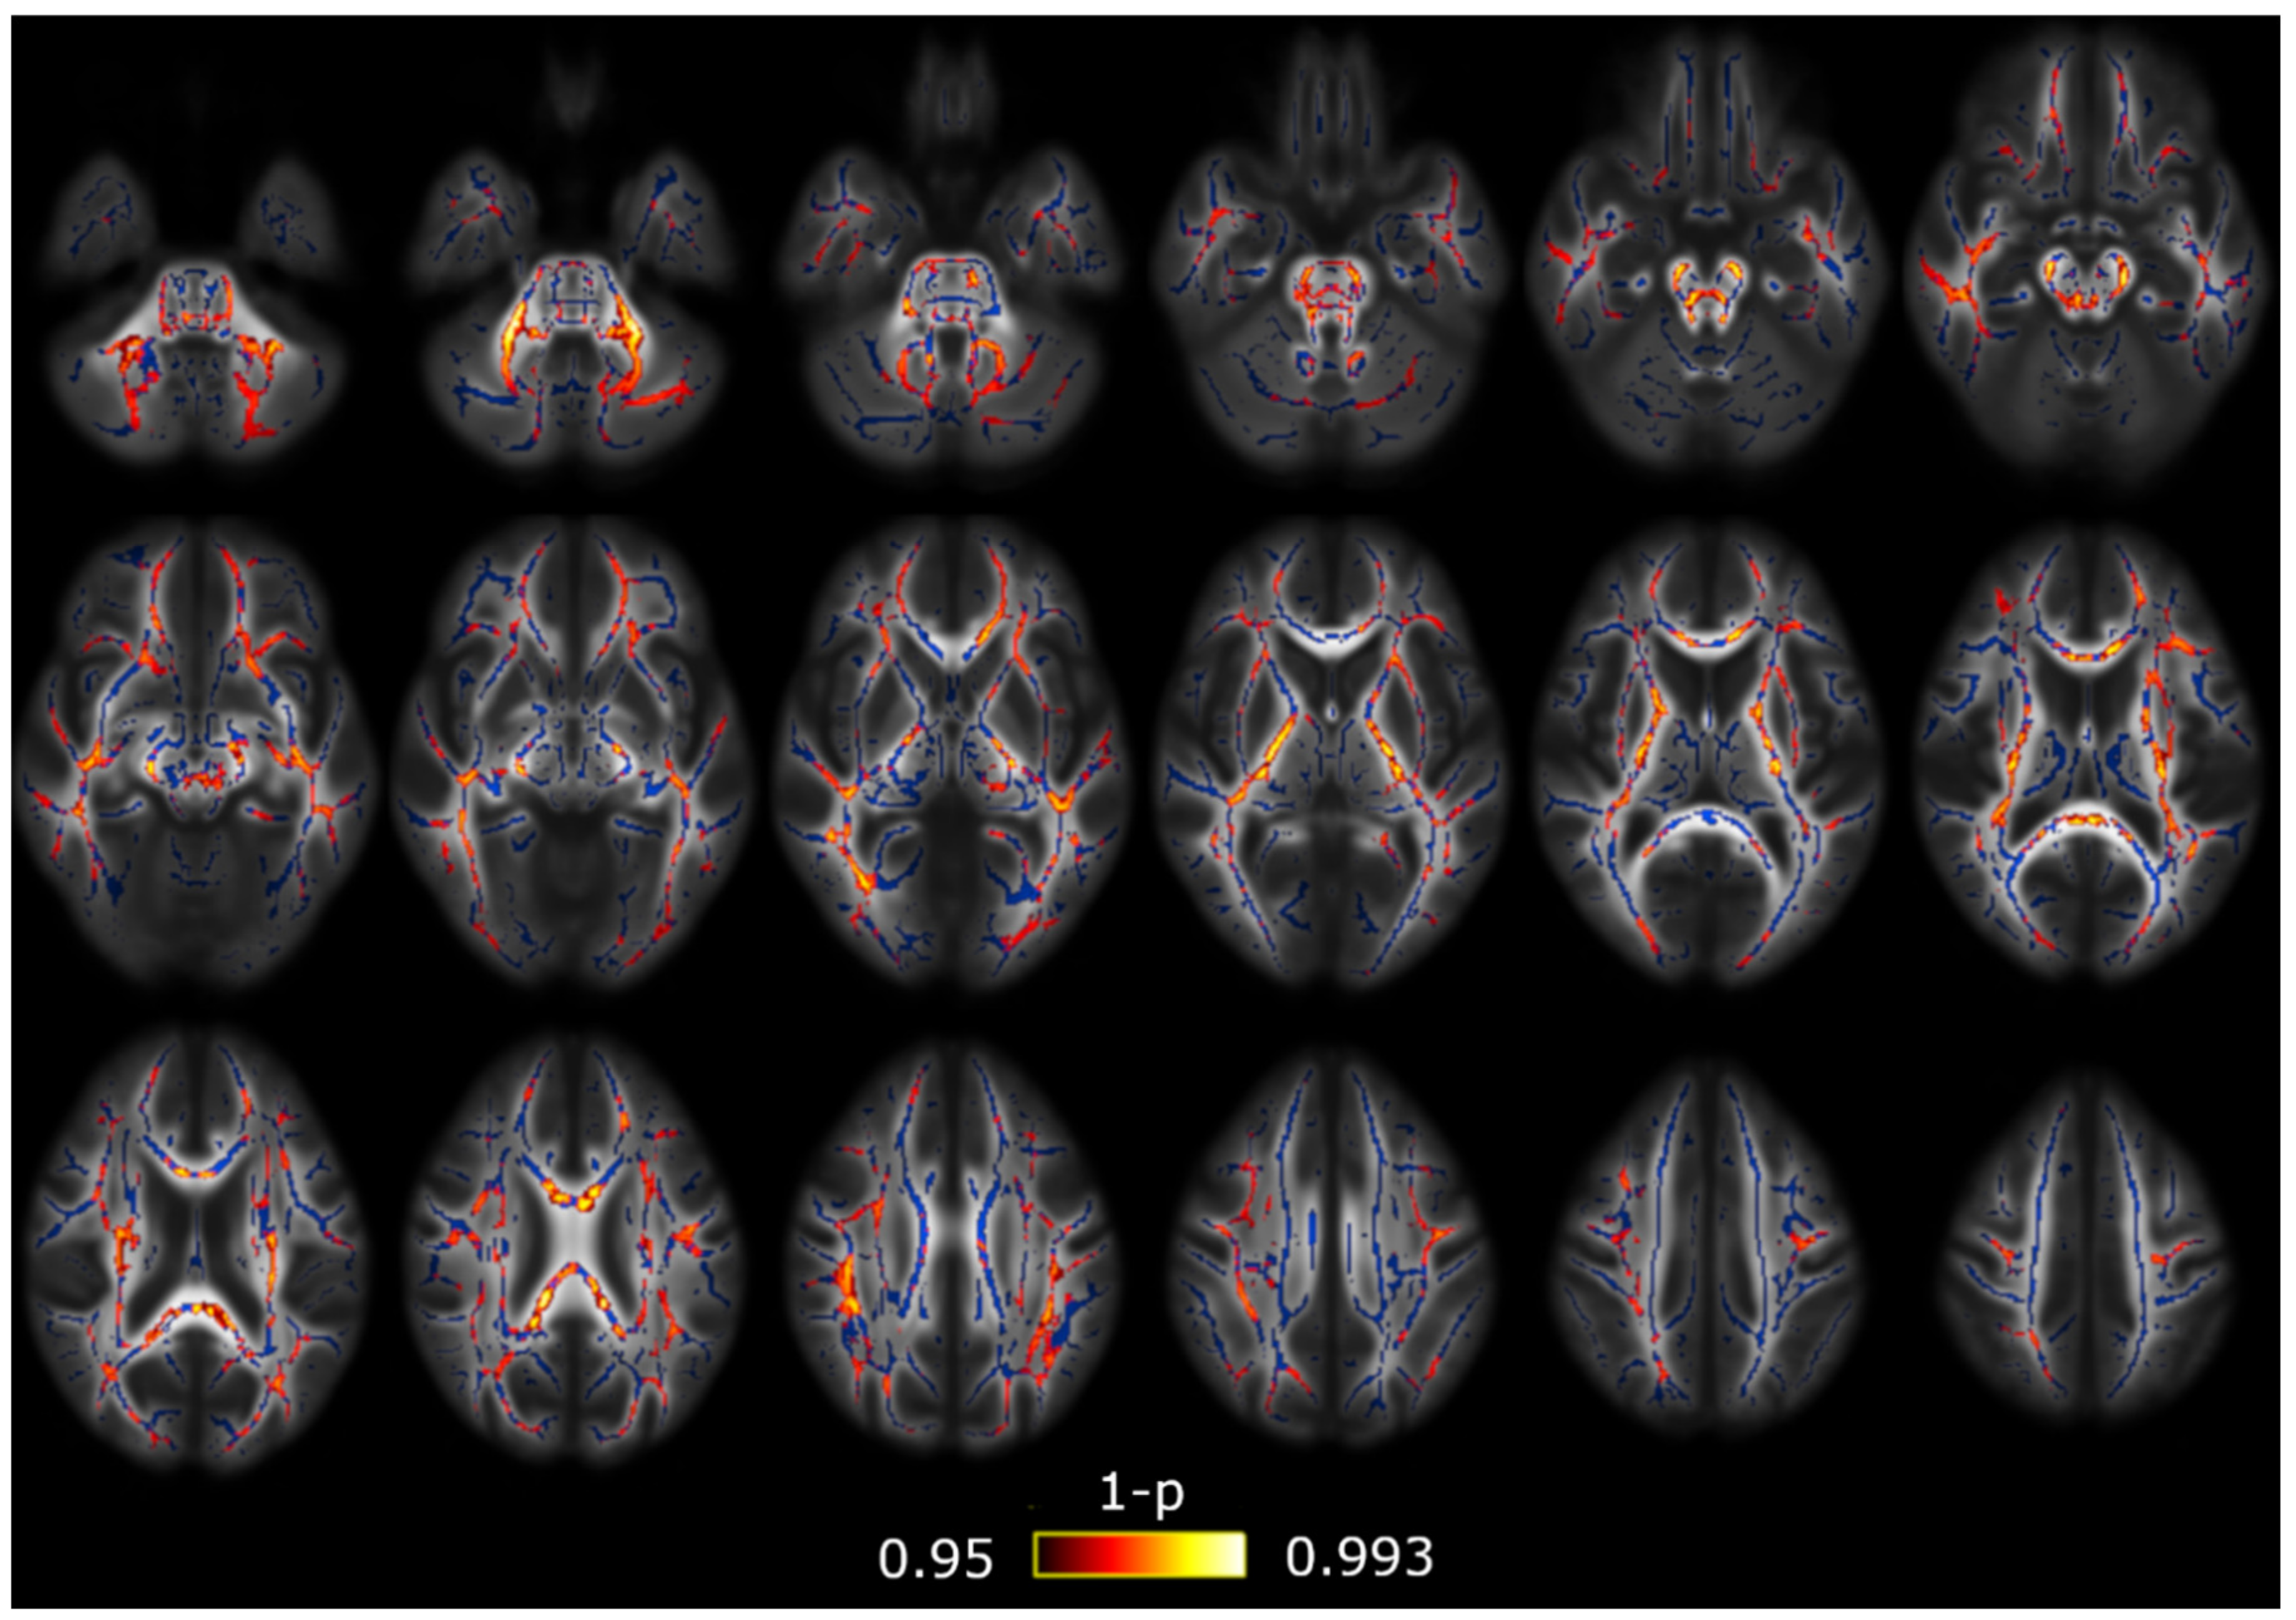
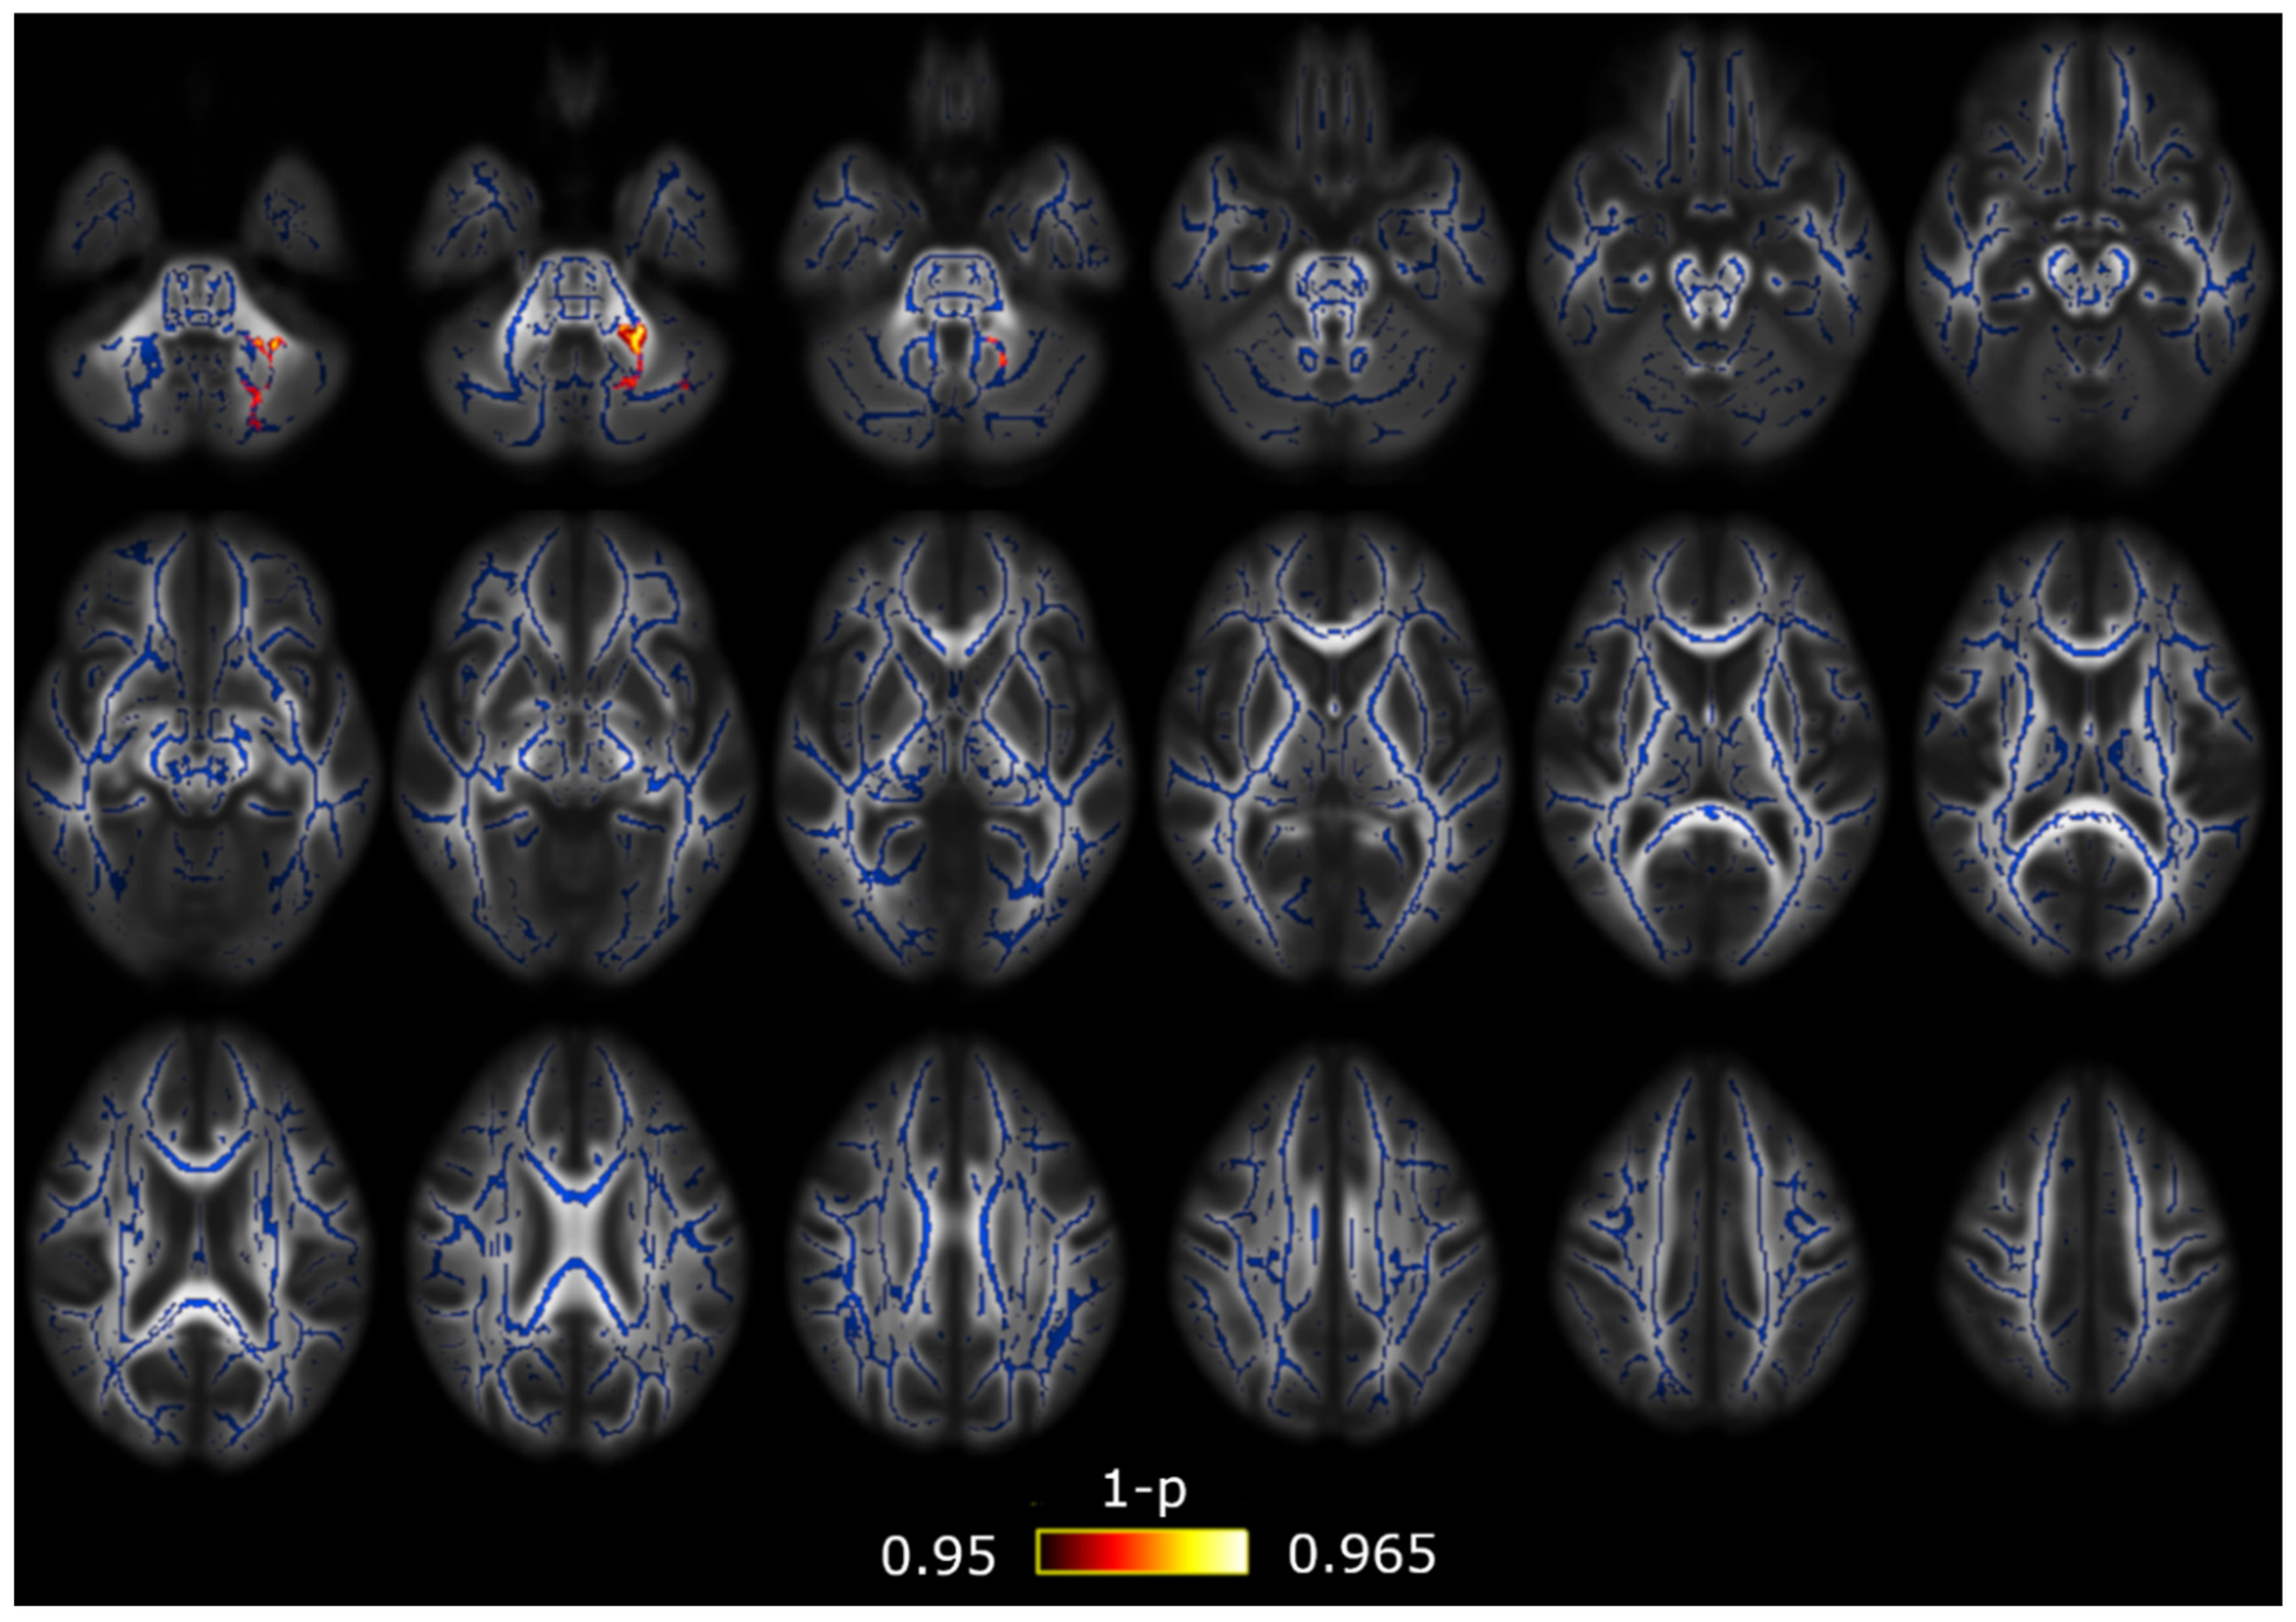
3.1. TBSS
3.2. TBSS with Covariates
3.3. Correlation Analysis
4. Discussion
5. Conclusions
Author Contributions
Funding
Acknowledgments
Conflicts of Interest
Appendix A
Appendix B

| White Matter Region | Minimum p-Value (FWE-Corrected) | Volume (mm3) | MNI Peak Coordinate (mm), (x,y,z) |
|---|---|---|---|
| Middle cerebellar peduncle | 0.023 | 1295 | (−20,−50,−32) |
| Superior cerebellar peduncle R/L | 0.028/0.030 | 101/115 | (5,−28,−19)/(−4,−28,−19) |
| Inferior cerebellar peduncle L | 0.035 | 46 | (−10,−50,−25) |
| Superior longitudinal fasciculus R | 0.033 | 720 | (32,−4,20) |
| Splenium of corpus callosum | 0.042 | 32 | (18,−49,27) |
| Superior corona radiata R/L | 0.030/0.032 | 335/136 | (28,−15,19)/(−27,−11,20) |
| Posterior corona radiata R | 0.035 | 83 | (28,−34,19) |
| External capsule R/L | 0.033/0.031 | 127/171 | (30,−10,14)/(−28,−10,18) |
| Posterior limb of internal capsule R/L | 0.029/0.032 | 301/281 | (26,−17,13)/(−27,−17,17) |
| Retrolenticular part of internal capsule R/L | 0.031/0.032 | 473/59 | (30,−29,7)/(−25,−23,12) |
| Sagittal stratum R | 0.034 | 150 | (38,−28,−4) |
| Posterior thalamic radiation R | 0.034 | 51 | (30,−39,16) |
| Cerebral peduncle R/L | 0.028/0.031 | 207/258 | (10,−28,−16)/(−9,−20,−20) |
| Corticospinal tract R/L | 0.030/0.031 | 105/125 | (11,−22,−22)/(−7,−18,−22) |
| Pontine crossing tract | 0.030 | 56 | (4,−26,−24) |
| Fornix (cres) R | 0.037 | 46 | (35,−12,−14) |
| White Matter Region | Minimum p-Value (FWE-Corrected) | Volume (mm3) | MNI Peak Coordinate (mm), (x,y,z) |
|---|---|---|---|
| Superior corona radiata L | 0.026 | 116 | (−26,−11,20) |
| External capsule L | 0.022 | 303 | (−34,−15,−8) |
| Posterior limb of internal capsule L | 0.024 | 472 | (−15,10,0) |
| Retrolenticular part of internal capsule L | 0.025 | 347 | (−33,−34,6) |
| Sagittal stratum L | 0.023 | 133 | (−36,−17,−9) |
| Posterior thalamic radiation L | 0.025 | 38 | (−35,−39,7) |
| Cerebral peduncle L | 0.024 | 105 | (−15,−13,−5) |
| White Matter Region | Minimum p-Value (FWE-Corrected) | Volume (mm3) | MNI Peak Coordinate (mm), (x,y,z) |
|---|---|---|---|
| Superior longitudinal fasciculus R | 0.033 | 271 | (32,−4,19) |
| Body of corpus callosum | 0.042 | 47 | (19,−30,31) |
| Splenium of corpus callosum | 0.042 | 209 | (19,−31,31) |
| Anterior corona radiata R | 0.033 | 295 | (25,17,12) |
| Superior corona radiata R | 0.038 | 236 | (32,−6,20) |
| Posterior corona radiata R | 0.039 | 133 | (25,−23,22) |
| External capsule R | 0.031 | 661 | (30,1,13) |
| Posterior limb of internal capsule R | 0.039 | 217 | (24,−19,1) |
| Retrolenticular part of internal capsule R | 0.036 | 425 | (38,−29,0) |
| Anterior limb of internal capsule R | 0.035 | 83 | (23,17,11) |
| Sagittal stratum R | 0.036 | 132 | (33,−23,−4) |
| Fornix (cres) R | 0.035 | 36 | (33,−22,−6) |
| White Matter Region | Minimum p-Value (FWE-Corrected) | Volume (mm3) | MNI Peak Coordinate (mm), (x,y,z) |
|---|---|---|---|
| Superior corona radiata R/L | 0.046/0.040 | 50/87 | (20,−28,40)/(−26,−11,19) |
| External capsule L | 0.033 | 278 | (−33,−11,1) |
| Anterior limb of internal capsule L | 0.044 | 31 | (−18,2,12) |
| Posterior limb of internal capsule L | 0.034 | 377 | (−23,−22,3) |
| Retrolenticular part of internal capsule L | 0.034 | 315 | (−30,−23,2) |
| Sagittal stratum L | 0.034 | 114 | (−36,−17,−9) |
| Cerebral peduncle L | 0.036 | 37 | (−14,−12,−5) |

| White Matter Region | Minimum p-Value (FWE-Corrected) | Volume (mm3) | MNI Peak Coordinate (mm), (x,y,z) |
|---|---|---|---|
| Superior longitudinal fasciculus R | 0.046 | 179 | (39,−9,26) |
| External capsule R | 0.044 | 244 | (33,−14,−3) |
| Retrolenticular part of internal capsule R | 0.045 | 157 | (34,−21,−2) |
| Sagittal stratum R | 0.045 | 194 | (39,−18,−12) |

| White Matter Region | Minimum p-Value (FWE-Corrected) | Volume (mm3) | MNI Peak Coordinate (mm), (x,y,z) |
|---|---|---|---|
| Middle cerebellar peduncle | 0.047 | 31 | (−21,−65,−40) |
| White Matter Region | Minimum p-Value (FWE-Corrected) | Volume (mm3) | MNI Peak Coordinate (mm), (x,y,z) |
|---|---|---|---|
| Middle cerebellar peduncle | 0.026 | 439 | (−23,−55,−42) |
| Superior longitudinal fasciculus R/L | 0.045/0.039 | 52/464 | (33,1,27)/(−36,−4,−18) |
| Anterior corona radiata L | 0.042 | 66 | (−23,16,27) |
| Superior corona radiata L | 0.041 | 160 | (−26,4,26) |
| Posterior corona radiata L | 0.039 | 42 | (−29,−60,21) |
| External capsule R | 0.018 | 36 | (36,−16,−9) |
| Retrolenticular part of internal capsule R/L | 0.019/0.043 | 239/40 | (39,−38,−3)/(−39,−33,−1) |
| Sagittal stratum R/L | 0.012/0.036 | 387/194 | (44,−29,−14)/(−40,−33,−6) |
| Posterior thalamic radiation R/L | 0.015/0.039 | 188/176 | (39,−41,−2)/(−30,−65,17) |
| Fornix (cres) R | 0.017 | 75 | (35,−16,−12) |
| Cingulum (hippocampus) R | 0.017 | 68 | (29,−18,27) |

| White Matter Region | Minimum p-Value (FWE-Corrected) | Volume (mm3) | MNI Peak Coordinate (mm), (x,y,z) |
|---|---|---|---|
| Superior longitudinal fasciculus R/L | 0.012/0.012 | 950/1030 | (38,−35,31)/(−35,−35,27) |
| Genu of corpus callosum | 0.012 | 653 | (18,20,25) |
| Body of corpus callosum | 0.012 | 1440 | (16,16,29) |
| Splenium of corpus callosum | 0.009 | 1170 | (26,−58,12) |
| Anterior corona radiata R/L | 0.011/0.012 | 1147/980 | (26,16,25)/(−25,18,21) |
| Superior corona radiata R/L | 0.011/0.012 | 904/820 | (25,12,28)/(−25,6,28) |
| Posterior corona radiata R/L | 0.009/0.012 | 265/246 | (28,−63,19)/(−30,−60,21) |
| External capsule R/L | 0.012/0.012 | 549/576 | (30,11,−1)/(−25,10,14) |
| Posterior limb of internal capsule R/L | 0.012/0.016 | 390/261 | (23,−6,17)/(−22,−10,16) |
| Retrolenticular part of internal capsule R/L | 0.012/0.016 | 390/271 | (30,−38,17)/(−38,−33,0) |
| Anterior limb of internal capsule R/L | 0.012/0.012 | 229/416 | (22,8,13)/(−20,9,13) |
| Sagittal stratum R/L | 0.014/0.016 | 444/309 | (44,−30,−15)/(−40,−28,−7) |
| Posterior thalamic radiation R/L | 0.008/0.012 | 601/470 | (29,−61,13)/(−30,−66,−16) |
| Fornix (cres) R/L | 0.015/0.018 | 171/177 | (33,−7,−19)/(−35,−11,−17) |
| Cingulum R/L | 0.014/0.016 | 53/135 | (10,−46,22)/(−10,−40,28) |
| Cingulum (hippocampus) R/L | 0.018/0.019 | 84/67 | (24,−29,−15)/(−19,−38,−7) |
| Superior fronto-occipital fasciculus R/L | 0.012/0.012 | 59/46 | (22,−1,21)/(−21,1,20) |
| Uncinate fasciculus R | 0.025 | 35 | (34,0,−15) |
| Tapetum R/L | 0.009/0.016 | 82/75 | (31,−52,14)/(−28,−50,16) |
| White Matter Region | Minimum p-Value (FWE-Corrected) | Volume (mm3) | MNI Peak Coordinate (mm), (x,y,z) |
|---|---|---|---|
| Middle cerebellar peduncle | 0.033 | 694 | (−6,−19,−32) |
| Superior cerebellar peduncle R/L | 0.033/0.034 | 66/49 | (6,−29,−19)/(−7,−34,−23) |
| Inferior cerebellar peduncle L | 0.040 | 113 | (−11,−46,−29) |
| Superior longitudinal fasciculus R/L | 0.016/0.019 | 610/722 | (35,−44,26)/(−32,7,22) |
| Genu of corpus callosum | 0.018 | 905 | (−13,22,18) |
| Body of corpus callosum | 0.018 | 1783 | (−13,18,21) |
| Splenium of corpus callosum | 0.015 | 1680 | (25,−53,19) |
| Anterior corona radiata R/L | 0.018/0.019 | 972/555 | (25,15,28)/(−25,13,23) |
| Superior corona radiata R/L | 0.018/0.019 | 710/793 | (25,12,28)/(−24,5,20) |
| Posterior corona radiata R/L | 0.014/0.019 | 291/287 | (28,−63,19)/(−18,−40,36) |
| External capsule R/L | 0.019/0.019 | 408/250 | (26,17,7)/(−25,10,14) |
| Posterior limb of internal capsule R/L | 0.020/0.019 | 297/390 | (23,−6,17)/(−22,−10,16) |
| Retrolenticular part of internal capsule R/L | 0.030/0.038 | 223/131 | (29,−37,17)/(−38,−33,0) |
| Anterior limb of internal capsule R/L | 0.019/0.019 | 319/436 | (22,18,9)/(−21,14,13) |
| Sagittal stratum R/L | 0.020/0.039 | 252/204 | (38,−15,−12)/(−40,−28,−7) |
| Posterior thalamic radiation R/L | 0.014/0.022 | 529/364 | (28,−64,18)/(−30,−66,16) |
| Cerebral peduncle R/L | 0.033/0.032 | 233/323 | (10,−29,−16)/(−8,−18,−20) |
| Corticospinal tract R/L | 0.034/0.033 | 99/205 | (11,−25,−22)/(−7,−21,−27) |
| Medial lemniscus R/L | 0.034/0.034 | 36/68 | (6,−33,−30)/(−4,−33,−26) |
| Pontine crossing tract | 0.033 | 217 | (6,−30,−30) |
| Fornix (cres) R | 0.020 | 164 | (33,7,−19) |
| Cingulum R/L | 0.029/0.019 | 43/160 | (10,−46,22)/(−10,−40,28) |
| Superior fronto-occipital fasciculus R/L | 0.020/0.019 | 61/54 | (22,6,20)/(−21,1,20) |
| Uncinate fasciculus R | 0.039 | 43 | (34,0,−18) |
| Tapetum R/L | 0.015/0.021 | 78/100 | (31,−52,14)/(−26,−49,19) |

| White Matter Region | Minimum p-Value (FWE-Corrected) | Volume (mm3) | MNI Peak Coordinate (mm), (x,y,z) |
|---|---|---|---|
| Superior cerebellar peduncle R | 0.043 | 49 | (4,−29,−17) |
| Superior longitudinal fasciculus R/L | 0.009/0.007 | 667/711 | (33,−40,29)/(−28,−44,31) |
| Genu of corpus callosum | 0.010 | 1005 | (−14,23,19) |
| Body of corpus callosum | 0.007 | 1749 | (−17,−23,34) |
| Splenium of corpus callosum | 0.007 | 1192 | (−23,−52,19) |
| Anterior corona radiata R/L | 0.009/0.007 | 1145/728 | (27,12,23)/(−24,13,15) |
| Superior corona radiata R/L | 0.009/0.007 | 966/991 | (26,8,25)/(−26,−18,28) |
| Posterior corona radiata R/L | 0.007/0.007 | 350/392 | (28,−63,16)/(−26,−62,16) |
| External capsule R/L | 0.009/0.007 | 426/362 | (26,16,9)/(−24,15,10) |
| Posterior limb of internal capsule R/L | 0.011/0.008 | 363/277 | (20,−4,12)/(−22,−11,14) |
| Retrolenticular part of internal capsule R/L | 0.011/0.011 | 234/276 | (30,−38,17)/(−37,−34,2) |
| Anterior limb of internal capsule R/L | 0.009/0.007 | 337/440 | (22,7,15)/(−21,14,13) |
| Sagittal stratum R/L | 0.029/0.011 | 267/189 | (40,−14,−16)/(−41,−26,−8) |
| Posterior thalamic radiation R/L | 0.007/0.008 | 512/303 | (28,−63,16)/(−26,−62,16) |
| Pontine crossing tract | 0.044 | 182 | (−2,−31,−35) |
| Fornix (cres) R/L | 0.030/0.013 | 182/191 | (35,−8,−19)/(−35,−11,−17) |
| Cingulum R/L | 0.018/0.011 | 35/141 | (10,−34,35)/(−9,−39,29) |
| Superior fronto-occipital fasciculus R/L | 0.009/0.007 | 85/61 | (22,6,19)/(−21,1,20) |
| Uncinate fasciculus R | 0.020 | 43 | (34,1,−15) |
| Tapetum R/L | 0.008/0.008 | 82/75 | (31,−52,14)/(−28,−48,20) |
| White Matter Region | Minimum p-Value (FWE-Corrected) | Volume (mm3) | MNI Peak Coordinate (mm), (x,y,z) |
|---|---|---|---|
| Middle cerebellar peduncle | 0.032 | 85 | (9,−21,−39) |
| Superior cerebellar peduncle R/L | 0.043/0.043 | 59/42 | (4,−29,−17)/(−7,−34,−23) |
| Superior longitudinal fasciculus R/L | 0.032/0.021 | 60/54 | (34,−45,28)/(−28,−44,31) |
| Genu of corpus callosum | 0.033 | 890 | (−13,23,19) |
| Body of corpus callosum | 0.021 | 1633 | (−17,−24,34) |
| Splenium of corpus callosum | 0.021 | 1612 | (−23,−52,19) |
| Anterior corona radiata R/L | 0.031/0.021 | 919/498 | (27,12,23)/(−24,13,15) |
| Superior corona radiata R/L | 0.029/0.021 | 672/804 | (19,−23,36)/(−24,3,20) |
| Posterior corona radiata R/L | 0.021/0.021 | 299/327 | (28,−63,19)/(−23,−32,32) |
| External capsule R/L | 0.032/0.021 | 81/157 | (26,16,8)/(−26,10,14) |
| Posterior limb of internal capsule R/L | 0.011/0.008 | 300/420 | (19,−11,2)/(−22,−10,14) |
| Retrolenticular part of internal capsule L | 0.028 | 127 | (−36,−34,1) |
| Anterior limb of internal capsule R/L | 0.009/0.007 | 364/432 | (23,18,8)/(−22,6,18) |
| Sagittal stratum R/L | 0.032/0.029 | 207/165 | (40,−42,−5)/(−40,−28,−7) |
| Posterior thalamic radiation R/L | 0.021/0.023 | 510/245 | (28,−63,16)/(−27,−63,18) |
| Cerebral peduncle R/L | 0.032/0.031 | 227/319 | (10,−29,−15)/(−17,−16,−6) |
| Corticospinal tract R/L | 0.032/0.032 | 107/141 | (6,−28,−40)/(−7,−20,−24) |
| Medial lemniscus R/L | 0.032/0.032 | 34/61 | (6,−33,−30)/(−4,−33,−26) |
| Pontine crossing tract | 0.032 | 204 | (−2,−31,−35) |
| Cingulum L | 0.022 | 162 | (−9,−39,29) |
| Cingulum (hippocampus) R | 0.042 | 40 | (24,−29,−15) |
| Superior fronto-occipital fasciculus R/L | 0.032/0.021 | 60/54 | (22,5,19)/(−21,1,20) |
| Tapetum R/L | 0.023/0.021 | 82/104 | (31,−52,14)/(−25,−46,20) |

| White Matter Region | Minimum p-Value (FWE-Corrected) | Volume (mm3) | MNI Peak Coordinate (mm), (x,y,z) |
|---|---|---|---|
| Superior longitudinal fasciculus L | 0.042 | 135 | (−29,−25,37) |
| Superior corona radiata L | 0.040 | 244 | (−22,−23,41) |
| External capsule L | 0.033 | 281 | (−35,−16,−8) |
| Posterior limb of internal capsule L | 0.031 | 430 | (−16,−8,4) |
| Retrolenticular part of internal capsule L | 0.035 | 297 | (−33,−35,6) |
| Anterior limb of internal capsule L | 0.035 | 37 | (−11,0,2) |
| Sagittal stratum L | 0.034 | 153 | (−40,−29,−6) |
| Cerebral peduncle L | 0.033 | 98 | (−15,−13,−5) |
| White Matter Region | Minimum p-Value (FWE-Corrected) | Volume (mm3) | MNI Peak Coordinate (mm), (x,y,z) |
|---|---|---|---|
| Superior longitudinal fasciculus L | 0.046 | 32 | (−41,−38,4) |
| External capsule L | 0.046 | 127 | (−34,−14,−8) |
| Posterior limb of internal capsule L | 0.044 | 277 | (−16,−8,4) |
| Retrolenticular part of internal capsule L | 0.047 | 202 | (−30,−23,2) |
| Sagittal stratum L | 0.042 | 83 | (−40,−30,−5) |

| White Matter Region | Minimum p-Value (FWE-Corrected) | Volume (mm3) | MNI Peak Coordinate (mm), (x,y,z) |
|---|---|---|---|
| Superior longitudinal fasciculus R | 0.037 | 78 | (35,−44,26) |
| Genu of corpus callosum | 0.037 | 387 | (−14,21,21) |
| Body of corpus callosum | 0.037 | 463 | (−12,19,21) |
| Splenium of corpus callosum | 0.034 | 87 | (25,−53,19) |
| Anterior corona radiata R | 0.042 | 91 | (17,24,24) |
| Superior corona radiata R/L | 0.049/0.046 | 258/48 | (20,−30,41)/(−22,−20,36) |
| Posterior corona radiata R | 0.020 | 285 | (20,−30,39) |
| Posterior thalamic radiation R | 0.034 | 100 | (28,−56,17) |
| Tapetum R | 0.034 | 94 | (30,−46,17) |
| White Matter Region | Minimum p-Value (FWE-Corrected) | Volume (mm3) | MNI Peak Coordinate (mm), (x,y,z) |
|---|---|---|---|
| Superior longitudinal fasciculus R/L | 0.038/0.046 | 218/127 | (35,−48,25)/(−29,−45,31) |
| Genu of corpus callosum | 0.033 | 566 | (−14,21,21) |
| Body of corpus callosum | 0.033 | 985 | (−12,19,21) |
| Splenium of corpus callosum | 0.035 | 314 | (25,−52,22) |
| Anterior corona radiata R/L | 0.040/0.038 | 144/188 | (17,27,21)/(−15,16,30) |
| Superior corona radiata R | 0.037 | 337 | (20,−29,41) |
| Posterior corona radiata R/L | 0.035/0.046 | 311/120 | (28,−55,20)/(−29,−57,21) |
| Posterior thalamic radiation R/L | 0.035/0.046 | 389/38 | (28,−63,17)/(−31,−52,16) |
| Tapetum R/L | 0.038/0.044 | 95/69 | (30,−47,17)/(−26,−51,18) |

References
- Headache Classification Committee of the International Headache Society. The International Classification of Headache Disorders, 3rd edition. Cephalalgia 2018, 38, 1–211. [Google Scholar] [CrossRef] [PubMed]
- Szabó, N.; Kincses, Z.T.; Párdutz, A.; Tajti, J.; Szok, D.; Tuka, A.; Király, A.; Babos, M.; Vörös, E.; Bomboi, G.; et al. White matter microstructural alterations in migraine: A diffusion-weighted MRI study. Pain 2012, 153, 651–656. [Google Scholar] [CrossRef] [PubMed]
- Yu, D.; Yuan, K.; Zhao, L.; Dong, M.; Liu, P.; Yang, X.; Liu, J.; Sun, J.; Zhou, G.; Xue, T.; et al. White matter integrity affected by depressive symptoms in migraine without aura: A tract-based spatial statistics study. NMR Biomed. 2013, 26, 1103–1112. [Google Scholar] [CrossRef] [PubMed]
- Gomez-Beldarrain, M.; Oroz, I.; Garcia Zapirain, B.; Fernandez Ruanova, B.; Garcia Fernandez, Y.; Cabrera, A.; Anton-Ladislao, A.; Aguirre-Larracoechea, U.; Garcia-Monco, J.C. Right fronto-insular white matter tracts link cognitive reserve and pain in migraine patients [erratum in J Headache Pain. 2016;17:22]. J. Headache Pain 2015, 17, 4. [Google Scholar] [CrossRef] [PubMed] [Green Version]
- Shibata, Y.; Ishiyama, S.; Matsushita, A. White matter diffusion abnormalities in migraine and medication overuse headache: A 1.5-T tract-based spatial statistics study. Clin. Neurol. Neurosurg. 2018, 174, 167–173. [Google Scholar] [CrossRef]
- Messina, R.; Rocca, M.A.; Colombo, B.; Pagani, E.; Falini, A.; Comi, G.; Filippi, M. White matter microstructure abnormalities in pediatric migraine patients. Cephalalgia 2015, 35, 1278–1286. [Google Scholar] [CrossRef]
- Planchuelo-Gómez, Á.; García-Azorín, D.; Guerrero, Á.L.; Aja-Fernández, S.; Rodríguez, M.; de Luis-García, R. White matter changes in chronic and episodic migraine: A diffusion tensor imaging study. J. Headache Pain 2020, 21, 1. [Google Scholar] [CrossRef]
- Coppola, G.; Di Renzo, A.; Tinelli, E.; Petolicchio, B.; Di Lorenzo, C.; Parisi, V.; Serrao, M.; Calistri, V.; Tardioli, S.; Cartocci, G.; et al. Patients with chronic migraine without history of medication overuse are characterized by a peculiar white matter fiber bundle profile. J. Headache Pain 2020, 21, 92. [Google Scholar] [CrossRef]
- Neeb, L.; Bastian, K.; Villringer, K.; Gits, H.C.; Israel, H.; Reuter, U.; Fiebach, J.B. No microstructural White Matter Alterations in Chronic and Episodic Migraineurs: A Case-Control Diffusion Tensor Magnetic Resonance Imaging Study. Headache 2015, 55, 241–251. [Google Scholar] [CrossRef]
- Tuch, D.S.; Reese, T.G.; Wiegell, M.R.; Wedeen, V.J. Diffusion MRI of Complex Neural Architecture. Neuron 2003, 40, 885–895. [Google Scholar] [CrossRef] [Green Version]
- Tristán-Vega, A.; Westin, C.-F.; Aja-Fernández, S. Estimation of fiber orientation probability density functions in high angular resolution diffusion imaging. Neuroimage 2009, 47, 638–650. [Google Scholar] [CrossRef] [PubMed]
- Jensen, J.H.; Helpern, J.A.; Ramani, A.; Lu, H.; Kaczynski, K. Diffusional kurtosis imaging: The quantification of non-gaussian water diffusion by means of magnetic resonance imaging. Magn. Reson. Med. 2005, 53, 1432–1440. [Google Scholar] [CrossRef] [PubMed]
- Wedeen, V.J.; Hagmann, P.; Tseng, W.-Y.I.; Reese, T.G.; Weisskoff, R.M. Mapping complex tissue architecture with diffusion spectrum magnetic resonance imaging. Magn. Reson. Med. 2005, 54, 1377–1386. [Google Scholar] [CrossRef] [PubMed]
- Özarslan, E.; Koay, C.G.; Shepherd, T.M.; Komlosh, M.E.; İrfanoğlu, M.O.; Pierpaoli, C.; Basser, P.J. Mean Apparent Propagator (MAP) MRI: A novel diffusion imaging method for mapping tissue microstructure. Neuroimage 2013, 78, 16–32. [Google Scholar] [CrossRef] [Green Version]
- Ning, L.; Westin, C.-F.; Rathi, Y. Estimating diffusion propagator and its moments using directional radial basis functions. IEEE Trans. Med. Imaging 2015, 34, 2058–2078. [Google Scholar] [CrossRef] [Green Version]
- Aja-Fernández, S.; de Luis-García, R.; Afzali, M.; Molendowska, M.; Pieciak, T.; Tristán-Vega, A. Micro-structure diffusion scalar measures from reduced MRI acquisitions. PLoS ONE 2020, 15, 1–25. [Google Scholar] [CrossRef]
- Planchuelo-Gómez, Á.; García-Azorín, D.; Guerrero, Á.L.; Aja-Fernández, S.; Rodríguez, M.; de Luis-García, R. Structural connectivity alterations in chronic and episodic migraine: A diffusion magnetic resonance imaging connectomics study. Cephalalgia 2020, 40, 367–383. [Google Scholar] [CrossRef]
- Headache Classification Committee of the International Headache Society. The International Classification of Headache Disorders, 3rd edition (beta version). Cephalalgia 2013, 33, 629–808. [Google Scholar] [CrossRef] [Green Version]
- Serrano, D.; Lipton, R.B.; Scher, A.I.; Reed, M.L.; Stewart, W.F.; Manack Adams, A.; Buse, D.C. Fluctuations in episodic and chronic migraine status over the course of 1 year: Implications for diagnosis, treatment and clinical trial design. J. Headache Pain 2017, 18, 101. [Google Scholar] [CrossRef]
- Zigmond, A.S.; Snaith, R.P. The hospital anxiety and depression scale. Acta Psychiatr. Scand. 1983, 67, 361–370. [Google Scholar] [CrossRef] [Green Version]
- Tournier, J.-D.; Smith, R.; Raffelt, D.; Tabbara, R.; Dhollander, T.; Pietsch, M.; Christiaens, D.; Jeurissen, B.; Yeh, C.-H.; Connelly, A. MRtrix3: A fast, flexible and open software framework for medical image processing and visualisation. Neuroimage 2019, 202, 116–137. [Google Scholar] [CrossRef] [PubMed]
- Veraart, J.; Novikov, D.S.; Christiaens, D.; Ades-Aron, B.; Sijbers, J.; Fieremans, E. Denoising of diffusion MRI using random matrix theory. Neuroimage 2016, 142, 394–406. [Google Scholar] [CrossRef] [PubMed] [Green Version]
- Andersson, J.L.; Sotiropoulos, S.N. An integrated approach to correction for off-resonance effects and subject movement in diffusion MR imaging. Neuroimage 2015, 125, 1063–1078. [Google Scholar] [CrossRef] [PubMed] [Green Version]
- Smith, S.M.; Jenkinson, M.; Woolrich, M.W.; Beckmann, C.F.; Behrens, T.E.; Johansen-Berg, H.; Bannister, P.R.; De Luca, M.; Drobnjak, I.; Flitney, D.E.; et al. Advances in functional and structural MR image analysis and implementation as FSL. Neuroimage 2004, 23, S208–S219. [Google Scholar] [CrossRef] [Green Version]
- Zhang, Y.; Brady, M.; Smith, S. Segmentation of brain MR images through a hidden Markov random field model and the expectation-maximization algorithm. IEEE Trans. Med. Imaging 2001, 20, 45–57. [Google Scholar] [CrossRef]
- Dhollander, T.; Raffelt, D.; Connelly, A. Unsupervised 3-tissue response function estimation from single-shell or multi-shell diffusion MR data without a co-registered T1 image. ISMRM Work. Break. Barriers Diffus. MRI 2016, 5. [Google Scholar]
- Jenkinson, M.; Beckmann, C.F.; Behrens, T.E.; Woolrich, M.W.; Smith, S.M. FSL. Neuroimage 2012, 62, 782–790. [Google Scholar] [CrossRef] [Green Version]
- Pelletier, A.; Periot, O.; Dilharreguy, B.; Hiba, B.; Bordessoules, M.; Chanraud, S.; Pérès, K.; Amieva, H.; Dartigues, J.-F.; Allard, M.; et al. Age-Related Modifications of Diffusion Tensor Imaging Parameters and White Matter Hyperintensities as Inter-Dependent Processes. Front. Aging. Neurosci. 2015, 7, 255. [Google Scholar] [CrossRef] [Green Version]
- Avram, A.V.; Sarlls, J.E.; Barnett, A.S.; Özarslan, E.; Thomas, C.; Irfanoglu, M.O.; Hutchinson, E.; Pierpaoli, C.; Basser, P.J. Clinical feasibility of using mean apparent propagator (MAP) MRI to characterize brain tissue microstructure. Neuroimage 2016, 127, 422–434. [Google Scholar] [CrossRef] [Green Version]
- Smith, S.M.; Jenkinson, M.; Johansen-Berg, H.; Rueckert, D.; Nichols, T.E.; Mackay, C.E.; Winkins, K.E.; Ciccarelli, O.; Cader, M.Z.; Matthews, P.M.; et al. Tract-based Spatial Statistics: Voxelwise analysis of multi-subject diffusion data. Neuroimage 2006, 31, 1487–1505. [Google Scholar] [CrossRef]
- Mori, S.; Wakana, S.; Nagae-Poetscher, L.M.; van Zijl, P.C. MRI Atlas of Human White Matter; Elsevier: Amsterdam, The Netherlands, 2005. [Google Scholar]
- Oishi, K.; Zilles, K.; Amunts, K.; Faria, A.; Jiang, H.; Li, X.; Akhter, K.; Hua, K.; Woods, R.; Toga, A.W.; et al. Human brain white matter atlas: Identification and assignment of common anatomical structures in superficial white matter. Neuroimage 2008, 43, 447–457. [Google Scholar] [CrossRef] [PubMed] [Green Version]
- Hua, K.; Zhang, J.; Wakana, S.; Jiang, H.; Li, X.; Reich, D.S.; Calabresi, P.A.; Pekar, J.J.; van Zijl, P.C.M.; Mori, S. Tract Probability Maps in Stereotaxic Spaces: Analyses of White Matter Anatomy and Tract-Specific Quantification. Neuroimage 2008, 39, 336–347. [Google Scholar] [CrossRef] [PubMed] [Green Version]
- Rueckert, D.; Sonoda, L.I.; Hayes, C.; Hill, D.L.; Leach, M.O.; Hawkes, D.J. Nonrigid registration using free-form deformations: Application to breast MR images. IEEE Trans. Med. Imaging 1999, 18, 712–721. [Google Scholar] [CrossRef] [PubMed]
- Nichols, T.E.; Holmes, A.P. Nonparametric permutation tests for functional neuroimaging: A primer with examples. Hum. Brain Mapp 2002, 15, 1–25. [Google Scholar] [CrossRef] [Green Version]
- Smith, S.M.; Nichols, T.E. Threshold-free cluster enhancement: Addressing problems of smoothing, threshold dependence and localisation in cluster inference. Neuroimage 2009, 44, 83–98. [Google Scholar] [CrossRef] [Green Version]
- Benjamini, Y.; Hochberg, Y. Controlling the false discovery rate: A practical and powerful approach to multiple testing. J. R. Stat. Soc. Ser. B 1995, 57, 289–300. [Google Scholar] [CrossRef]
- Yu, D.; Yuan, K.; Qin, W.; Zhao, L.; Dong, M.; Liu, P.; Yang, X.; Liu, J.; Sun, J.; Zhou, G.; et al. Axonal loss of white matter in migraine without aura: A tract-based spatial statistics study. Cephalalgia 2013, 33, 34–42. [Google Scholar] [CrossRef]
- Alexander, A.L.; Lee, J.E.; Lazar, M.; Field, A.S. Diffusion Tensor Imaging of the Brain. Neurotherapeutics 2007, 4, 316–329. [Google Scholar] [CrossRef] [Green Version]
- Sun, S.-W.; Liang, H.-F.; Cross, A.H.; Song, S.-K. Evolving Wallerian Degeneration after Transient Retinal Ischemia in Mice Characterized by Diffusion Tensor Imaging. Neuroimage 2008, 40, 1–10. [Google Scholar] [CrossRef] [Green Version]
- Winklewski, P.J.; Sabisz, A.; Naumczyk, P.; Jodzio, K.; Szurowska, E.; Szarmach, A. Understanding the Physiopathology Behind Axial and Radial Diffusivity Changes—What Do We Know? Front. Neurol 2018, 9, 92. [Google Scholar] [CrossRef] [Green Version]
- Bilgiç, B.; Kocaman, G.; Arslan, A.B.; Noyan, H.; Sherifov, R.; Alkan, A.; Asil, T.; Parman, Y.; Baykan, B. Volumetric differences suggest involvement of cerebellum and brainstem in chronic migraine. Cephalalgia 2016, 36, 301–308. [Google Scholar] [CrossRef] [PubMed]
- Vincent, M.; Hadjikhani, N. The cerebellum and migraine. Headache 2007, 47, 820–833. [Google Scholar] [CrossRef] [PubMed] [Green Version]
- Borsook, D.; Burstein, R. The enigma of the dorsolateral pons as a migraine generator. Cephalalgia 2012, 32, 803–812. [Google Scholar] [CrossRef] [PubMed] [Green Version]
- Chong, C.D.; Plasencia, J.D.; Frakes, D.H.; Schwedt, T.J. Structural alterations of the brainstem in migraine. NeuroImage. Clin. 2016, 13, 223–227. [Google Scholar] [CrossRef] [PubMed]
- Rocca, M.A.; Pagani, E.; Colombo, B.; Tortorella, P.; Falini, A.; Comi, G.; Filippi, M. Selective Diffusion Changes of The Visual Pathways in Patients with Migraine: A 3-T Tractography Study. Cephalalgia 2008, 28, 1061–1068. [Google Scholar] [CrossRef] [PubMed]
- Chong, C.D.; Schwedt, T.J. Migraine affects white-matter tract integrity: A diffusion-tensor imaging study. Cephalalgia 2015, 35, 1162–1171. [Google Scholar] [CrossRef]
- Marciszewski, K.K.; Meylakh, N.; Di Pietro, F.; Macefield, V.G.; Macey, P.M.; Henderson, L.A. Altered brainstem anatomy in migraine. Cephalalgia 2018, 38, 476–486. [Google Scholar] [CrossRef]
- Kattem Husøy, A.; Eikenes, L.; Håberg, A.K.; Hagen, K.; Stovner, L.J. Diffusion tensor imaging in middle-aged headache sufferers in the general population: A cross-sectional population-based imaging study in the Nord-Trøndelag health study (HUNT-MRI). J. Headache Pain 2019, 20, 78. [Google Scholar] [CrossRef] [Green Version]
- Qin, Z.; He, X.-W.; Zhang, J.; Xu, S.; Li, G.-F.; Su, J.; Shi, Y.-H.; Ban, S.; Hu, Y.; Liu, Y.-S.; et al. Structural changes of cerebellum and brainstem in migraine without aura. J. Headache Pain 2019, 20, 93. [Google Scholar] [CrossRef] [Green Version]
- Chong, C.D.; Peplinski, J.; Berisha, V.; Ross, K.; Schwedt, T.J. Differences in fibertract profiles between patients with migraine and those with persistent post-traumatic headache. Cephalalgia 2019, 39, 1121–1133. [Google Scholar] [CrossRef]
- Rocca, M.A.; Colombo, B.; Inglese, M.; Codella, M.; Comi, G.; Filippi, M. A diffusion tensor magnetic resonance imaging study of brain tissue from patients with migraine. J. Neurol. Neurosurg. Psychiatry 2003, 74, 501–503. [Google Scholar] [CrossRef] [PubMed] [Green Version]
- Burstein, R.; Jakubowski, M.; Garcia-Nicas, E.; Kainz, V.; Bajwa, Z.; Hargreaves, R.; Becerra, L.; Borsook, D. Thalamic sensitization transforms localized pain into widespread allodynia. Ann. Neurol. 2010, 68, 81–91. [Google Scholar] [CrossRef] [PubMed] [Green Version]
- Maleki, N.; Becerra, L.; Upadhyay, J.; Burstein, R.; Borsook, D. Direct optic nerve pulvinar connections defined by diffusion MR tractography in humans: Implications for photophobia. Hum. Brain Mapp. 2012, 33, 75–88. [Google Scholar] [CrossRef] [PubMed] [Green Version]
- Coppola, G.; Di Renzo, A.; Tinelli, E.; Lepre, C.; Di Lorenzo, C.; Di Lorenzo, G.A.; Scapeccia, M.; Parisi, V.; Serrao, M.; Colonnese, C.; et al. Thalamo-cortical network activity between migraine attacks: Insights from MRI-based microstructural and functional resting-state network correlation analysis. J. Headache Pain 2016, 17, 100. [Google Scholar] [CrossRef] [PubMed]
- Tracey, I.; Mantyh, P.W. The Cerebral Signature for Pain Perception and Its Modulation. Neuron 2007, 55, 377–391. [Google Scholar] [CrossRef] [Green Version]
- Moulton, E.A.; Becerra, L.; Maleki, N.; Pendse, G.; Tully, S.; Hangreaves, R.; Burstein, R.; Borsook, D. Painful Heat Reveals Hyperexcitability of the Temporal Pole in Interictal and Ictal Migraine States. Cereb. Cortex 2011, 21, 435–448. [Google Scholar] [CrossRef] [Green Version]
- Hadjikhani, N.; Ward, N.; Boshyan, J.; Napadow, V.; Maeda, Y.; Truini, A.; Caramia, F.; Tinelli, E.; Mainero, C. The missing link: Enhanced functional connectivity between amygdala and visceroceptive cortex in migraine. Cephalalgia 2013, 33, 1264–1268. [Google Scholar] [CrossRef] [Green Version]
- Coppola, G.; Di Renzo, A.; Tinelli, E.; Iacovelli, E.; Lepre, C.; Di Lorenzo, C.; Di Lorenzo, G.; Di Lenola, D.; Parisi, V.; Serrao, M.; et al. Evidence for brain morphometric changes during the migraine cycle: A magnetic resonance-based morphometry study. Cephalalgia 2015, 35, 783–791. [Google Scholar] [CrossRef]
- Schwedt, T.J.; Berisha, V.; Chong, C.D. Temporal Lobe Cortical Thickness Correlations Differentiate the Migraine Brain from the Healthy Brain. PLoS ONE 2015, 10, e0116687. [Google Scholar] [CrossRef] [Green Version]
- Yuan, K.; Qin, W.; Liu, P.; Zhao, L.; Yu, D.; Zhao, L.; Dong, M.; Liu, J.; Yang, X.; von Deneen, K.M.; et al. Reduced Fractional Anisotropy of Corpus Callosum Modulates Inter-Hemispheric Resting State Functional Connectivity in Migraine Patients without Aura. PLoS ONE 2012, 7, e45476. [Google Scholar] [CrossRef]
- Granziera, C.; DaSilva, A.F.M.; Snyder, J.; Tuch, D.S.; Hadjikhani, N. Anatomical Alterations of the Visual Motion Processing Network in Migraine with and without Aura. PLoS Med. 2006, 3, e402. [Google Scholar] [CrossRef] [PubMed]
- DaSilva, A.F.M.; Granziera, C.; Tuch, D.S.; Snyder, J.; Vincent, M.; Hadjikhani, N. Interictal alterations of the trigeminal somatosensory pathway and PAG in migraine. Neuroreport 2007, 18, 301–305. [Google Scholar] [CrossRef] [PubMed]
- Schmitz, N.; Admiraal-Behloul, F.; Arkink, E.B.; Kruit, M.C.; Schoonmann, G.G.; Ferrari, M.D.; Van Buchem, M.A. Attack frequency and disease duration as indicators for brain damage in migraine. Headache 2008, 48, 1044–1055. [Google Scholar] [CrossRef] [PubMed]
- Li, X.L.; Fang, Y.N.; Gao, Q.C.; Lin, E.J.; Hu, S.H.; Ren, L.; Ding, M.H.; Luo, B.N. A Diffusion Tensor Magnetic Resonance Image Study of Corpus Callosum From Adult Patients With Migraine Complicated With Depressive/Anxious Disorder. Headache 2011, 51, 237–245. [Google Scholar] [CrossRef]
- Coppola, G.; Tinelli, E.; Lepre, C.; Iacovelli, E.; Di Lorenzo, C.; Di Lorenzo, G.; Serrao, M.; Pauri, F.; Fiermonte, G.; Bianco, F.; et al. Dynamic changes in thalamic microstructure of migraine without aura patients: A diffusion tensor magnetic resonance imaging study. Eur J. Neurol 2014, 21, 287-e13. [Google Scholar] [CrossRef]
- Szabó, N.; Faragó, P.; Király, A.; Veréb, A.; Csete, G.; Tóth, E.; Kocsis, K.; Kincses, B.; Tuka, B.; Párdutz, A.; et al. Evidence for Plastic Processes in Migraine with Aura: A Diffusion Weighted MRI Study. Front. Neuroanat 2017, 11, 138. [Google Scholar] [CrossRef] [Green Version]
- Yalcin, A.; Ceylan, M.; Bayraktutan, O.F.; Akkurt, A. Episodic Migraine and White Matter Hyperintensities: Association of Pain Lateralization. Pain Med. 2018, 19, 2051–2057. [Google Scholar] [CrossRef] [Green Version]
- Xie, H.; Zhang, Q.; Huo, K.; Liu, R.; Jian, Z.-J.; Bian, Y.-T.; Li, G.-L.; Zhu, D.; Zhang, L.-H.; Yang, J.; et al. Association of white matter hyperintensities with migraine features and prognosis. BMC Neurol 2018, 18, 93. [Google Scholar] [CrossRef] [Green Version]
- Porter, A.; Gladstone, J.P.; Dodick, D.W. Migraine and white matter hyperintensities. Curr. Pain Headache Rep. 2005, 9, 289–293. [Google Scholar] [CrossRef]
- May, A. Understanding migraine as a cycling brain syndrome: Reviewing the evidence from functional imaging. Neurol Sci 2017, 38, 125–130. [Google Scholar] [CrossRef]
- Karsan, N.; Goadsby, P.J. Biological insights from the premonitory symptoms of migraine. Nat. Rev. Neurol. 2018, 14, 699–710. [Google Scholar] [CrossRef] [PubMed]
- Gudmundsson, L.S.; Scher, A.I.; Sigurdsson, S.; Geerlings, M.I.; Vidal, J.-S.; Eiriksdottir, G.; Garcia, M.I.; Harris, T.B.; Kjartansson, O.; Aspelund, T.; et al. Migraine, depression, and brain volume: The AGES-Reykjavik Study. Neurology 2013, 80, 2138–2144. [Google Scholar] [CrossRef] [PubMed] [Green Version]


| HC (n = 50) | EM (n = 54) | CM (n = 56) | Statistical Test | |
|---|---|---|---|---|
| Gender, male/female | 11/39 (22/78%) | 9/45 (17/83%) | 6/50 (11/89%) | χ2(2, N = 160) = 2.48, p = 0.29 † |
| Age (years) | 36.1 ± 13.2 | 37.1 ± 8.2 | 38.1 ± 8.7 | χ2 (2) = 2.85, p = 0.24 ‡ |
| Duration of the migraine history (years) | 14.1 ± 11.1 | 19.6 ± 10.4 | t(108) = −2.7, p = 0.008 § | |
| Time from onset of CM (months) | 24.5 ± 32.9 | |||
| Headache frequency (days/month) | 3.6 ± 1.9 | 23.3 ± 6.3 | U = 44.0, p < 0.001 ⁋ | |
| Migraine frequency (days/month) | 3.6 ± 1.9 | 13.9 ± 6.9 | U = 108.5, p < 0.001 ⁋ | |
| Overusing medication | 0 (0%) | 42 (75%) | p < 0.001 ⁑ | |
| Aura | 9 (17%) | 1 (2%) | p = 0.007 ⁑ |
| White Matter Region | Minimum p-Value (FWE-Corrected) | Volume (mm3) | MNI Peak Coordinate (mm), (x,y,z) |
|---|---|---|---|
| Middle cerebellar peduncle | 0.007 | 2206 | (−20,−50,−32) |
| Superior cerebellar peduncle R/L | 0.020/0.020 | 142/126 | (5,−28,−19)/(−4,−28,−19) |
| Inferior cerebellar peduncle R/L | 0.019/0.009 | 75/89 | (12,−43,−35)/(−13,−45,−31) |
| Superior longitudinal fasciculus R/L | 0.021/0.021 | 971/874 | (33,−4,20)/(−36,−49,15) |
| Genu of corpus callosum | 0.019 | 455 | (10,−28,1) |
| Body of corpus callosum | 0.032 | 842 | (−4,30,23) |
| Splenium of corpus callosum | 0.025 | 873 | (22,−50,25) |
| Anterior corona radiata R/L | 0.024/0.018 | 556/805 | (18,21,−11)/(−18,38,−1) |
| Superior corona radiata R/L | 0.020/0.022 | 666/396 | (28,−16,21)/(−27,−11,20) |
| Posterior corona radiata R/L | 0.022/0.022 | 201/214 | (25,−24,24)/(−30,−52,22) |
| External capsule R/L | 0.020/0.018 | 459/695 | (30,−10,14)/(−22,16,−12) |
| Posterior limb of internal capsule R/L | 0.020/0.022 | 569/536 | (26,−17,13)/(−27,−17,17) |
| Retrolenticular part of internal capsule R/L | 0.023/0.023 | 457/344 | (31,−34,15)/(−25,−22,3) |
| Anterior limb of internal capsule R/L | 0.022/0.020 | 216/290 | (15,−1,7)/(−20,18,3) |
| Sagittal stratum R/L | 0.022/0.022 | 471/359 | (37,−49,−4)/(−41,−18,−13) |
| Posterior thalamic radiation R/L | 0.022/0.022 | 353/279 | (37,−50,−2)/(−35,−52,13) |
| Cerebral peduncle R/L | 0.020/0.022 | 234/265 | (11,−23,−21)/(−9,−19,−20) |
| Corticospinal tract R/L | 0.019/0.023 | 106/165 | (10,−27,−26)/(−7,−18,−22) |
| Medial lemniscus R/L | 0.020/0.015 | 82/103 | (8,−39,−40)/(−7,−37,−40) |
| Pontine crossing tract | 0.018 | 82 | (8,−31,−27) |
| Fornix (cres) R/L | 0.024/0.024 | 74/45 | (35,−12,−14)/(−34,−15,−13) |
| Cingulum (hippocampus) L | 0.036 | 56 | (−17,−42,−2) |
| White Matter Region | Minimum p-Value (FWE-Corrected) | Volume (mm3) | MNI Peak Coordinate (mm), (x,y,z) |
|---|---|---|---|
| Anterior thalamic radiation L/R | 0.020/0.021 | 316/232 | (−21,18,3)/(9,−29,−14) |
| Corticospinal tract L/R | 0.022/0.018 | 627/601 | (−24,−20,9)/(10,−28,−26) |
| Cingulum (hippocampus) L | 0.036 | 37 | (−17,−43,−2) |
| Forceps major | 0.024 | 375 | (−18,−85,8) |
| Forceps minor | 0.018 | 1601 | (−17,39,−2) |
| Inferior fronto-occipital fasciculus L/R | 0.018/0.022 | 994/973 | (−23,27,3)/(37,−49,−4) |
| Inferior longitudinal fasciculus L/R | 0.022/0.022 | 418/507 | (−35,−52,12)/(44,−33,−12) |
| Superior longitudinal fasciculus L/R | 0.021/0.021 | 1023/828 | (−36,−50,14)/(31,−6,17) |
| Superior longitudinal fasciculus (temporal part) R | 0.022 | 62 | (49,−33,−11) |
| Uncinate fasciculus L | 0.018 | 83 | (−18,21,−9) |
| White Matter Region | Minimum p-Value (FWE-Corrected) | Volume (mm3) | MNI Peak Coordinate (mm), (x,y,z) |
|---|---|---|---|
| Middle cerebellar peduncle | 0.042 | 908 | (13,−30,−26) |
| Superior cerebellar peduncle R/L | 0.042/0.042 | 65/65 | (7,−32,−19)/(−5,−31,−18) |
| Inferior cerebellar peduncle L | 0.045 | 96 | (−13,−45,−31) |
| Genu of corpus callosum | 0.047 | 44 | (18,31,15) |
| Anterior corona radiata R | 0.044 | 446 | (26,35,−1) |
| Superior corona radiata R | 0.048 | 84 | (23,−12,19) |
| External capsule R/L | 0.042/0.046 | 415/392 | (33,−19,−2)/(−33,−13,1) |
| Posterior limb of internal capsule R/L | 0.042/0.046 | 285/420 | (20,−20,−4)/(−22,−8,14) |
| Retrolenticular part of internal capsule R/L | 0.041/0.044 | 244/314 | (37,−26,−2)/(−37,−34,2) |
| Anterior limb of internal capsule L | 0.046 | 43 | (−17,−2,12) |
| Sagittal stratum R/L | 0.041/0.044 | 243/97 | (39,−29,−5)/(−40,−29,−6) |
| Cerebral peduncle R | 0.042 | 254 | (12,−25,−21) |
| Corticospinal tract R/L | 0.042/0.042 | 156/135 | (11,−25,−22)/(−7,−25,−26) |
| Medial lemniscus R/L | 0.045/0.046 | 83/87 | (9,−32,−25)/(−4,−37,−30) |
| Pontine crossing tract | 0.042 | 163 | (−4,−30,−28) |
| Fornix (cres) R | 0.041 | 148 | (32,−22,−6) |
| Uncinate fasciculus R | 0.043 | 32 | (35,−4,−14) |
| White Matter Region | Minimum p-Value (FWE-Corrected) | Volume (mm3) | MNI Peak Coordinate (mm), (x,y,z) |
|---|---|---|---|
| Anterior thalamic radiation L/R | 0.046/0.042 | 34/68 | (−7,−36,−27)/(9,−29,−14) |
| Corticospinal tract L/R | 0.042/0.042 | 284/374 | (−7,−25,−26)/(11,−25,−22) |
| Forceps minor | 0.046 | 342 | (19,38,16) |
| Inferior fronto-occipital fasciculus L/R | 0.044/0.044 | 240/676 | (−39,−30,−4)/(37,−27,−3) |
| Inferior longitudinal fasciculus L/R | 0.043/0.042 | 309/167 | (−41,−28,−4)/(42,−14,−14) |
| Uncinate fasciculus L/R | 0.048/0.044 | 62/71 | (−35,−2,−20)/(34,1,−16) |
© 2020 by the authors. Licensee MDPI, Basel, Switzerland. This article is an open access article distributed under the terms and conditions of the Creative Commons Attribution (CC BY) license (http://creativecommons.org/licenses/by/4.0/).
Share and Cite
Planchuelo-Gómez, Á.; García-Azorín, D.; Guerrero, Á.L.; de Luis-García, R.; Rodríguez, M.; Aja-Fernández, S. Alternative Microstructural Measures to Complement Diffusion Tensor Imaging in Migraine Studies with Standard MRI Acquisition. Brain Sci. 2020, 10, 711. https://doi.org/10.3390/brainsci10100711
Planchuelo-Gómez Á, García-Azorín D, Guerrero ÁL, de Luis-García R, Rodríguez M, Aja-Fernández S. Alternative Microstructural Measures to Complement Diffusion Tensor Imaging in Migraine Studies with Standard MRI Acquisition. Brain Sciences. 2020; 10(10):711. https://doi.org/10.3390/brainsci10100711
Chicago/Turabian StylePlanchuelo-Gómez, Álvaro, David García-Azorín, Ángel L. Guerrero, Rodrigo de Luis-García, Margarita Rodríguez, and Santiago Aja-Fernández. 2020. "Alternative Microstructural Measures to Complement Diffusion Tensor Imaging in Migraine Studies with Standard MRI Acquisition" Brain Sciences 10, no. 10: 711. https://doi.org/10.3390/brainsci10100711