Article

Measuring Spatial Accessibility of Urban Fire Services Using Historical Fire Incidents in Nanjing, China

1
College of Hydrology and Water Resources, Hohai University, Nanjing 210098, China
2
School of Earth Sciences and Engineering, Hohai University, Nanjing 210098, China
*
Author to whom correspondence should be addressed.
ISPRS Int. J. Geo-Inf. 2020, 9(10), 585; https://doi.org/10.3390/ijgi9100585
Submission received: 11 August 2020 / Revised: 27 September 2020 / Accepted: 4 October 2020 / Published: 6 October 2020

Abstract

:
The measurement of spatial accessibility of fire services is a key task in enhancing fire response efficiency and minimizing property losses and deaths. Recently, the two-step floating catchment area method and its modified versions have been widely applied. However, the circle catchment areas used in these methods are not suitable for measuring the accessibility of fire services because each fire station is often responsible for the fire incidents within its coverage. Meanwhile, most existing methods take the demographic data and their centroids of residential areas as the demands and locations, respectively, which makes it difficult to reflect the actual demands and locations of fire services. Thus, this paper proposes a fixed-coverage-based two-step floating catchment area (FC2SFCA) method that takes the fixed service coverage of fire stations as the catchment area and the locations and dispatched fire engines of historical fire incidents as the demand location and size, respectively, to measure the spatial accessibility of fire services. Using a case study area in Nanjing, China, the proposed FC2SFCA and enhanced two-step floating catchment area (E2SFCA) are employed to measure and compare the spatial accessibility of fire incidents and fire stations. The results show that (1) the spatial accessibility across Nanjing, China is unbalanced, with relatively high spatial accessibility in the areas around fire stations and the southwest and northeast at the city center area and relatively low spatial accessibility in the periphery and boundary of the service coverage areas and the core of the city center; (2) compared with E2SFCA, FC2SFCA is less influenced by other fire stations and provides greater actual fire service accessibility; (3) the spatial accessibility of fire services is more strongly affected by the number of fire incidents than firefighting capabilities, the area of service coverage, or the average number of crossroads (per kilometer). Suggestions are then made to improve the overall spatial access to fire services.

Graphical Abstract

1. Introduction

Fire disasters are one of the most significant global disasters that seriously threaten public safety and social development [1,2]. A total of 10,815 fire fatalities occurred and caused 15,193 deaths between 2007 and 2016 in China (http://www.china-fire.com). With the acceleration of urbanization, fire incidents have become increasingly frequent and complex [3]. Timely fire emergency responses are increasingly required and must be able to effectively minimize property losses and deaths [4]. Spatial accessibility is an important way to measure the spatial equilibrium of public service facilities and is also widely used as an effective approach to evaluate the accessibility of urban fire services [5,6,7,8]. According to the evaluation of spatial accessibility for urban fires, the areas with low access can be determined, which are relatively scarce in areas with greater demand for fire services [7]. It is helpful for fire agencies to optimize and improve the spatial allocation of firefighting resources in these poor spatial accessibility areas, which may shorten emergency response time and thus improve the fire rescue’s efficiency [6,8].
Spatial accessibility refers to the availability of and proximity to public services, while the tendency of individuals to choose public services is referred to as non-spatial accessibility [9,10,11]. Many methods have been developed to quantify spatial accessibility, such as the proximity to the nearest facility [12], regional availability methods [13], and the gravity model [14], while the two-step floating catchment area (2SFCA) method is one of the most widely used approaches [15,16,17]. The 2SFCA method was first proposed by Radke and Mu [18] and considers the facility capacity, potential demand, and travel impedance between demand and service facilities, as well as the maximum service coverage area, to evaluate the spatial accessibility of public services. However, the original 2SFCA is a dichotomous measure that considers a single distance impedance within a catchment and disregards all of the areas out of the threshold range. To overcome these limits, Luo and Qi [19] developed an enhanced two-step floating catchment area (E2SFCA) method by applying weights to differentiate travel time zones to account for the distance decay. In past decades, the original 2SFCA method was extended in three groups [20]: (1) variable or dynamic 2SFCA using different catchment sizes [16,21], (2) three-step FCA using the competition of supply and demand [22], and (3) multi-modal or commuter-based 2SFCA using transport modes [23,24]. A large number of these modified versions have been applied to measure spatial accessibility in various public services, such as health care [25,26,27,28,29], green spaces [17,30,31], food stores [32,33], job opportunities [15], and emergency shelters [34].
Several modified 2SFCA versions have also been applied to assess the spatial accessibility of fire emergency services. Min, Kim, and Lee [8] used 2SFCA to measure the spatial accessibility of fire services in Dallas City, Texas, USA and found that this measure was closely related to unintentional residential fire-related injuries. Xia, Li, Chen, and Yu [7] proposed an optimized 2SFCA that integrated spatial and non-spatial dimensions to measure urban fire service access. Kc, Corcoran, and Chhetri [6] employed E2SFCA to compute the levels of spatial accessibility to fire services in relation to the current population and future population in Brisbane, Australia, and identified the areas with low future spatial accessibility of fire services, which provided beneficial decision-making data for fire services agencies to select the locations of new fire stations in the future.
However, the original 2SFCA and its existing extensions (including E2SFCA) adopted the circles of service locations as the catchment areas, which are unsuitable for assessing spatial accessibility of fire services. Because each fire station is often responsible for fire incidents within its coverage area and the overwhelming majority of people suffering fire incidents cannot choose other fire stations as their service supply [35], this is different from other public services (e.g., health care services and green spaces), for which people can choose one of the nearby hospitals or green spaces as their service supply [16,17]. Meanwhile, most modified 2SFCA methods take demographical data and their centroids of residential areas as the demands and locations, respectively [6,8], which make it difficult to reflect the actual demands and locations of fires. Because the centroid of a demographical area (e.g., an administrative unit) is only one point in a large area, this centroid cannot represent the detailed spatial distribution of all fire incidents within the area accurately. The demand size for fire services is not directly related to population density but often to fire loads [3,36,37]. By contrast, the locations of historical fire incidents and the number of fire engines dispatched during each fire incident are able to present the actual locations and demands of fires, respectively. Fire incidents can specify where fires are spatially distributed and thus provide a more realistic and detailed distribution of fire incidents than the centroids of demographic areas. A greater fire load usually needs more fire engines, so indicating the number of dispatched fire engines in each fire incident can accurately characterize the demand size of fire services.
Therefore, this paper proposes a fixed-coverage-based two-step floating catchment area (FC2SFCA) method that uses the fixed service coverage of fire stations as the catchment area and takes the locations and dispatched fire engines of historical fire incidents as the demand location and size, respectively. The proposed FC2SFCA method is applied in Nanjing, China as a case study to measure and analyze the spatial accessibility of fire incidents and fire services.
The remainder of this paper is organized as follows. Section 2 outlines the study area and data, Section 3 describes the proposed method, and the experimental results are analyzed in Section 4. Section 5 provides the discussion. Finally, Section 6 presents the conclusions.

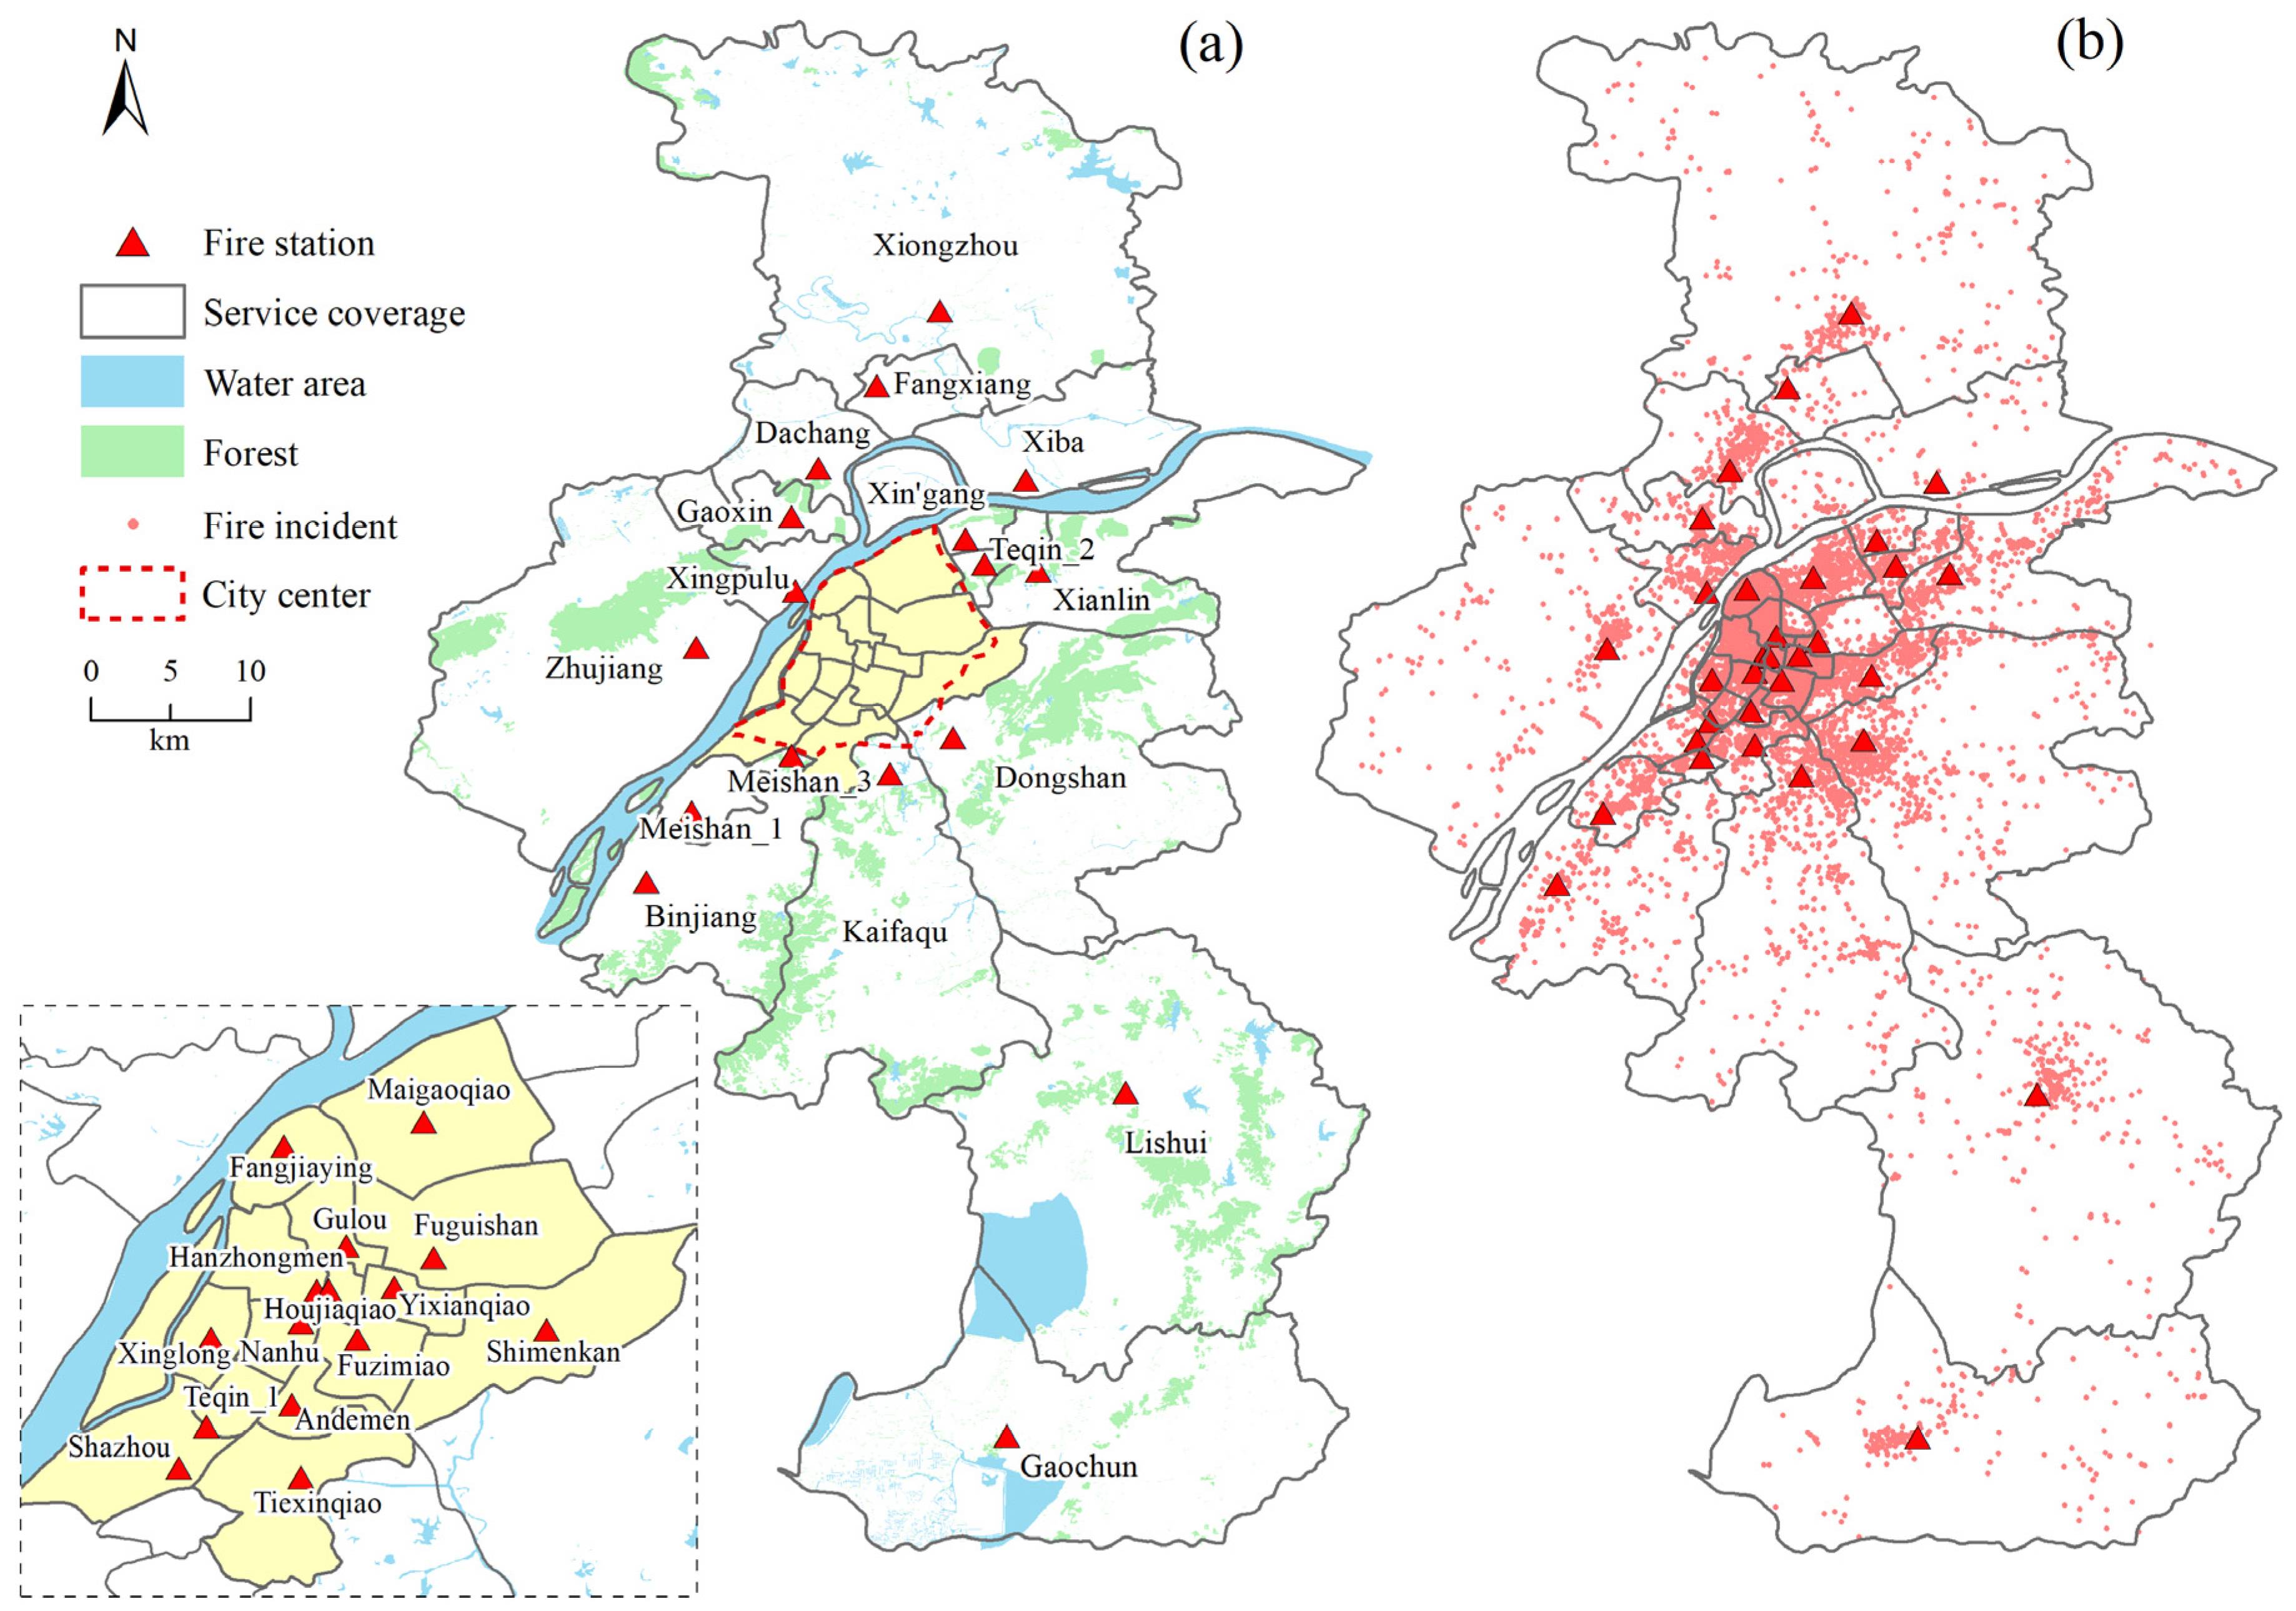
2. Study Area and Data

Nanjing is the capital of Jiangsu province, and is located in the southwest of the province and the lower reaches of the Yangtze River. According to the Jiangsu Statistical Yearbook (http://tj.jiangsu.gov.cn/index.html), the population of Nanjing in 2015 was 8.236 million, with an area of 6587 square kilometers. The rate of urbanization in Nanjing was 80.23% in 2012 and reached 83.20% in 2019. As one of the earliest cities to rapidly urbanize in modern China, Nanjing is a typical area in terms of firefighting construction in large cities, making it suitable for analyzing spatial accessibility of fire services.
As shown in Figure 1a, Nanjing is divided into two areas, the city center and suburbs, for a later comparative analysis (http://ghj.nanjing.gov.cn/), and the service coverage of 32 fire stations is employed as the basic spatial analysis unit of spatial accessibility for the fire stations. At the same time, historical fire records were collected from 2012, 2013, and 2015 for each fire station (records from 2014 were not available), with a total of 15,878 fire incidents, among which there were 2965 in 2012, 4432 in 2013, and 8481 in 2015. As shown in Figure 1b, the distribution of fire incidents is densely distributed in the city center and sparsely distributed in the suburbs. The fire incident records contain the fire incident location (i.e., the destination of fire rescue), the involved fire station location (i.e., the origin of fire rescue), the fire engines used for each fire incident, the date of the fire incidents, etc. Furthermore, as shown in Figure 2, the number of firefighters and fire engines at each fire station was acquired to measure the firefighting capability of each fire station [7]. All data mentioned above were obtained from the Nanjing Fire Department (http://www.nj119.com.cn/).

3. Methodology

The E2SFCA method considers different decay weights for different travel time zones and has been widely applied in various fields for measuring spatial accessibility [6,25,38,39,40]. Therefore, the proposed FC2SFCA follows the idea of E2SFCA [19] and modifies it in the following ways: (1) the circles are replaced by the fixed-service coverage of fire stations as the catchment area for calculating the supply-to-demand ratio; (2) the locations and dispatched fire engines of historical fire incidents (rather than population and their centroids as in previous studies [6,8,41,42]) are used as the demand location and size, respectively; (3) a hybrid time zone scheme is adopted to measure travel impedance; and (4) an online map API is employed to accurately estimate the travel time from a fire station to a fire incident. More details are described in the following. A flowchart of the FC2SFCA method is shown in Figure 3 and involves the following four processes.
(1) According to the fire station locations and fire incident locations, the travel time between a fire incident location (i.e., destination) and its involved fire station (i.e., origin) is first estimated from an online map API and then used to calculate the travel impedance with the hybrid time zone scheme (FC2SFCA assumes that each fire incident has only one fire station as support since the overwhelming majority of fire incidents were supported by only one fire station according to the historical data records).
(2) The number of firefighters and fire engines of each fire station is used to measure the supply capacity of the fire stations, as done in a previous study [7].
(3) The locations and numbers of dispatched fire engines of fire incidents (i.e., demands) within the service coverage area are combined with the supply capacity of the fire station and the travel impedance of each fire incident to compute the supply-to-demand ratio for each fire station.
(4) The spatial accessibility of each fire incident is measured using the supply-to-demand ratio of the fire station and the travel impedance of the fire incident.

3.1. Estimation of Travel Time by Online Map API

Most previous studies calculated the travel time via the ArcGIS Network Analyst tool using a distance from origin to destination and a hypothetical speed based on vector maps [43,44], which has the obvious limitation that the accuracy of the result depends on the hypothetical speed, which is arbitrary in practice [45]. Recently, online map APIs (e.g., Google map API, Baidu map API, and AutoNavi Maps API) have been widely applied to estimate the travel distance and travel time for the multi-model 2SFCA model [45,46,47] and have demonstrated several advantages, such as the lack of a need to build a road network, their use of the latest road network, and their ability to reflect real-time traffic situations [48,49]. In this study, the road network travel time from a fire station to a fire incident is estimated by the AutoNavi Maps API. As one of the biggest online maps, the AutoNavi Maps API (http://lbs.amap.com/) has been extensively applied in measuring spatial accessibility [49,50]. For this, the private car mode of AutoNavi Maps API was employed to estimate the travel time under unblocked traffic conditions (0:00 am–1:00 am on 23 June 2020). Note that the traffic light waiting time was not excluded for fire engines due to the unavailability of waiting time in AutoNavi Maps API. Even so, the previous study on fire analysis demonstrated the effectiveness of online map APIs in estimating accurate travel time [35].

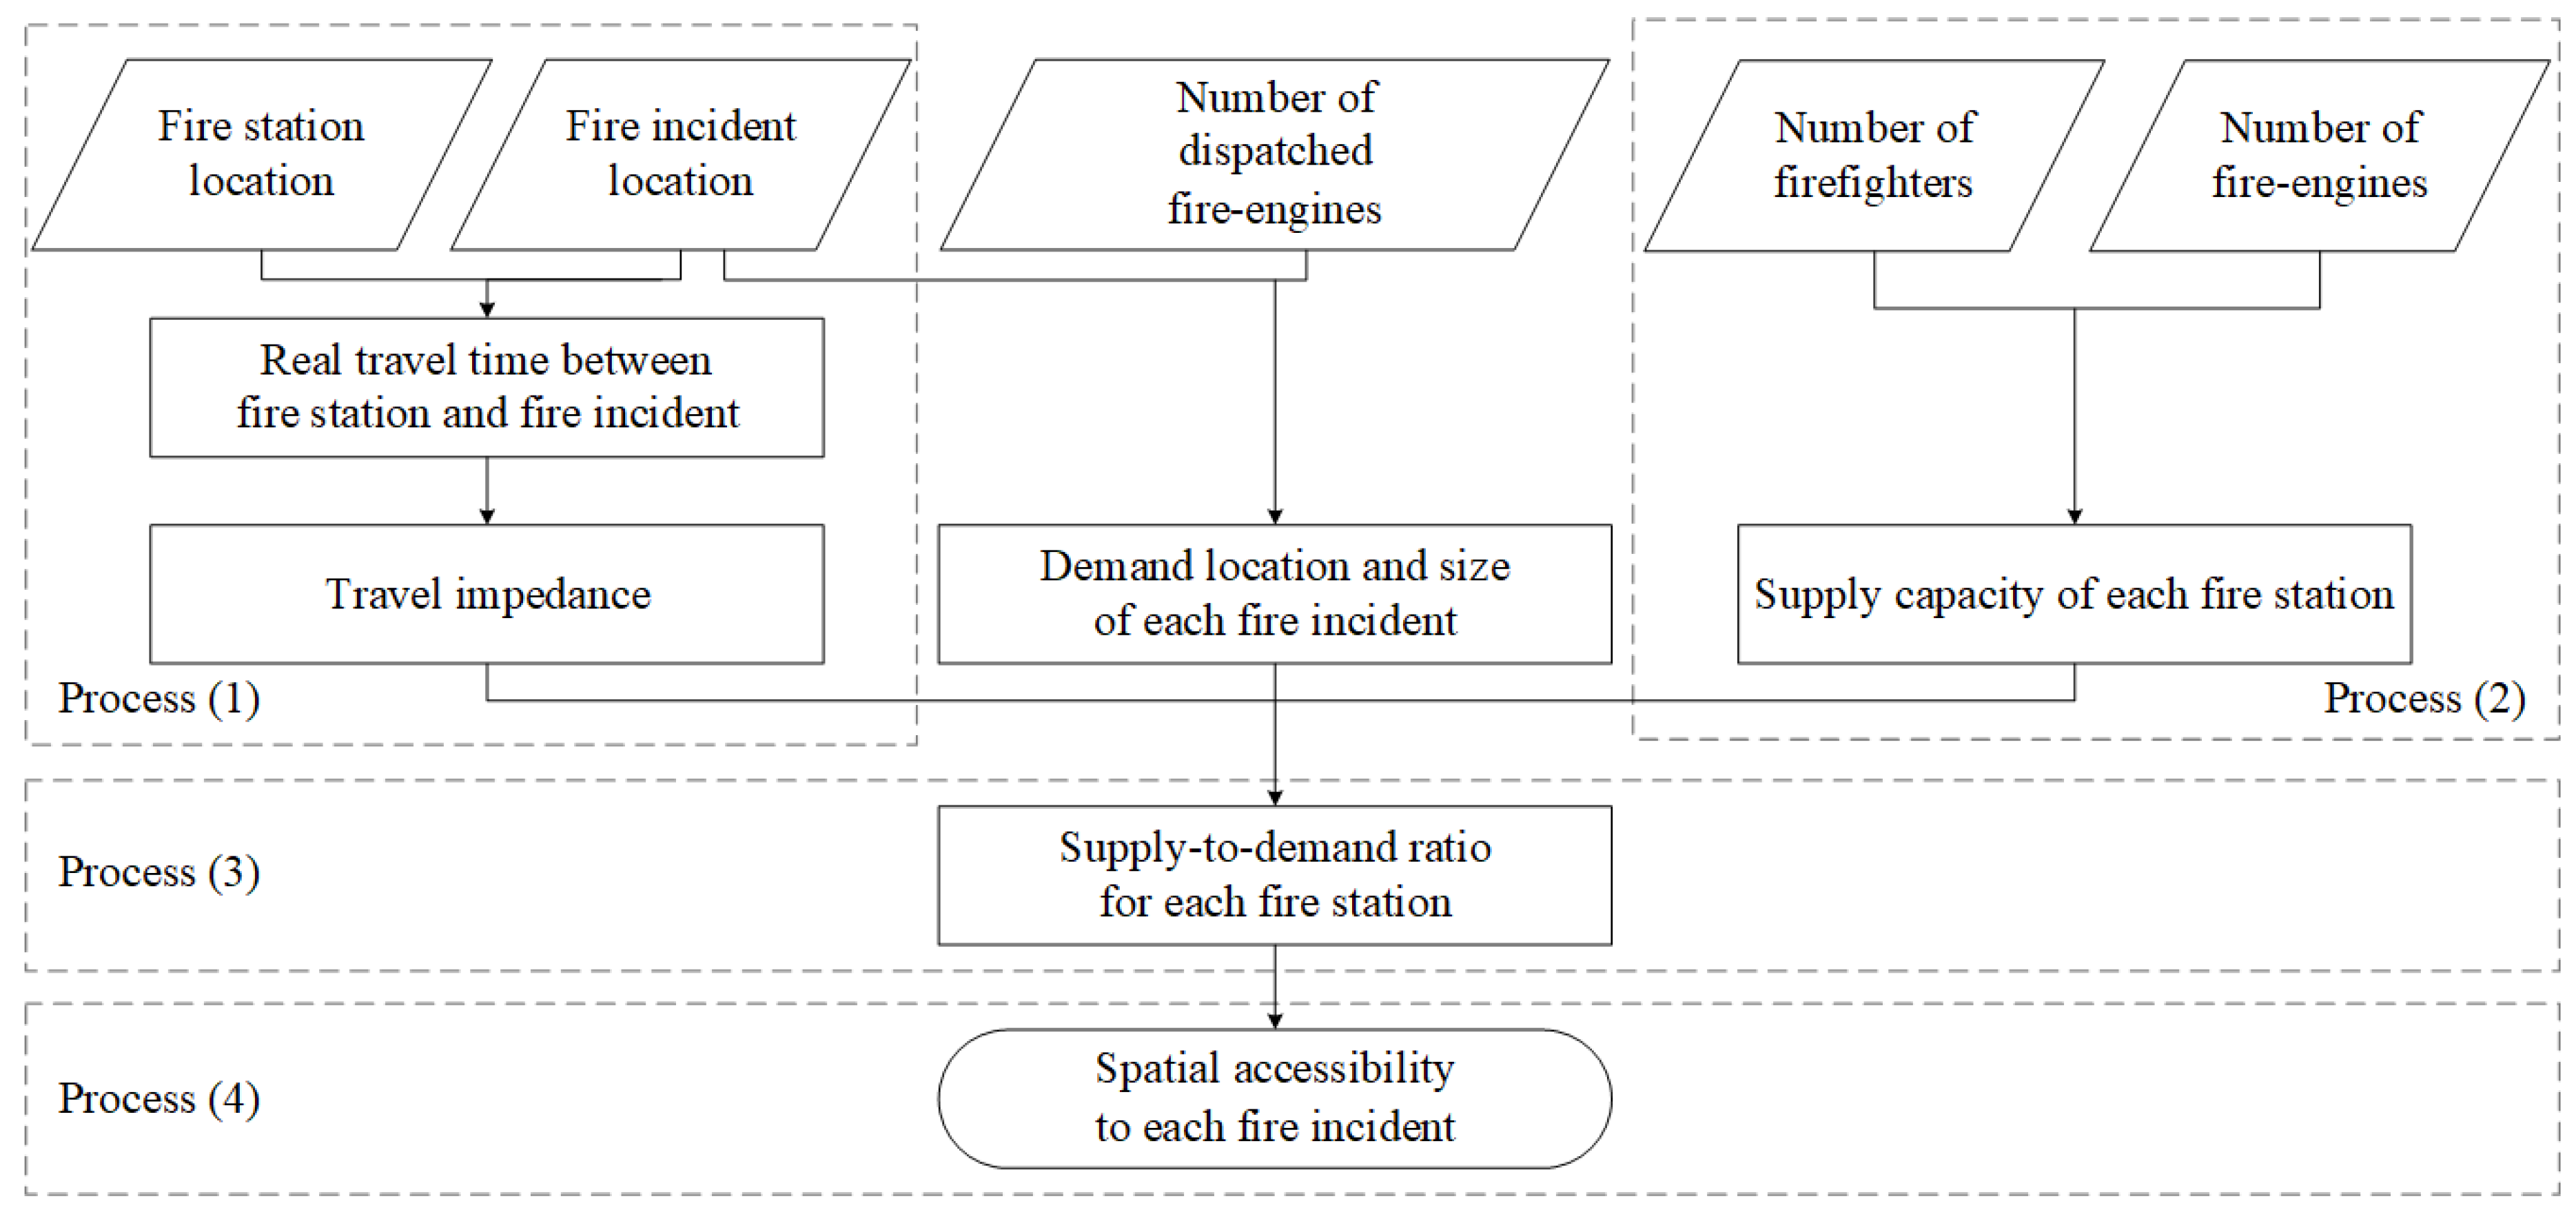
3.2. Spatial Accessibility Measurement of Fire Incidents

The proposed FC2SFCA method measures the spatial accessibility to fire incidents in two steps.
Step 1: For fire station j , search all fire incidents i within a threshold of travel time t 0 , the number of used fire engines D i during the fire incident i is weighted by travel impedance ω i j . The supply-to-demand ratio for each fire station is computed as
R j = S j i ϵ { t i j t 0 } D i ω i j
where the supply S j of fire station j is estimated by the sum of firefighters and fire engines that are intact and on duty [7], D i is the number of fire engines that are dispatched during the fire incident i , ω i j is the travel impedance from i to j under the hybrid travel time zone scheme capturing the travel time decay of access for the service coverage, which is represented by
ω i j = { 1 t i j 300   s ( e 1 2 ( t i j 300 900 ) 2 e 1 2 ) / ( 1 e 1 2 )   300   s < t i j 1200   s 0 t i j > 1200   s
The hybrid travel time zone scheme is designed for two reasons. First, national regulations stipulate that firefighters should reach the fire scene within 5 minutes after they receive the fire alarm [51]. Hence, 5 minutes is the ideal travel time, and each time zone within 5 minutes should use the same decay weight. Second, it was found that 90.6% of fire incidents can be reached within 20 minutes in our case study, and thus a time zone with 5 min to 20 min maximum catchment radius with an impedance function was defined. Time over 20 min was defined as the last time zone. Set ω i j = 1 when the travel time is within 5 minutes, indicating that the rescue area has good spatial accessibility with no travel time decay. When the travel time is over 20 minutes, set ω i j = 0 , indicating that the rescue area is inaccessible. When the travel time is between 5 minutes and 20 minutes, the Gaussian function was used to measure the travel time decay, which is one of the most popular impedance functions [52], and is expressed in Equation (2), where t i j is the travel time in seconds from fire station j to fire incident i .
Step 2: Generally, the E2SFCA method calculates the spatial accessibility A i of fire incident i by summing up the supply-to-demand ratios R j of the fire station j that falls within the catchment area, as shown in Equation (3). However, it is unsuitable for measuring the spatial accessibility of fire services because the overwhelming majority of fire incidents only have one corresponding fire station to rescue, and each fire station is only responsible for the fire incidents within its coverage area. Thus, the spatial accessibility of each fire incident is calculated by Equation (4)
A i = j ϵ { t i j t 0 } R j ω i j
A i = R j ω i j
where R j is the supply-to-demand ratio of fire station j , which corresponds to the fire incident i , and ω i j is the travel impedance in Equation (2).
To compare FC2SFCA with E2SFCA in a fair way, the historical fire incidents, rather than the population data of residential areas often used for E2SFCA [6,38,53], are also used as the demand in E2SFCA. Meanwhile, the modified hybrid travel time zone scheme for calculating travel impedance is also used in the two methods. A comparison of the original E2SFCA method and the proposed FC2SFCA method for measuring the accessibility of fire incidents is summarized in Table 1. In essence, the use of catchment areas for calculating the supply-to-demand ratio in Step 1 and for measuring the spatial accessibility in Step 2 by the proposed FC2SFCA is different from that in E2SFCA. Figure 4 illustrates a comparison of those two methods for generating the catchment area. It can be seen that in Step 1, E2SFCA uses a circle of the fire station (red triangle) and its covered fire incidents (red points) for the calculation of the supply-to-demand ratio, while FC2SFCA employs the fixed-service coverage area of the fire station and its covered fire incidents (red points). In Step 2, E2SFCA adopts the three covered fire stations (three red triangles) of a circle centered on the fire incident (red point) to measure the accessibility of the fire incident, whereas FC2SFCA only uses one fire station (red triangle) responsible for the fire incident.

3.3. Spatial Accessibility Measurement of Fire Stations

To represent the spatial accessibility of each fire station comprehensively, the average of the fire incidents’ spatial accessibility within the service coverage is taken as the spatial accessibility of this fire station, which is expressed as
F j = 1 N i = 1 N A i
where F j represents the spatial accessibility of fire station j , A i represents the spatial accessibility of fire incident i , and N is the number of fire incidents within the service coverage of fire station j .

3.4. Spatial Pattern Analysis of Fire Service Accessibility

The Optimized Hot Spot Analysis in ArcGIS 10.4 is used to analyze the spatial pattern of the spatial accessibility of fire incidents. This software can create a map of statistically significant hot and cold spots using the Getis–Ord Gi* statistic and evaluate the characteristics of the input feature class to produce optimal results.

4. Results and Analysis

To compare the proposed FC2SFCA with E2SFCA, the spatial accessibility of fire incidents and fire stations by E2SFCA is measured and analyzed.

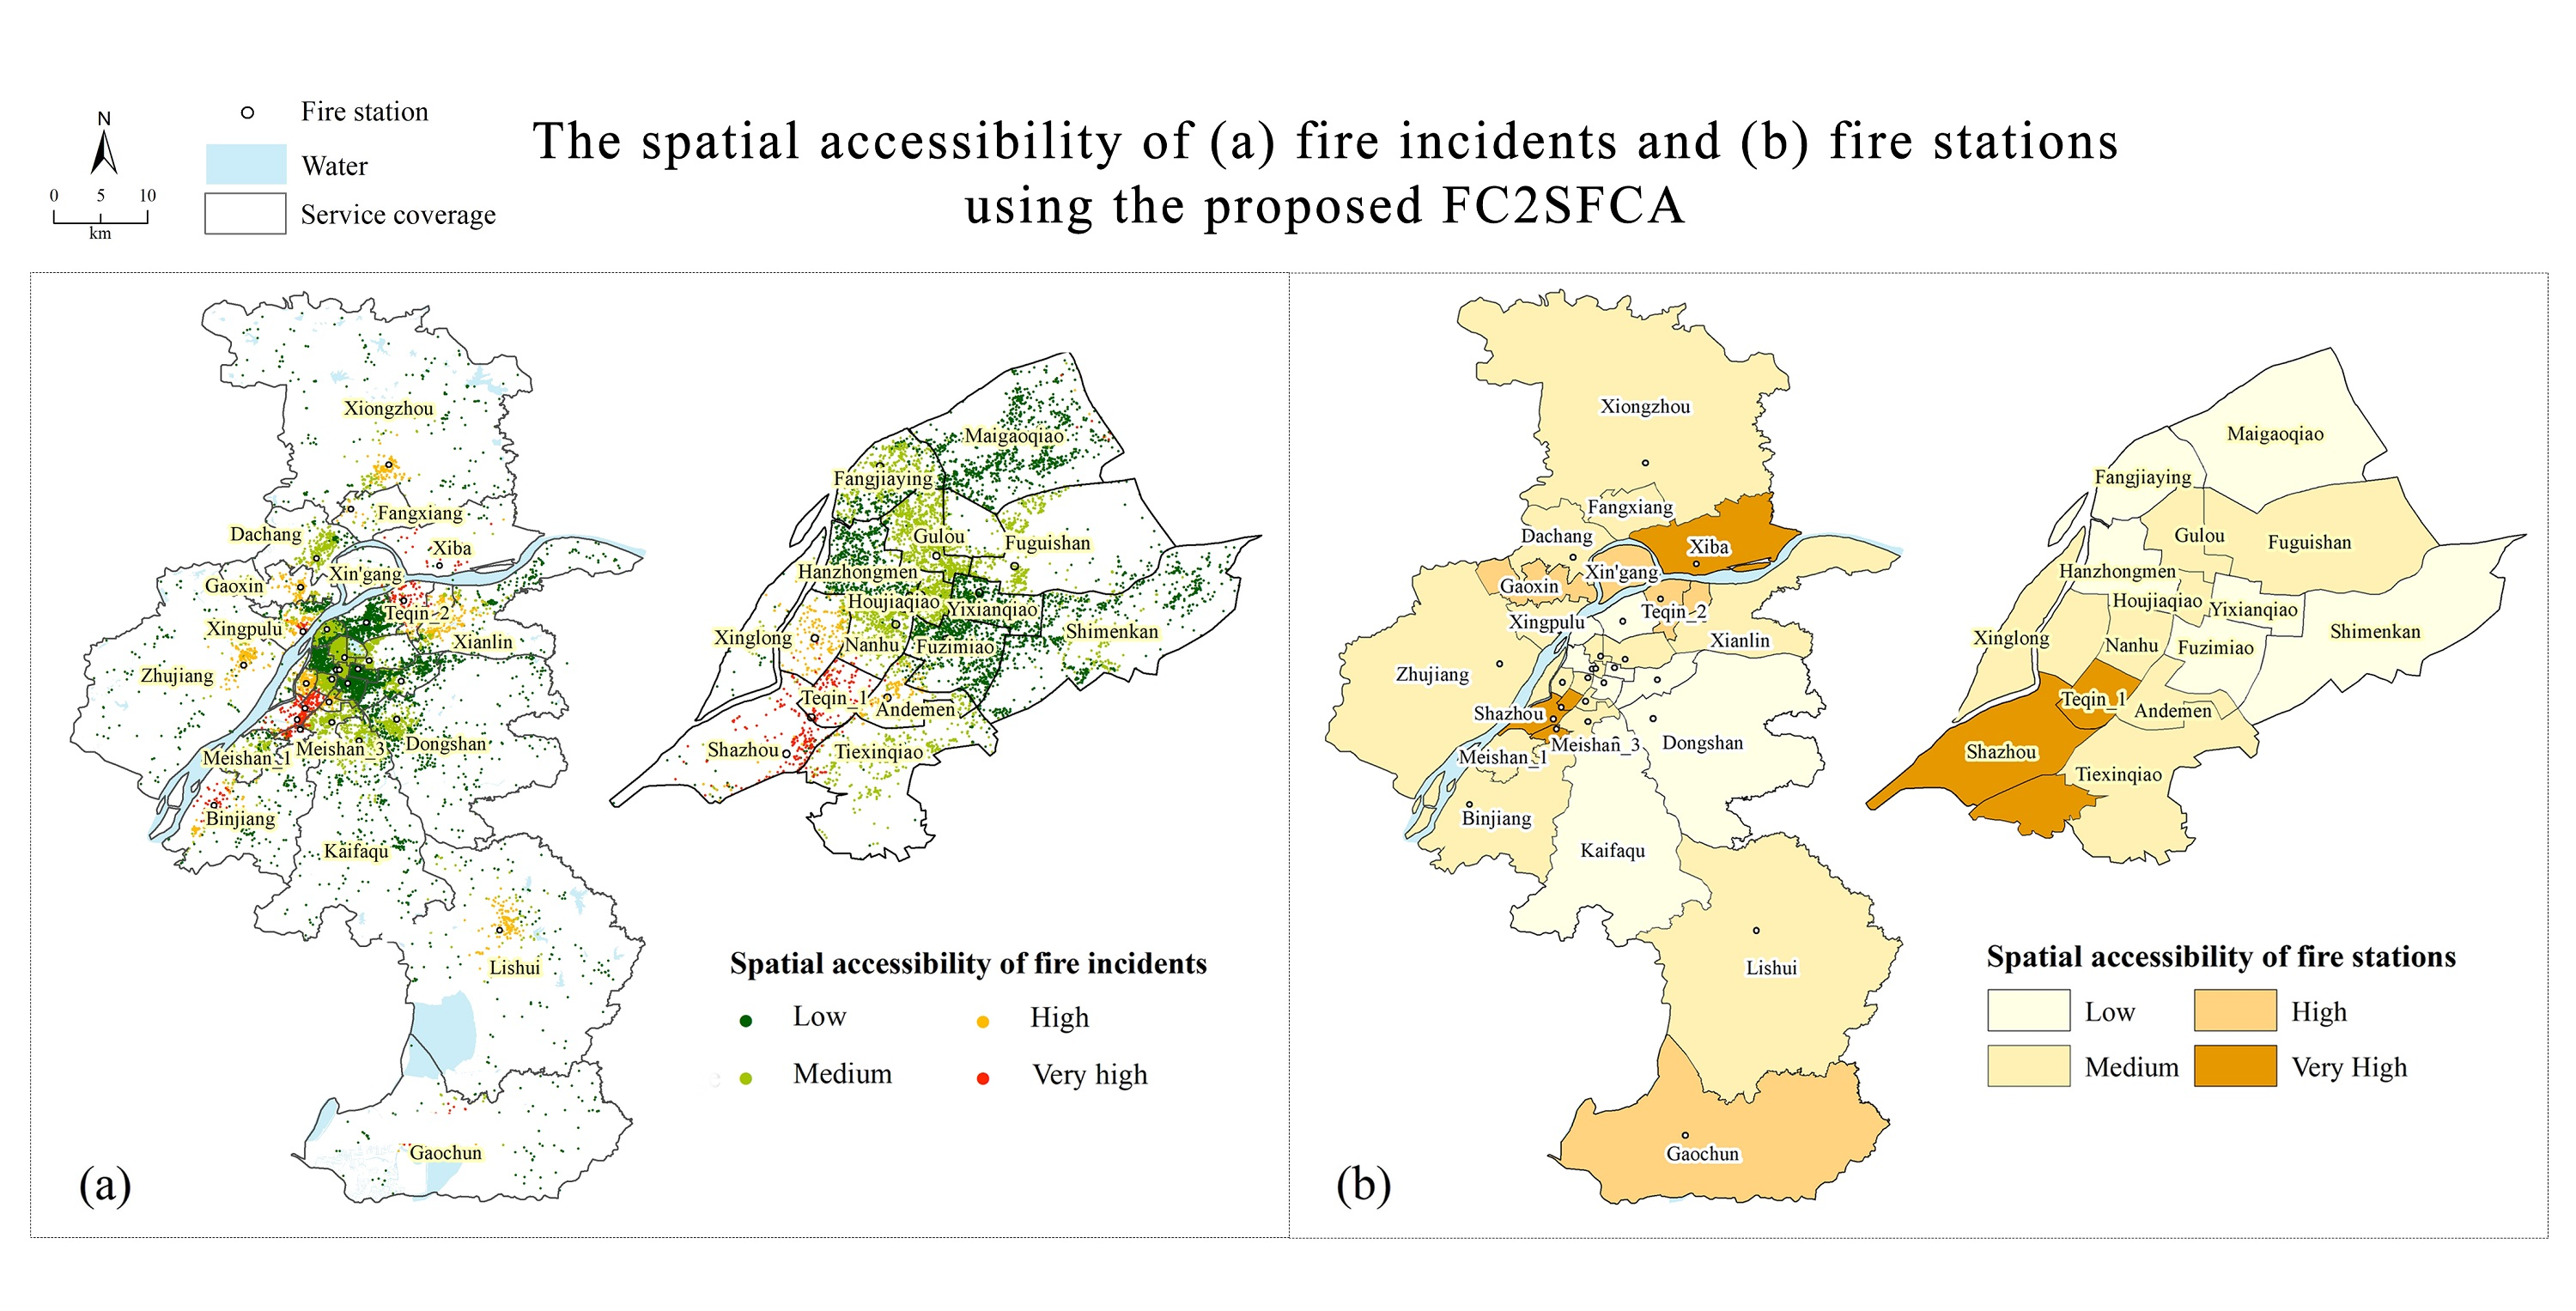
4.1. Spatial Accessibility Analysis of Fire Incidents

The E2SFCA method and the FC2SFCA method are used to calculate the spatial accessibility of 15,878 historical fire incidents over three years. As shown in Figure 5, the probability density distribution histogram shows that the spatial accessibility score of the fire incidents is mainly distributed within 0.09 (about 93%), with a few high values in the range of 0.09–0.35 and a frequency peak around 0.02–0.04. At the same time, it can be found that some spatial accessibility scores are zero, which indicates that the travel time of these fire incidents exceeds 20 minutes. By comparison, the spatial accessibility in FC2SFCA has a higher frequency within 0.03 but a lower frequency in the range of 0.03–0.09, indicating that the overall spatial accessibility in FC2SFCA is lower than that in E2SFCA. In addition, the spatial accessibility in E2SFCA changes more smoothly, but that in FC2SFCA changes more drastically and shows an obviously higher frequency for some values. The main reason for this result is that FC2SFCA takes the service coverage of the fire station as the catchment area. In the same catchment area, there is only one supply, so fire incidents with similar travel times or travel distances have similar spatial accessibility. Moreover, the distribution of fire incidents in the service coverage is always regionally aggregated instead of uniform. For instance, more fire incidents gather around the fire station, which leads to a higher frequency for some values of spatial accessibility.
According to the distribution characteristics of the spatial accessibility score, the spatial accessibility of fire incidents is classified into four levels. A few fire incidents with a score of over 0.09 are classified under the very high level. The spatial accessibility scores from 0 to 0.09 are divided into three levels with an interval of 0.03, corresponding to the levels of low, medium, and high, as shown in Table 2. Only a few fire incidents have high or very high spatial accessibility, while most of them have low or medium spatial accessibility. There are slightly more fire incidents with medium spatial accessibility in E2SFCA, and slightly more with low spatial accessibility in the results of the FC2SFCA method, which further confirms the distribution of the probability density distribution histogram.
Figure 6 presents the spatial accessibility levels of fire incidents in Nanjing: Figure 6a,c present the results of the E2SFCA method, and Figure 6b,d show the results of the FC2SFCA method. As can be seen from Figure 6, the accessibility of fire incidents in Nanjing has obvious spatial differences, with higher spatial accessibility in the vicinity of several fire stations and in the southwest (around Teqin_1) and northeast outside (around Teqin_2) of the city center, with lower spatial accessibility in the periphery and the boundary of the service coverage and the north area (Fangjiaying, Maigaoqiao, Shimenkan, etc.) of the city center.
The spatial accessibility of the two models is generally similar in the urban suburbs (such as Xiongzhou, Zhujiang, Lishui, and Gaochun) but shows great differences in the city center, especially in areas like Fuzimiao, Houjiaqiao, and Yixianqiao, where the spatial accessibility of fire incidents according to E2SFCA is generally higher than that in FC2SFCA. Meanwhile, the spatial distribution of the two models is also different in the city center. Though both models present high spatial accessibility around Teqin_1 and low spatial accessibility around Gulou, for FC2SFCA, the spatial accessibility is different at the boundary of the service coverage but similar within the coverage, which is obviously restricted by the boundary of the service coverage, while the result in E2SFCA is not restricted by the coverage boundary.
The Optimized Hot Spot Analysis in ArcGIS is used to analyze the spatial patterns of fire incidents. The clusters of high spatial accessibility (hot spot) and low spatial accessibility (cold spot) for fire incidents are identified in Figure 7. These spatial clusters further highlight the differences in spatial accessibility to fire incidents between the two models. In the suburbs, the discrete cold spots on the periphery of the service coverage in FC2SFCA are fewer than those in E2SFCA. In the city center, the results of the two methods show marked differences. For FC2SFCA, the boundary between the cold and hot spots is on the northern border of Andemen and Teqin_1. On the north side of the boundary, Fuzimiao, Yixianqiao, and Shimenkan are obviously covered by cold spots; Gulou and Houjiaqiao are also surrounded by cold spots but feature a circle of hot spots gathered around the fire stations. For E2SFCA, the boundary between the cold and hot spots extends to the north up to the northern border of Houjiaqiao and Fuzimiao. As a result, areas such as Houjiaqiao and Fuzimiao are obviously covered by hot spots, the cold spots in Yixianqiao and Shimenkan derease, and Gulou is almost entirely covered by cold spots. Furthermore, in Kaifaqu and Dongshan, the southern area outside of the city center, the cold spots evenly distributed around the two fire stations in E2SFCA are mainly clustered at the border of the coverage area between the two fire stations in FC2SFCA, and a small circle of hot spots is gathered near the fire station in Kaifaqu. In addition, the clustering effect in FC2SFCA is more concentrated, and the spatial distribution of its cold and hot spots is obviously restricted by the boundaries of the service coverage.
The main reason for the obvious difference between the two results in the city center is that the service coverage of the fire stations and the distances between fire stations are generally small, causing the catchment area of the two models to be significantly different. FC2SFCA takes the boundary of the service coverage into account, so its spatial accessibility to fire incidents will not be affected by the surrounding fire stations due to the small service coverage. Conversely, E2SFCA only considers the travel time between the supply and demand, making fire incidents in the city center affected by the surrounding fire stations and fire incidents within other service coverage areas, resulting in higher or lower spatial accessibility. For instance, in E2SFCA, fire incidents in areas such as Fuzimiao are affected by the fire stations in the southwest and show higher spatial accessibility, while those in Gulou are affected by the surrounding cold spots in other service coverages and show lower spatial accessibility. By comparison, FC2SFCA takes the boundary of the service coverage into account to ensure the spatial accessibility of fire incidents will not be affected by other fire stations and fire incidents, which is more in line with the actual fire rescue scenes; thus, more realistic spatial accessibility of fire incidents can be obtained.
Based on the spatial accessibility analysis of fire incidents, there is an obvious spatial imbalance in the spatial accessibility of fire incidents in Nanjing. Spatial accessibility is generally higher around fire stations and in the southwest (such as Teqin_1, Shazhou, etc.) and the northeast outside (such as Teqin_2, Xingang, etc.) of the city center, while the boundary and periphery of the service coverage and the north part of the city center (such as Fangjiaying, Maigaoqiao, Shimenkan, etc.) have lower spatial accessibility. At the same time, the spatial accessibility of the two models is generally similar in the suburbs but obviously different in the city center; especially in the central parts of the city center such as Fuzimiao and Nanhu, the spatial accessibility in FC2SFCA is generally lower and restricted by the boundary of the service coverage, largely because FC2SFCA takes the boundary of the service coverage into account, allowing it to simulate more realistic fire rescue scenes and thus generate more real and accurate spatial accessibility to fire incidents, as well as determine the areas with lower spatial accessibility.

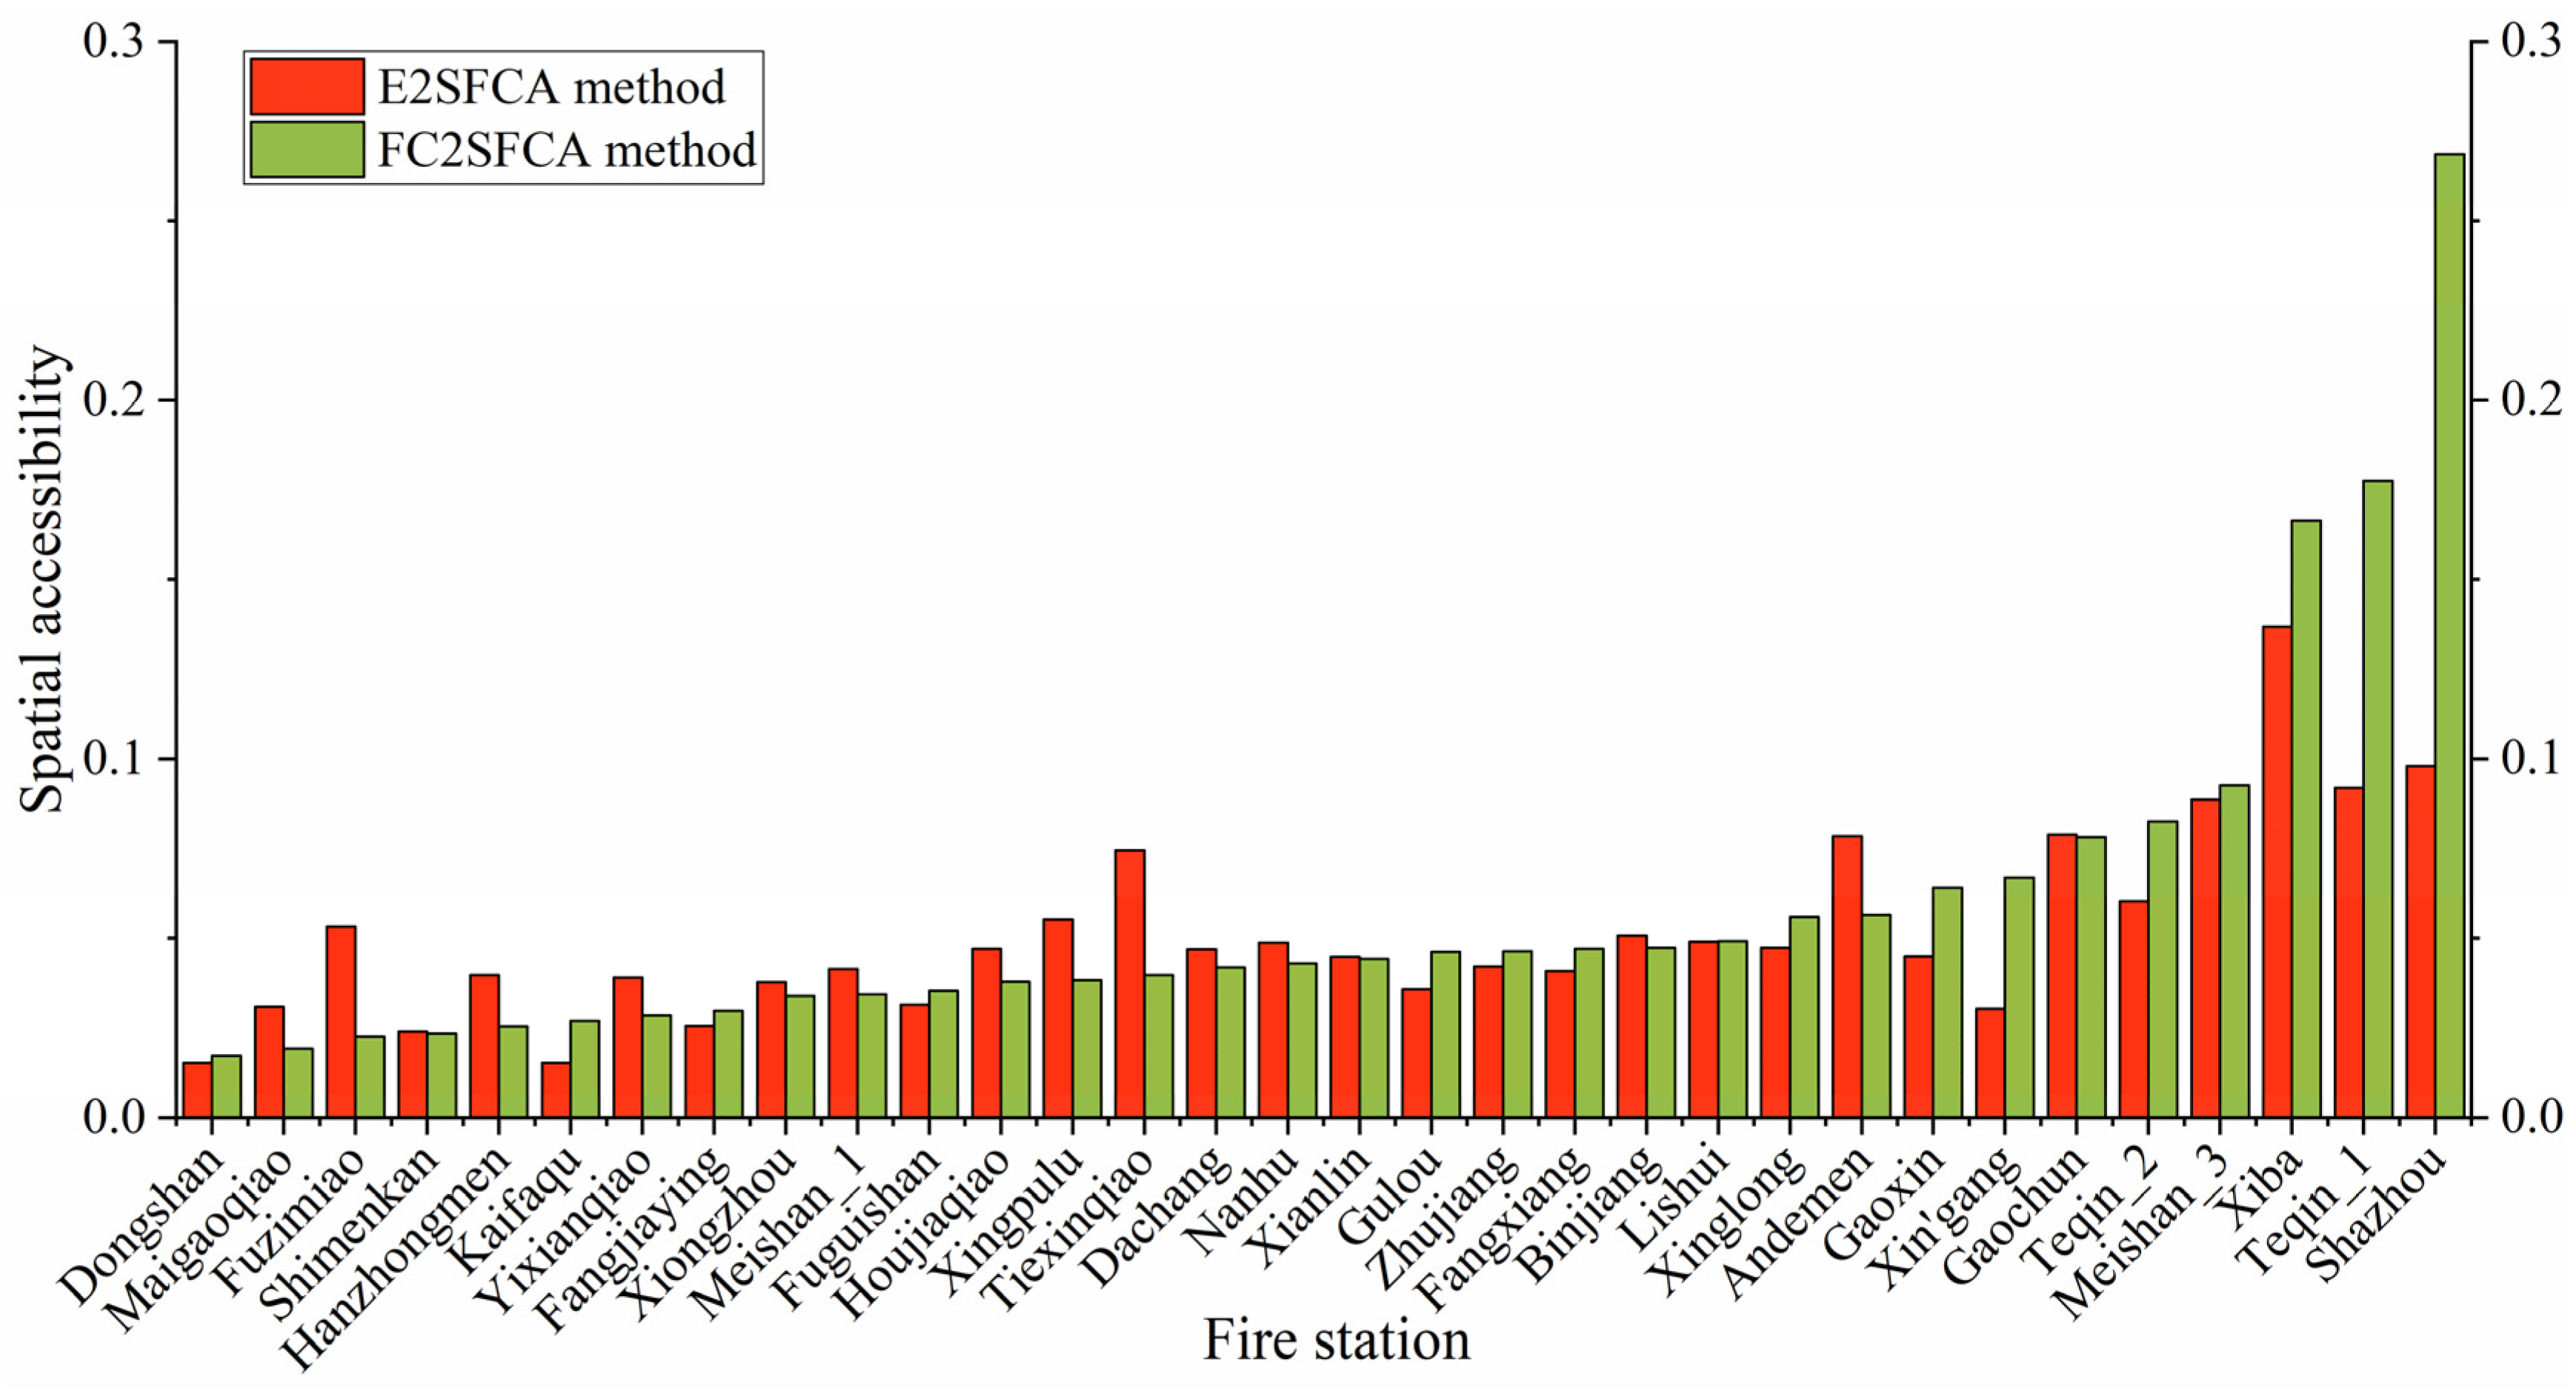
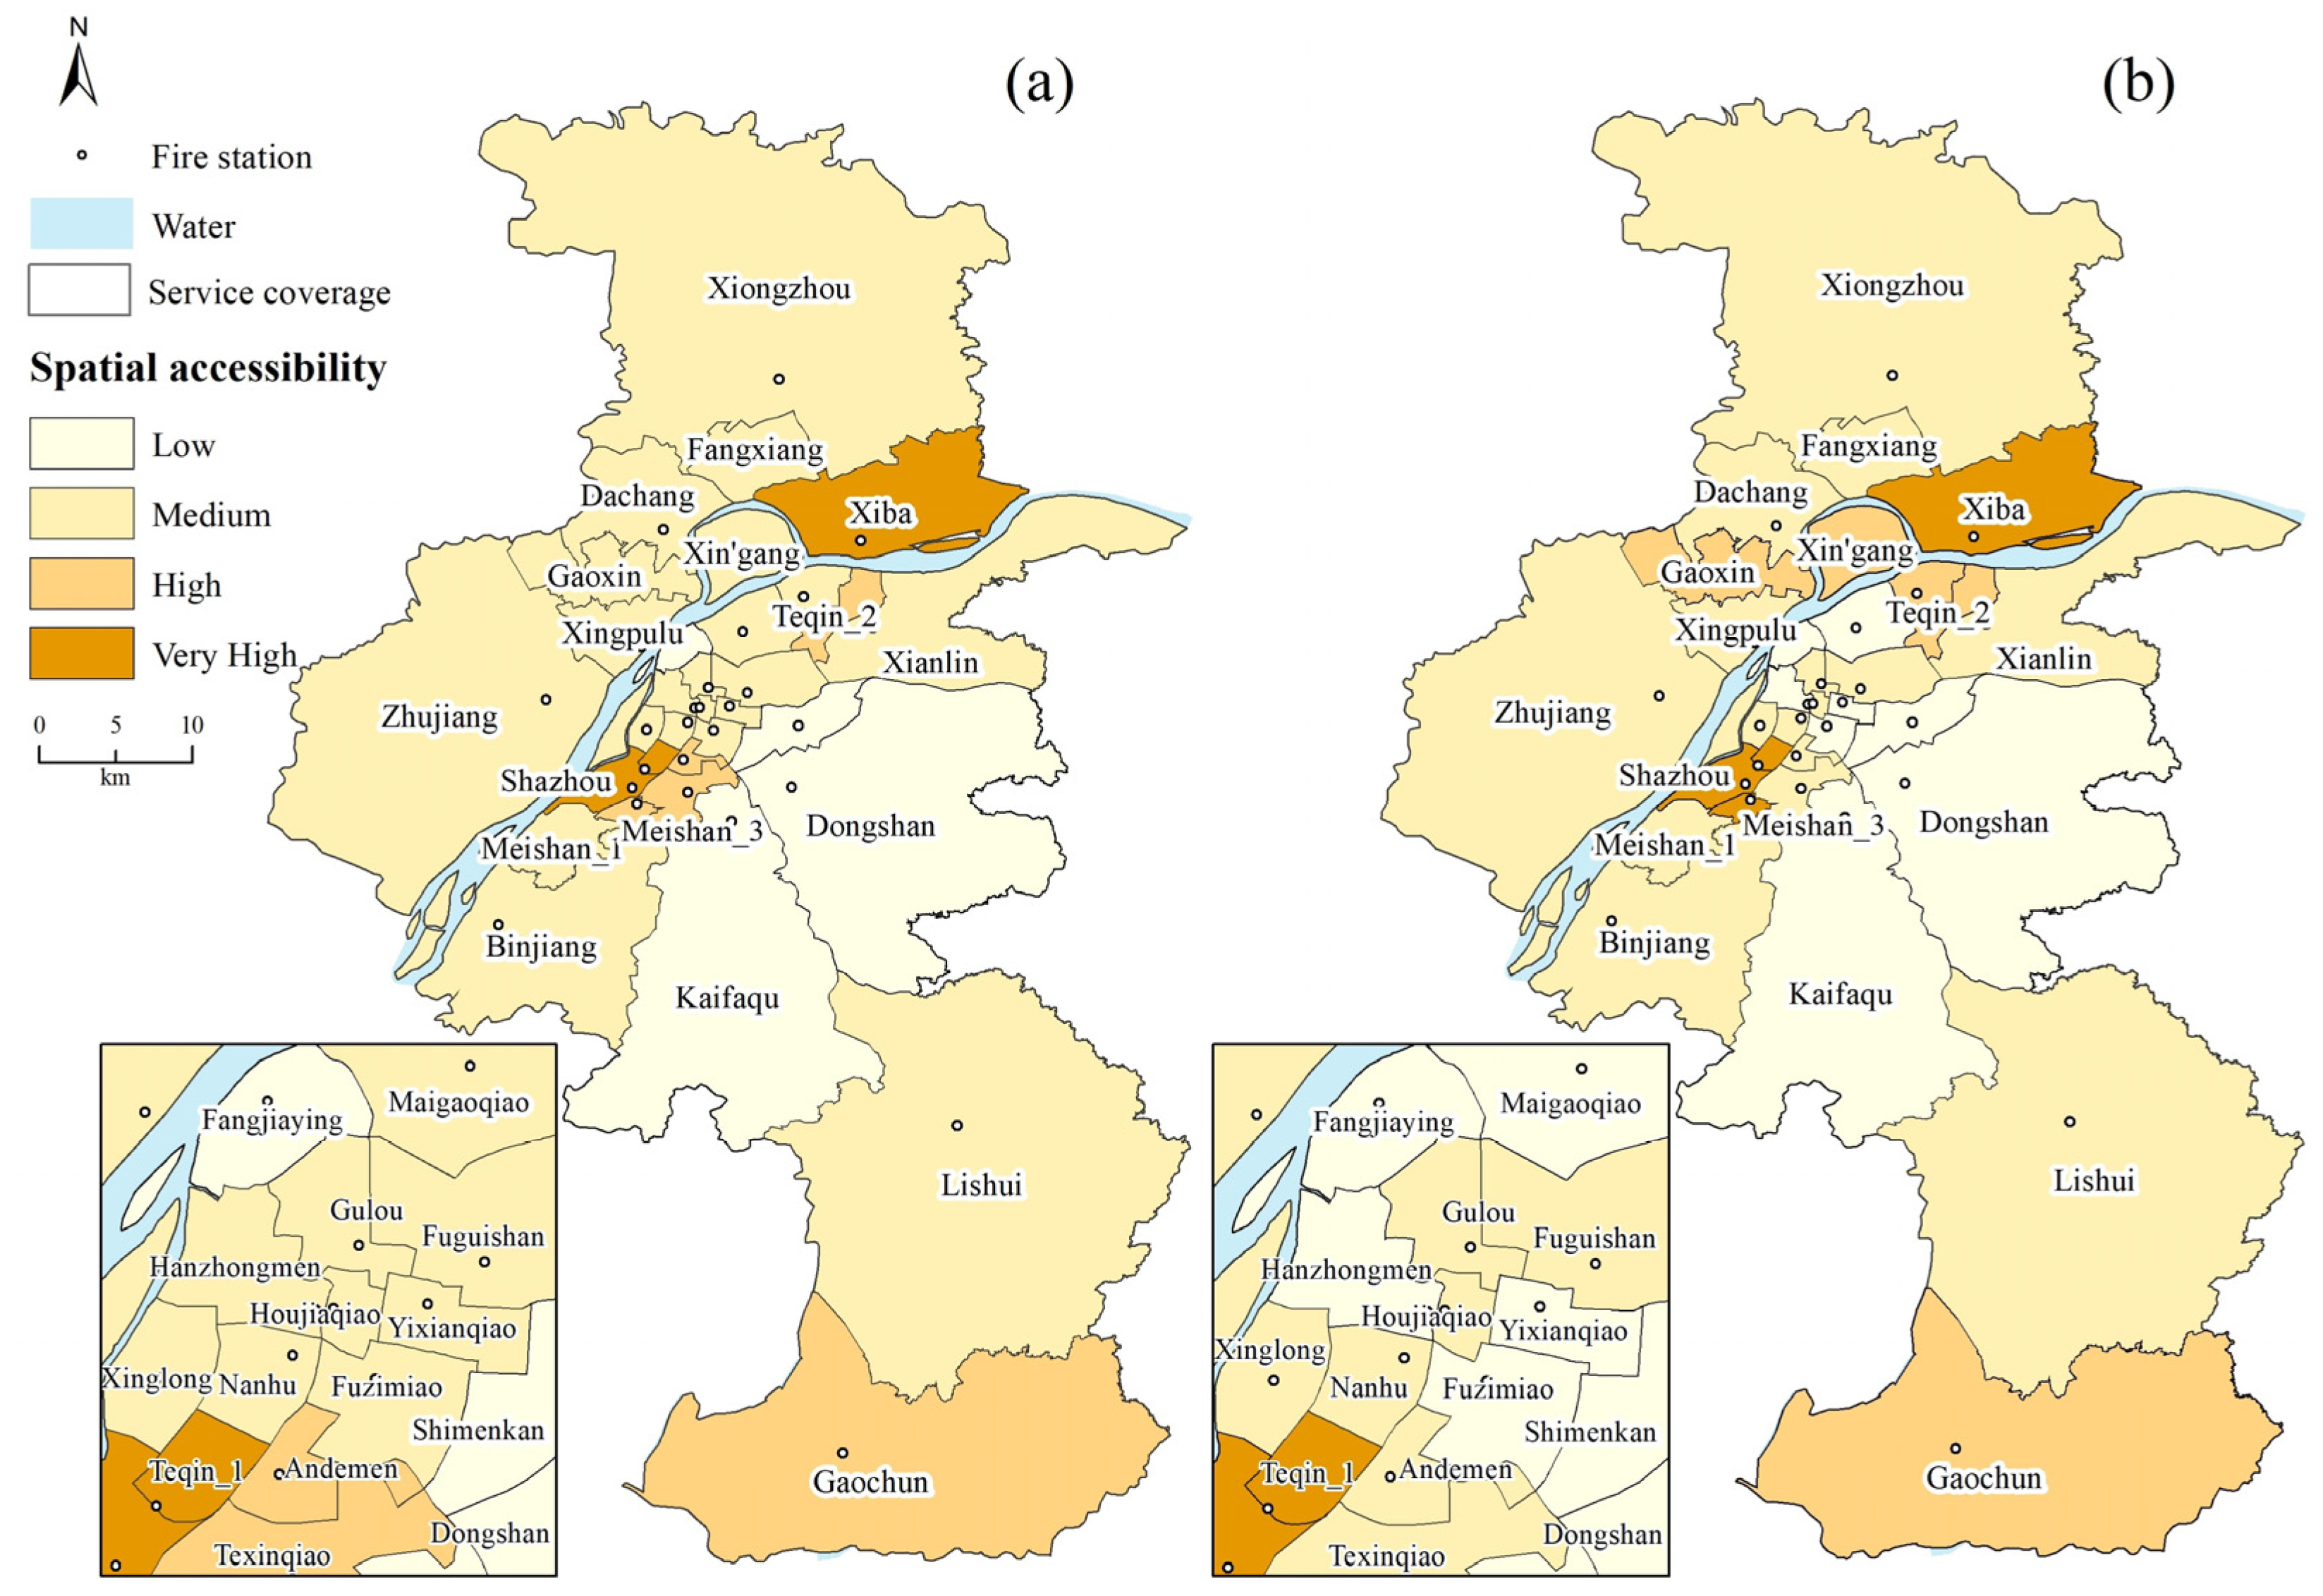
4.2. Spatial Accessibility Analysis of Fire Stations

To further understand the spatial accessibility of fire stations in Nanjing, the average of the spatial accessibility scores of fire incidents within each service coverage was computed and divided into four levels: very high, high, medium, and low (the same as the standard for the spatial accessibility of fire incidents), as shown in Figure 8 and Figure 9. Figure 8 shows the spatial accessibility scores of the two models. It can be seen that there are slight differences between the two results. Compared with the results in E2SFCA, most fire stations in the city center have slightly lower spatial accessibility scores inFC2SFCA, especially Fuzimiao and Tiexinqiao, while Teqin_1 and Shazhou have higher spatial accessibility scores and also have relatively high scores in E2SFCA.
Figure 9 shows the spatial accessibility levels of the fire stations. As can be seen from Figure 9, most fire stations have medium-level spatial accessibility and are mainly located in the suburbs and the central part (in E2SFCA) of the city center. Fire stations with low-level spatial accessibility are concentrated in the central (in FC2SFCA) and southern outside parts of the city center, such as Fangjiaying, Shimenkan, Kaifaqu, and Dongshan, etc., while fire stations with high-level and very-high-level spatial accessibility are mainly concentrated in the southwest (such as Teqin_1, Shazhou, etc.) and northeast outside (such as Teqin_2, Xiba, etc.) of the city center. The overall situation is largely consistent with that for fire incidents. The difference between the two methods is also largely reflected in the city center. Compared with E2SFCA, FC2SFCA reveals more fire stations with lower spatial accessibility in the central part of the city center, such as Fuzimiao, Yixianqiao, Houjiaqiao, etc.

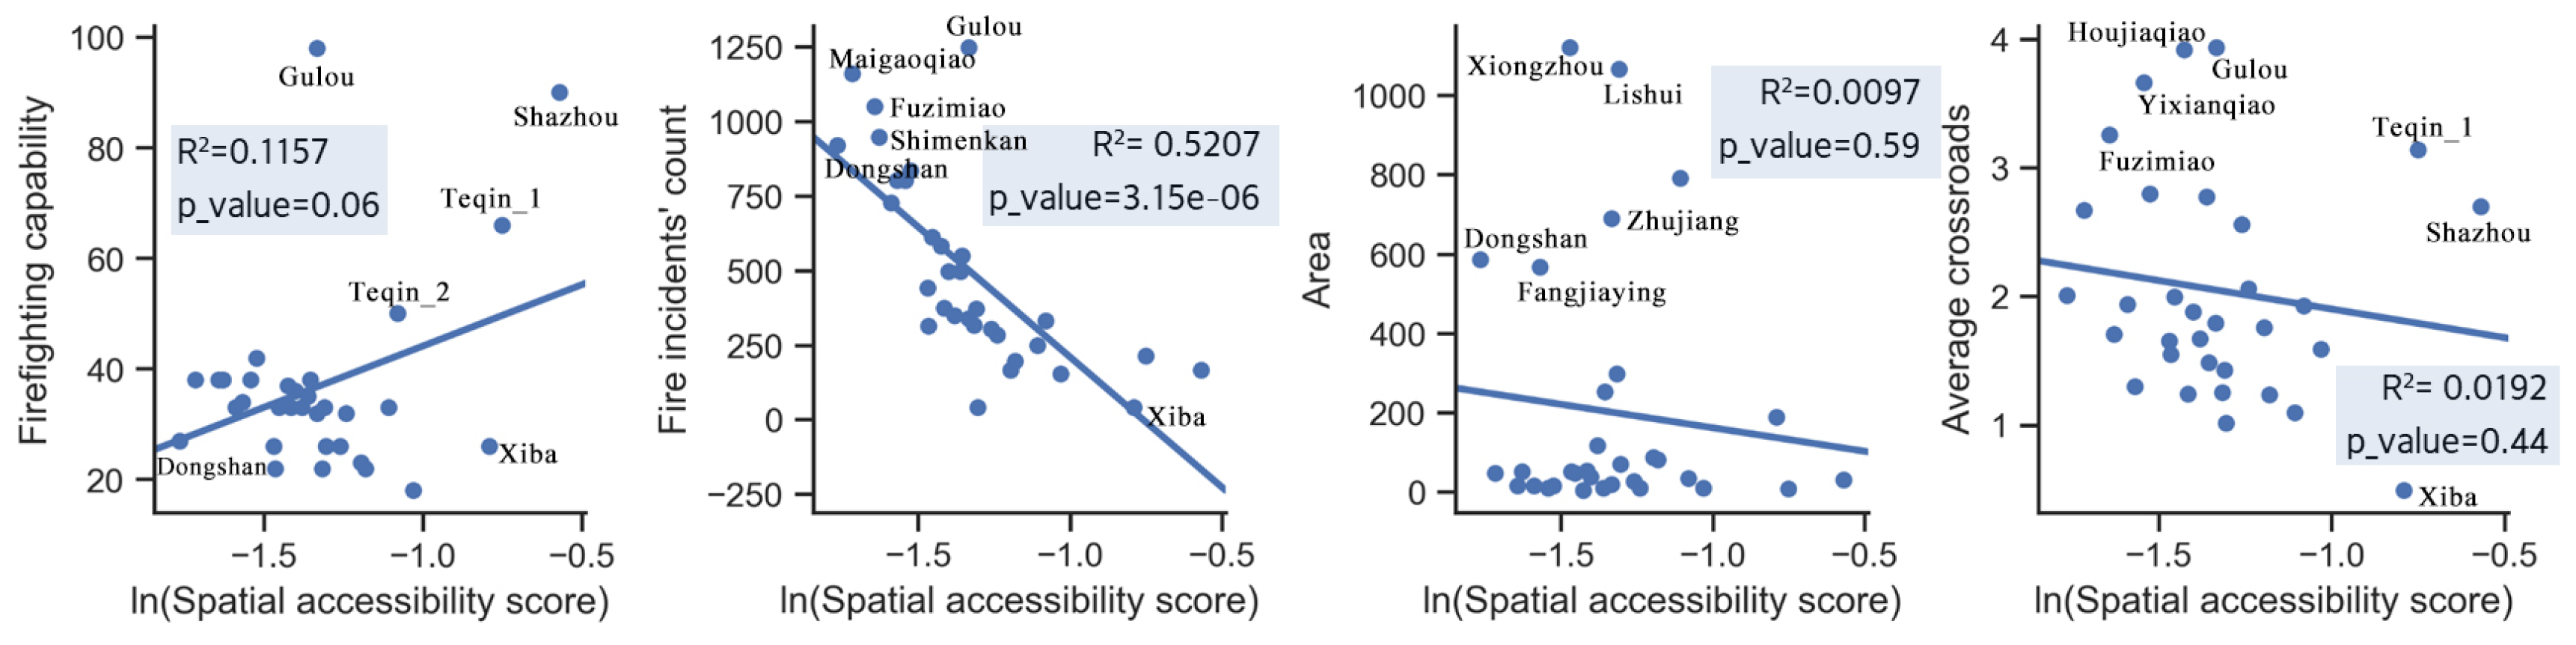
4.3. Impact Factors of Spatial Accessibility

The spatial accessibility of fire stations in Nanjing was measured and analyzed above. The impact factors that may affect the spatial accessibility of fire stations are analyzed in this part. The firefighting capability and number of fire incidents of each fire station directly affect the spatial accessibility of fire incidents. There is also a certain correlation with the spatial accessibility of fire stations. At the same time, the attributes of the fire station, such as the area of the station’s service coverage and the average number of crossroads (per kilometer), may also affect the station’s spatial accessibility. Therefore, this part analyzes the correlation between the logarithm of the spatial accessibility score by FC2SFCA and the firefighting capability, the number of fire incidents, the area of the service coverage, and the average number of crossroads (per kilometer) for fire stations, as shown in Figure 10. It can be seen from Figure 10 that there is a relatively strong negative correlation between the spatial accessibility and the number of fire incidents, indicating that an excessive number of fire incidents is one of the most important reasons for the reduction of spatial accessibility of fire stations. The overall correlation between the spatial accessibility and firefighting capability, the area of the service coverage, and the average number of crossroads (per kilometer) is not obvious. Considering the specific situation of fire stations in the study area, the fire stations in the southwestern and northeast outside areas of the city center (such as Teqin_1, Shazhou, and Teqin_2) may have higher spatial accessibility because they have stronger firefighting capability than others. Fire stations in the central part of the city center (such as Fuzimiao and Gulou) have lower spatial accessibility mainly due to the large number of fire incidents and crossroads within the service coverage area. Xiba has higher spatial accessibility due to its obviously fewer fire incidents and small number of crossroads. Fire stations in the southern outside parts of the city center (such as Shimenkan, Dongshan, and Kaifaqu) have lower spatial accessibility for three main reasons. One is that their firefighting capability is obviously weaker than that of others, the second is that fire incidents occur frequently in the area, and the third is that the service coverage is larger compared to that in the city center, which affects the spatial accessibility of fire stations to some extent.
The attribution analysis of the spatial accessibility of fire incidents and fire stations aims to investigate the main factors that lead to regional differences in spatial accessibility and then provide effective reference suggestions for fire agencies to optimize the allocation of fire resources and improve the regional spatial accessibility to fire services. Through a discussion of the above factors, it can be found that an excessive number of fire incidents is the primary reason for the low accessibility of fire stations. The firefighting capability, the area of the service coverage, and the average number of crossroads (per kilometer) also affect, to a certain extent, the spatial accessibility of some fire stations. In addition, it is worth noting that the fire stations located in the southern outside parts of the city center, such as Dongshan, have witnessed a rapid increase in population and industry over the past decade, resulting in frequent fire incidents. However, the firefighting capabilities in these areas have not been effectively strengthened, which is likely to aggravate the economic and property losses caused by fires.

5. Discussion

5.1. Impact of the Historical Fire Data on Fire Service Accessibility

This study used the historical fire incidents and the dispatched fire engines of each fire incident for 2012, 2013, and 2015 to measure the spatial accessibility of fire services in Nanjing, China. Although the historical fire data are from a few years ago, these 3-year fire data can effectively present the spatial distribution of fire incidents. Future fire incidents are difficult to predict, but the spatial distribution of historical fire data can be regarded as an effective proxy for determining fire risk in Nanjing, China. At the same time, historical fire incidents, as the demand, provide more details (e.g., fire locations and fire engines) than the demographical data (most are also historical data) of residential areas used in previous studies [6,8]. Furthermore, Nanjing is a famous ancient city in China, with well-preserved buildings alongside a high standard of urbanization. As early as 2012, the rate of urbanization exceeded 80%, and the overall urbanization rate changed slightly from 2012 (80.23%) to 2019 (83.20%) (http://tj.jiangsu.gov.cn). As an ancient city, Nanjing’s road network remains nearly unchanged in the urban center but changed slightly in the suburbs from 2012 to 2020. In addition, historical fire incidents can be regarded as a current or future proxy of fire risk, and the travel time obtained from online map APIs can also be adapted to calculate the current or future travel impedance. Therefore, these three years of historical fire incidents are an effective proxy for measuring the fire service accessibility of current or future fires in Nanjing.

5.2. Comparison of the Results with Other Studies

Kc, Corcoran, and Chhetri [6] employed the E2SFCA method to compute the spatial accessibility of the population to fire stations. Min, Kim, and Lee [8] measured the spatial accessibility to fire stations at the census block group level. Xia, Li, Chen, and Yu [7] proposed an optimized 2SFCA method in the central part of Nanjing, China, which takes the number of dwellers in a residential location as the demand to measure the fire service spatial accessibility in each residential area. Those studies take the centroid of the residential area as the demand location, which cannot show the detailed spatial accessibility within the demographic area. Moreover, the population size in each residential area is taken as the demand size, which is less realistic for fires. In contrast, our study used the number of fire engines dispatched during each fire incident as the “real” fire service demand size, rather than the population-based demand, to obtain a more realistic distribution of spatial accessibility, and applied the location of historical fire incidents as the demand location to measure the spatial accessibility of each fire incident instead of each residential area, so as to provide more accurate and detailed accessibility distribution data of fire incidents at finer spatial scales.

5.3. Limitation of the Proposed FC2SFCA Method

Although the proposed FC2SFCA method has powerful advantages that make it better suited to measure the spatial accessibility to fire incidents, certain limitations still remain. This study assumes that each fire incident was supported by only one fire service without considering rare large fire incidents that use multiple fire services to support; in this case, the restriction of a catchment area to non-overlapping areas may not be useful. However, such situations are very rare in historical fire records and have little impact on the results based on the huge amount of fire data.

6. Conclusions

Measuring the spatial accessibility of urban fire incidents and fire stations is an important task to improve fire service and reduce the injuries and deaths caused by fires. This paper proposed an FC2SFCA method that makes full use of the service coverage of fire stations and historical fire data (e.g., the locations and fire engines used for fire incidents) to measure the spatial accessibility of fire incidents and fire stations in Nanjing, China. The spatial differences and main influencing factors of spatial accessibility were further analyzed. The main conclusions are as follows:
(1) The spatial accessibility of fire incidents and fire stations across Nanjing is unbalanced. For fire incidents, the spatial accessibility in the areas around several fire stations and the southwest and northeast areas outside of the city center is relatively high, while that at the periphery and boundary of service coverage and at the core of the city center is relatively low. For fire stations, the overall situation is basically consistent with the spatial accessibility of fire incidents; the spatial accessibility for Shazhou, Teqin_1, and Xiba is the highest, while that for Dongshan, Kaifaqu, and some fire stations in the city center is the lowest.
(2) The spatial accessibility between the proposed FC2SFCA and E2SFCA methods has a few differences in suburbs, while the differences are more evident in the city center. Compared with E2SFCA, FC2SFCA has lower spatial accessibility in the city center, and its spatial accessibility of fire incidents is obviously restricted by the boundary of the service coverage. FC2SFCA is less influenced by other fire stations and fire incidents and provides greater actual fire service accessibility than E2SFCA. In this way, areas and fire stations with lower spatial accessibility can be identified more accurately, thereby providing decision-making support for fire agencies to take targeted measures to improve fire services.
(3) The number of fire incidents is the largest impact factor on the spatial accessibility of fire stations. The firefighting capability, the area of service coverage, and the average number of crossroads (per kilometer) also affect the spatial accessibility of some fire stations. The high spatial accessibility in the southwest and northeast outside of the city is mainly due to the strong capacity of fire stations in the area, while the low spatial accessibility in the center of the city is due to a large number of fire incidents. In addition, the main influencing factors for the low spatial accessibility at the southern area outside of the city center are the poor capacity of the fire stations, the area’s frequent fire incidents, and the large area of service coverage, which should be given greater attention.
In practice, the following suggestions are proposed for fire services agencies in Nanjing to improve their fire services in the future. First, fire service agencies should optimize their fire resource allocations. The fire stations with relatively weak fire service capacities need to be strengthened, such as Fangjiaying and Dongshan. Meanwhile, fire stations in the city center, such as Maigaoqiao, Fuzimiao, and Shimenkan, also need to enhance their firefighting capabilities because of their highly aggregated populations, frequent fire incidents, and obsolete urban facilities. Second, some fire stations in the suburbs should be given more attention, and measures such as adding new fire stations and modifying the boundaries of service coverage need to be taken because the service coverage area of fire stations is uneven in Nanjing (small in the city center but too large in the suburbs), and the locations of some fire stations (such as Dongshan, Kaifaqu, and Xingpulu) are too close to the boundary of service coverage, which results in time delays and low spatial accessibility.
In general, this study measured the spatial accessibility of fire services in Nanjing, China and put forward some important suggestions for fire agencies to optimize and improve the spatial allocation of their fire resources. Moreover, this proposed FC2SFCA method can be applied as an important reference to measure the spatial accessibility of fire services in other cities and countries. In the future, there are two issues that need to be further addressed. First, some factors that may affect spatial accessibility were discussed in Section 4.3, but the urban environment is complex, and its influencing factors are diverse. Therefore, greater analysis needs to be done by combining this model with social and economic data to identify the potential factors that can influence spatial accessibility. Second, the analysis of spatial accessibility of fire incidents and fire stations represents a new idea for optimizing fire resources. In the future, the optimal layout of fire stations and resources should be further studied based on spatial accessibility.

Author Contributions

Yuehong Chen conceived and designed the research. Kainan Mao, Yuehong Chen and Junwang Huang analyzed the experimental results and wrote the paper. Guohao Wu, Wanying Yang and Zelong Xia performed the experiments. All authors have read and agreed to the published version of the manuscript.

Funding

This research was funded in part by the National Key R&D Program of China [No. 2019YFC1510601], in part by the Fundamental Research Funds for the Central Universities [No. 2019B00314], in part by the Strategic Priority Research Program of Chinese Academy of Sciences [No. XDA 20030302], and in part by the National Natural Science Foundation of China [No. 42071315].

Acknowledgments

We are grateful to the Nanjing Fire Department, China, for providing the historical fire incident data.

Conflicts of Interest

The authors declare no conflict of interest.

References

  1. Ceyhan, E.; Ertuğay, K.; Düzgün, Ş. Exploratory and inferential methods for spatio-temporal analysis of residential fire clustering in urban areas. Fire Saf. J. 2013, 58, 226–239. [Google Scholar]
  2. Kc, K.; Corcoran, J. Modelling residential fire incident response times: A spatial analytic approach. Appl. Geogr. 2017, 84, 64–74. [Google Scholar] [CrossRef]
  3. Xia, Z.; Li, H.; Chen, Y. An integrated spatial clustering analysis method for identifying urban fire risk locations in a network-constrained environment: A case study in nanjing, china. ISPRS Int. J. Geo-Inf. 2017, 6, 370. [Google Scholar]
  4. Challands, N. The relationships between fire service response time and fire outcomes. Fire Technol. 2009, 46, 665–676. [Google Scholar] [CrossRef]
  5. Shahparvari, S.; Fadaki, M.; Chhetri, P. Spatial accessibility of fire stations for enhancing operational response in melbourne. Fire Saf. J. 2020, 103149. [Google Scholar]
  6. Kc, K.; Corcoran, J.; Chhetri, P. Measuring the spatial accessibility to fire stations using enhanced floating catchment method. Socio-Econ. Plan. Sci. 2020, 69, 100673. [Google Scholar] [CrossRef]
  7. Xia, Z.; Li, H.; Chen, Y.; Yu, W. Integrating spatial and non-spatial dimensions to measure urban fire service access. ISPRS Int. J. Geo-Inf. 2019, 8, 138. [Google Scholar]
  8. Min, S.; Kim, D.; Lee, C.K. Association between spatial accessibility to fire protection services and unintentional residential fire injuries or deaths: A cross-sectional study in Dallas, Texas. BMJ Open 2019, 9, e023780. [Google Scholar]
  9. Hashtarkhani, S.; Kiani, B.; Bergquist, R.; Bagheri, N.; VafaeiNejad, R.; Tara, M. An age-integrated approach to improve measurement of potential spatial accessibility to emergency medical services for urban areas. Int. J. Health Plan. Manag. 2020, 35, 788–798. [Google Scholar]
  10. Khan, A.A. An integrated approach to measuring potential spatial access to health care services. Socio-Econ. Plan. Sci. 1992, 26, 275–287. [Google Scholar] [CrossRef]
  11. Penchansky, R.; Thomas, J.W. The concept of access: Definition and relationship to consumer satisfaction. Med. Care 1981, 19, 127–140. [Google Scholar] [CrossRef] [PubMed]
  12. Wang, F. Job proximity and accessibility for workers of various wage groups. Urban Geogr. 2003, 24, 253–271. [Google Scholar]
  13. Luo, W. Using a GIS-based floating catchment method to assess areas with shortage of physicians. Health Place 2004, 10, 1–11. [Google Scholar] [PubMed]
  14. Joseph, L.; Kuby, M. Gravity modeling and its impacts on location analysis. In Foundations of Location Analysis; Eiselt, H.A., Marianov, V., Eds.; Springer: New York, NY, USA, 2011; pp. 423–443. [Google Scholar]
  15. Dai, T.-Q.; Liu, Z.-B.; Liao, C.; Cai, H.-Y. Incorporating job diversity preference into measuring job accessibility. Cities 2018, 78, 108–115. [Google Scholar] [CrossRef]
  16. McGrail, M.R.; Humphreys, J.S. Measuring spatial accessibility to primary health care services: Utilising dynamic catchment sizes. Appl. Geogr. 2014, 54, 182–188. [Google Scholar]
  17. Dai, D. Racial/ethnic and socioeconomic disparities in urban green space accessibility: Where to intervene? Landsc. Urban Plan. 2011, 102, 234–244. [Google Scholar]
  18. Radke, J.; Mu, L. Spatial decompositions, modeling and mapping service regions to predict access to social programs. Ann. GIS 2000, 6, 105–112. [Google Scholar] [CrossRef]
  19. Luo, W.; Qi, Y. An enhanced two-step floating catchment area (E2SFCA) method for measuring spatial accessibility to primary care physicians. Health Place 2009, 15, 1100–1107. [Google Scholar] [CrossRef]
  20. Zhuolin Tao, Y.C. Research progress of the two-step floating catchment area method and extensions. Prog. Geogr. 2016, 35, 589–599. [Google Scholar]
  21. Luo, W.; Whippo, T. Variable catchment sizes for the two-step floating catchment area (2sfca) method. Health Place 2012, 18, 789–795. [Google Scholar] [PubMed]
  22. Wan, N.; Zou, B.; Sternberg, T. A three-step floating catchment area method for analyzing spatial access to health services. Int. J. Geogr. Inf. Sci. 2012, 26, 1073–1089. [Google Scholar] [CrossRef]
  23. Fransen, K.; Neutens, T.; De Maeyer, P.; Deruyter, G. A commuter-based two-step floating catchment area method for measuring spatial accessibility of daycare centers. Health Place 2015, 32, 65–73. [Google Scholar] [CrossRef]
  24. Langford, M.; Higgs, G.; Fry, R. Multi-modal two-step floating catchment area analysis of primary health care accessibility. Health Place 2016, 38, 70–81. [Google Scholar] [CrossRef]
  25. Zhu, L.; Zhong, S.; Tu, W.; Zheng, J.; He, S.; Bao, J.; Huang, C. Assessing spatial accessibility to medical resources at the community level in Shenzhen, China. Int. J. Environ. Res. Public Health 2019, 16, 242. [Google Scholar] [CrossRef] [Green Version]
  26. Wang, F.; Luo, W. Assessing spatial and nonspatial factors for healthcare access: Towards an integrated approach to defining health professional shortage areas. Health Place 2005, 11, 131–146. [Google Scholar] [CrossRef]
  27. Polzin, P.; Borges, J.; Coelho, A. An extended kernel density two-step floating catchment area method to analyze access to health care. Environ. Plan. B Plan. Des. 2014, 41, 717–735. [Google Scholar] [CrossRef]
  28. Gu, W.; Wang, X.; McGregor, S.E. Optimization of preventive health care facility locations. Int. J. Health Geogr. 2010, 9, 17. [Google Scholar] [CrossRef] [Green Version]
  29. Wang, F. Measurement, optimization, and impact of health care accessibility: A methodological review. Ann. Assoc. Am. Geogr. 2012, 102, 1104–1112. [Google Scholar] [CrossRef] [PubMed] [Green Version]
  30. Xing, L.; Liu, Y.; Wang, B.; Wang, Y.; Liu, H. An environmental justice study on spatial access to parks for youth by using an improved 2sfca method in Wuhan, China. Cities 2020, 96, 102405. [Google Scholar] [CrossRef]
  31. Wu, H.; Liu, L.; Yu, Y.; Peng, Z. Evaluation and planning of urban green space distribution based on mobile phone data and two-step floating catchment area method. Sustainability 2018, 10, 214. [Google Scholar] [CrossRef] [Green Version]
  32. Chen, X. Enhancing the two-step floating catchment area model for community food access mapping: Case of the supplemental nutrition assistance program. Prof. Geogr. 2019, 71, 668–680. [Google Scholar] [CrossRef]
  33. Dai, D.; Wang, F. Geographic disparities in accessibility to food stores in southwest Mississippi. Environ. Plan. B Plan. Des. 2011, 38, 659–677. [Google Scholar] [CrossRef]
  34. Zhu, X.; Tong, Z.; Liu, X.; Li, X.; Lin, P.; Wang, T. An improved two-step floating catchment area method for evaluating spatial accessibility to urban emergency shelters. Sustainability 2018, 10, 2180. [Google Scholar] [CrossRef] [Green Version]
  35. Liu, D.; Xu, Z.; Wang, Z.; Zhou, Y.; Fan, C. Estimation of effective coverage rate of fire station services based on real-time travel times. Fire Saf. J. 2020, 103021. [Google Scholar] [CrossRef]
  36. Xia, Z.; Li, H.; Chen, Y.; Yu, W. Detecting urban fire high-risk regions using colocation pattern measures. Sustain. Cities Soc. 2019, 49, 101607. [Google Scholar] [CrossRef]
  37. Yu, W.; Chen, Y.; Chen, Z.; Xia, Z.; Zhou, Q. Service area delimitation of fire stations with fire risk analysis: Implementation and case study. Int. J. Environ. Res. Public Health 2020, 17, 2030. [Google Scholar] [CrossRef] [Green Version]
  38. Bryant, J., Jr.; Delamater, P.L. Examination of spatial accessibility at micro-and macro-levels using the enhanced two-step floating catchment area (E2SFCA) method. Ann. GIS 2019, 25, 219–229. [Google Scholar] [CrossRef] [Green Version]
  39. Page, N.; Langford, M.; Higgs, G. Measuring spatial accessibility to services within indices of multiple deprivation: Implications of applying an enhanced two-step floating catchment area (E2SFCA) approach. Appl. Spat. Anal. Policy 2019, 12, 321–348. [Google Scholar] [CrossRef]
  40. Vadrevu, L.; Kanjilal, B. Measuring spatial equity and access to maternal health services using enhanced two step floating catchment area method (E2SFCA)—A case study of the indian sundarbans. Int. J. Equity Health 2016, 15, 87. [Google Scholar] [CrossRef] [Green Version]
  41. Wan, N.; Zhan, F.B.; Zou, B.; Chow, E. A relative spatial access assessment approach for analyzing potential spatial access to colorectal cancer services in texas. Appl. Geogr. 2012, 32, 291–299. [Google Scholar] [CrossRef]
  42. McGrail, M.R. Spatial accessibility of primary health care utilising the two step floating catchment area method: An assessment of recent improvements. Int. J. Health Geogr. 2012, 11, 50. [Google Scholar] [CrossRef] [PubMed] [Green Version]
  43. Ni, J.; Wang, J.; Rui, Y.; Qian, T.; Wang, J. An enhanced variable two-step floating catchment area method for measuring spatial accessibility to residential care facilities in Nanjing. Int. J. Environ. Res. Public Health 2015, 12, 14490–14504. [Google Scholar] [CrossRef] [Green Version]
  44. Tao, Z.; Cheng, Y.; Dai, T.; Rosenberg, M.W. Spatial optimization of residential care facility locations in Beijing, China: Maximum equity in accessibility. Int. J. Health Geogr. 2014, 13, 33. [Google Scholar] [CrossRef] [PubMed] [Green Version]
  45. Tao, Z.; Cheng, Y. Modelling the spatial accessibility of the elderly to healthcare services in Beijing, China. Environ. Plan. B Urban Anal. City Sci. 2019, 46, 1132–1147. [Google Scholar] [CrossRef]
  46. Tao, Z.; Yao, Z.; Kong, H.; Duan, F.; Li, G. Spatial accessibility to healthcare services in shenzhen, china: Improving the multi-modal two-step floating catchment area method by estimating travel time via online map APIS. BMC Health Serv. Res. 2018, 18, 345. [Google Scholar] [CrossRef] [Green Version]
  47. Cheng, G.; Zeng, X.; Duan, L.; Lu, X.; Sun, H.; Jiang, T.; Li, Y. Spatial difference analysis for accessibility to high level hospitals based on travel time in shenzhen, china. Habitat Int. 2016, 53, 485–494. [Google Scholar] [CrossRef] [Green Version]
  48. Wang, F.; Xu, Y. Estimating o–d travel time matrix by google maps API: Implementation, advantages, and implications. Ann. GIS 2011, 17, 199–209. [Google Scholar] [CrossRef]
  49. Niu, Q.; Wang, Y.; Xia, Y.; Wu, H.; Tang, X. Detailed assessment of the spatial distribution of urban parks according to day and travel mode based on web mapping API: A case study of main parks in Wuhan. Int. J. Environ. Res. Public Health 2018, 15, 1725. [Google Scholar] [CrossRef] [PubMed] [Green Version]
  50. Li, L.; Du, Q.; Ren, F.; Ma, X. Assessing spatial accessibility to hierarchical urban parks by multi-types of travel distance in Shenzhen, China. Int. J. Environ. Res Public Health 2019, 16, 1038. [Google Scholar] [CrossRef] [PubMed] [Green Version]
  51. Standards for the Construction of Urban Fire Stations. Available online: http://www.mohurd.gov.cn/wjfb/201710/W020171017021316.pdf (accessed on 11 April 2020).
  52. Kwan, M.-P. Space-time and integral measures of individual accessibility: A comparative analysis using a point-based framework. Geogr. Anal. 1998, 30, 191–216. [Google Scholar] [CrossRef]
  53. Kanuganti, S.; Sarkar, A.K.; Singh, A.P. Evaluation of access to health care in rural areas using enhanced two-step floating catchment area (E2SFCA) method. J. Transp. Geogr. 2016, 56, 45–52. [Google Scholar] [CrossRef]
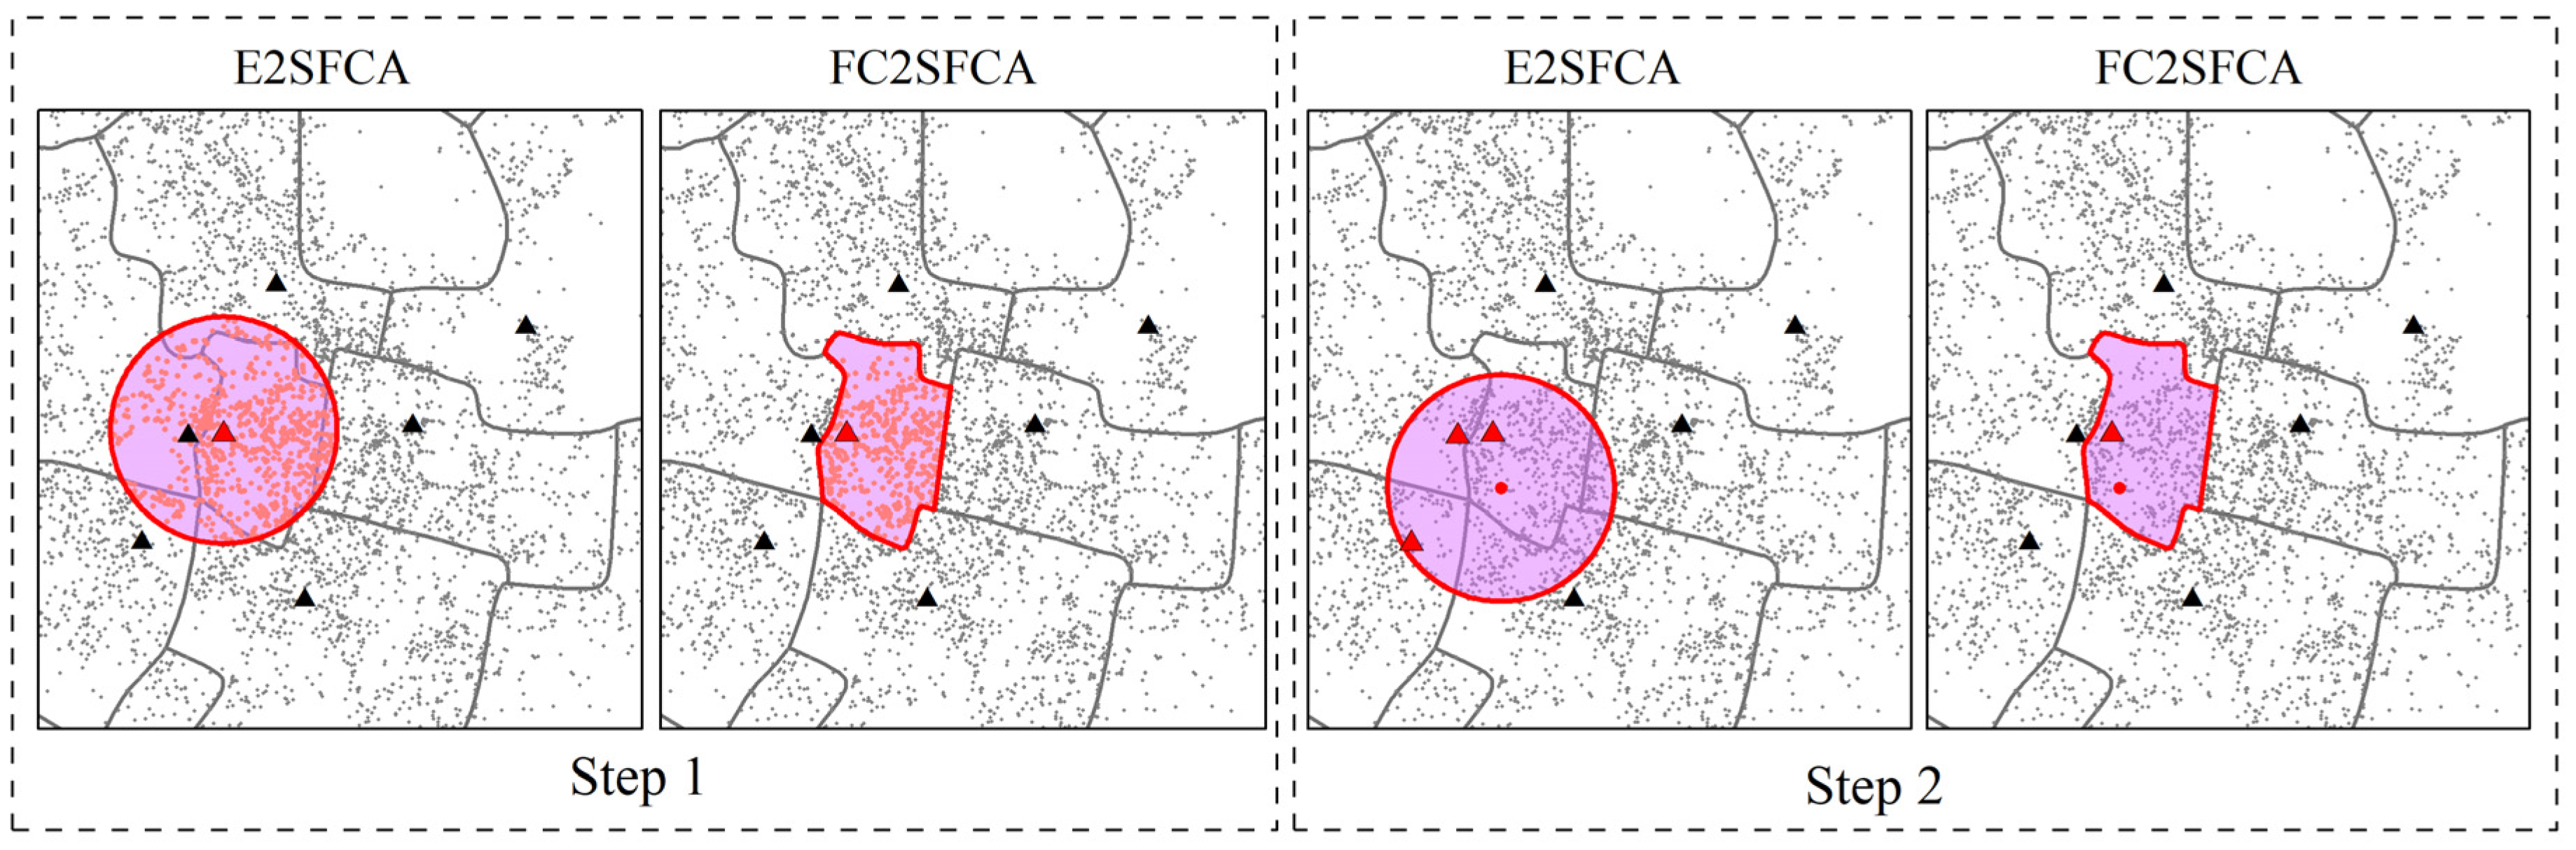
Figure 1. The spatial distribution of (a) the service coverage of fire stations and (b) historical fire incidents in Nanjing, China.
Ijgi 09 00585 g001
Figure 2. Histogram of the firefighters and fire engines in each fire station.
Ijgi 09 00585 g002
Figure 3. Flowchart of the proposed fixed-coverage-based two-step floating catchment area (FC2SFCA) method.
Ijgi 09 00585 g003
Figure 4. Comparison of E2SFCA and FC2SFCA for generating the catchment area.
Ijgi 09 00585 g004
Figure 5. The probability density distribution histogram of the spatial accessibility score of fire incidents.
Ijgi 09 00585 g005
Figure 6. The spatial accessibility of fire incidents using (a) E2SFCA and (b) FC2SFCA. (c) city center of (a), (d) city center of (b).
Ijgi 09 00585 g006
Figure 7. Optimized Hot Spot Analysis of spatial accessibility of fire incidents using (a) E2SFCA, (b) FC2SFCA.
Ijgi 09 00585 g007
Figure 8. The spatial accessibility of fire stations.
Ijgi 09 00585 g008
Figure 9. The spatial accessibility levels of fire stations using (a) E2SFCA, and (b) FC2SFCA.
Ijgi 09 00585 g009
Figure 10. The correlation between the spatial accessibility score (logarithm) and the firefighting capability, the fire incidents’ count, the area, the average crossroads.
Ijgi 09 00585 g010
Table 1. Comparison of enhanced two-step floating catchment area (E2SFCA) and FC2SFCA for measuring the accessibility of fire incidents.
E2SFCAFC2SFCA
Difference in Step 1For each fire station j , sum up demands D i by travel impedance ω i j within its catchment area (i.e., a circle with the center of fire station j ), and compute the supply to demand ratio R j : R j = S j i ϵ { t i j t 0 } D i ω i j For each fire station j , sum up demands D i by travel impedance ω i j within its service coverage area, and compute the supply to demand ratio
R j : R j = S j i ϵ { t i j t 0 } D i ω i j
Difference in Step 2For each fire incident i , sum up ratios R j by travel impedance ω i j across all supply locations j within the catchment area (i.e., a circle with the center of fire incident i ) to obtain the accessibility A i at fire incident i : A i = j ϵ { t i j t 0 } R j ω i j For each fire incident i , calculate the accessibility A i by the product of ratio R j and travel impedance ω i j from the fire station j which corresponds to the fire incident i : A i = R j ω i j
SimilarityThe calculation of travel impedance ω i j uses the same hybrid travel time zone scheme.
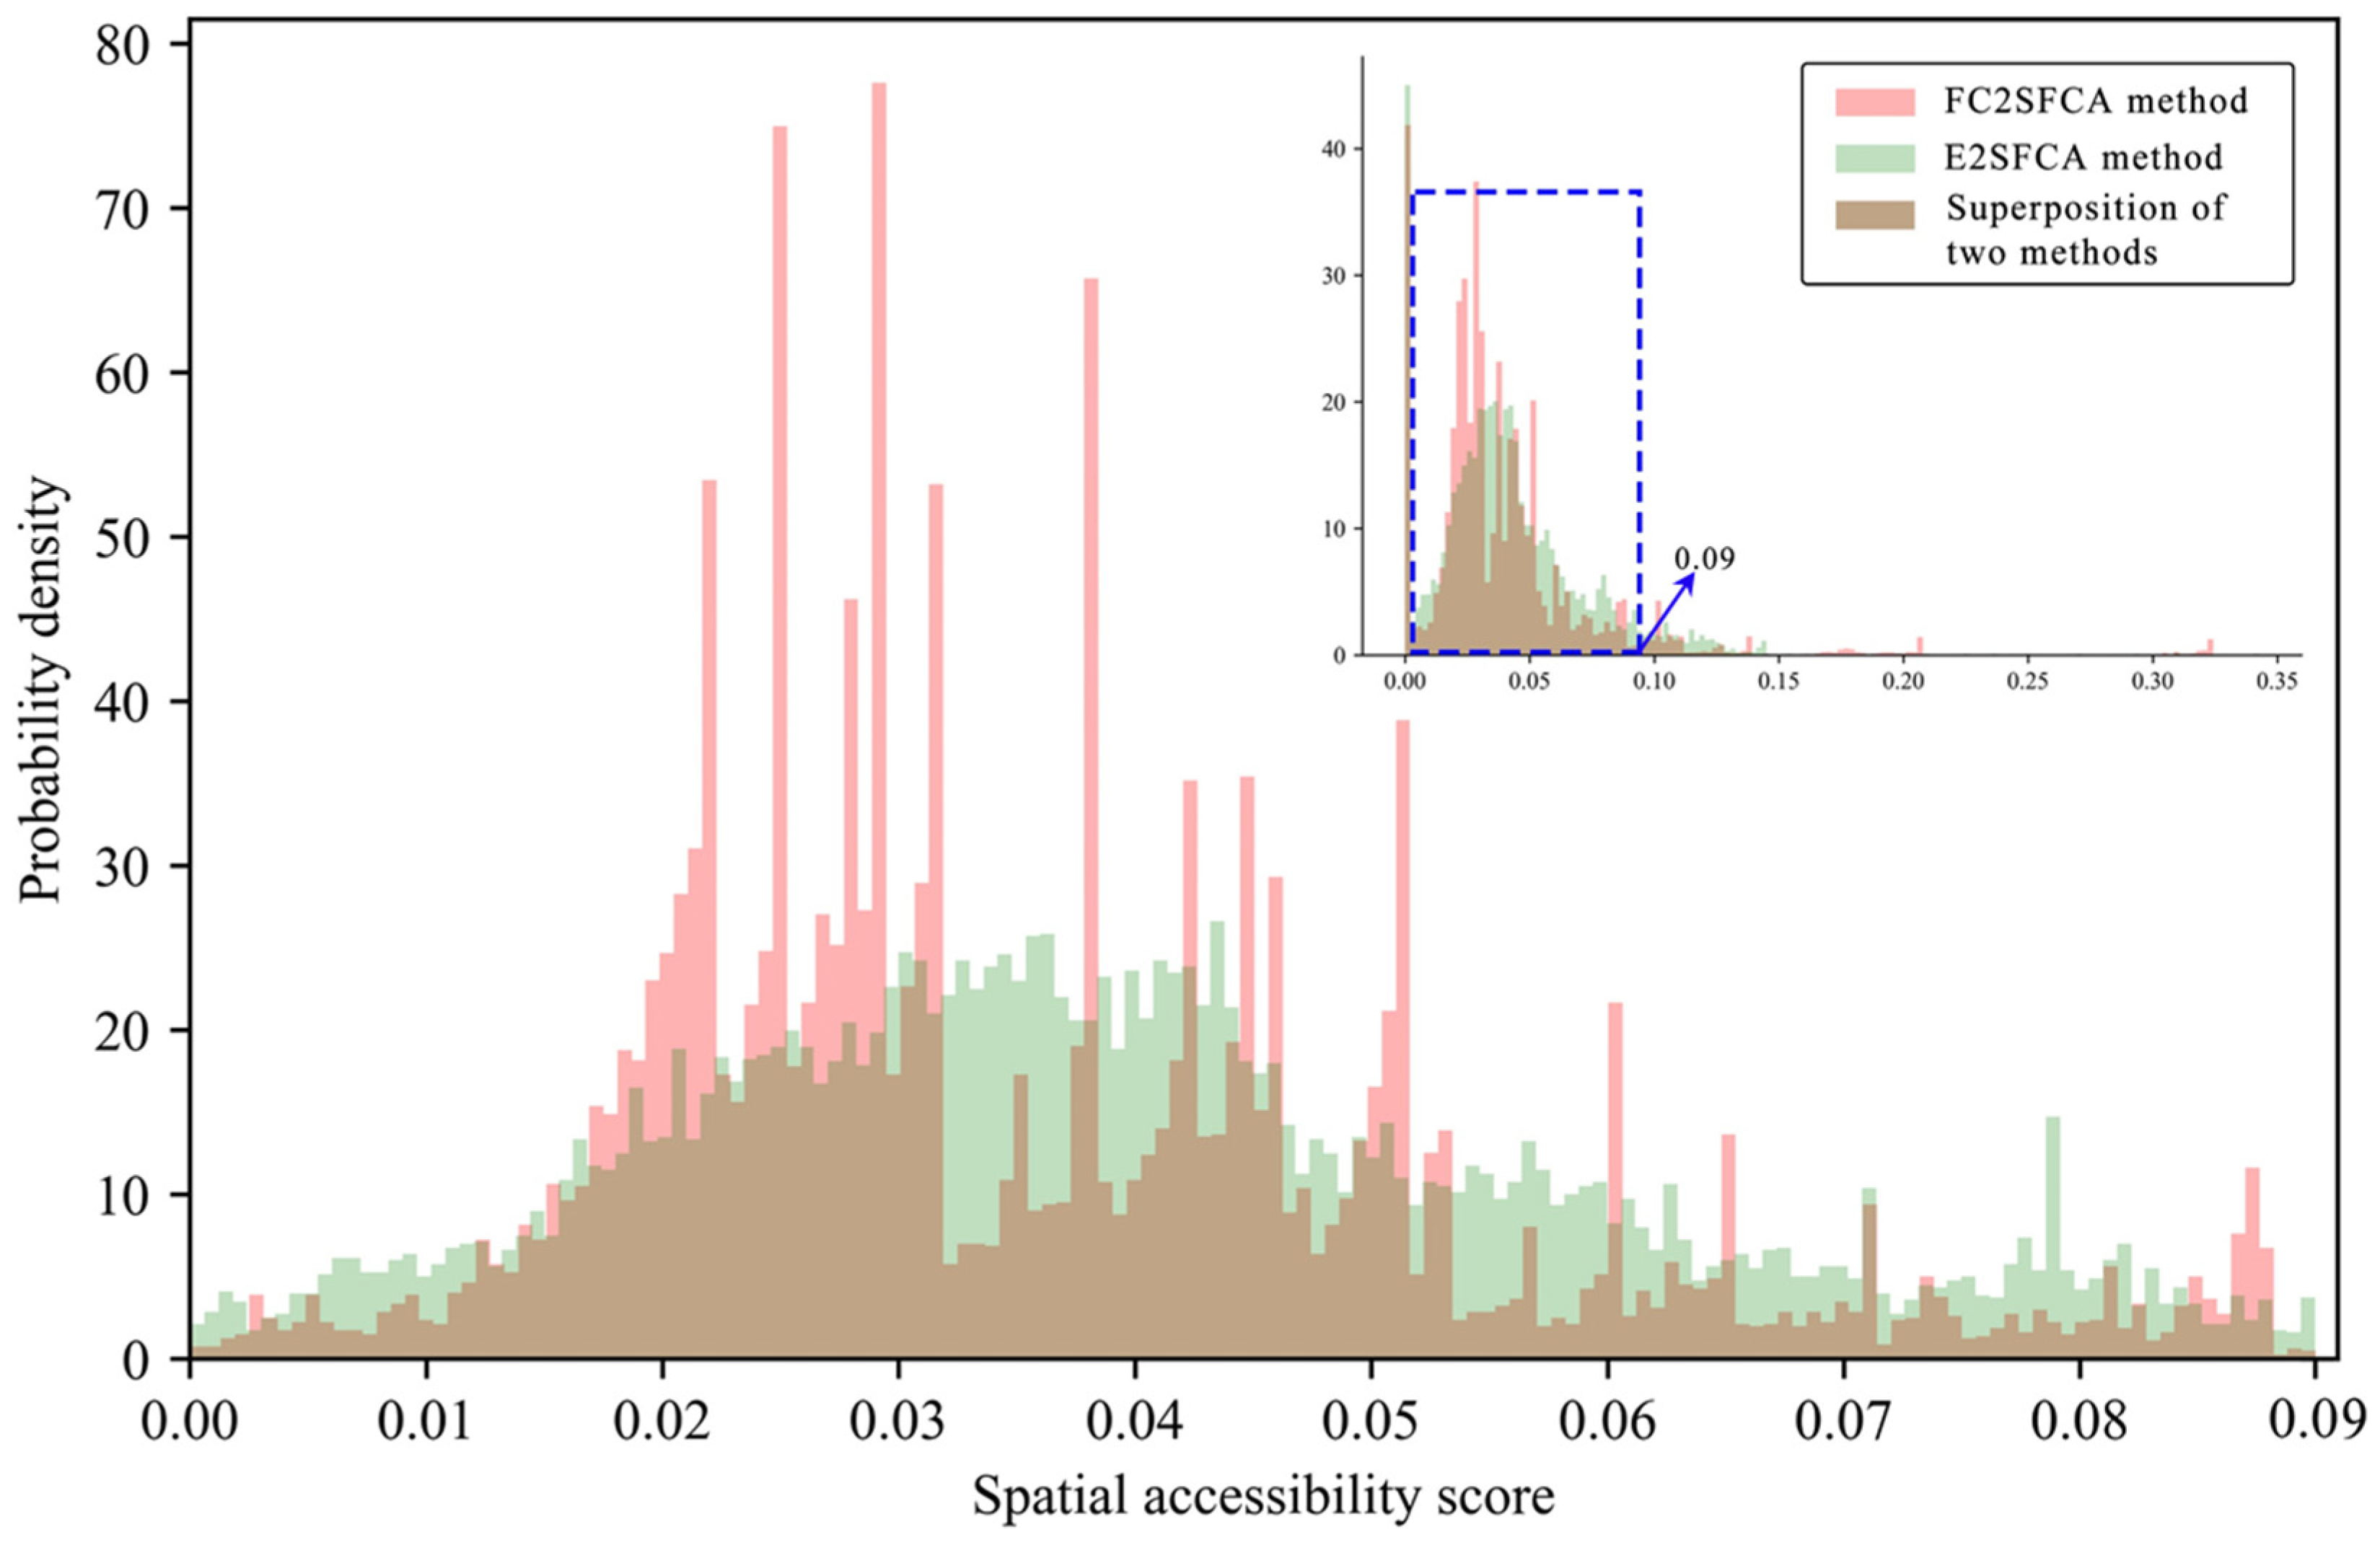
Table 2. The levels of spatial accessibility for E2SFCA and FC2SFCA.
Numerical RangeSpatial Accessibility LevelCount & Percentage of Fire Incidents
E2SFCAFC2SFCA
≤0.03Low5673 (36%)7506 (47%)
(0.03,0.06]Medium6948 (44%)5795 (36%)
(0.06,0.09]High2134 (13%)1520 (10%)
>0.09Very high1123 (7%)1057 (7%)

