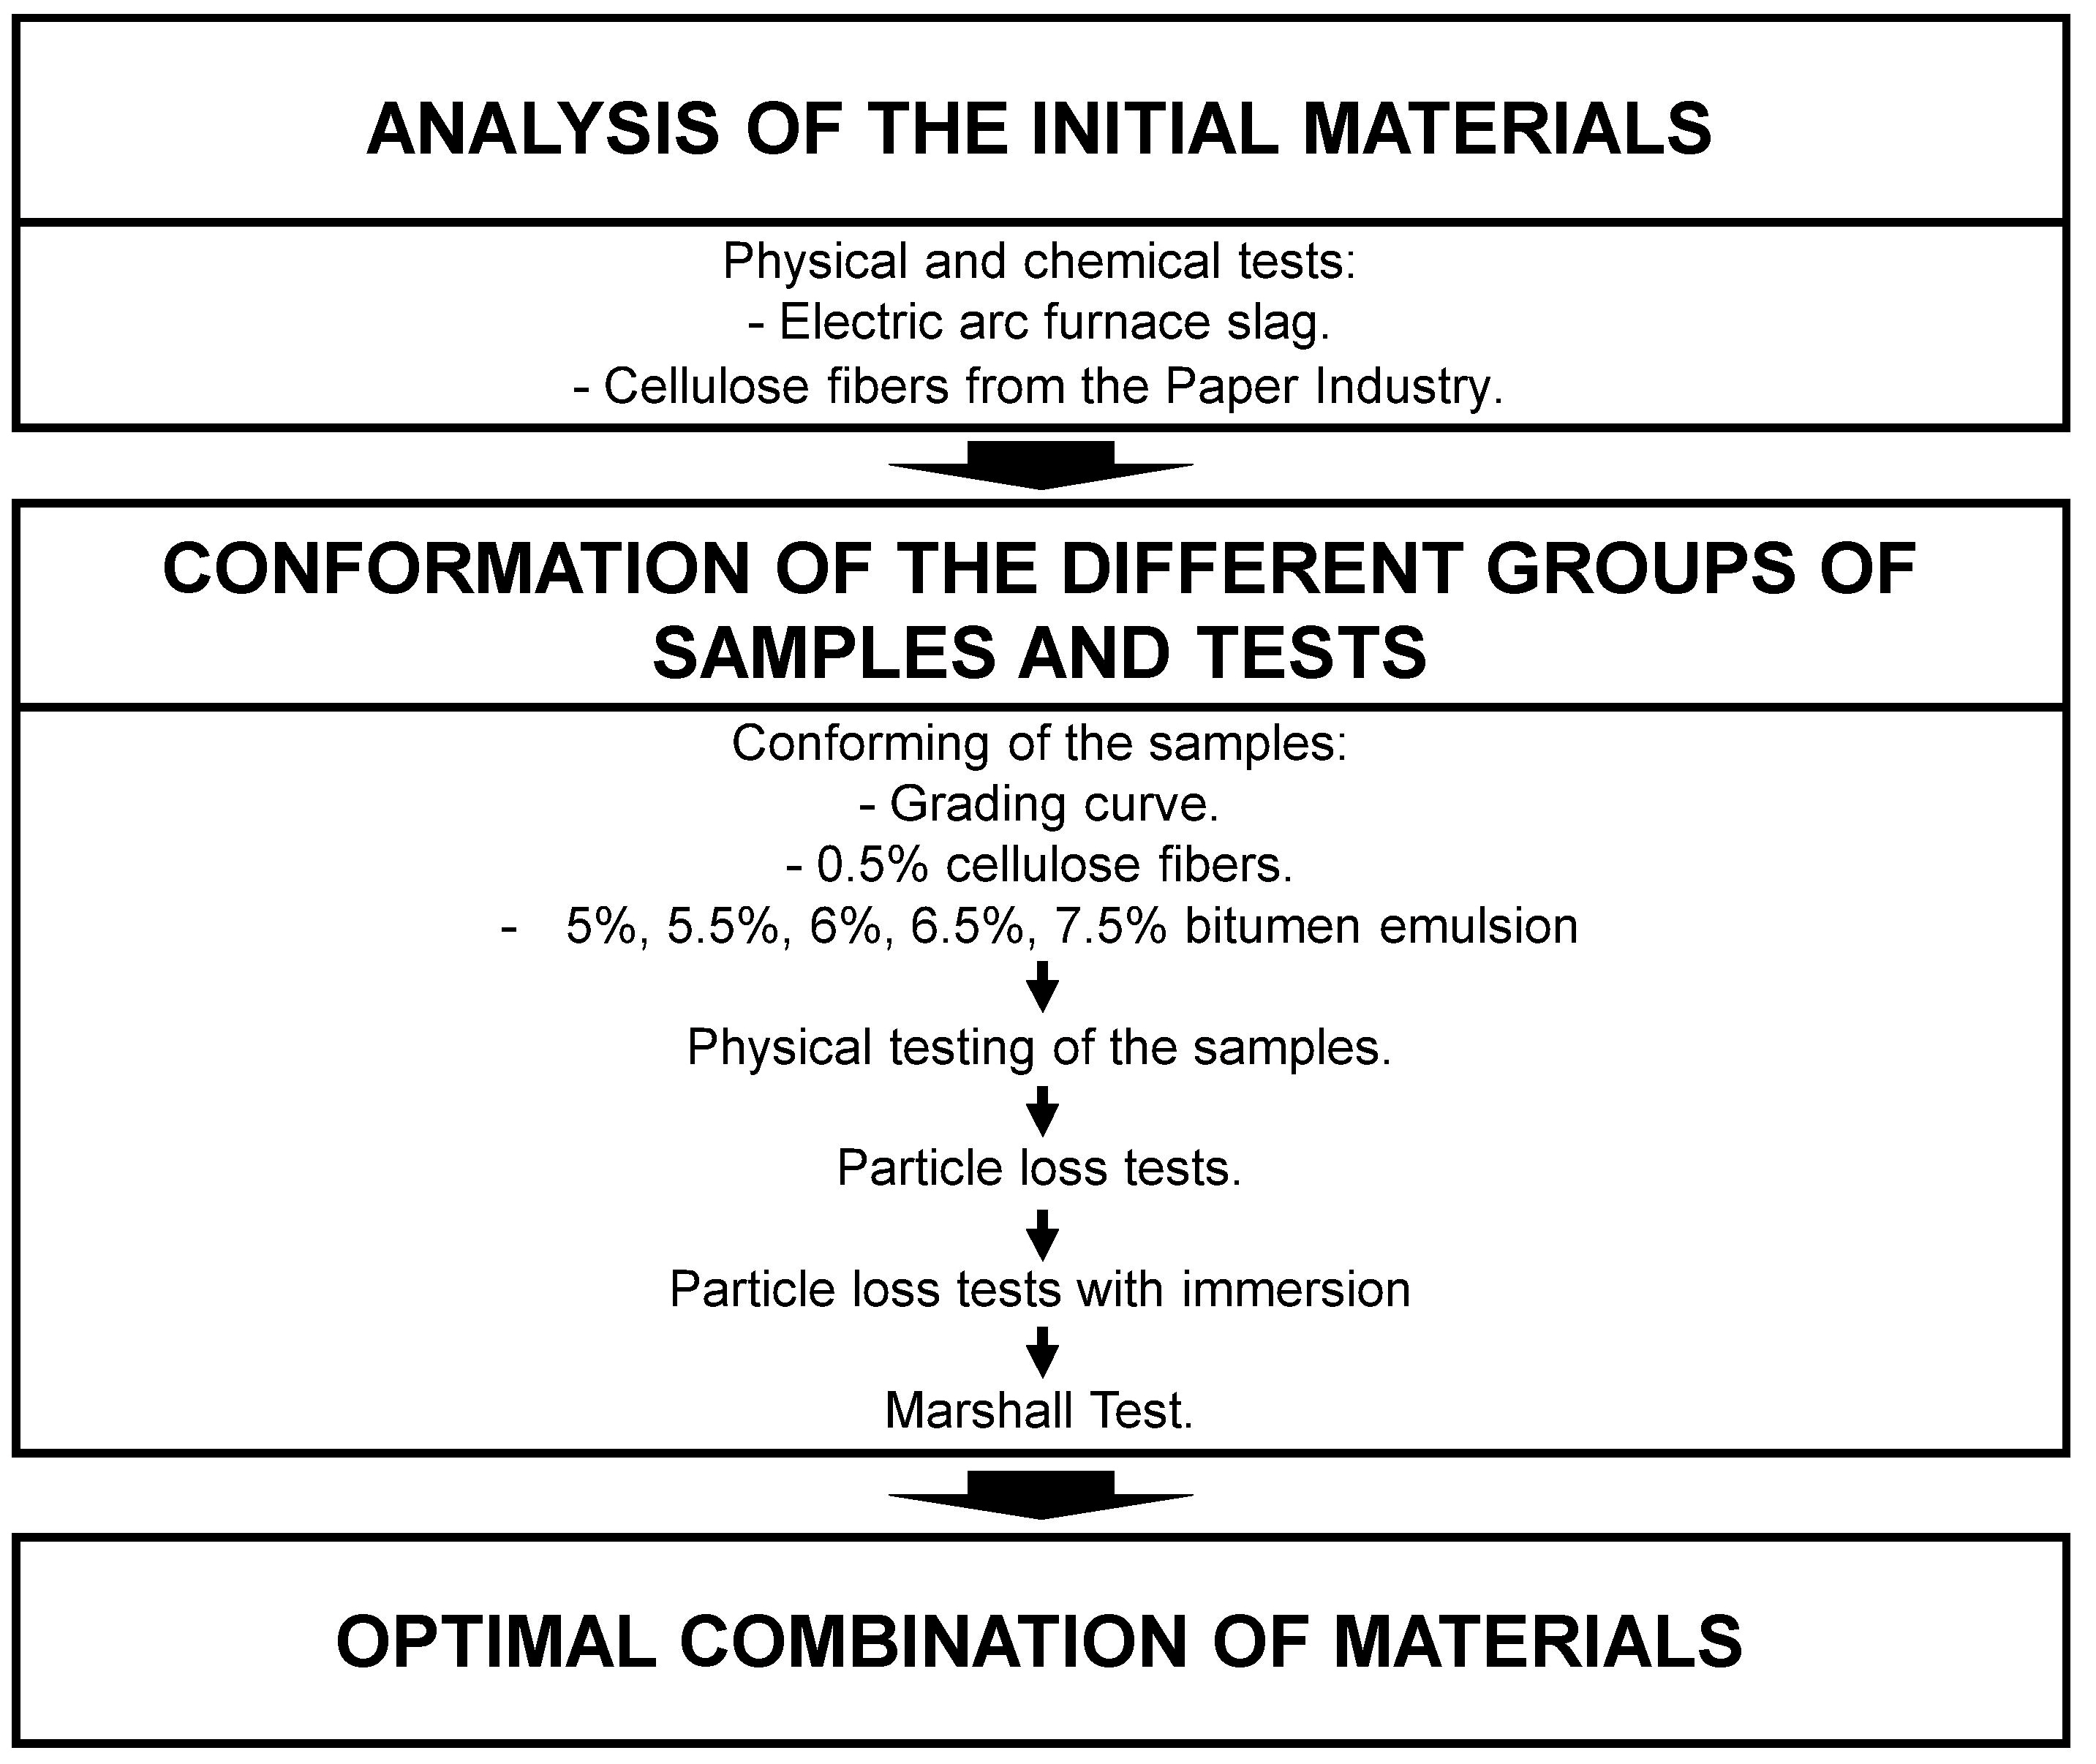
This section describes the results obtained from the tests mentioned in the methodology, subdivided into the three detailed study blocks.
3.1. Analysis of the Initial Materials
First the CFP were analyzed. The CFP after treatment were subjected to a series of tests. The fundamental test for the study of its chemical composition is the elemental analysis, since it is an organic material. The results of this test are shown in
Table 2.
The results reflect a main composition of Carbon and Hydrogen, as expected from a natural fiber. There is also a small amount of Nitrogen, unavoidable because of the type of byproduct, and is not of concern for its use. Sulfur, which could be one of the elements harmful to the bituminous mixture and the environment, does not appear in the fiber composition. Note that the sum of the four elements is not 100%, indicating that there are other inorganic chemical elements in the sample. Sodium may be one of them as the fiber has been washed with sodium hydroxide.
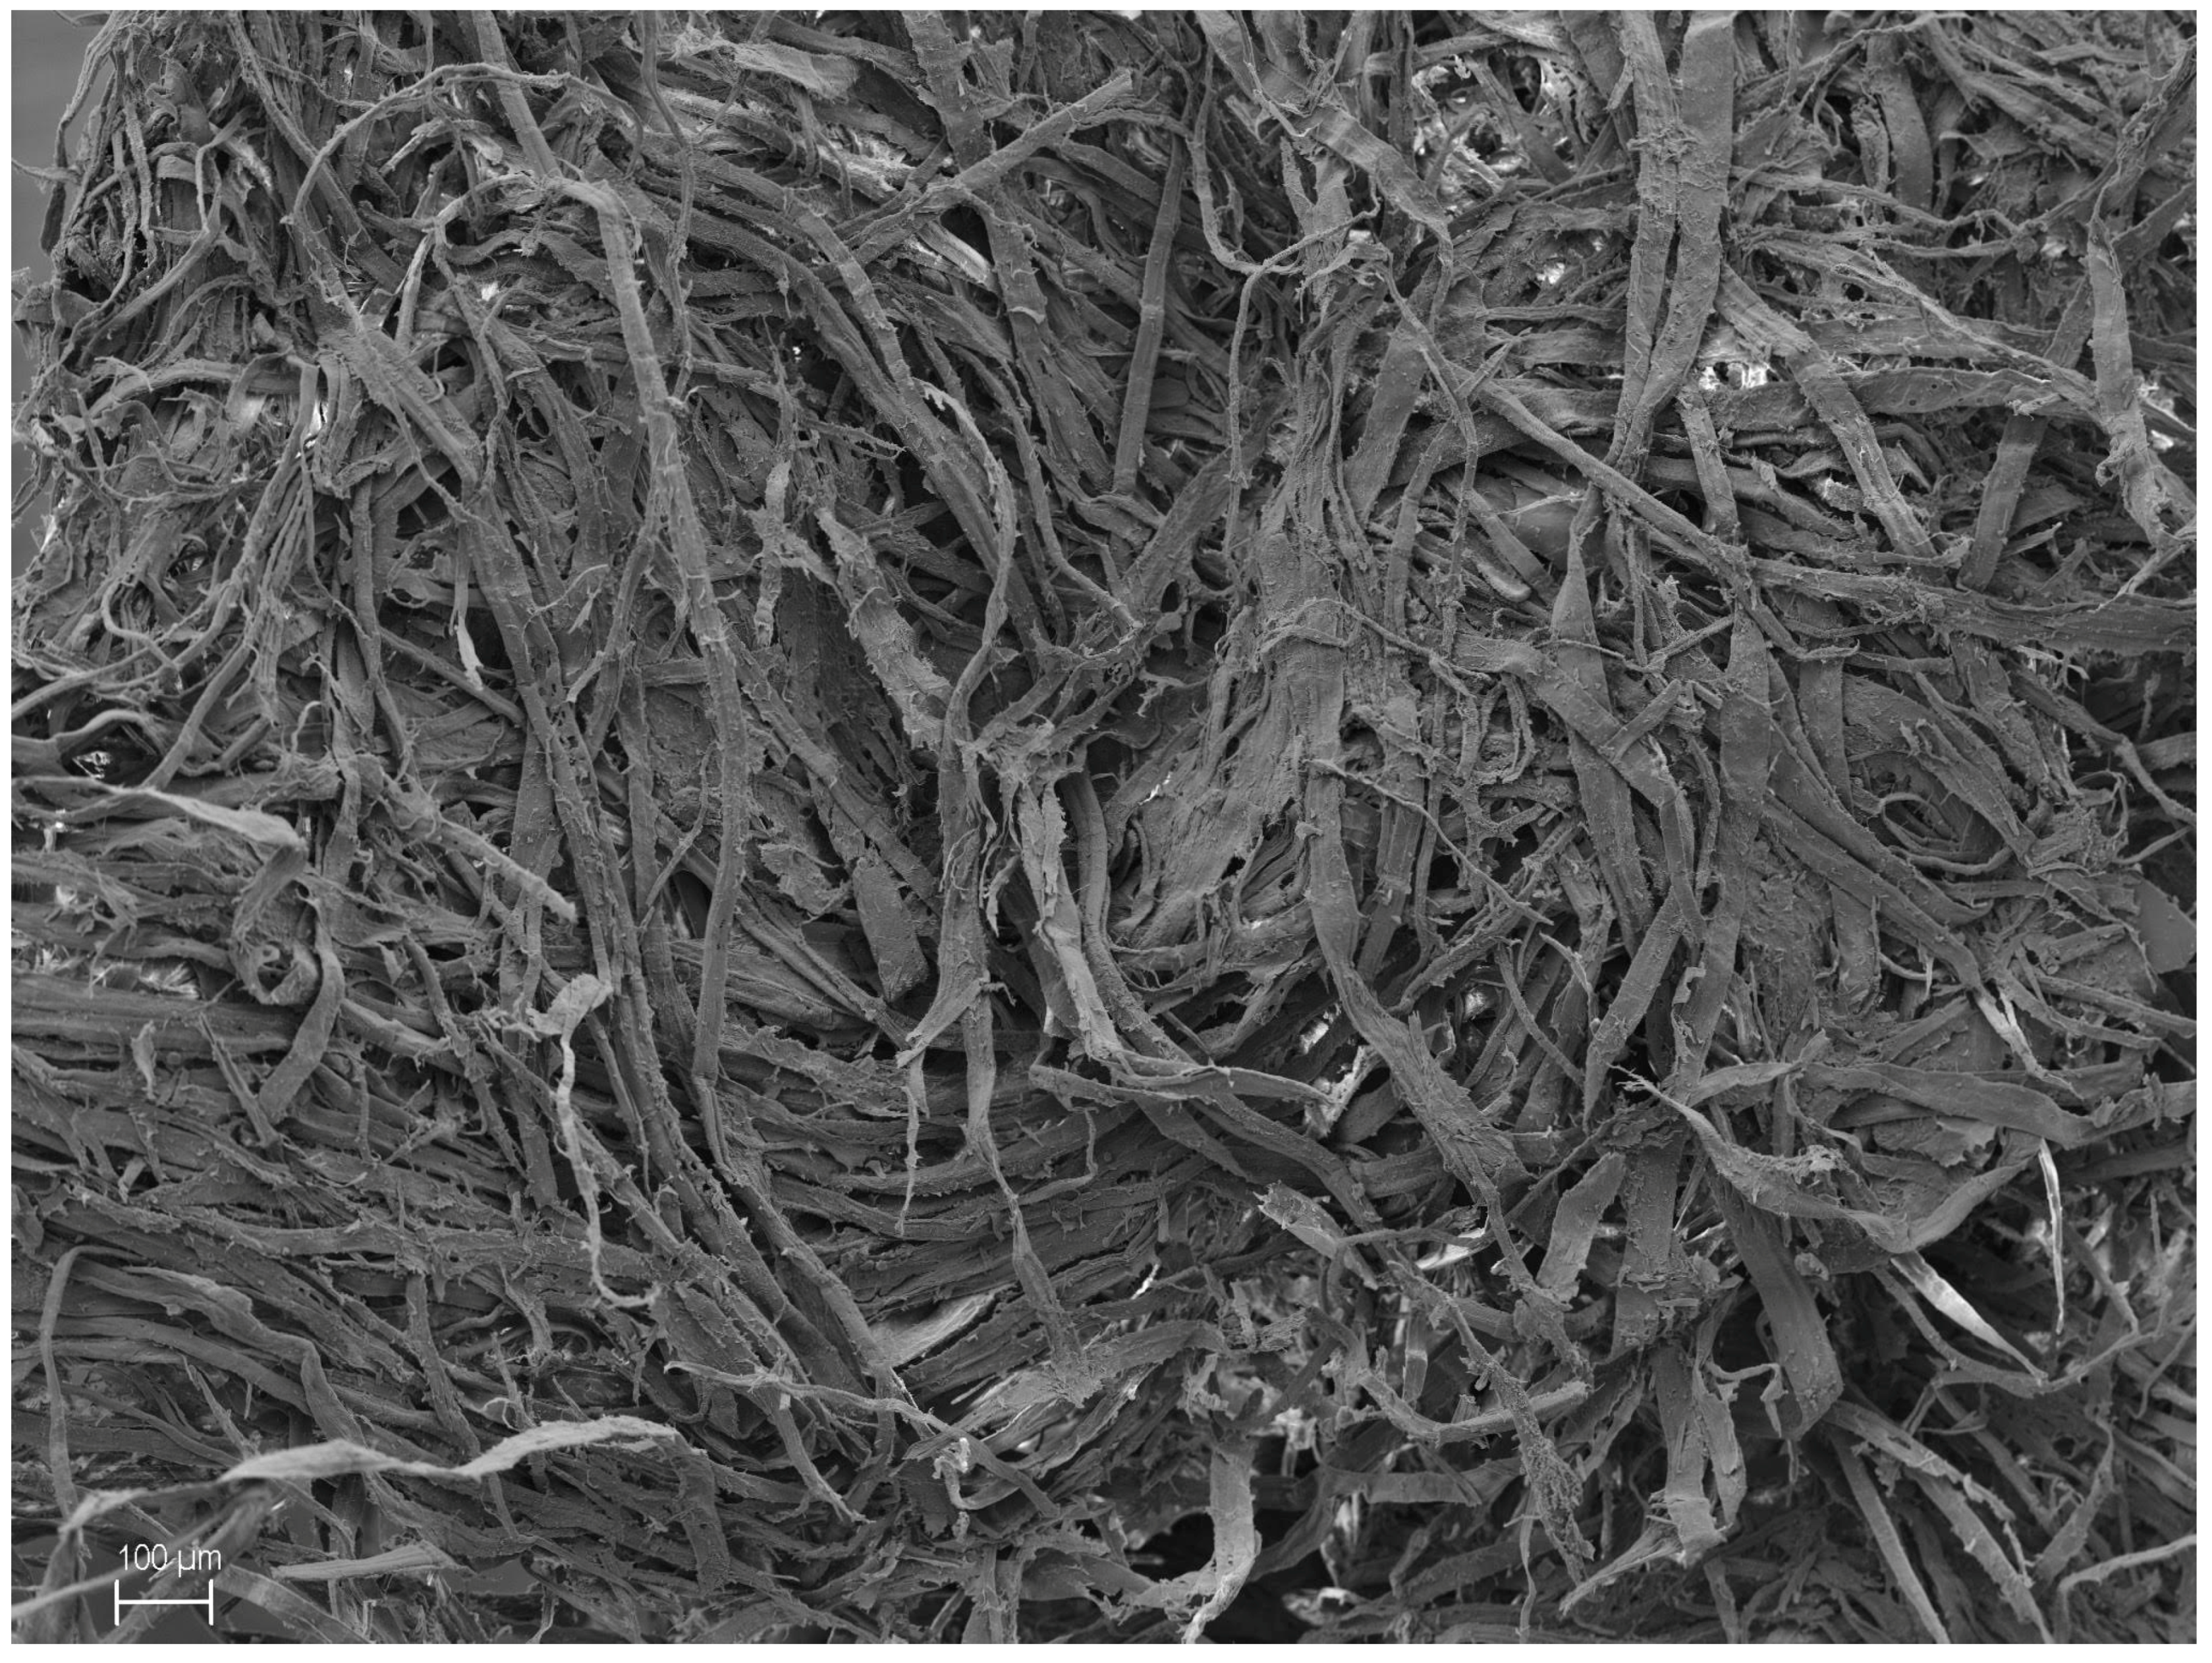
The Scanning Electron Microscope provided an image of the CFP with higher magnifications for this study.
Figure 2 shows the image of the CFP in the secondary option obtained with the Scanning Electron Microscope.
The image of the cellulose fibers shows a similarity between them in terms of dimension and surface appearance. In addition, there are no gross fibers or fiber clusters that could damage the bituminous mixture due to incorrect distribution. The average size of the cellulose fibers measured by microscope corresponds to millimeters. They are therefore suitable for use in bituminous mixtures if the mixing times with the emulsion established in the laboratory are respected and they are distributed homogeneously in the bituminous mixture.
The EAFS were also chemically analyzed through elemental analysis and X-ray fluorescence tests. The X-ray fluorescence test provides further information, as the material has an inorganic composition. The results of the elemental analysis of the EAFS are detailed in
Table 3.
The percentage of Carbon, Nitrogen and Hydrogen in the EAFS sample is very low, as the EAFS is an inorganic waste from the steelmaking Industry. It should be highlighted that there is no Sulfur, which makes the use of the EAFS as an aggregate for the bituminous mixture reliable without leachate problems.
The X-ray fluorescence test performed on the EAFS determined its inorganic composition. The results of the test are shown in
Table 4.
The chemical composition of EAFS is directly derived from its formation process. A high percentage of iron is to be expected, as it comes from steel, as well as a high percentage of calcium oxide due to its addition to obtain the final material. Silicon and aluminum oxides are common in the scrap used for the manufacture of new steels. Magnesium, manganese and chromium are also common in the composition of steel. The other elements are found in such small percentages that they cannot be extrapolated. The very low percentage of sulfur ensures that the leachate from the EAFS does not pose an environmental problem, as is the case with other pollutants. Otherwise, we would have to study the leaching of these chemical pollutants and compare them with the limit values established by the regulations. It should be noted that the existence of oxides, mainly calcium oxide, in the unaltered sample of electric arc furnace slag does not cause any subsequent problems of expansion in contact with water. This fact is derived from the industrial process of slag formation—after extracting the residue, the mixture is watered. In this way, a carbonate of the oxides is produced and therefore stability in its physical structure.
Once the CFP and the chemical composition of the EAFS were analyzed, the physical and mechanical properties were studied. As commented in the methodology, the tests were divided into two large groups depending on the size of the EAFS particles; on the one hand, the coarse and fine aggregate, and on the other, the mineral filler.
In the case of EAFS mineral filler, the particle density was 3076 ± 77 kg/m3. This density is higher than that of a conventional aggregate that has a density of around 2650 kg/m3. The higher density of the mineral filler of the EAFS makes it necessary to proportion by volume to make the correct combination of materials. On the other hand, the bulk density of the EAFS mineral powder showed the value of 700 ± 50 kg/m3. The mentioned density value was adequate for its use, reflecting that it is not a pulverulent material that could cause problems in its dosage.
The particle density of the coarse and fine aggregate of EAFS was made for all the grading fractions used in the grading curve for the formulation of the mixture, with these fractions being: 0.063–2 mm, 2–4 mm, 4–8 mm, 8–12.5 mm and 12.5–20 mm. In this way, volumetric corrections were made for each fraction and the mixture dosed as accurately as possible to its density. The results for each particle size fraction are shown in
Table 5.
The densities of the different grading fractions differ from the density of a conventional aggregate, 2650 kg/m3, which is higher than the density of the EAFS. Volumetric correction is necessary for the dosage, thus ensuring that the percentage of emulsion is not excessive with respect to the aggregate if we proportion by weight.
The absorption coefficient for the coarse aggregate was also evaluated. The reason for carrying out this test was twofold: the calculation of the absorption of the emulsion in comparison with a conventional aggregate, and the study of the possible problems that a high absorption coefficient can trigger in the mineral skeleton of the bituminous mixture. The absorption coefficient of the coarse aggregate showed a value of 1.50 ± 0.03%. As can be observed, the value of water absorption was slightly superior to 1%, so it should be taken into account in the dosage of the emulsion since it will absorb more. It could also cause problems due to freezing and thawing cycles in service. However, in order to fully determine its viability, the resistance of the EAFS to freezing and thawing cycles has been calculated.
The result of the fine aggregate sand equivalent test was 77 ± 2%. The value is greater than 50%, and therefore the use of EAFS for bituminous mixtures is acceptable, as it does not contain a high percentage of colloidal particles that could cause future problems.
Conversely, the broken surfaces in coarse aggregate particles was calculated for EAFS with a result of 100 ± 0%. The achievement of these excellent results is determined by the process of formation of the EAFS, since the shape derives from their formation process with oxygenation in the furnace, making them irregular and with various sharp edges. They are therefore excellent for working in this type of bituminous mixture that requires the formation of a strong and well-fitted mineral skeleton.
To complement the previous test, the flakiness index was calculated, showing a value of 0 ± 0%. As in the previous test, these excellent results were obtained due to the process of EAFS formation. Therefore, there are particles of similar dimensions in the three axes, but with irregular surfaces typical of processes with high temperatures. This test, together with the previous one, shows the excellent suitability of the EAFS for use in aggregates for bituminous mixtures with discontinuous granulometry, contingent on the results obtained in terms of their mechanical characteristics.
Finally, in order to evaluate the mechanical resistance of the EAFS, the tests of resistance to fragmentation and to the freezing and thawing cycles were carried out. The result of 13 ± 1% of the test of resistance to fragmentation makes the slag an ideal material for use in bituminous mixtures for roads, as well as in layers that are mechanically very demanding, such as the wearing course. In turn, the percentage of mass reduction of 0.551 ± 0.016% after the freezing thaw cycle test is negligible. Therefore, even if the EAFS has a slightly higher absorption coefficient than the established one, it can be seen that its mechanical behavior during the freezing and thawing cycles is ideal.
The previous tests have reflected the excellent suitability of the EAFS for the conformation of bituminous mixtures, not only in medium traffic roads, but also in roads with important traffic. However, a number of properties must be considered that, while not negative, may cause the bituminous mixture to fail if they were not known. Mainly, these are that the particle density and the absorption coefficient are higher than those of a conventional aggregate.
3.2. Conformation of the Different Groups of Samples and Tests
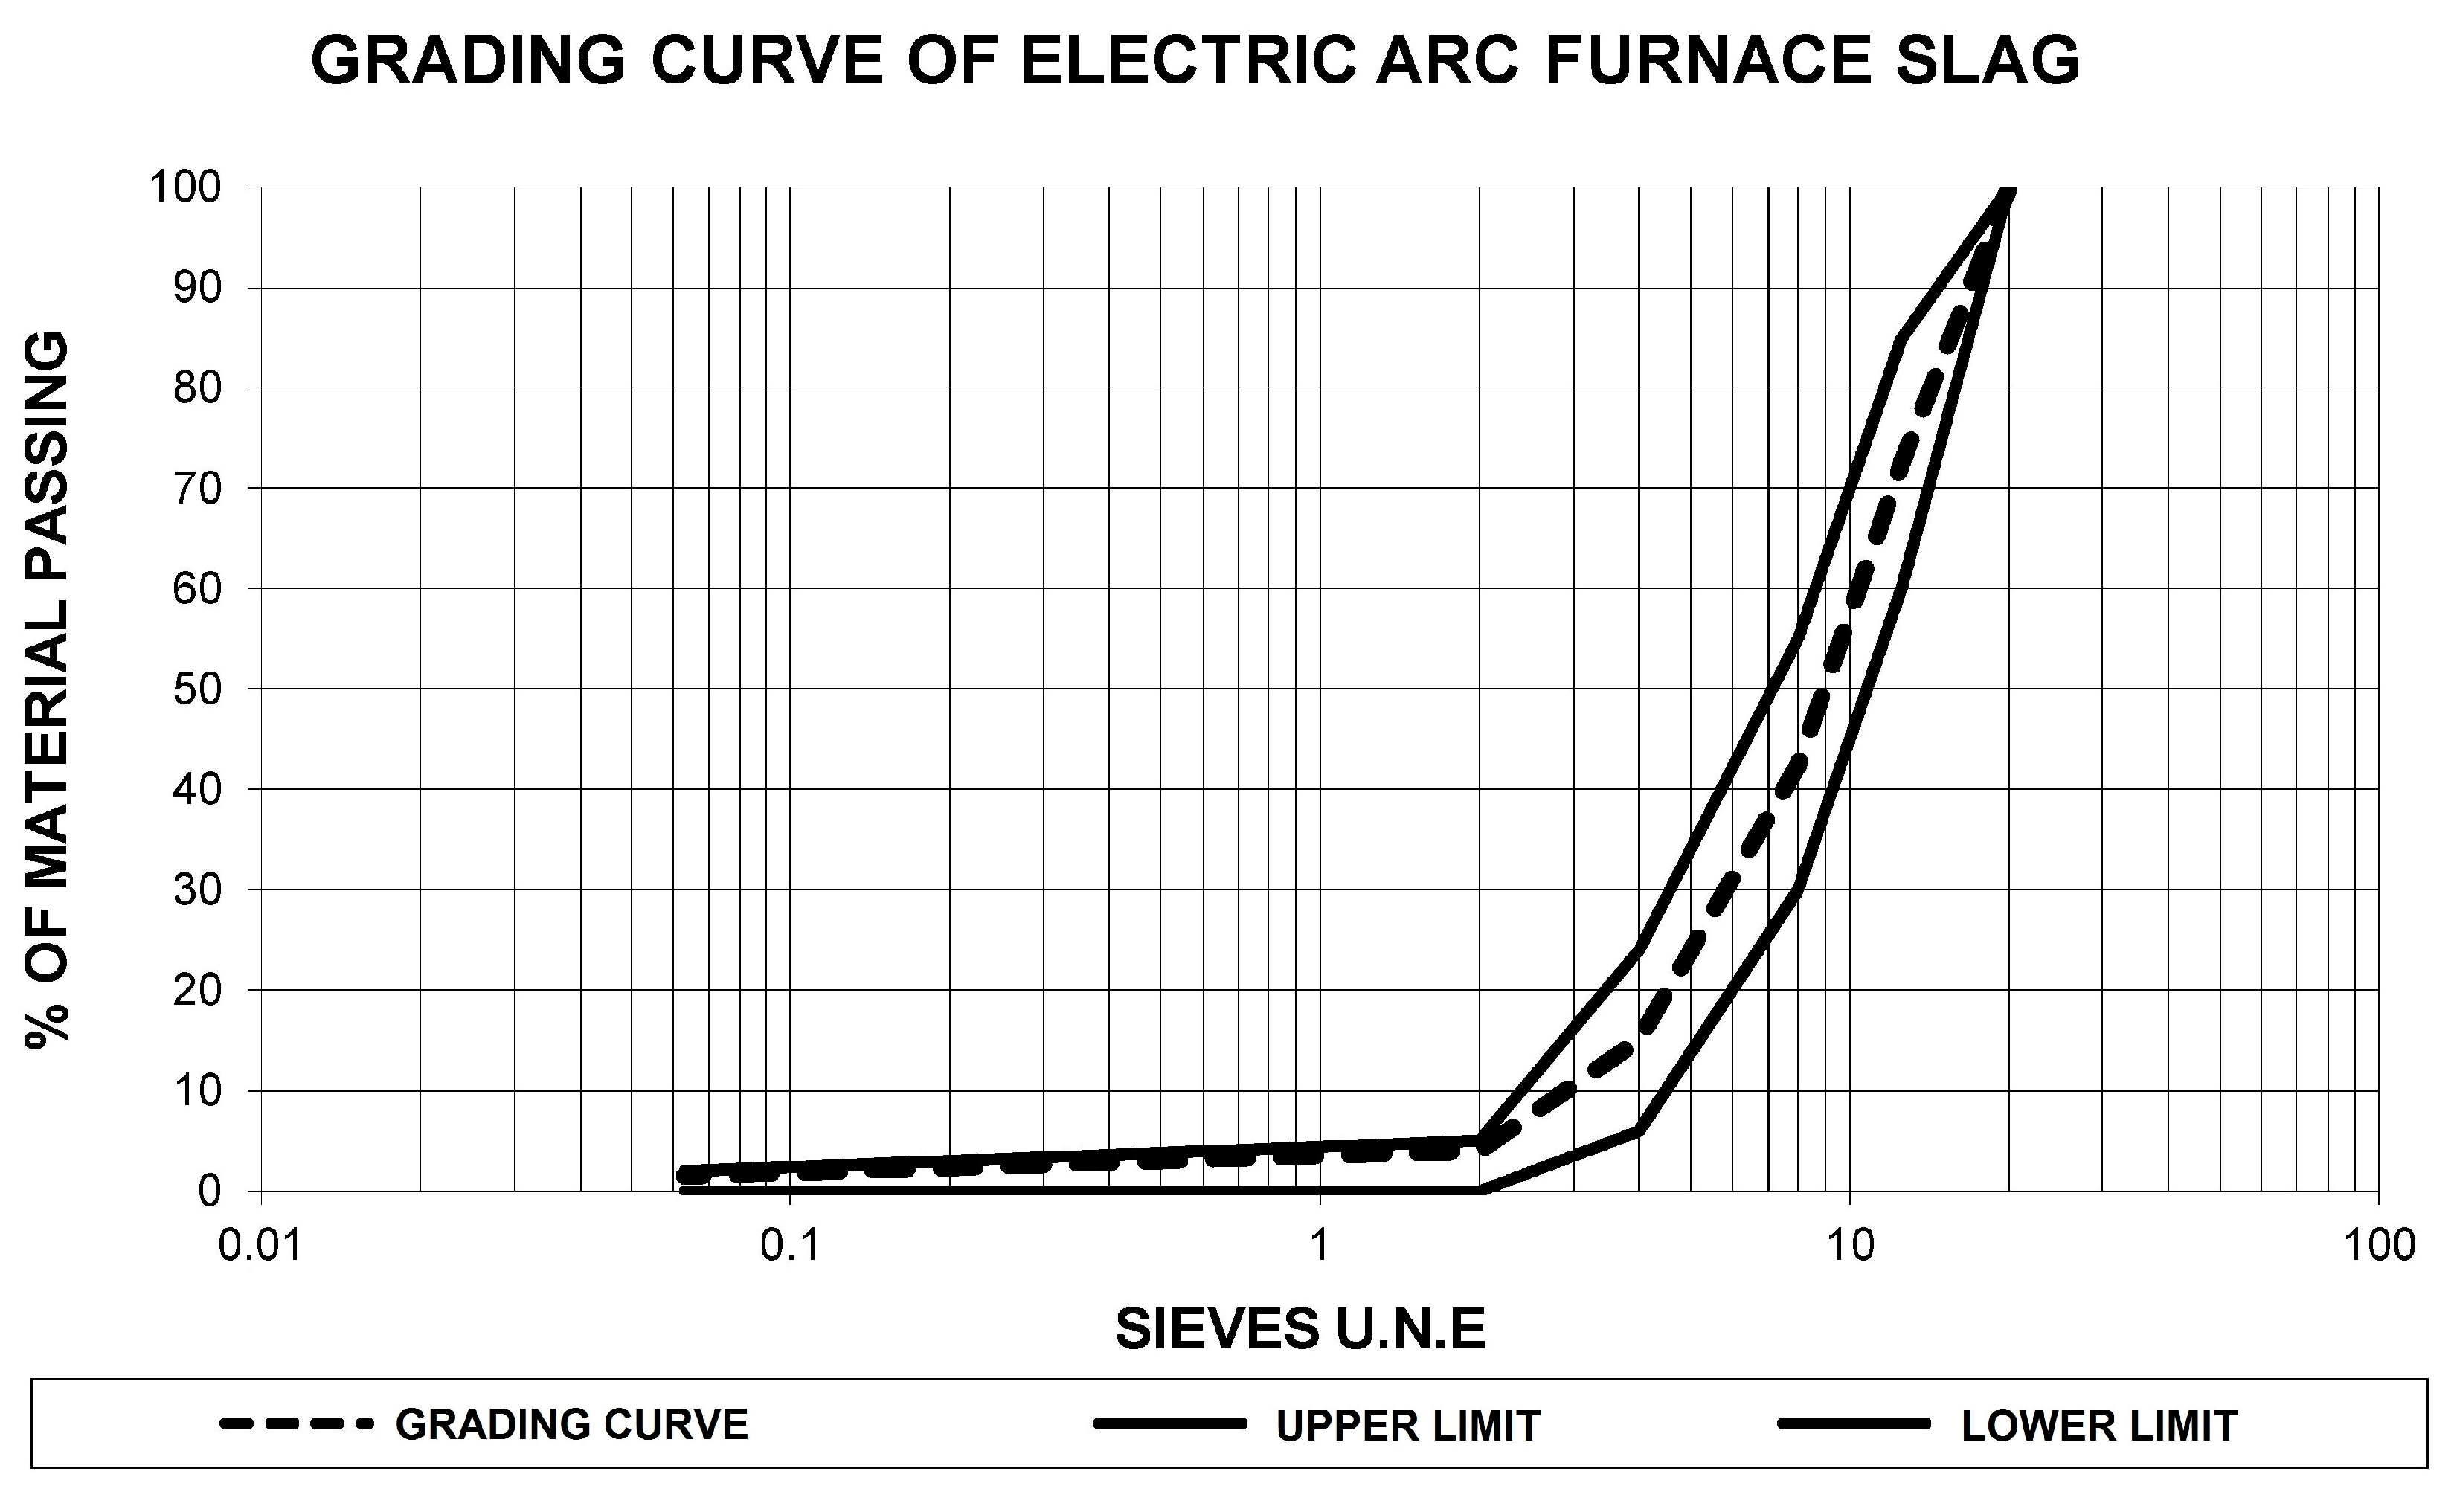
Once the suitability of the EAFS and CFP for the conformation of bituminous mixtures has been studied, the grading curve of the bituminous mixture is defined. The bituminous mixture to be developed is a discontinuous granulometry mixture with bituminous emulsion. The grading curve adopted has an intermediate composition between the upper and lower envelope for the coarse aggregate. On the other hand, and with the purpose of improving the useful life of the bituminous mixture and the resistance to tensile strength, as well as making it possible to absorb increasing percentages of bitumen, the proportion of fine aggregate was slightly increased with respect to the intermediate curve between the upper and lower grading envelope. The grading envelope for this bituminous mixture of discontinuous granulometry with a maximum aggregate size by 12 mm, as detailed in the Spanish regulations, was mentioned in the methodology [
47]. The grading curve of the EAFS is detailed in
Figure 3 below.
For a conventional aggregate the density is approximately 2650 kg/m
3, however, the EAFS has a density that differs from this value. Therefore, the appropriate volumetric corrections were made so as not to add excess emulsion with respect to the aggregate. The density corrections are those detailed in
Table 6, also showing the necessary mass of EAFS for each grading fraction for the conformation of Marshall type samples with the established grading curve.
It is observed that the EAFS samples obtained a mass of 1223 g; to obtain a similar sample using conventional aggregate, it should be 1000 g. This fact must be taken into account not only in the dosing of the aggregate, but also in the dosing of the emulsion and the CFP in terms of the mass of a conventional aggregate test sample, that is, to the density of 2650 kg/m3.
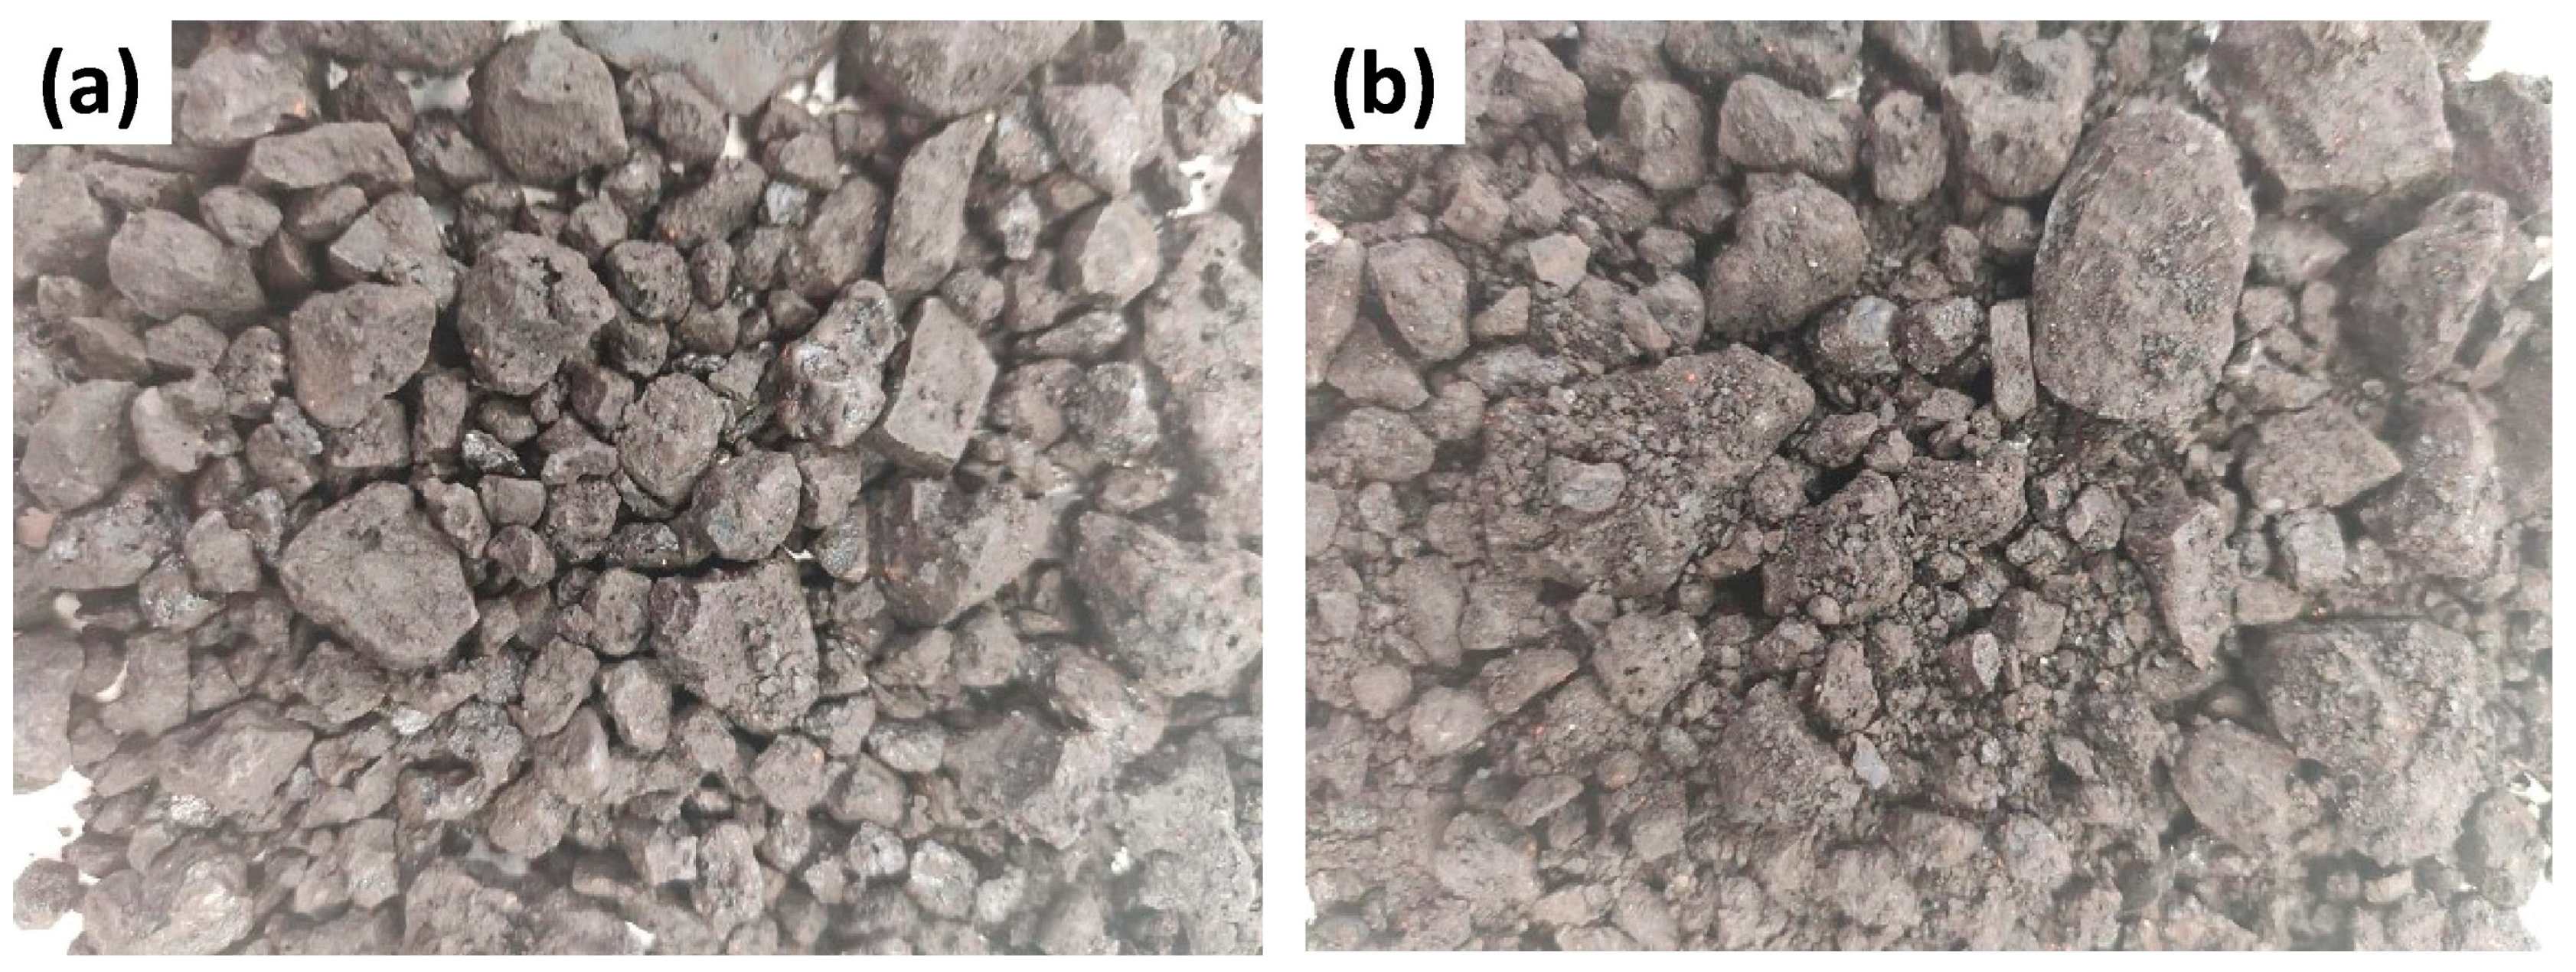
Once the grading curve of the EAFS was determined, the compatibility of the EAFS with the bitumen emulsion was evaluated by means of the adhesivity test. This test distinguishes two types of adhesivity; one called immediate adhesivity and corresponding to the aggregate coating with the bitumen emulsion; and the other, aggregate-bitumen adhesivity by studying the aggregate coating by bitumen after the curing process and a 24 h period in water at a temperature of 60 ± 1 °C. Both values are measured quantitatively, expressing the percentage of EAFS coating by bitumen at the end of the test.
The emulsion used for this test and evaluated for use in bituminous mixtures is a medium breaking cationic bitumen emulsion, more specifically, and according to European standard C60BF3 MBA.
Figure 4 shows the image of the EAFS after the immediate adhesivity test with the aforementioned emulsion and the image of the aggregate-bitumen adhesivity. The result of the adhesivity test is shown in
Table 7.
Both adhesivity measures show an excellent behavior of the emulsion in conjugation with the EAFS, making the use of this emulsion suitable for the studied bituminous mixtures.
On the other hand, the formula provided by ATEB [
48] in Equation (1) was used to calculate the percentage of emulsion needed for the AF12 bituminous mixture without CFP. This formula is based on the specific surface area of a conventional aggregate and is detailed below:
where:
BR = Proportion of residual bitumen on the dry mass of the aggregates.
K = Coefficient of enrichment, the value of which is 1 in the wearing course and 0.9 in the lower course.
A = Proportion of aggregates retained by the sieve UNE 20 mm.
B = Proportion of aggregates passing through the sieve UNE 20 mm and is retained by the sieve UNE 8 mm.
C = Proportion of aggregates passing through the sieve UNE 8 mm and is retained by the sieve UNE 4 mm.
D = Proportion of aggregates passing through the sieve UNE 4 mm and is retained by the sieve UNE 2 mm.
E = Proportion of aggregates passing through the sieve UNE 2 mm and is retained by the sieve UNE 0.063 mm.
F = Proportion of aggregates passing through the sieve UNE 0.063 mm.
Applying this formula, taking into account a K factor of 0.1 and the values in
Table 6 for the other coefficients, gives a bitumen percentage of approximately 3.6% aggregate. Therefore, the percentage of emulsion on aggregate must be calculated. As bitumen represents 60% of the emulsion, in
Table 1, the percentage of emulsion is 6% over aggregate. The bituminous mixture with this percentage of emulsion and the detailed grading curve will be the initial one for the study.
It should be noted that the aim of this study is to develop a bituminous mixture with a higher percentage of bitumen due to the incorporation of CFP. In turn, EAFS has a higher absorption coefficient than conventional aggregate. Therefore, tests were made without the addition of CFP, with increasing percentages of bitumen, to observe exudation during the curing process. The percentage of bitumen, and consequently of bituminous emulsion, that led to exudations was the initial percentage for the study of bituminous mixtures with CFP. Therefore, their suitability was corroborated, as no exudation for that percentage occurred when CFP were added, and bituminous mixtures with increasing bitumen percentages of 0.5% were developed. The percentage of emulsion was increased until the breaking time of the bituminous mixture in its manufacture was inadequate, compaction was unacceptable or exudations of bitumen occurred during curing.
Based on the above, the CFP free samples with 8.3% emulsion and 5% bitumen produced exudation of bitumen during the two days of the oven curing process at 75 ± 2 °C and a further five days at 90 ± 2 °C. Therefore, this is the initial bitumen percentage for the study of new bituminous mixtures with CFP and increasing bitumen percentages of 0.5%.
To complete the information, the groups of samples that were manufactured with the addition of CFP for the tests mentioned in
Table 8 are defined.
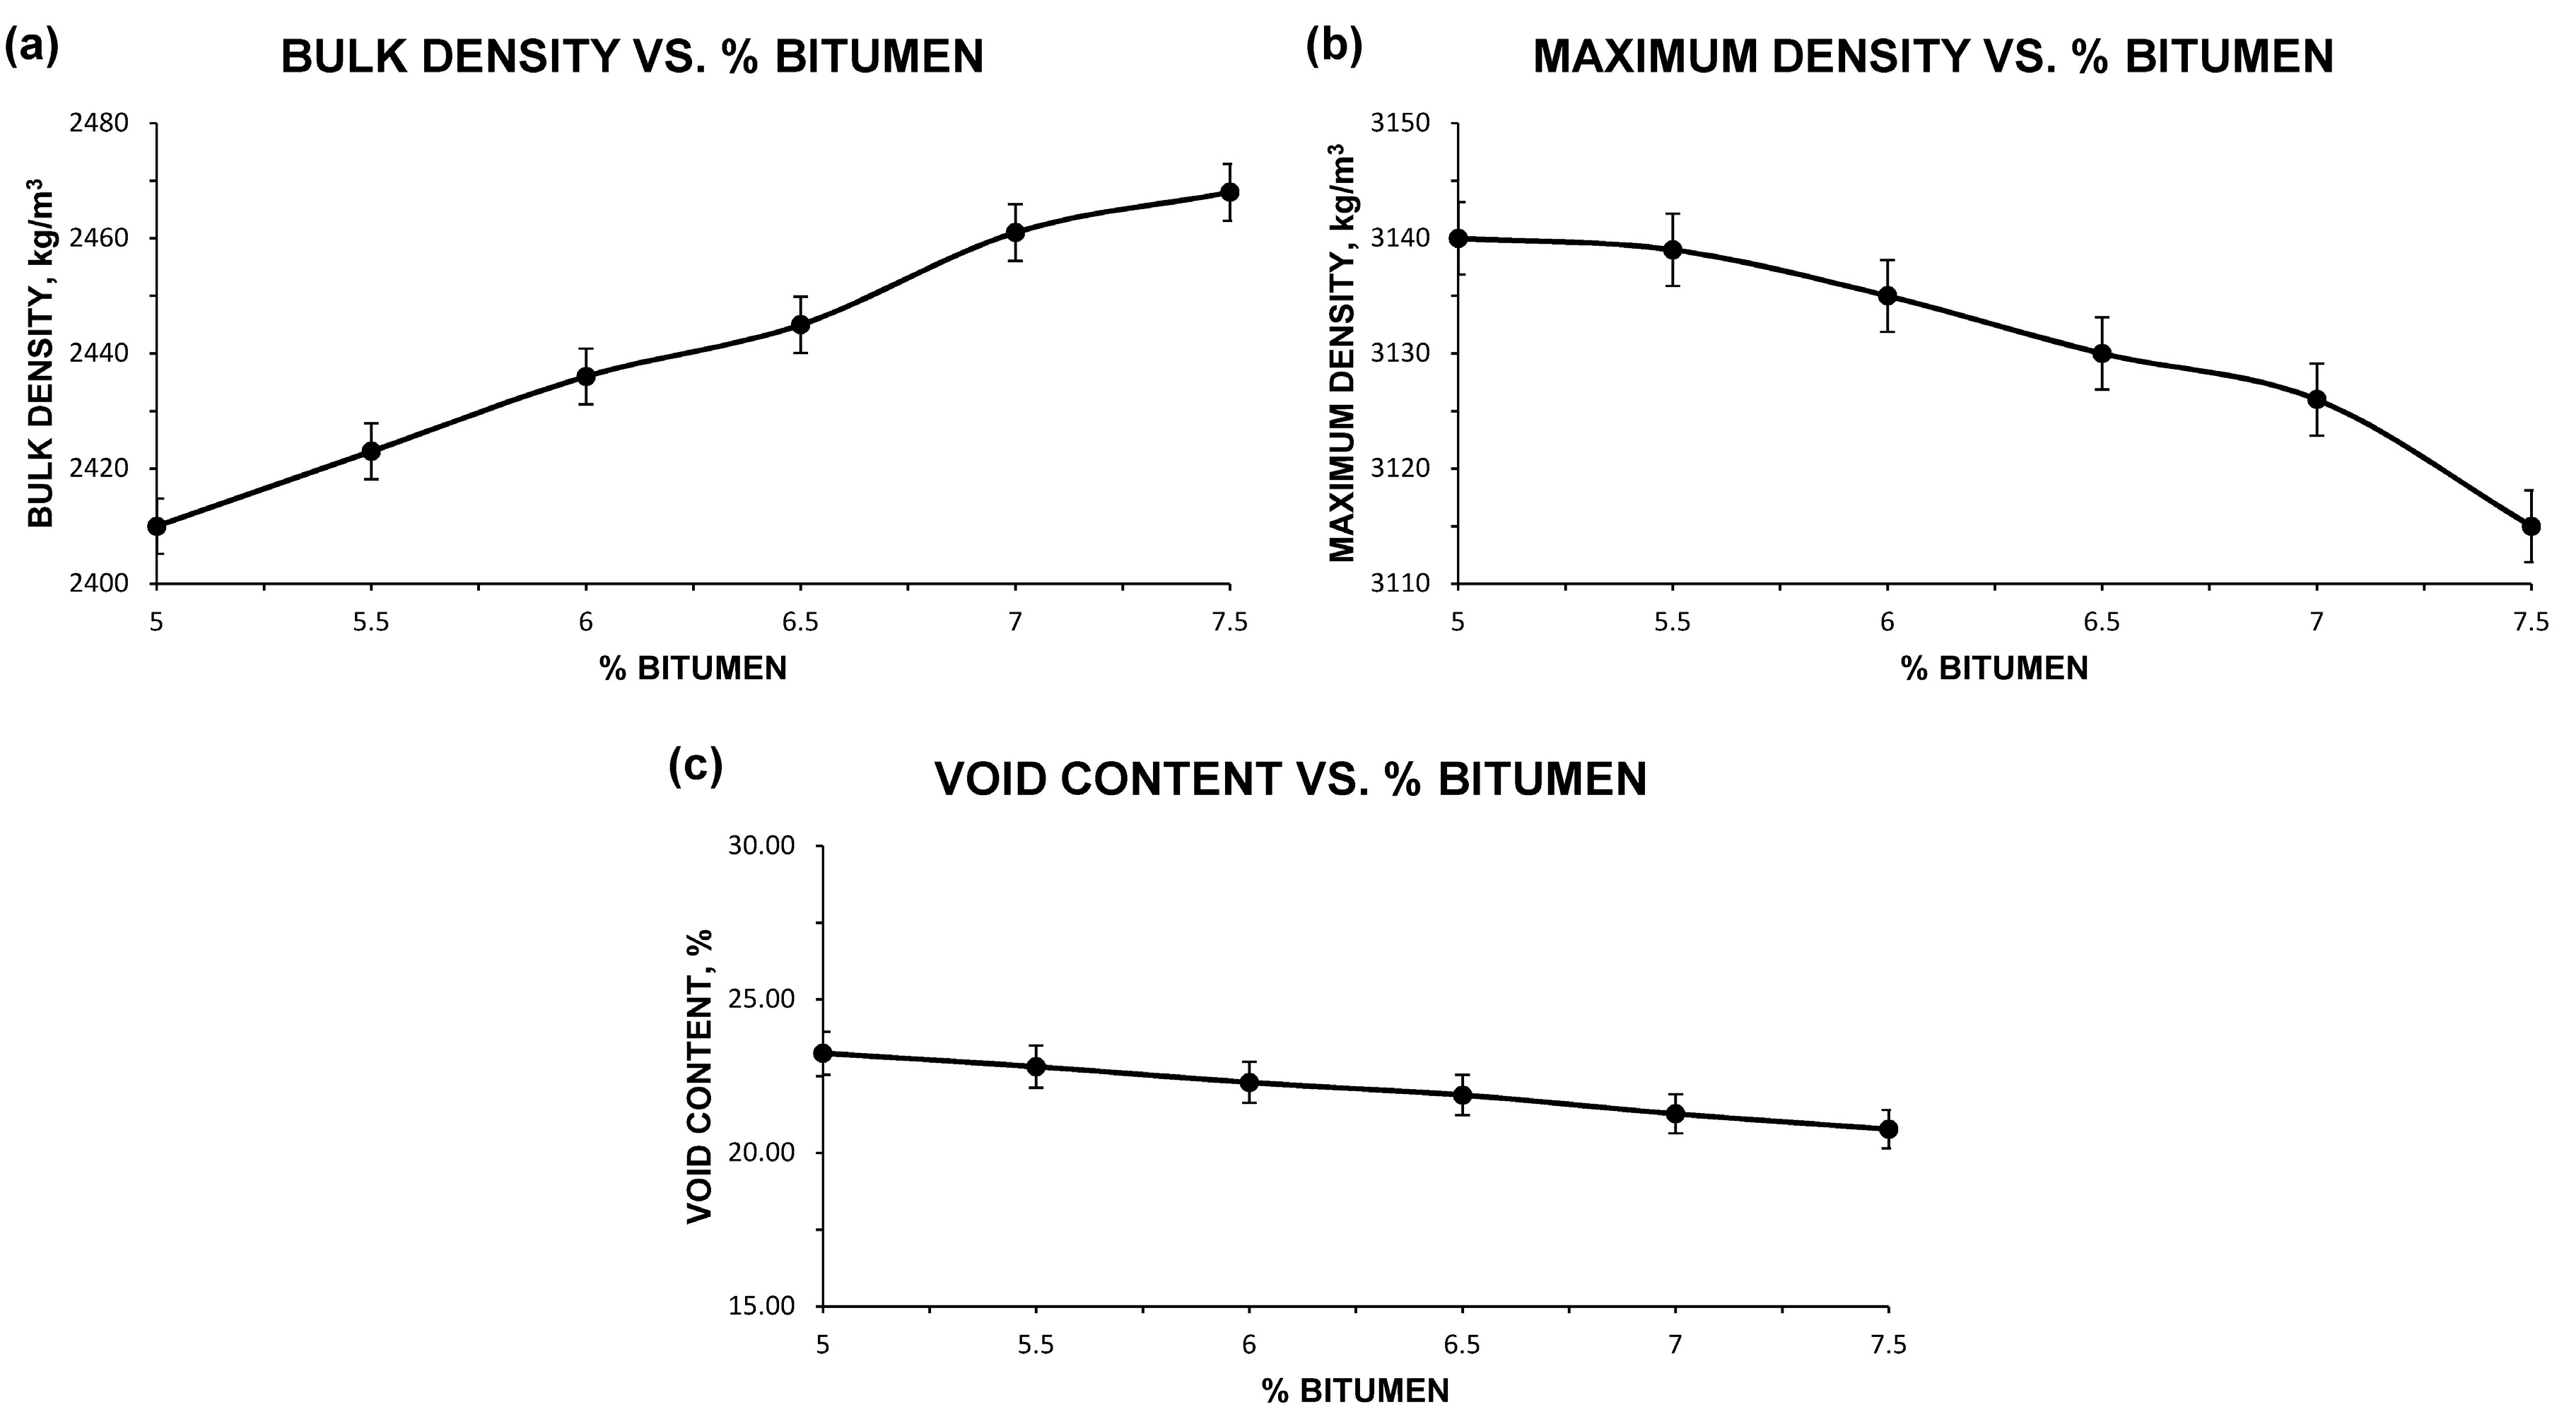
Once the percentage of starting emulsion had been determined, the samples were manufactured with 0.5% CFP and increasing percentages of 0.5% bitumen. The process of compacting and curing the samples were as detailed previously. The breaking and curing times of the bituminous mixtures increased slightly with the increase in the percentage of bituminous emulsion, with the difference being negligible. For each group of samples manufactured, the physical properties were then determined, which were bulk density, maximum density and void content.
Figure 5 shows the values obtained from the different tests to determine these physical properties of the different groups of samples with CFP and EAFS.
As can be seen, the bulk density increases with the percentage of bitumen added. This is mainly due to the higher compaction possible with the increasing percentage of emulsion and the same compacting energy. The results of this physical parameter influence subsequent parameters such as the void content and, indirectly, the resistance characteristics.
Conversely, the maximum density of the samples is abnormally high compared to the densities of samples of similar mixtures made from conventional aggregate. This increase in density is obviously due to the use of EAFS for their conformation, which is not a problem in principle, but is a detail to be taken into account in their proportioning, storage and transport. The maximum density decreases with the increase in the percentage of bitumen, which is to be expected, as the density of bitumen is much lower than that of EAFS.
Finally, the void content results are high for all groups, with all of them being higher than 20%. This fact, far from being a disadvantage, is one of the properties pursued by the present study, since a high content of voids in the bituminous mixture means a greater drainage capacity of the pavement in rainy periods, and at the same time, provides an excellent macrotexture. This macrotexture, together with the resistance of the EAFS, gives the wearing course a high level of safety. Also, the fact that it has a high content of voids in the bituminous mixture conditions the comfort of the road, since it absorbs the noise produced by the contact between the tire and the pavement. The disadvantage of a higher void content derives from the possible collapse of the bituminous mixture due to freezing and thawing cycles, or from the introduction of clayey material into the voids, i.e., problems caused by the loss of particles and breaking. This usual disadvantage in discontinuous bituminous mixtures with bitumen emulsion is compensated for with a higher percentage of bitumen provided by the CFP.
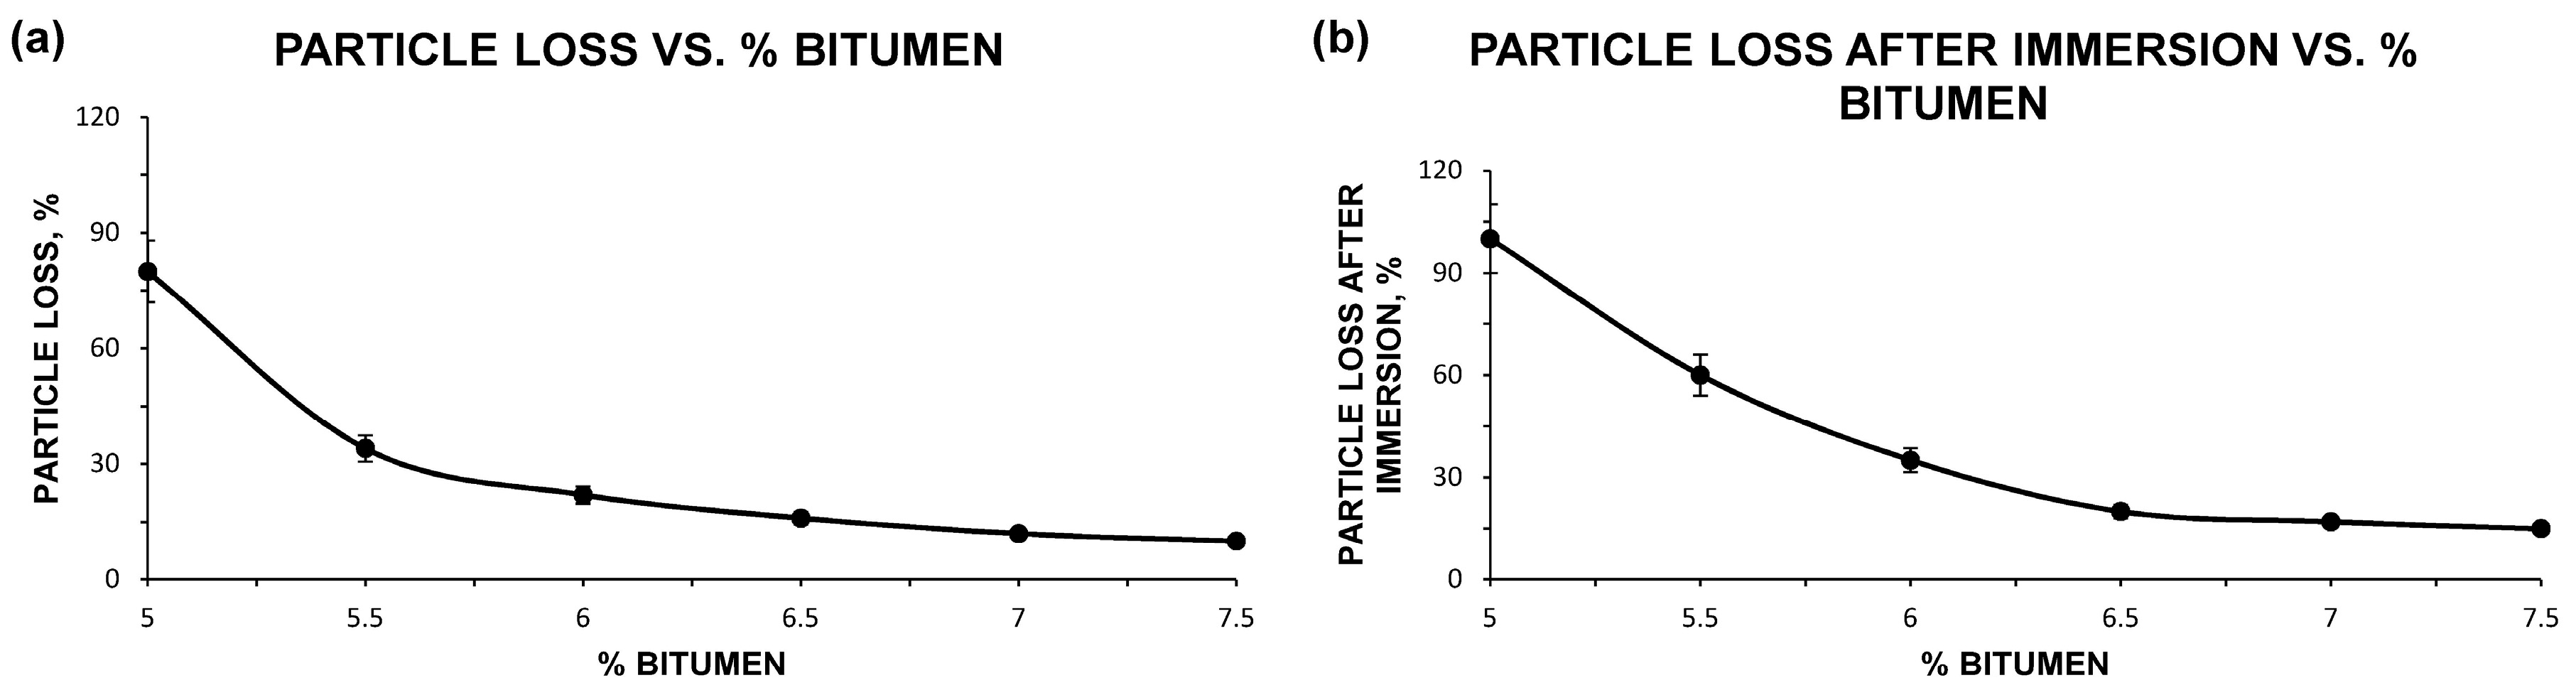
Once the good results of their physical properties were obtained, the loss of particles was evaluated, as mentioned previously, in order to study the influence of this high content of voids. The particle loss test was also carried out with a substantial modification in its procedure, namely with the immersion of the samples in water at 45 ± 1 °C for 24 h after curing and before testing. This test modification is shown in the NLT-362/92 standard and allows for an accurate evaluation of the adhesivity of the emulsion and the aggregate, as well as the influence of such a high percentage of void content. The values of the test results of the samples of each family, after their curing process and for the loss of particles without or with immersion, are detailed in
Figure 6.
The results of the nonimmersion particle loss test reflect a significant decrease for wear loss of dry bituminous mixtures with the addition of higher percentages of emulsion. This fact is logical if we think that a higher percentage of bitumen will enable a better coating of the aggregate and will also support better external loads.
As established in the Spanish regulations for this type of bituminous mixture with discontinuous grading, values lower than 25% are acceptable for this test [
47]. The values from the A12F6.0 group are therefore acceptable results, with a percentage of bitumen of approximately 6%.
Conversely, subjecting the samples of the different groups to the conditions of the loss of particles test after immersion leads to worse results than the loss of particles test without immersion, with the loss being greater by this method in all groups of samples. If we take as a reference what is established by the Spanish regulations and value the bituminous mixture from a safety perspective, then only the A12F6.5, A12F7.0 and A12F7.5 groups have produced results lower than 25%, with these percentages being that to which the field of action is restricted. In the groups indicated as suitable, the difference between particle loss without immersion and after immersion is relatively low. This fact confirms the effectiveness of the bituminous mixtures obtained.
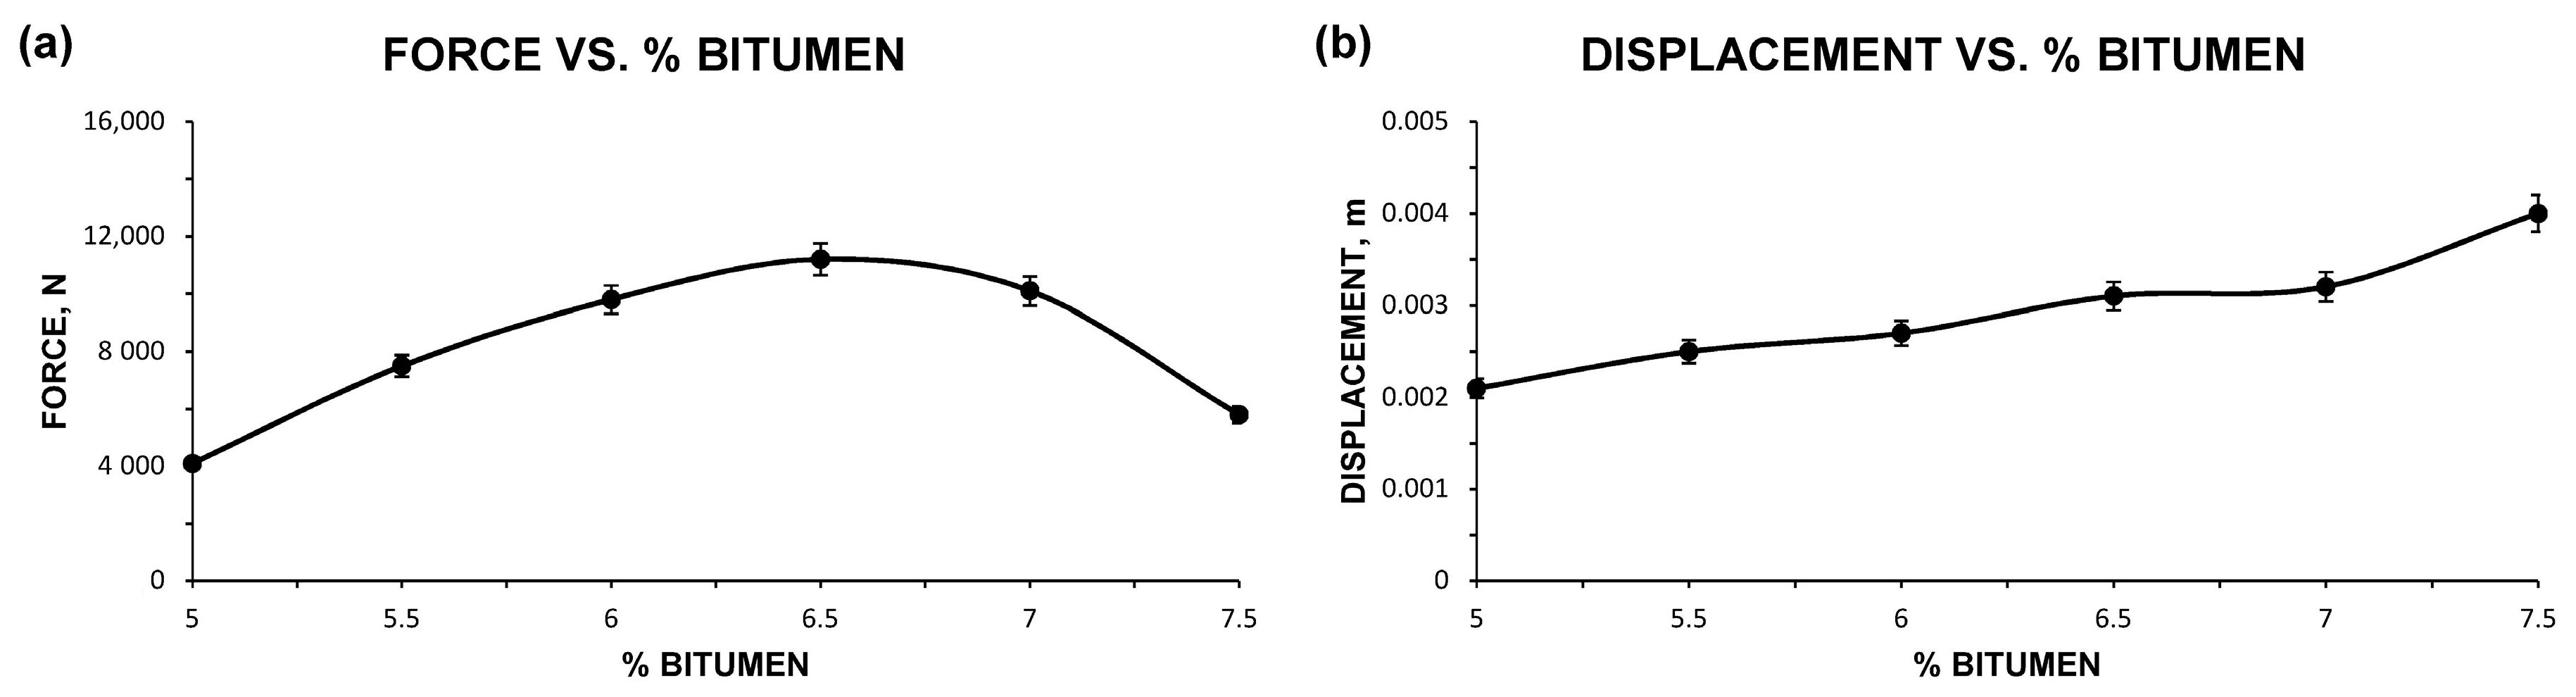
Finally, in order to fully characterize the bituminous mixture, a Marshall test was carried out on all the groups of samples. It should be noted that an increase in the percentage of bitumen will create a bituminous mixture that loses less particles due to wear, however, a higher percentage of bitumen can create important plastic deformations that are totally unacceptable. It is therefore the Marshall test that assesses this characteristic for all sample groups. The results of the Marshall test are shown in
Figure 7.
First, it should be noted that the flow is obviously increasing with the percentage of bitumen added, but that all flow values are acceptable and even reduced compared to other types of bituminous mixtures. Conversely, and as established in the Spanish standards [
47], a bituminous mixture with discontinuous grading or porous asphalt must provide a stability value in the Marshall test in excess of 7500 N. Based on this, it can be stated that all groups, with the exception of the first A12F5.0 and the last A12F7.5, are suitable according to this test and this limitation, even if they have very high percentages of bitumen in bituminous mixture and are impossible to carry out without the incorporation of CFP in bituminous mixture.
In addition, all bitumen mix samples after the Marshall test showed that the cellulose fibers were perfectly distributed, without agglomerations and coated with bitumen.

 ,
, 


