Au Doping ZnO Nanosheets Sensing Properties of Ethanol Gas Prepared on MEMS Device

Department of Mechanical Engineering, Southern Taiwan University of Science and Technology, Tainan 710, Taiwan
*
Author to whom correspondence should be addressed.
Coatings 2020, 10(10), 945; https://doi.org/10.3390/coatings10100945
Submission received: 31 August 2020
/
Revised: 25 September 2020
/
Accepted: 28 September 2020
/
Published: 30 September 2020
(This article belongs to the Special Issue Advances in Thin Film Transistors: Properties and Applications)
Abstract
:Sensitivity of the Micro Electro Mechanical System (MEMS) device ZnO nanosheets sensor and the Au doped ZnO nanosheets sensor has been investigated. The ZnO samples have been prepared using Hydrothermal synthesis at 90 °C. The prepared ZnO nanostructure is tested for structural morphology and crystallinity properties. The elemental analysis of the ZnO sample and Au–ZnO samples are tested by using Energy Dispersive X-ray Spectroscopy (EDS) spectrum analysis. MEMS device microheater is designed and prepared for testing the sensitivity of Ethanol gas. Thermal properties of the MEMS microheater is studied for better gas testing at different temperatures. Both the ZnO nanosheets sensor and Au doped ZnO nanosheets sensor are tested using Ethanol gas, and the gas concentrations are taken to be 15, 30, 45, and 60 ppm at 300 °C. The gas sensing response of pure ZnO nanosheets tested for ethanol gas at 60 ppm showed 20%, while the Au–ZnO nanosheets showed 35%, which is increased by 15% at similar operating conditions.
1. Introduction
Semiconductor gas sensors are widely used in today’s scenario for the detection of harmful and poisonous gases. Among the different kinds of sensors used for gas detection are resistive gas sensors [1], capacitive gas sensors [2], and electrochemical sensors [3], while most of the ongoing studies are concentrating on semiconductor gas sensors. This kind of gas sensor utilizes the porous sintered material body which comprises of polycrystalline particles of the metal oxide used for the gas sensor [4]. Nowadays, semiconductor gas sensors are widely used in many industries and public homes as gas leak detectors and alarms. Usually, any gas sensors have mainly two basic functions: (i) the recognition of the objective gas to that of the other gases, which is a function of the receptor, and (ii) to transduce the recognized gas to a concentration dependent output signal [5]. So, in the case of semiconductor gas sensors, function of the receptor is provided by the objective gas interaction with the semiconductor material and surface adsorption of the objective gas on the surface of the semiconductor. Function of the transducer is dependent on the metal oxide band structure and also on the coagulated structure of microparticles [6].
Most research studies consider metal oxides semiconductors as the sensing materials for developing gas sensors. There are different kinds of metal oxides for gas detections like ZnO [7], SnO2 [8], In2O3 [9], Fe2O3 [10], and TiO2 [11]. Among these metal oxides, ZnO thin films are considered mostly for developing the gas sensor [12,13]. The main reason is due to the easy availability and easy deposition methods. ZnO is an n-type semiconductor that is thermally and chemically stable. ZnO has large bandgap energy (3.37 eV) and large excitation binding energy (60 meV) [14]. ZnO is a promising semiconductor metal oxide due to numerous applications such as gas sensors, surface acoustic wave (SAW) devices, electrodes, etc. For the deposition process, there are so many different types of techniques for the doped and undoped deposition processes. Some of the processes include hydrothermal synthesis, sol-gel process, sputtering, PECVD, dip coating, etc. [15]. Different types of ZnO nanostructures like ZnO nanorods, ZnO nanowires, ZnO nanoflowers, etc., are prepared for the gas sensing processes. Most of these preparation processes use Solid-Liquid-Vapor (SLV) technique and thermal evaporation techniques which require temperatures of more than 900 °C [16,17]. The current study uses Hydrothermal synthesis of ZnO deposition, in which ZnO can be successfully synthesized at 90 °C. Hydrothermal synthesis is a one-step synthetic procedure and is an environmentally friendly process. From recent studies, metal oxide semiconductor sensitivity can be enhanced with the addition of noble metals as a doping agent [18], as well as the deposition of bi-layered or double layered metal oxides [19]. Metal doping has proven to be an important factor in enhancing the gas sensing response, as these doping agents change the band energy structure, changing the morphology and increasing the surface-to-volume ratio for more gas interaction [20]. In the current study, Gold (Au) doping is chosen. The band gap of Au doped ZnO has proven to be lower than bare ZnO, which shows Au doped ZnO is more electrically active than bare ZnO due to the availability of more free electrons as donors [21]. Li [22] revealed that the doping of ZnO with Au and Y elements has increased the sensing response of acetone substantially when compared to bare ZnO and Au–ZnO, which are prepared by the facile wet chemical method. Lai [23] used the electrospinning process to develop combined nanostructures of ZnO and SnO2 along with Au doping, proving the improved gas sensing response of ethanol. Huang [24] developed the ZnO sensor with 2 metal dopants like Au and Pd, which can detect the ppb levels of acetone gas with enhanced sensitivity. It is clear that the noble metal dopants can enhance the sensing properties of semiconductors with different preparation methods.
In this study, Ethanol gas was chosen to test the sensitivity of the gas sensor. Volatile Organic Compound (VOC) gases are attracting many researchers for their harmful nature and wide variety of gases. These gases have to be monitored for environmental safety and public safety. Ethanol gas is one of the most important and common VOC gases that needs to be detected during leakage, or in the case of a drunk driving test [25]. Most of the ethanol gas detection sensors are coated with metal oxide semiconductors due to advantages like easy availability, non-toxic, high sensitivity, and being a stable compound.
The current study implemented the hydrothermal synthesis for the deposition of doped ZnO with Au noble metals. The study was conducted to compare the gas sensing response of the ZnO sensor to that of the Au doped ZnO sensor. As mentioned, the detection gas was chosen to be ethanol gas. The maximum gas concentration was chosen to be 60 ppm in order to prepare a gas sensor to have maximum sensing response with low gas concentrations.
2. Materials and Methods
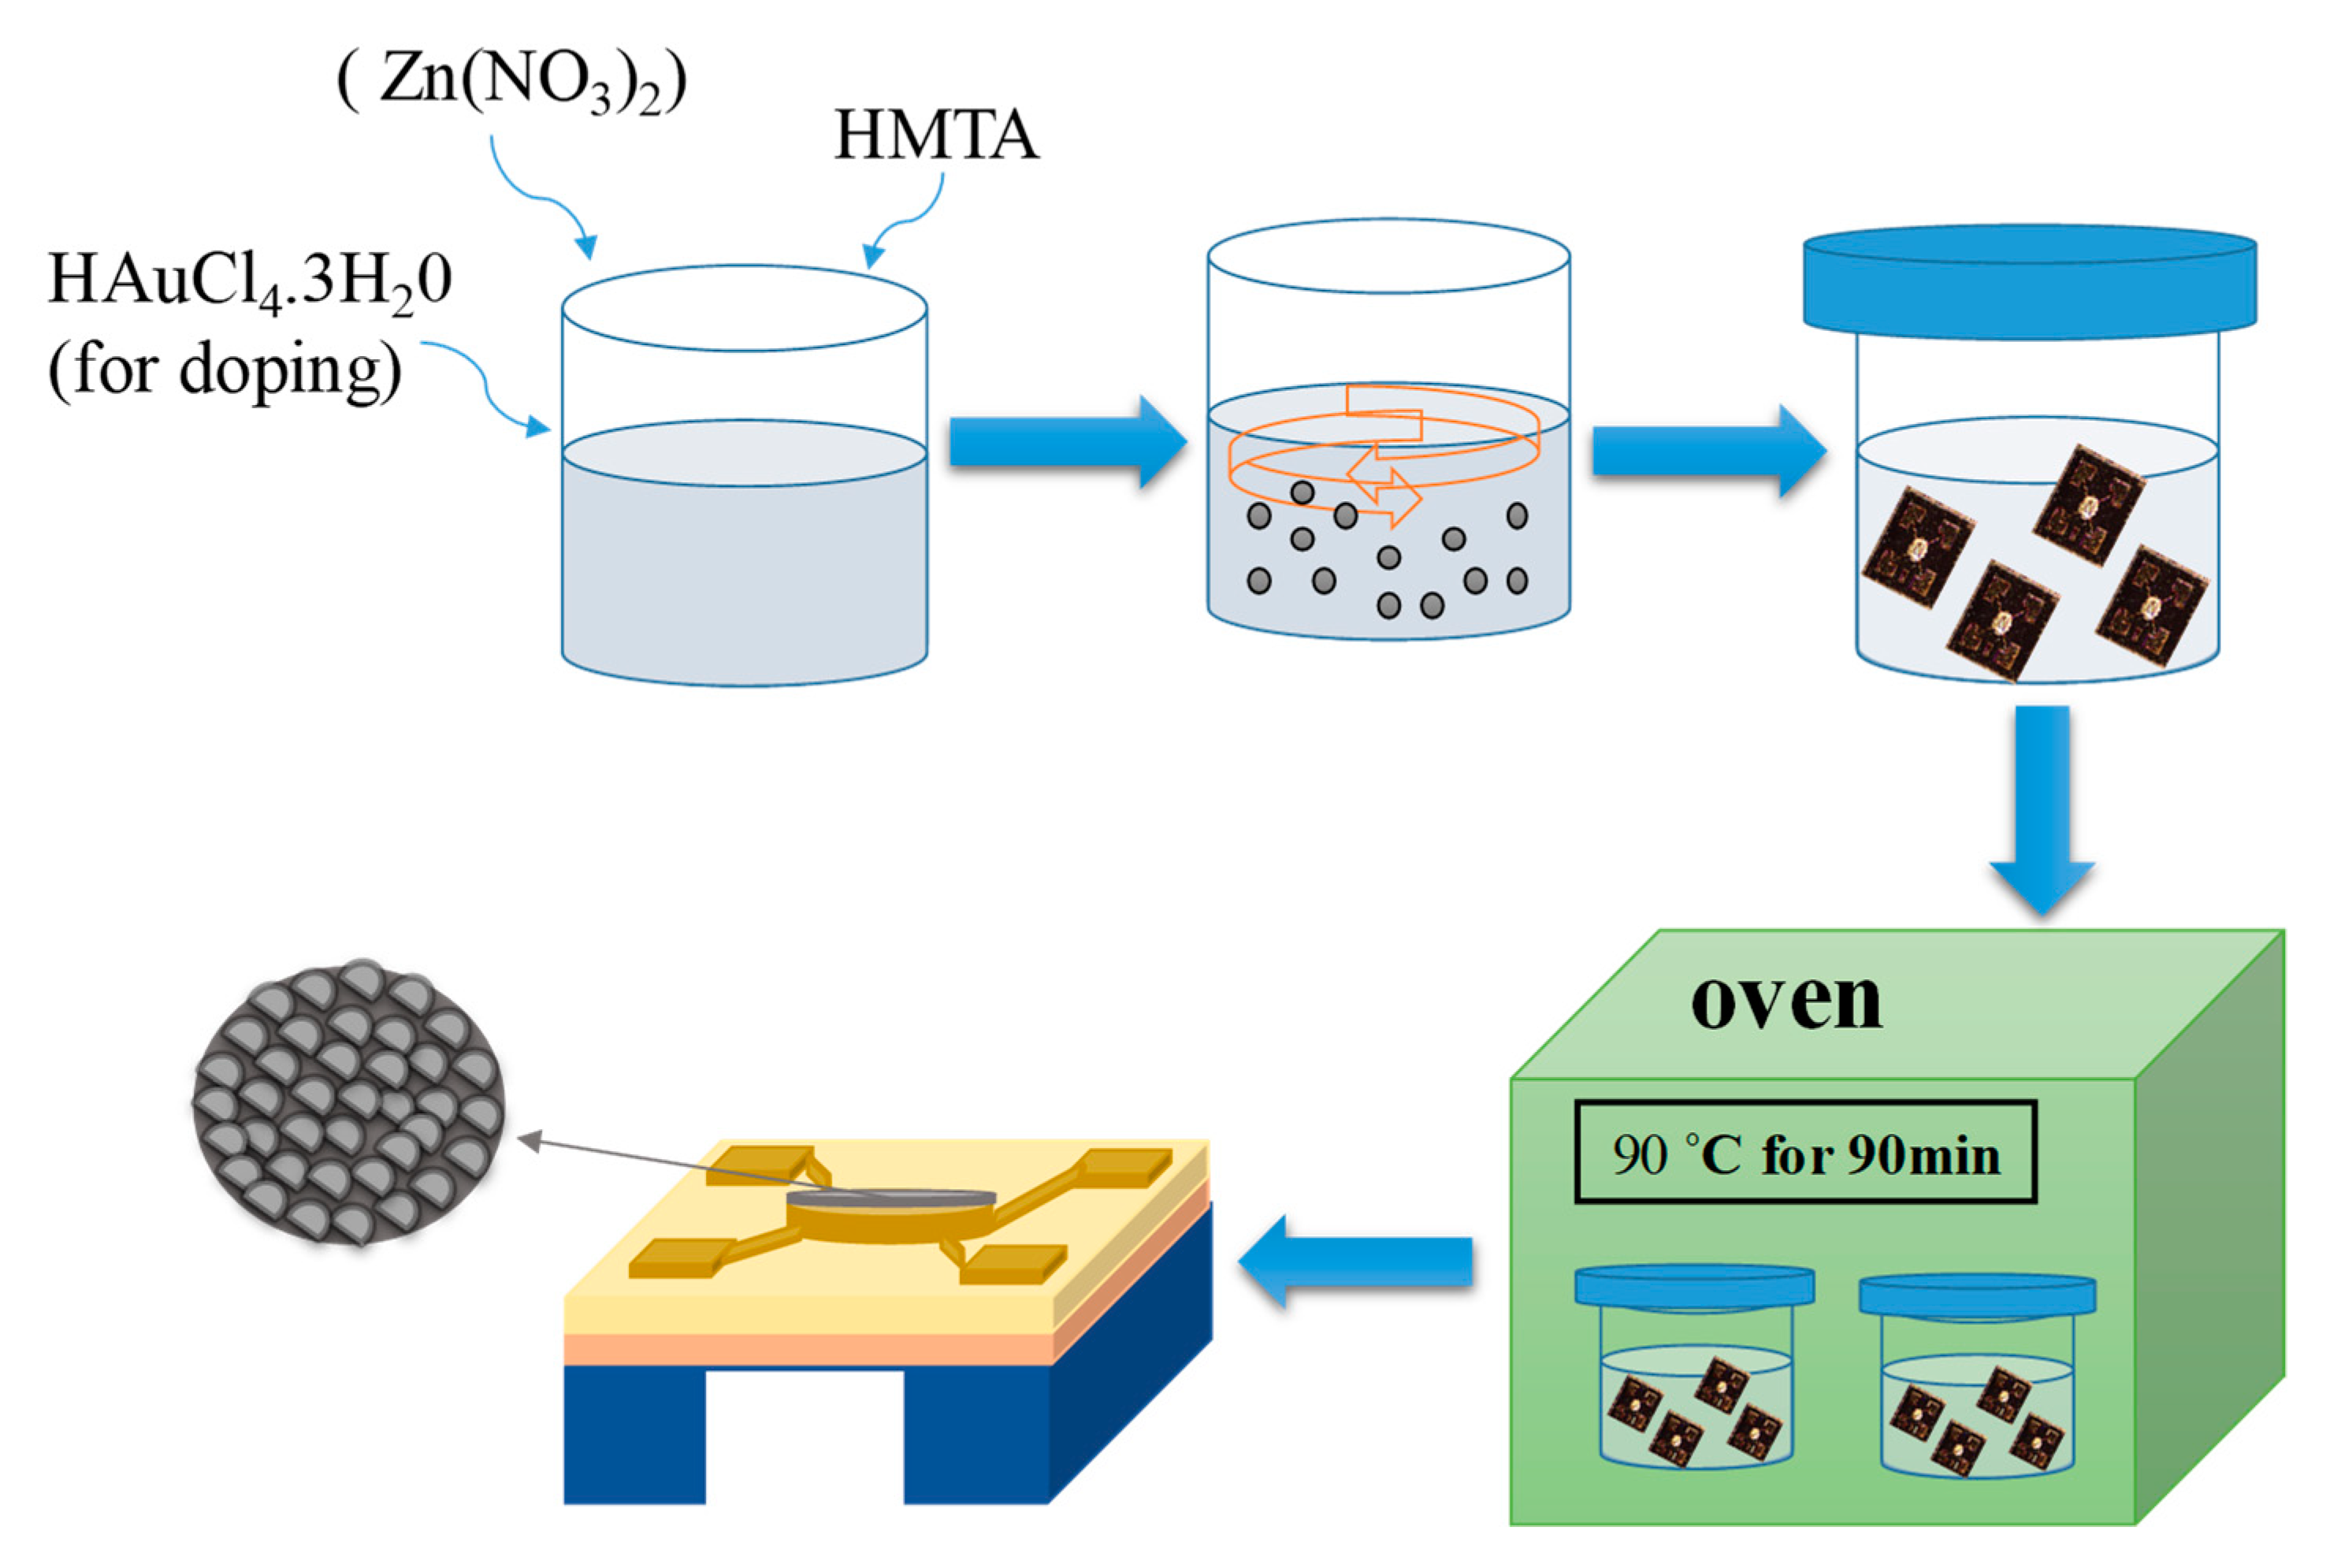
Hydrothermal synthesis is the process chosen for the deposition of ZnO nanostructure. The primary materials for the formation of ZnO are Zinc nitrate hexahydrate (Zn(NO3)2·6H2O) and Hexamethylenetetramine (HMTA/C6H12N4). In aqueous solutions containing 0.06 M of each Zn(NO3)2·6H2O and HMTA are taken in a laboratory bottle. Thin films and the MEMS microheater (Taiwan Semiconductor Research Institute (TSRI), Tainan city, Taiwan) in which the ZnO structure has to deposit, have to be placed inside the bottle. The prepared bottle is placed in a heating oven at 90 °C with the time set at 90 min. After the designated time, the ZnO nanostructure is deposited over the thin film, and the same process is repeated for the deposition of ZnO nanostructure on MEMS microheater. For the case of Au doping, Gold (III) chloride trihydrate (HAuCl4·3H2O) solution is added to the mixture of Zn(NO3)2·6H2O and the HMTA solution in a laboratory bottle. 0.0018 M of Au solution is considered for the doping. The entire process of hydrothermal synthesis is shown in Figure 1. After the ZnO and Au doped ZnO deposited on the microheater, the samples were annealed at 500 °C temperature using a Rapid Thermal Annealing (RTA) machine (Premtek, Hsinchu city, Taiwan).
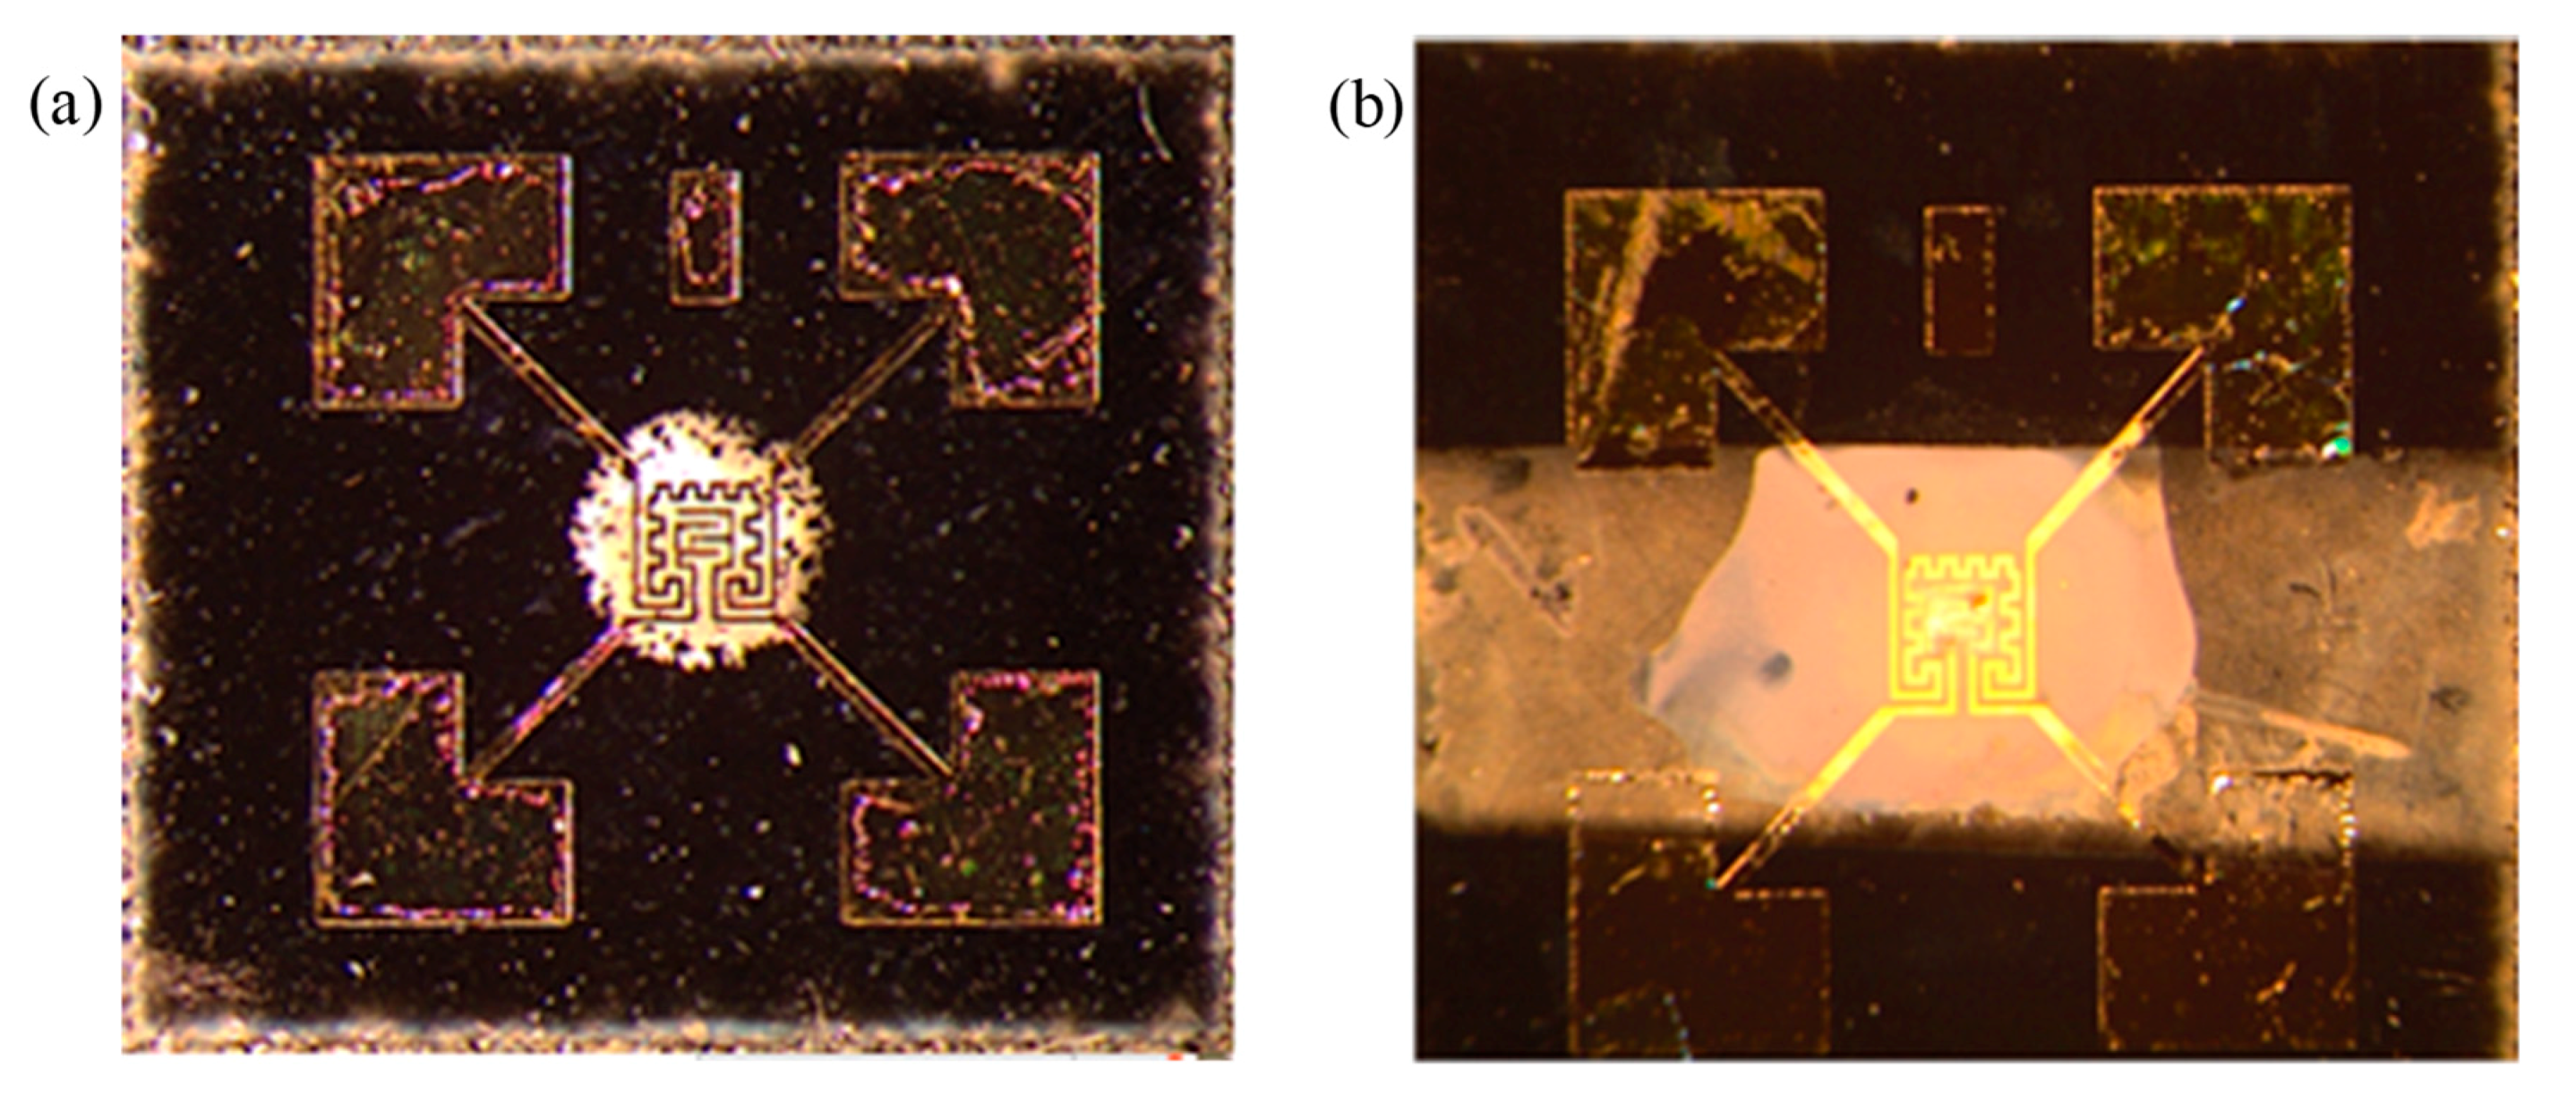
MEMS microheater is one of the important devices in gas sensing. For the current study, a MEMS microheater is designed in CAD 2D software (2012 version) and fabricated by semiconductor processes. The device dimensions are of 3700 × 3700 μm2 from electrode to electrode, and the sensing area dimension is 800 × 800 μm2. The outline of the fabricated microheater is shown in Figure 2a. The ZnO nanosheets deposited the sensing area with microheater is shown in Figure 2b. The four electrodes of microheater are made of Gold (Au) and Titanium (Ti), which are deposited using a Electron Gun machine. The resistance readings of the microheater without ZnO deposition and deposited ZnO are almost similar.
The ethanol gas is diluted to 15–60 ppm from a 2300 ppm ethanol gas cylinder. The sample was placed in the chamber and then heated at 300 °C for 60 s in an air ambient atmosphere to form a stable resistance. Notably, the sealed chamber had an inlet port connected to a gas inlet valve, and an outlet port connected to an air pump. During the gas-sensing measurements, the outlet port is closed and ethanol gas is injected into the chamber through a gas-injecting syringe. In this stage, the resistivity of the sample was measured continuously in the presence of ethanol gas and air. After the chamber was stabilized, the outlet port was opened so that the chamber could eliminate the ethanol gas. At this point, the inlet valve was opened simultaneously to introduce air into the chamber. This can form a dynamic curve of the gas measurement.
3. Results & Discussion
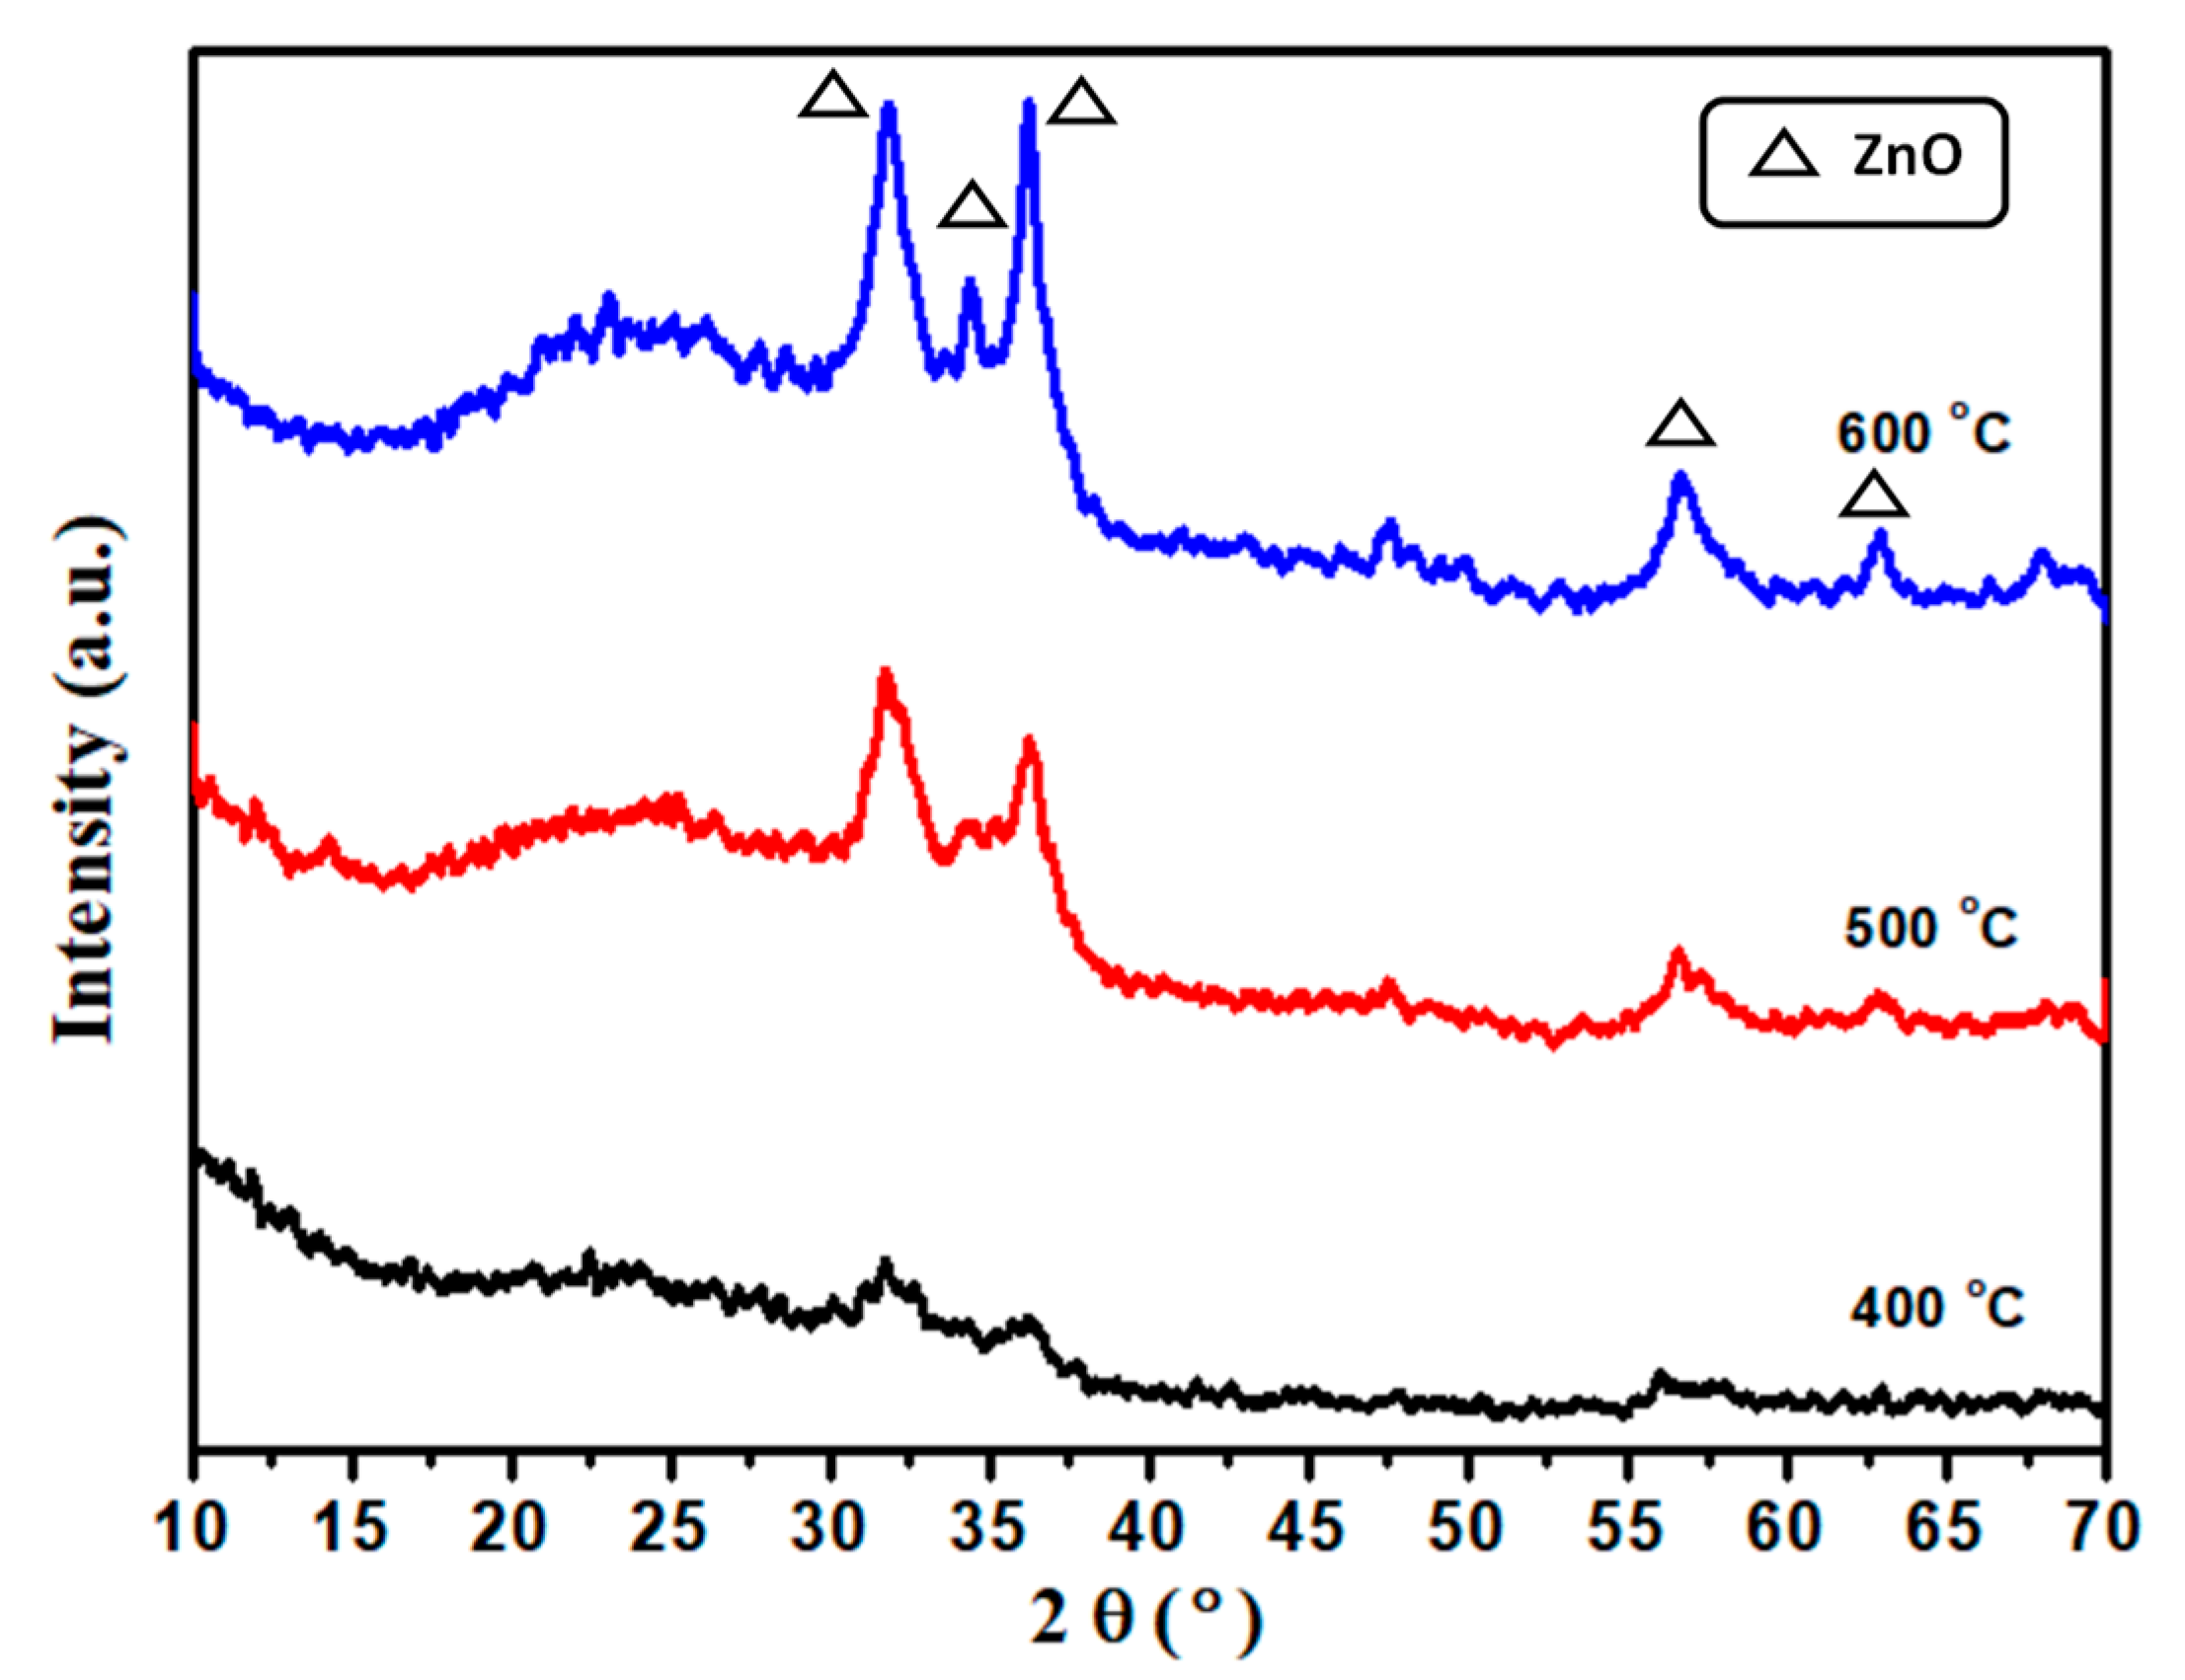
Figure 3 shows the XRD (Bruker, Hsinchu city, Taiwan) graph analysis of the ZnO sample. The samples are being heated at three different temperatures 400, 500, and 600 °C, respectively. All the samples were annealed using a Rapid Thermal Annealing (RTA) machine. With the increase in the temperatures, the ZnO peaks such as (100), (002), (101), (110), and (103) showed great improvement in the crystalline process. The XRD result of ZnO structure is in accordance to the ZnO JCPDS: 36-1451 structure.
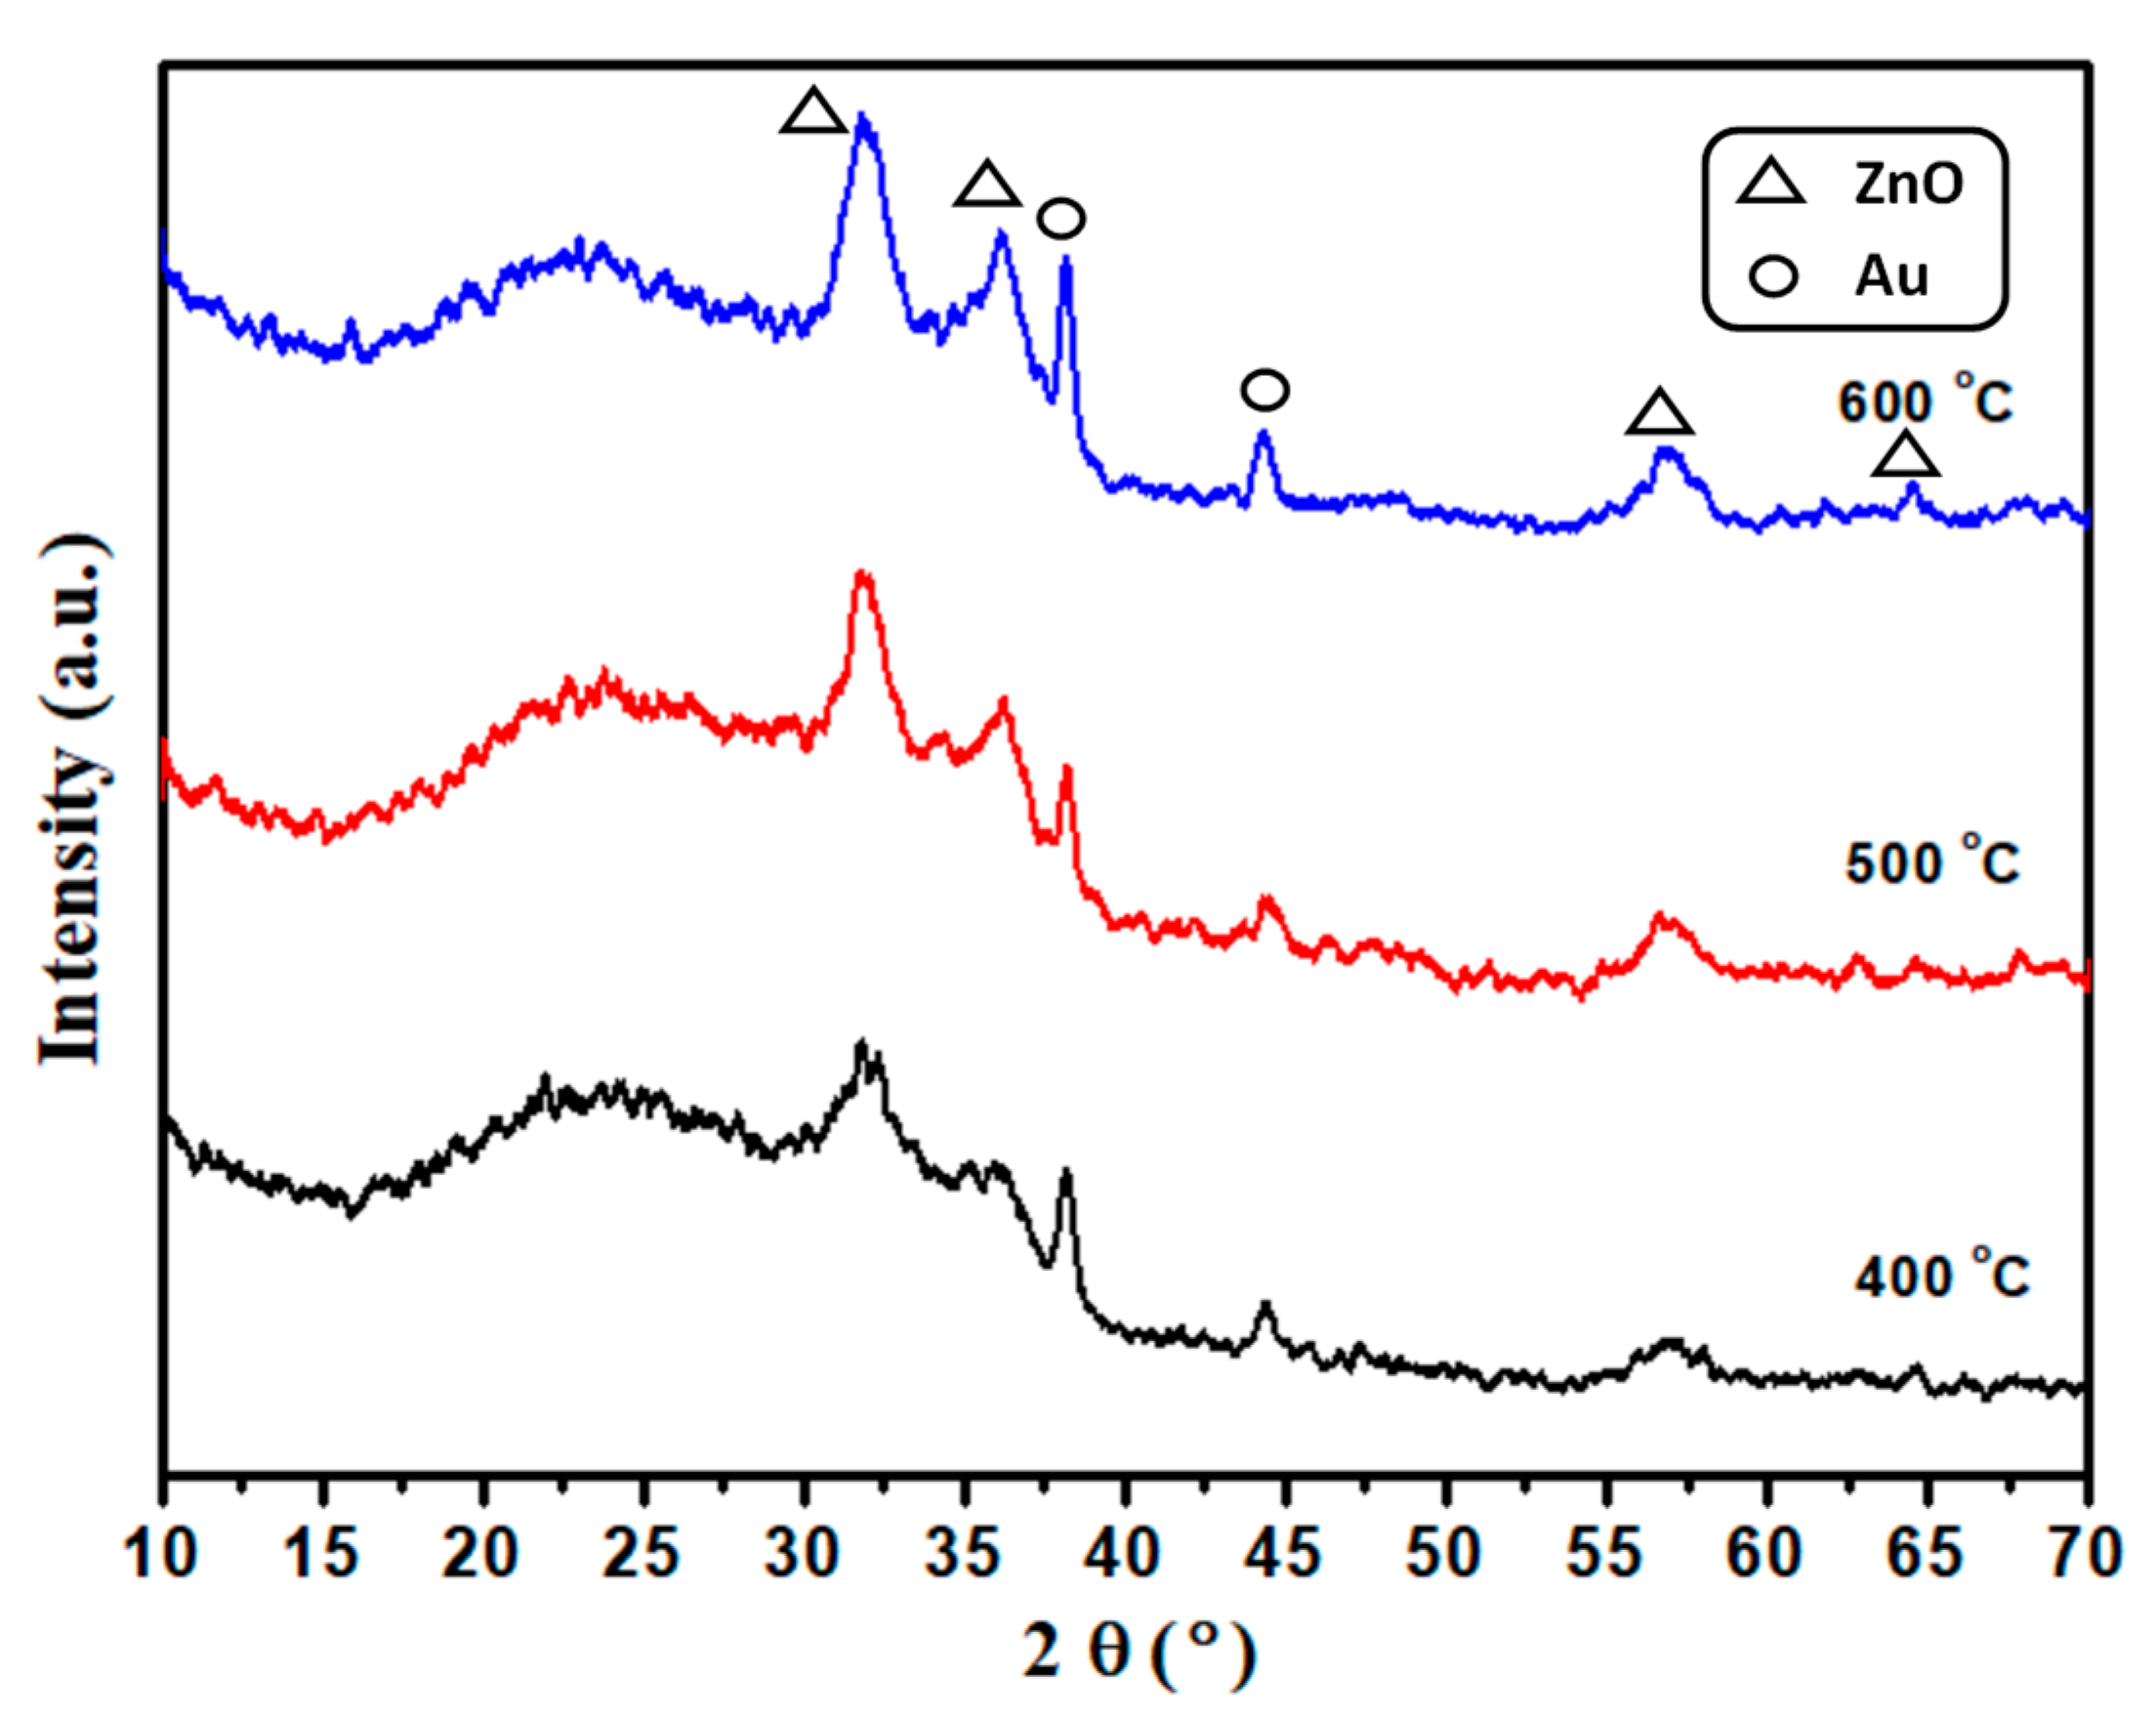
Figure 4 shows the XRD analysis of the Au doped ZnO sample. The figure represents the XRD graph Au–ZnO samples heated at different temperatures. The samples were heated at 400, 500, and 600 °C using a Rapid Thermal Annealing (RTA) machine. Similar to ZnO samples, Au doped ZnO samples with Au peaks (111) and (200) also showed good crystallinity improvement with the increase in temperature. The Au peaks in the graph is in accordance with the Au JCPDS 65-8601 structure.
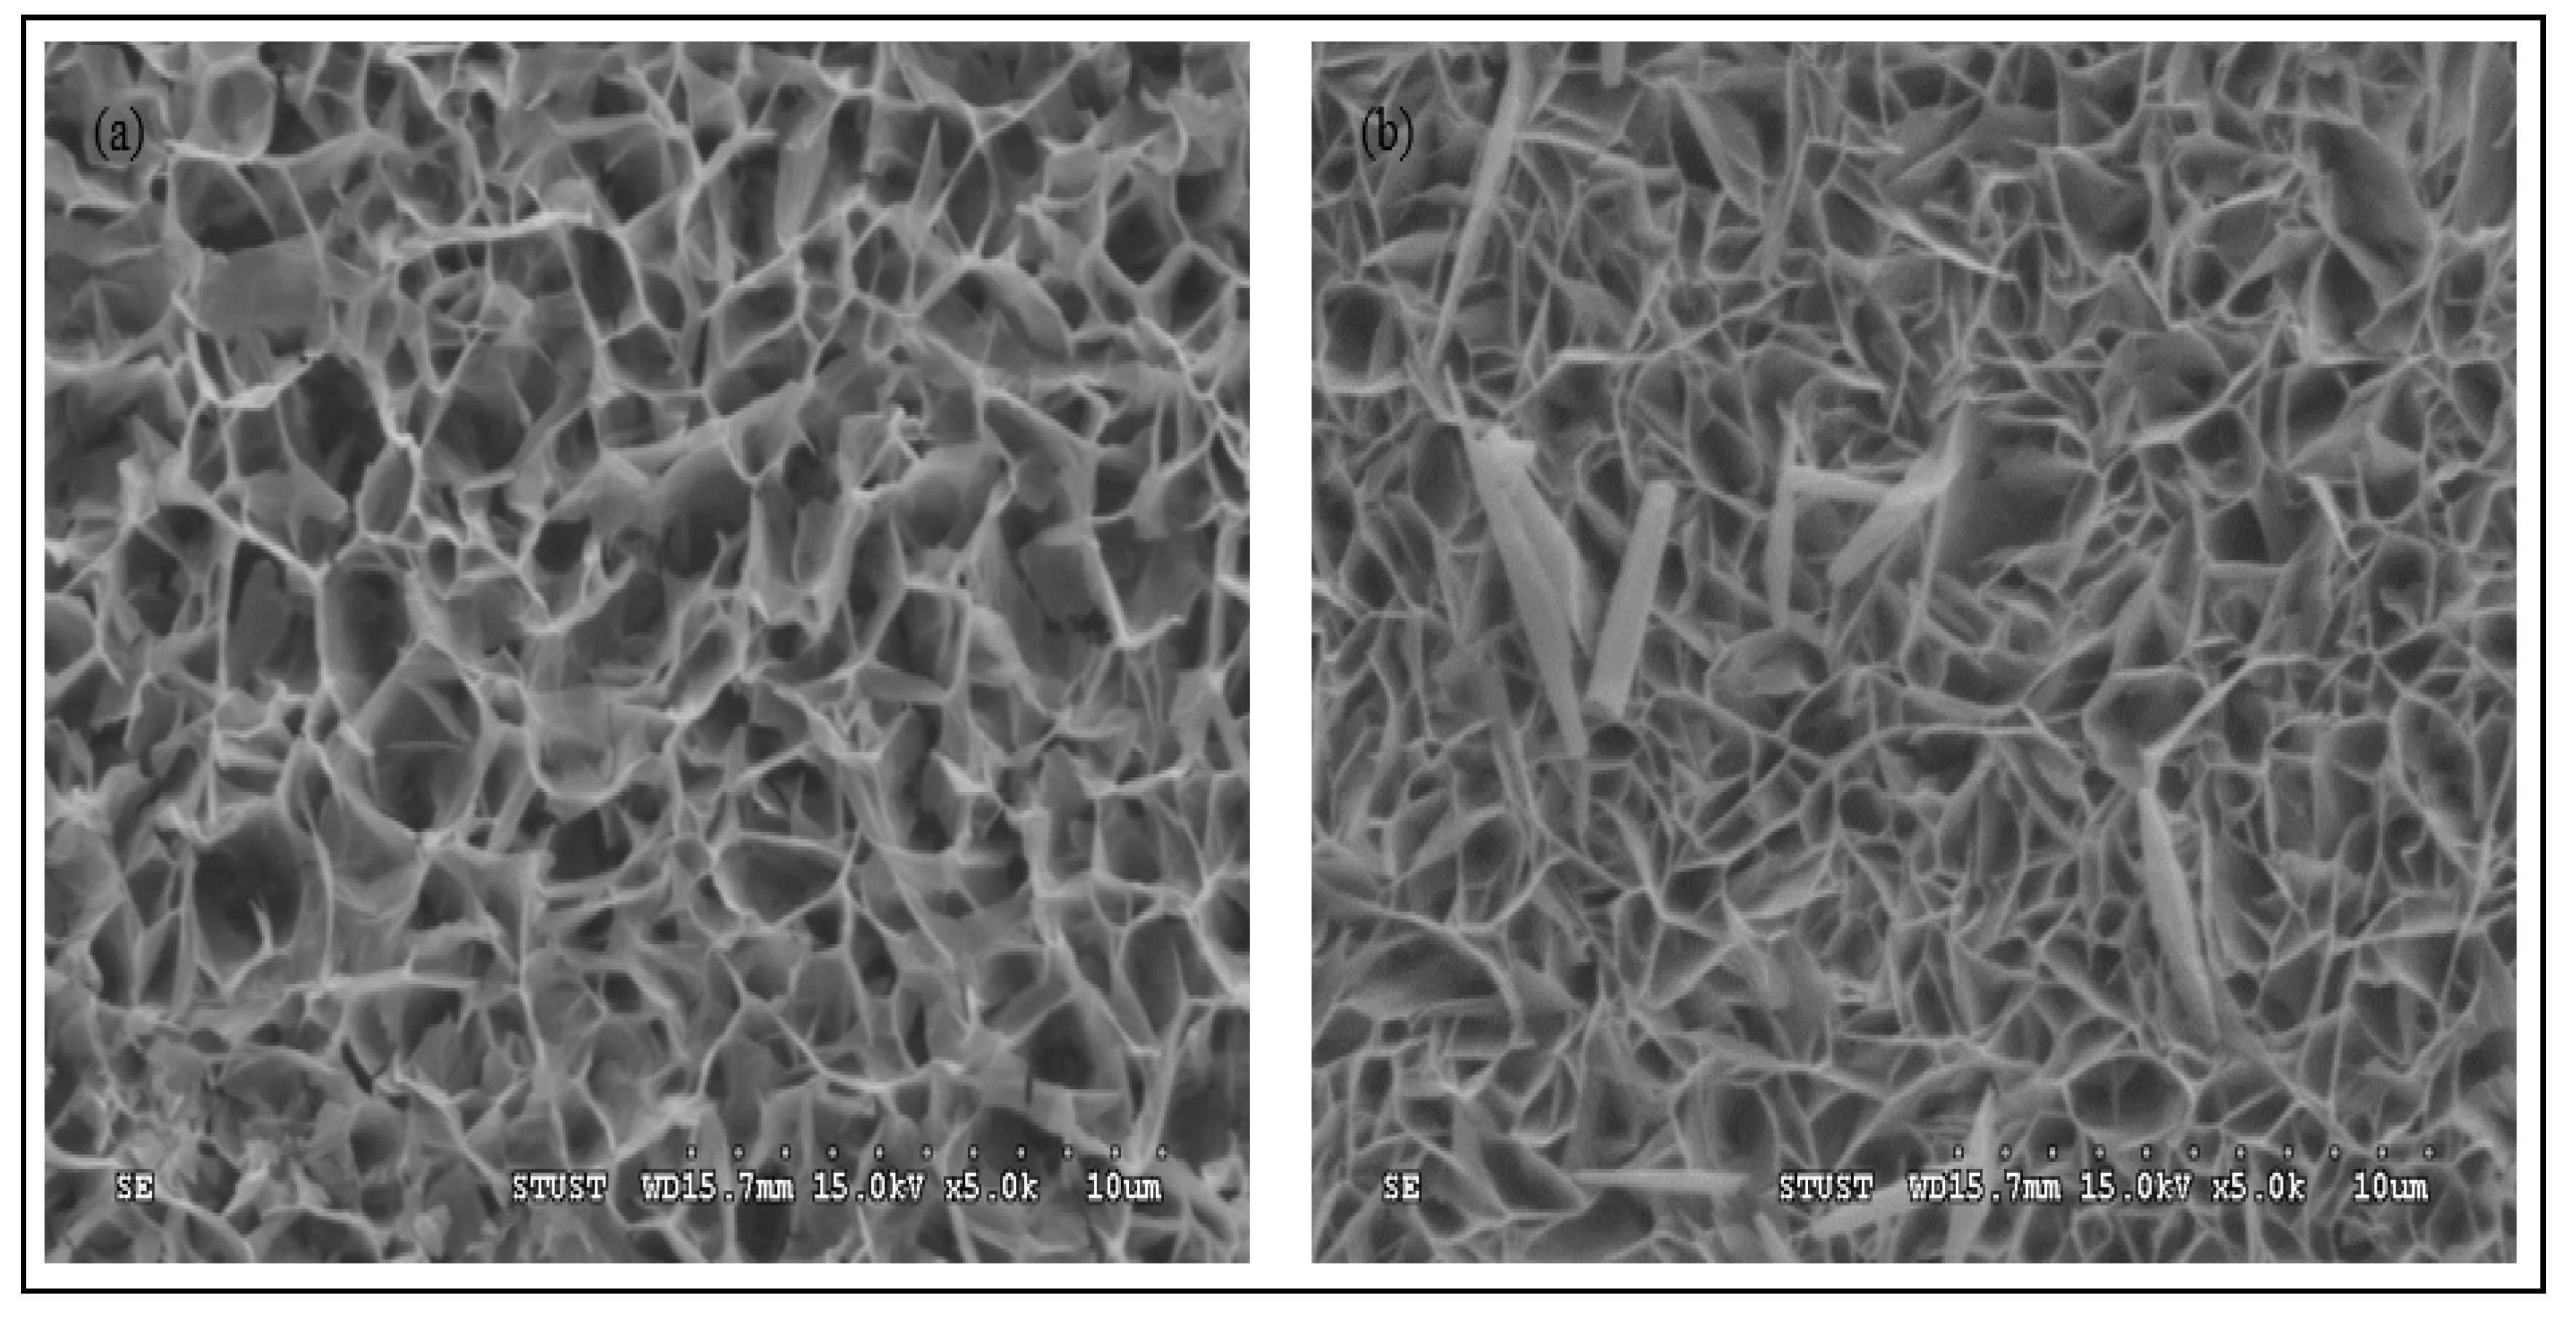
Figure 5a shows the SEM image of the ZnO sample annealed at 500 °C. The hydrothermal synthesis preparation of the sample provided good deposition of ZnO material all over the surface. The structure of the sample reminds one of a spider web type of structure. Figure 5b shows the SEM image of the Au doped ZnO sample, which is also annealed at 500 °C. Similar to the ZnO sample, the Au–ZnO sample also had a good deposition all over the surface. The Au dopant mixed with the ZnO solution formed ZnO nanorods upon heating during the hydrothermal synthesis. The ZnO nanorods are not to be seen in the pure ZnO sample is the indication of the formation of ZnO nanorods with Au doping. The structure of the Au doped ZnO is also looks like a spider web structure, but there is a shrinking among the pores which differentiates the structure between pure ZnO and Au doped ZnO samples. The pores present on both the samples will be good for the gas detection to absorb the incoming gas.
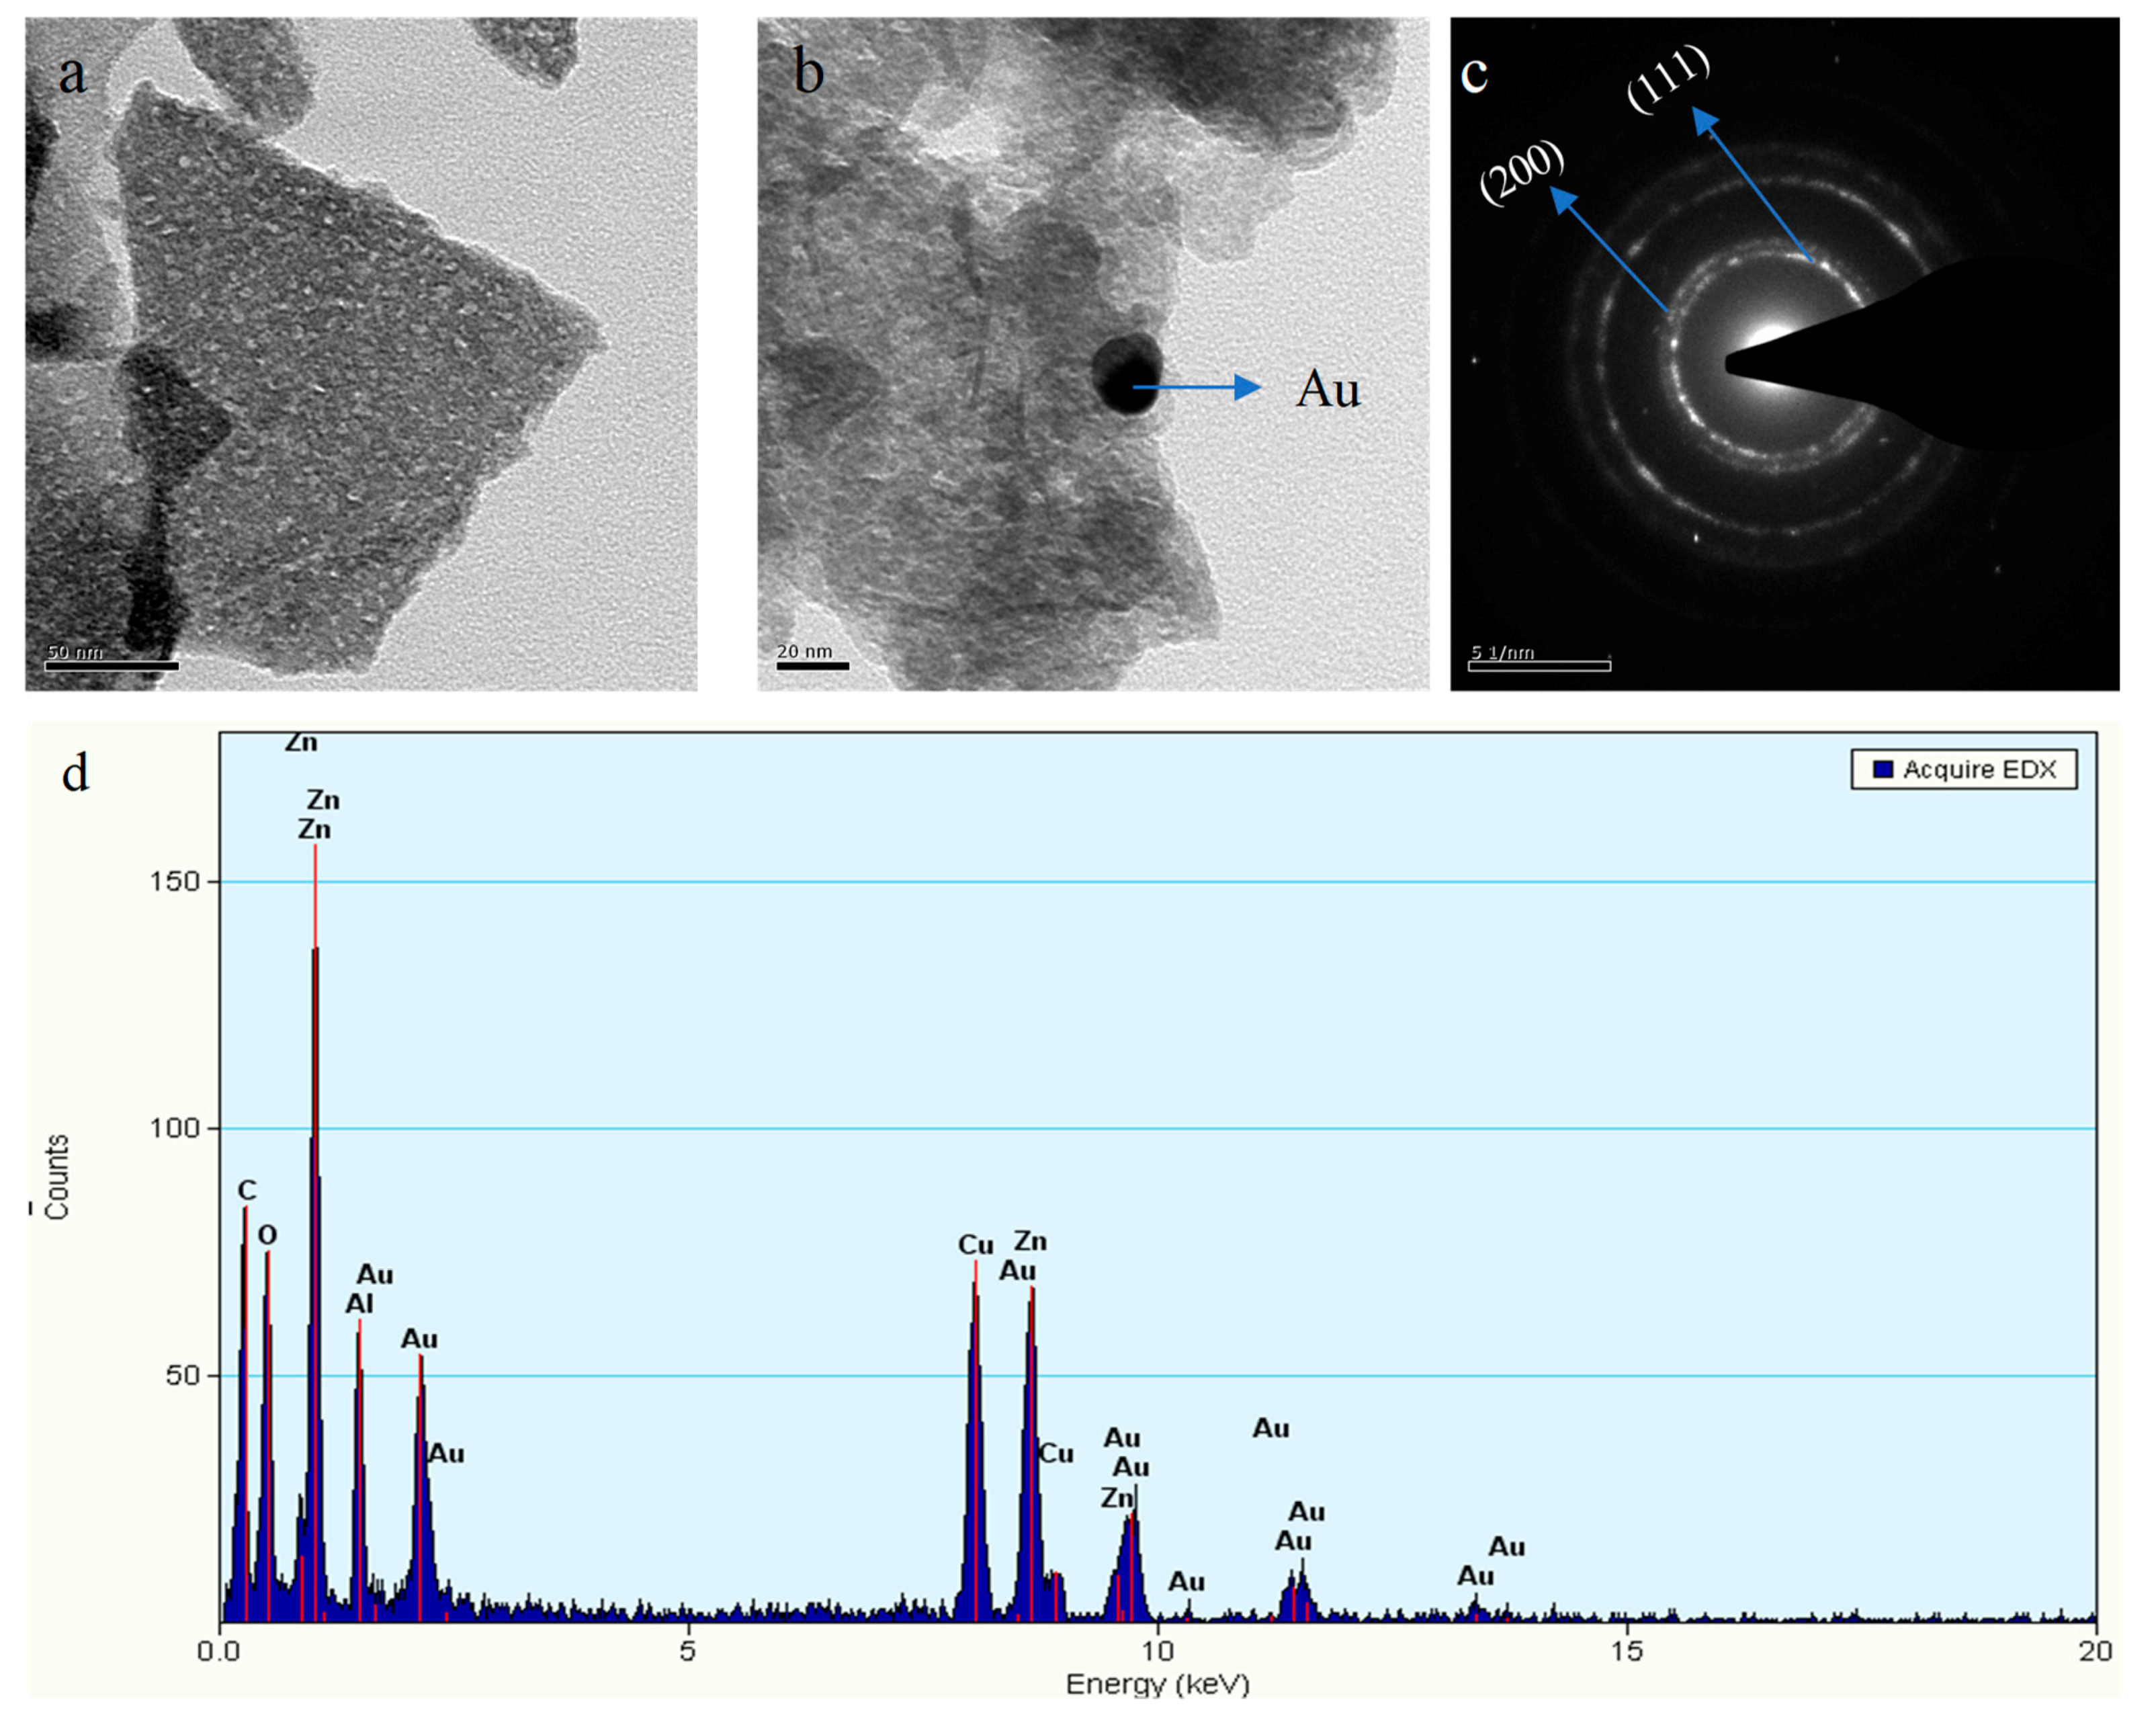
TEM analysis of the ZnO sample heated at 500 °C is shown in Figure 6a. The ZnO sample from the figure is a solid structure with rough edges. While the Au doped ZnO sample has a different structural surface, which is shown in Figure 6b, the Au–ZnO sample has smooth surface over the top and around the edges. The presence of Au is also spotted as a black mark which is spherical and homogenous, as mentioned in the figure.
The SAED pattern for the Au doped ZnO is shown in Figure 6c. The crystalline rings of the Au sample can be seen clearly, which proves the improvement of its crystalline nature in the XRD analysis. The elemental analysis of the Au–ZnO sample is shown in Figure 6d. Oxygen has more atomic weight presence in the sample, which is 49.58% and followed by the Zinc, which has an atomic weight of 23.17%. The doping agent Au has 9% atomic weight presence.
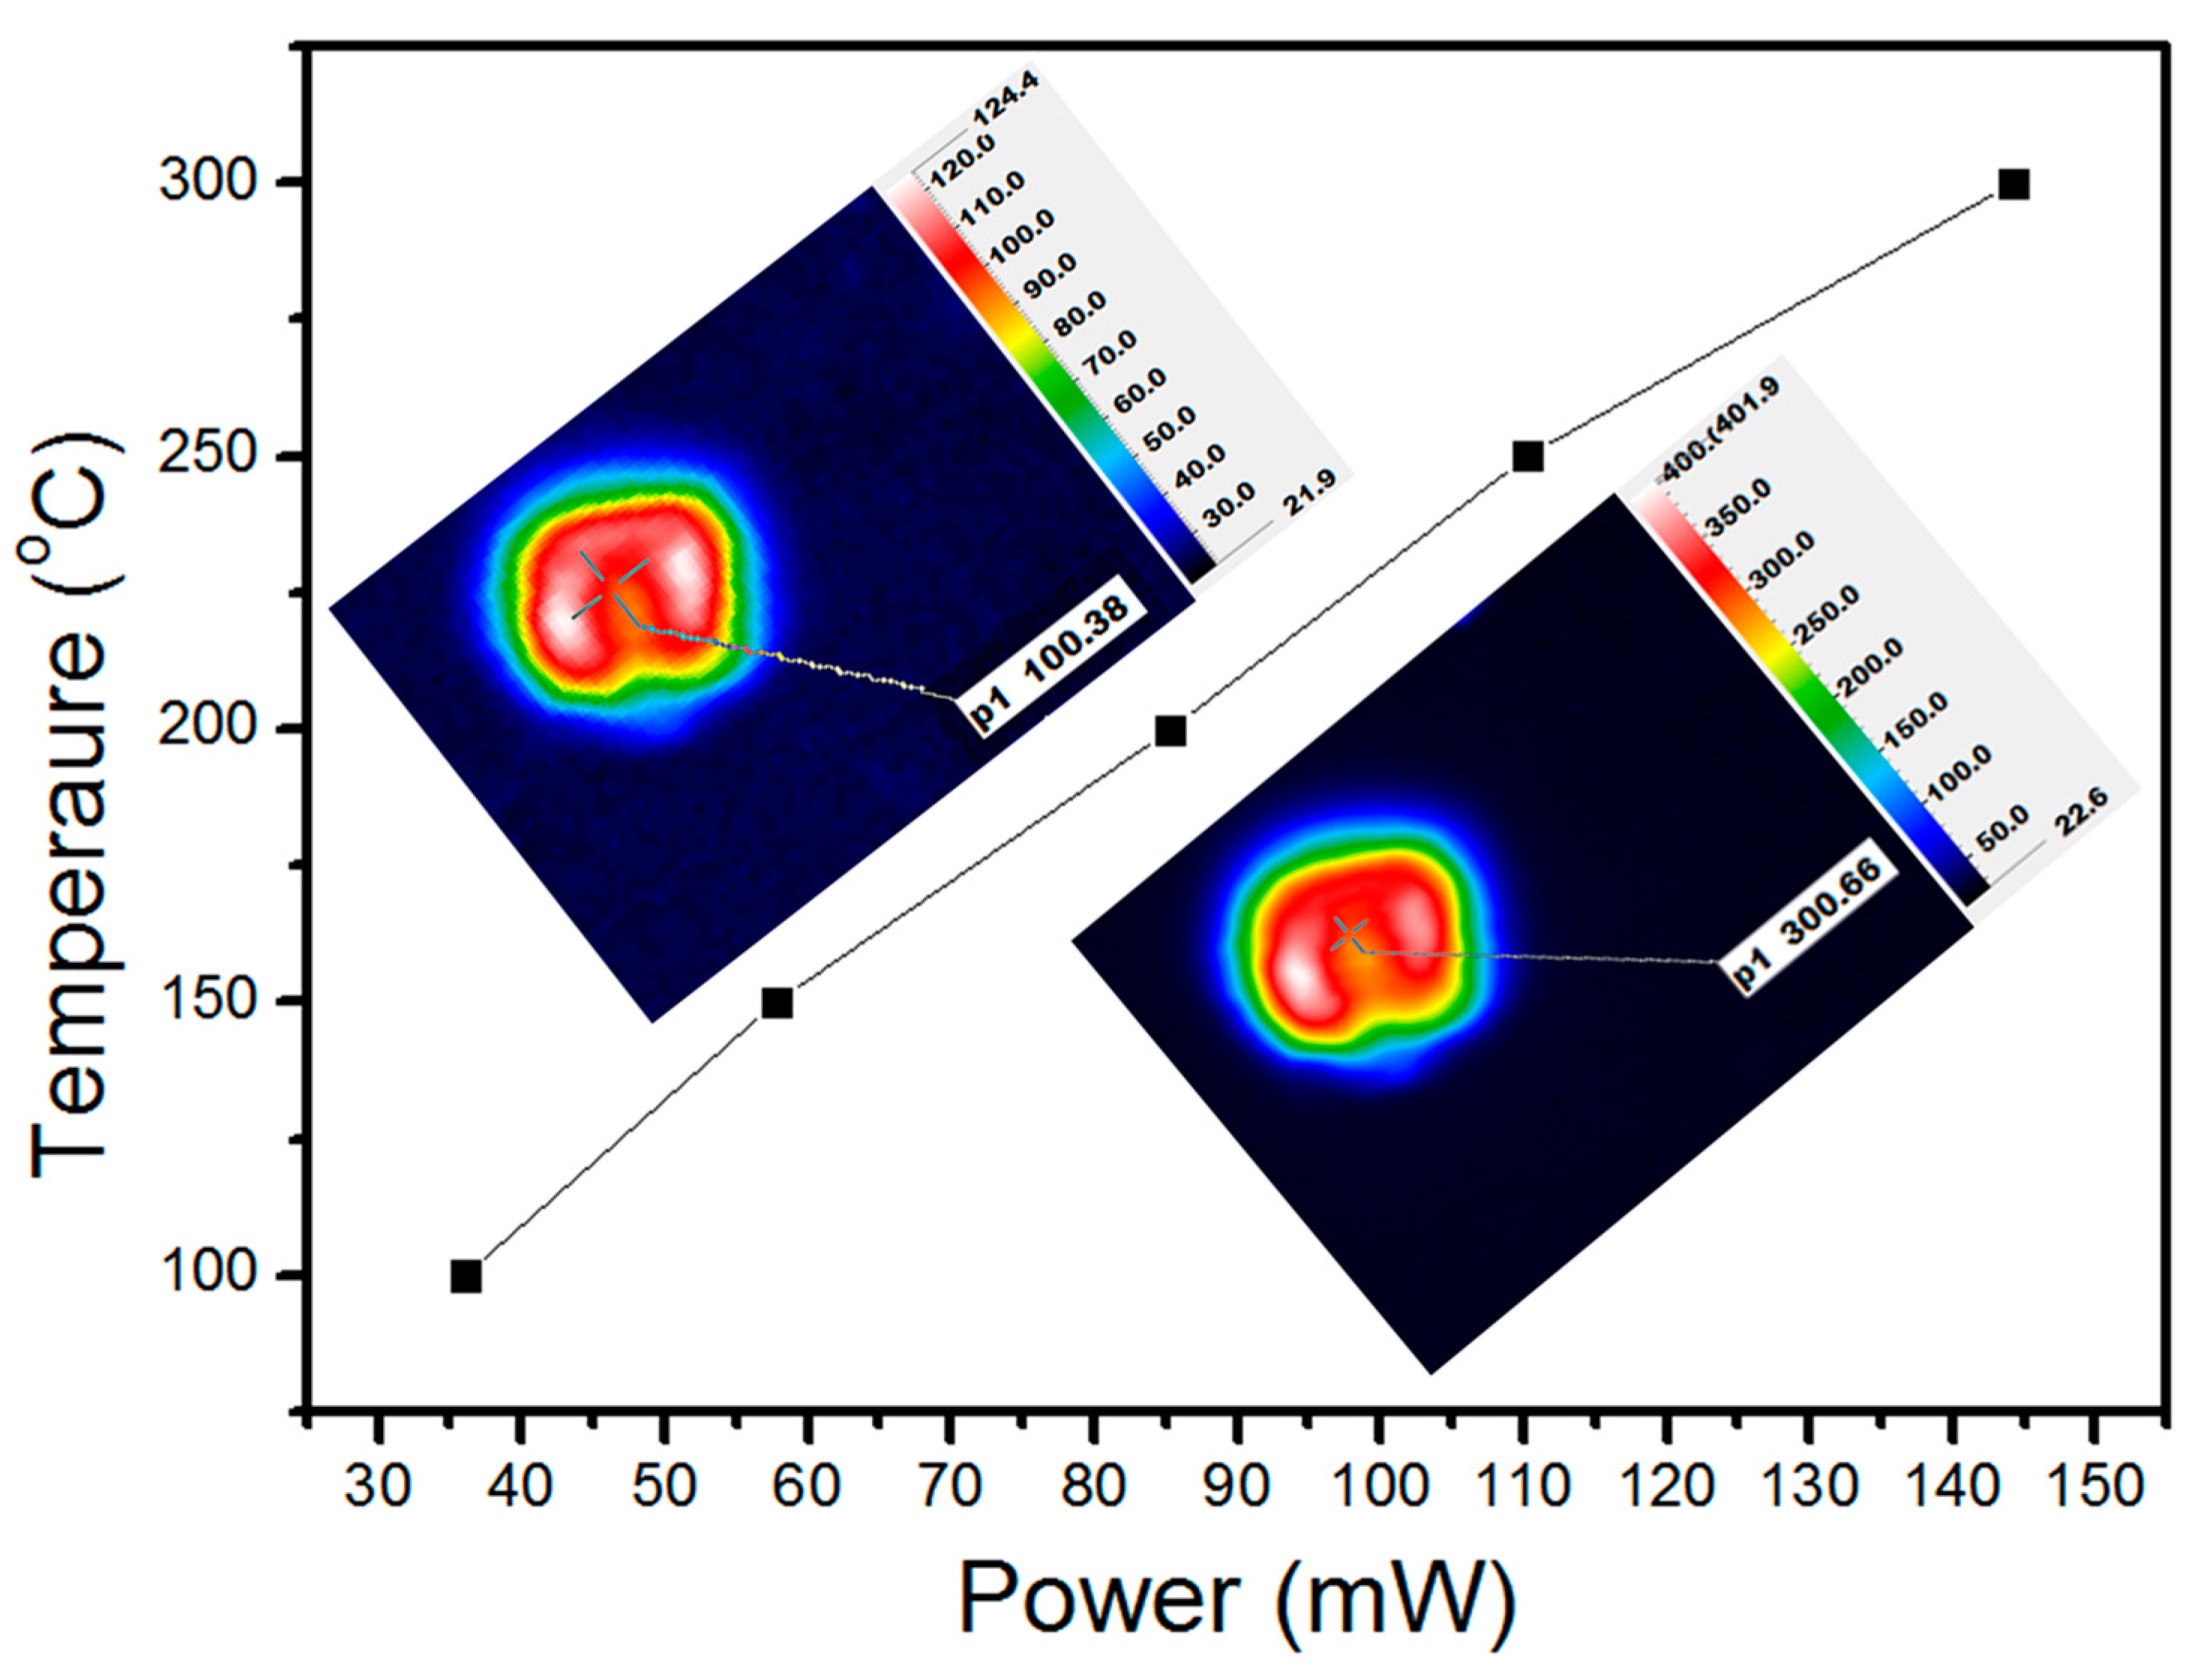
Power vs. Temperature graph of the microheater according to the Voltage ampere values are shown in Figure 7. The graph is linear, showing the constant increase of the power consumption. At 36.01 mW, the temperature of the microheater is 100 °C and at 144.21 mW, the temperature of the microheater reaches a maximum level of 300 °C. Insight pictures show the thermal images of the microheater at 100 and 300 °C. Thermal readings scale of the microheater is shown in the inset figures, which shows the temperatures of microheater at different positions. At 100 and 300 °C, the temperatures of the microheater at the electrodes are recorded and shown. The microheater data is calculated with five different samples and the values of voltage, current, resistance, and power consumption are taken as an average value. The voltage and current readings are 7.2 V and 0.2 mA, and the resistance value can be obtained from V–I readings, which is 350 ohms. The power consumption of the microheater at mentioned V–I values is 144 mW and the temperature is set at 300 °C.
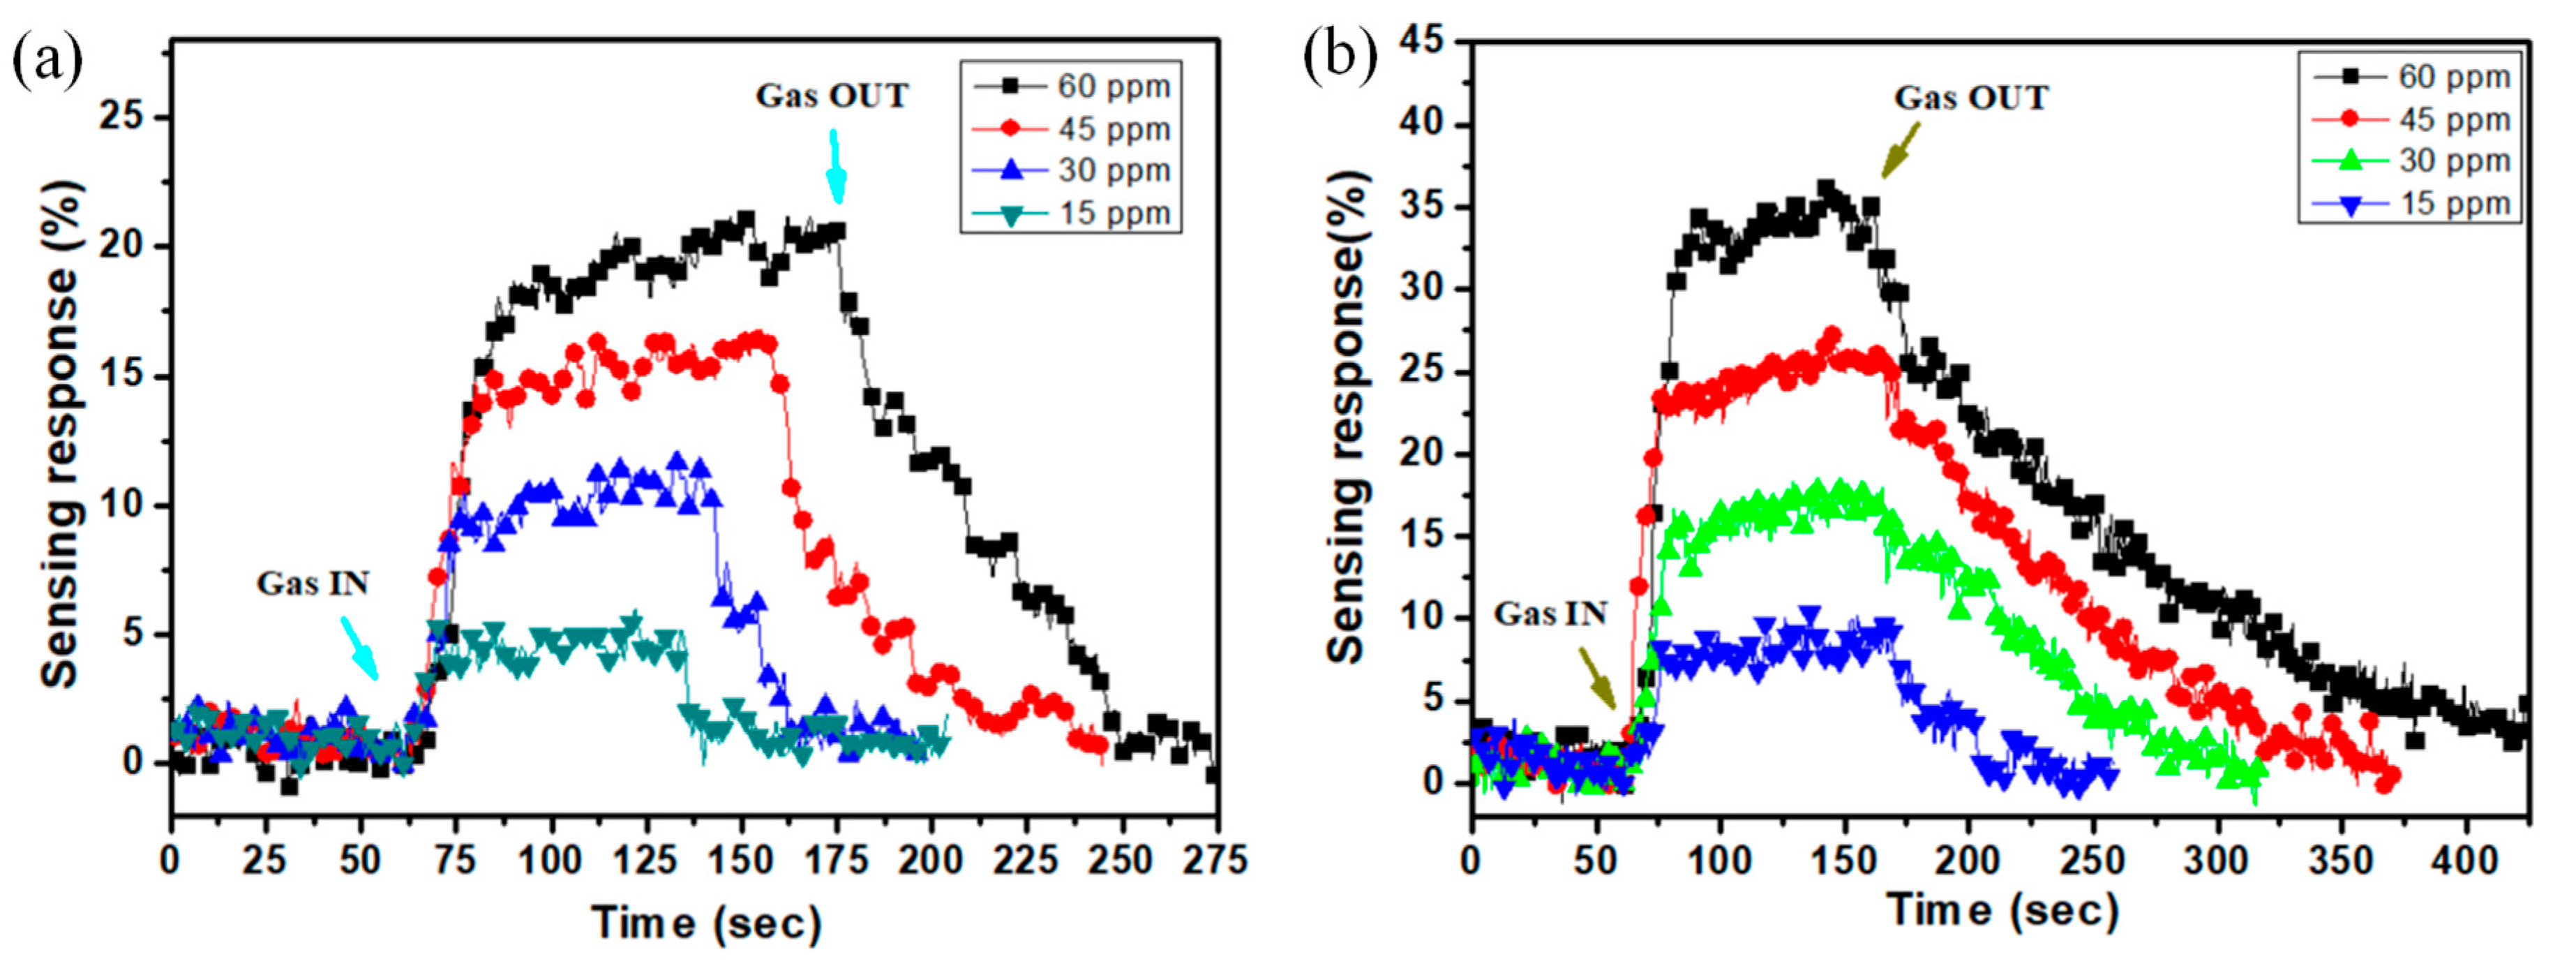
The sensing properties of ZnO sample annealed at 500 °C is shown in Figure 8a. Gas sensing measurements were taken at 133 mW power consumption which is at 300 °C. The gas concentrations are taken from 15 ppm to 60 ppm with an increasing level of 15 ppm. At 15 ppm Ethanol gas concentration, ZnO sensor showed 5% of sensing response and at 60 ppm, the sensing response is recorded to be 20%.
The sensing properties of Au–ZnO sample annealed at 500 °C is shown in Figure 8b. The power consumption and temperature variables are the same as the ZnO sample, which are 133 mW and 300 °C. At 15 ppm Ethanol gas concentration, the Au–ZnO sensor showed 8% sensing response and at 60 ppm, the sensing response reached 35%. During the gas sensing response measurement, the sensor is at a stable position until 60 s and gas is entered at 60th s, as shown in the figure, represented by “Gas IN”. The equilibrium reaction lasts for about 100 s, before opening the chamber as shown in the figure, represented by “Gas OUT”. As the ethanol concentration is diluted, the resistance value will slowly return to the original state. The response time is seen to be 15 s for the gas reaction equilibrium. The sensor’s response time is ~15 s.
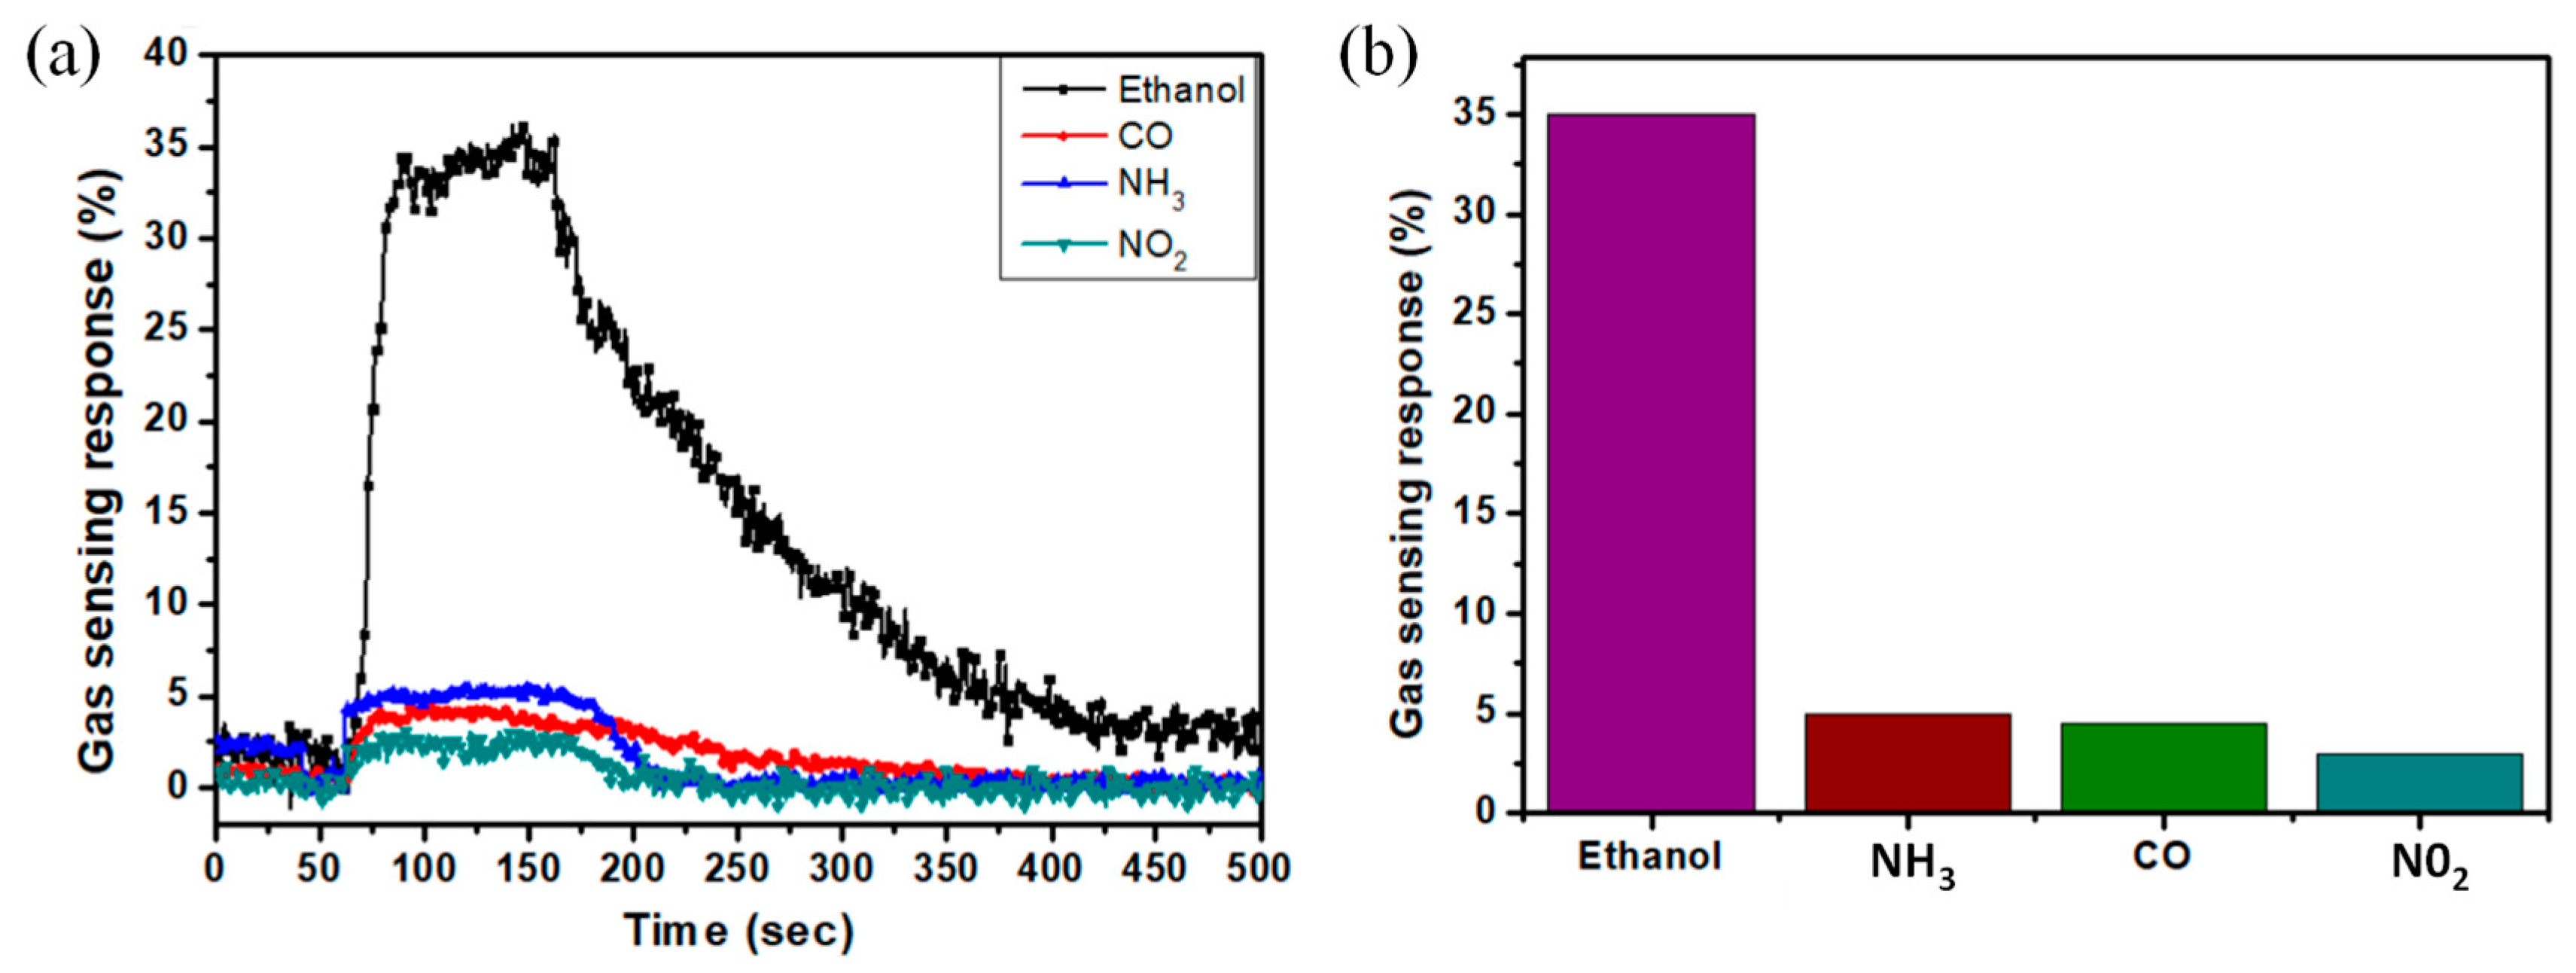
The selectivity of the Au doped ZnO sensor is tested with 4 different gases, along with Ethanol gas. Gas sensing response curves of the gases such as Ethanol, CO, NO2 and NH3 are shown in Figure 9a. The sensing response of all gases are taken at the same gas concentration, which is 60 ppm. Ethanol gas has sensitivity over other selected gases. Figure 9b shows the gas sensing response values of the gases, which are Ethanol, NH3, CO, and NO2. While ethanol has 35% sensing response, NH3 gas has 5%, CO gas has 4.4%, and NO2 gas has 3% sensing responses.
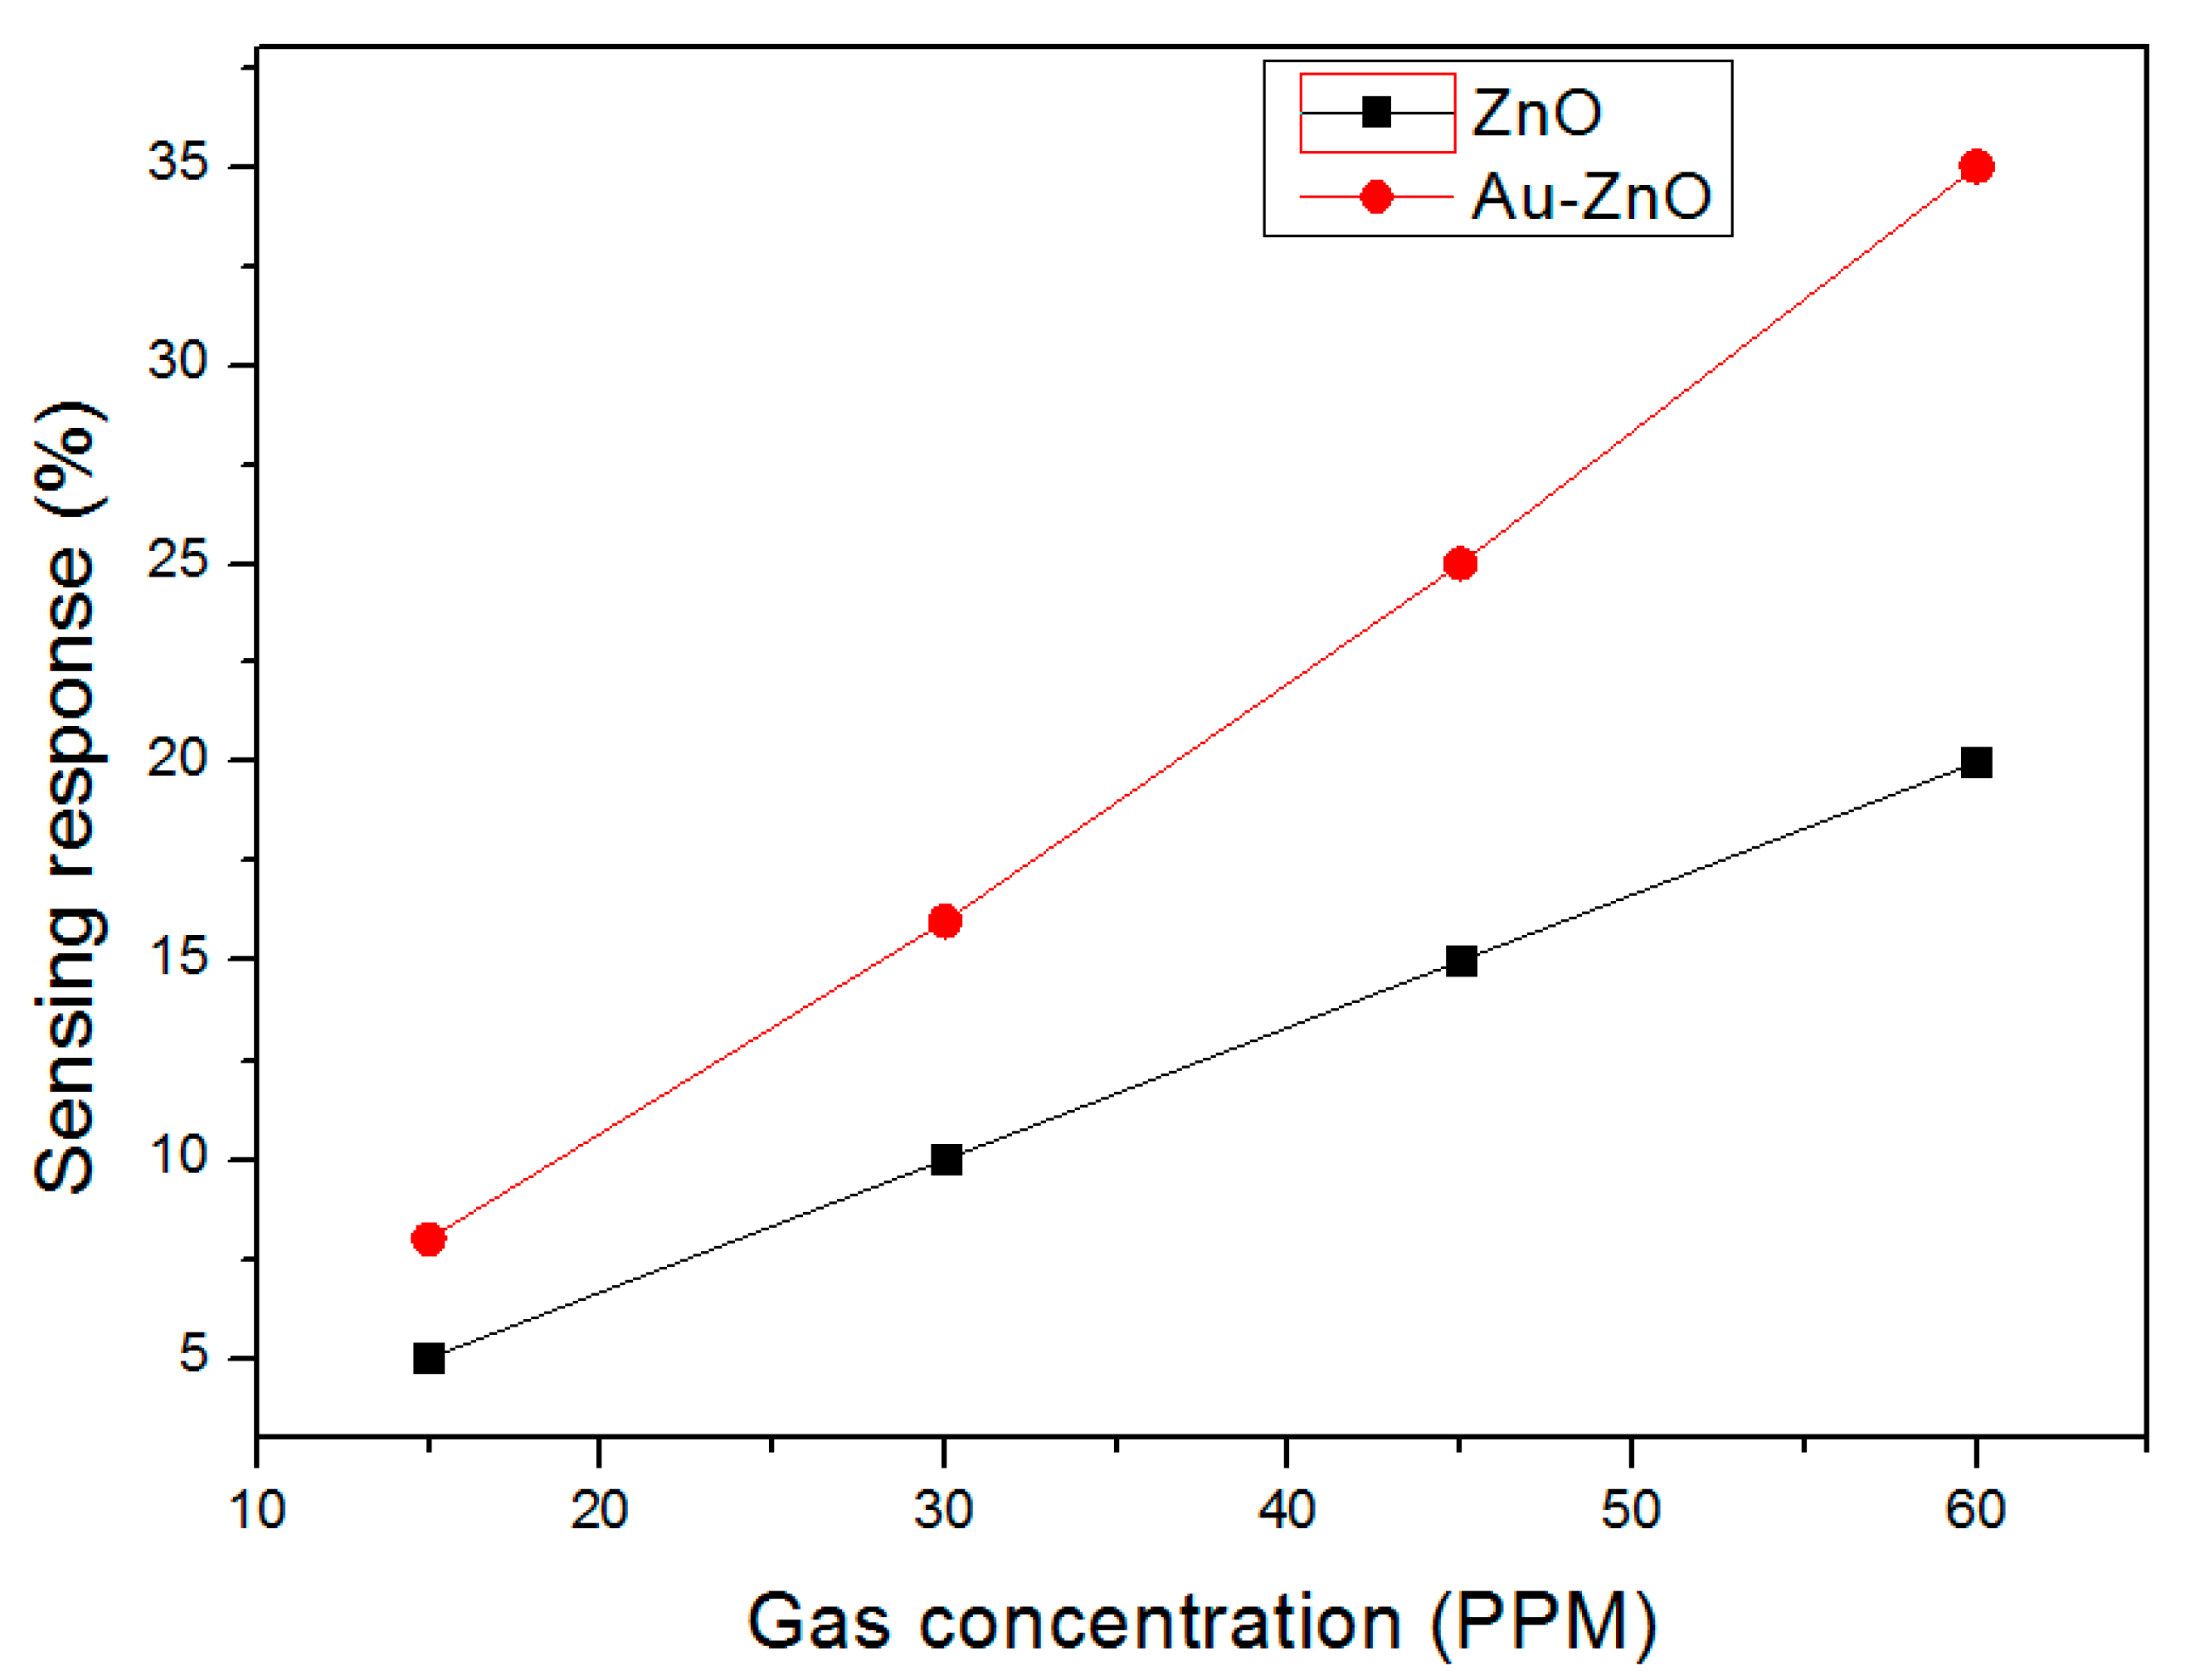
The graph between gas concentration and sensing response is shown in Figure 10. The graph indicates the constant increase in the gas sensing response of both the ZnO and Au–ZnO sensors. For ZnO sensor, gas sensing response started at 4% for 15 ppm and reached 20% for 60 ppm. For the Au–ZnO sensor, gas sensing response started at 8%, which increased by 4% when compared to the ZnO sensor and reached 35% for 60 ppm, which increased by 15% when compared to the ZnO sensor.
Gas Sensing Mechanism
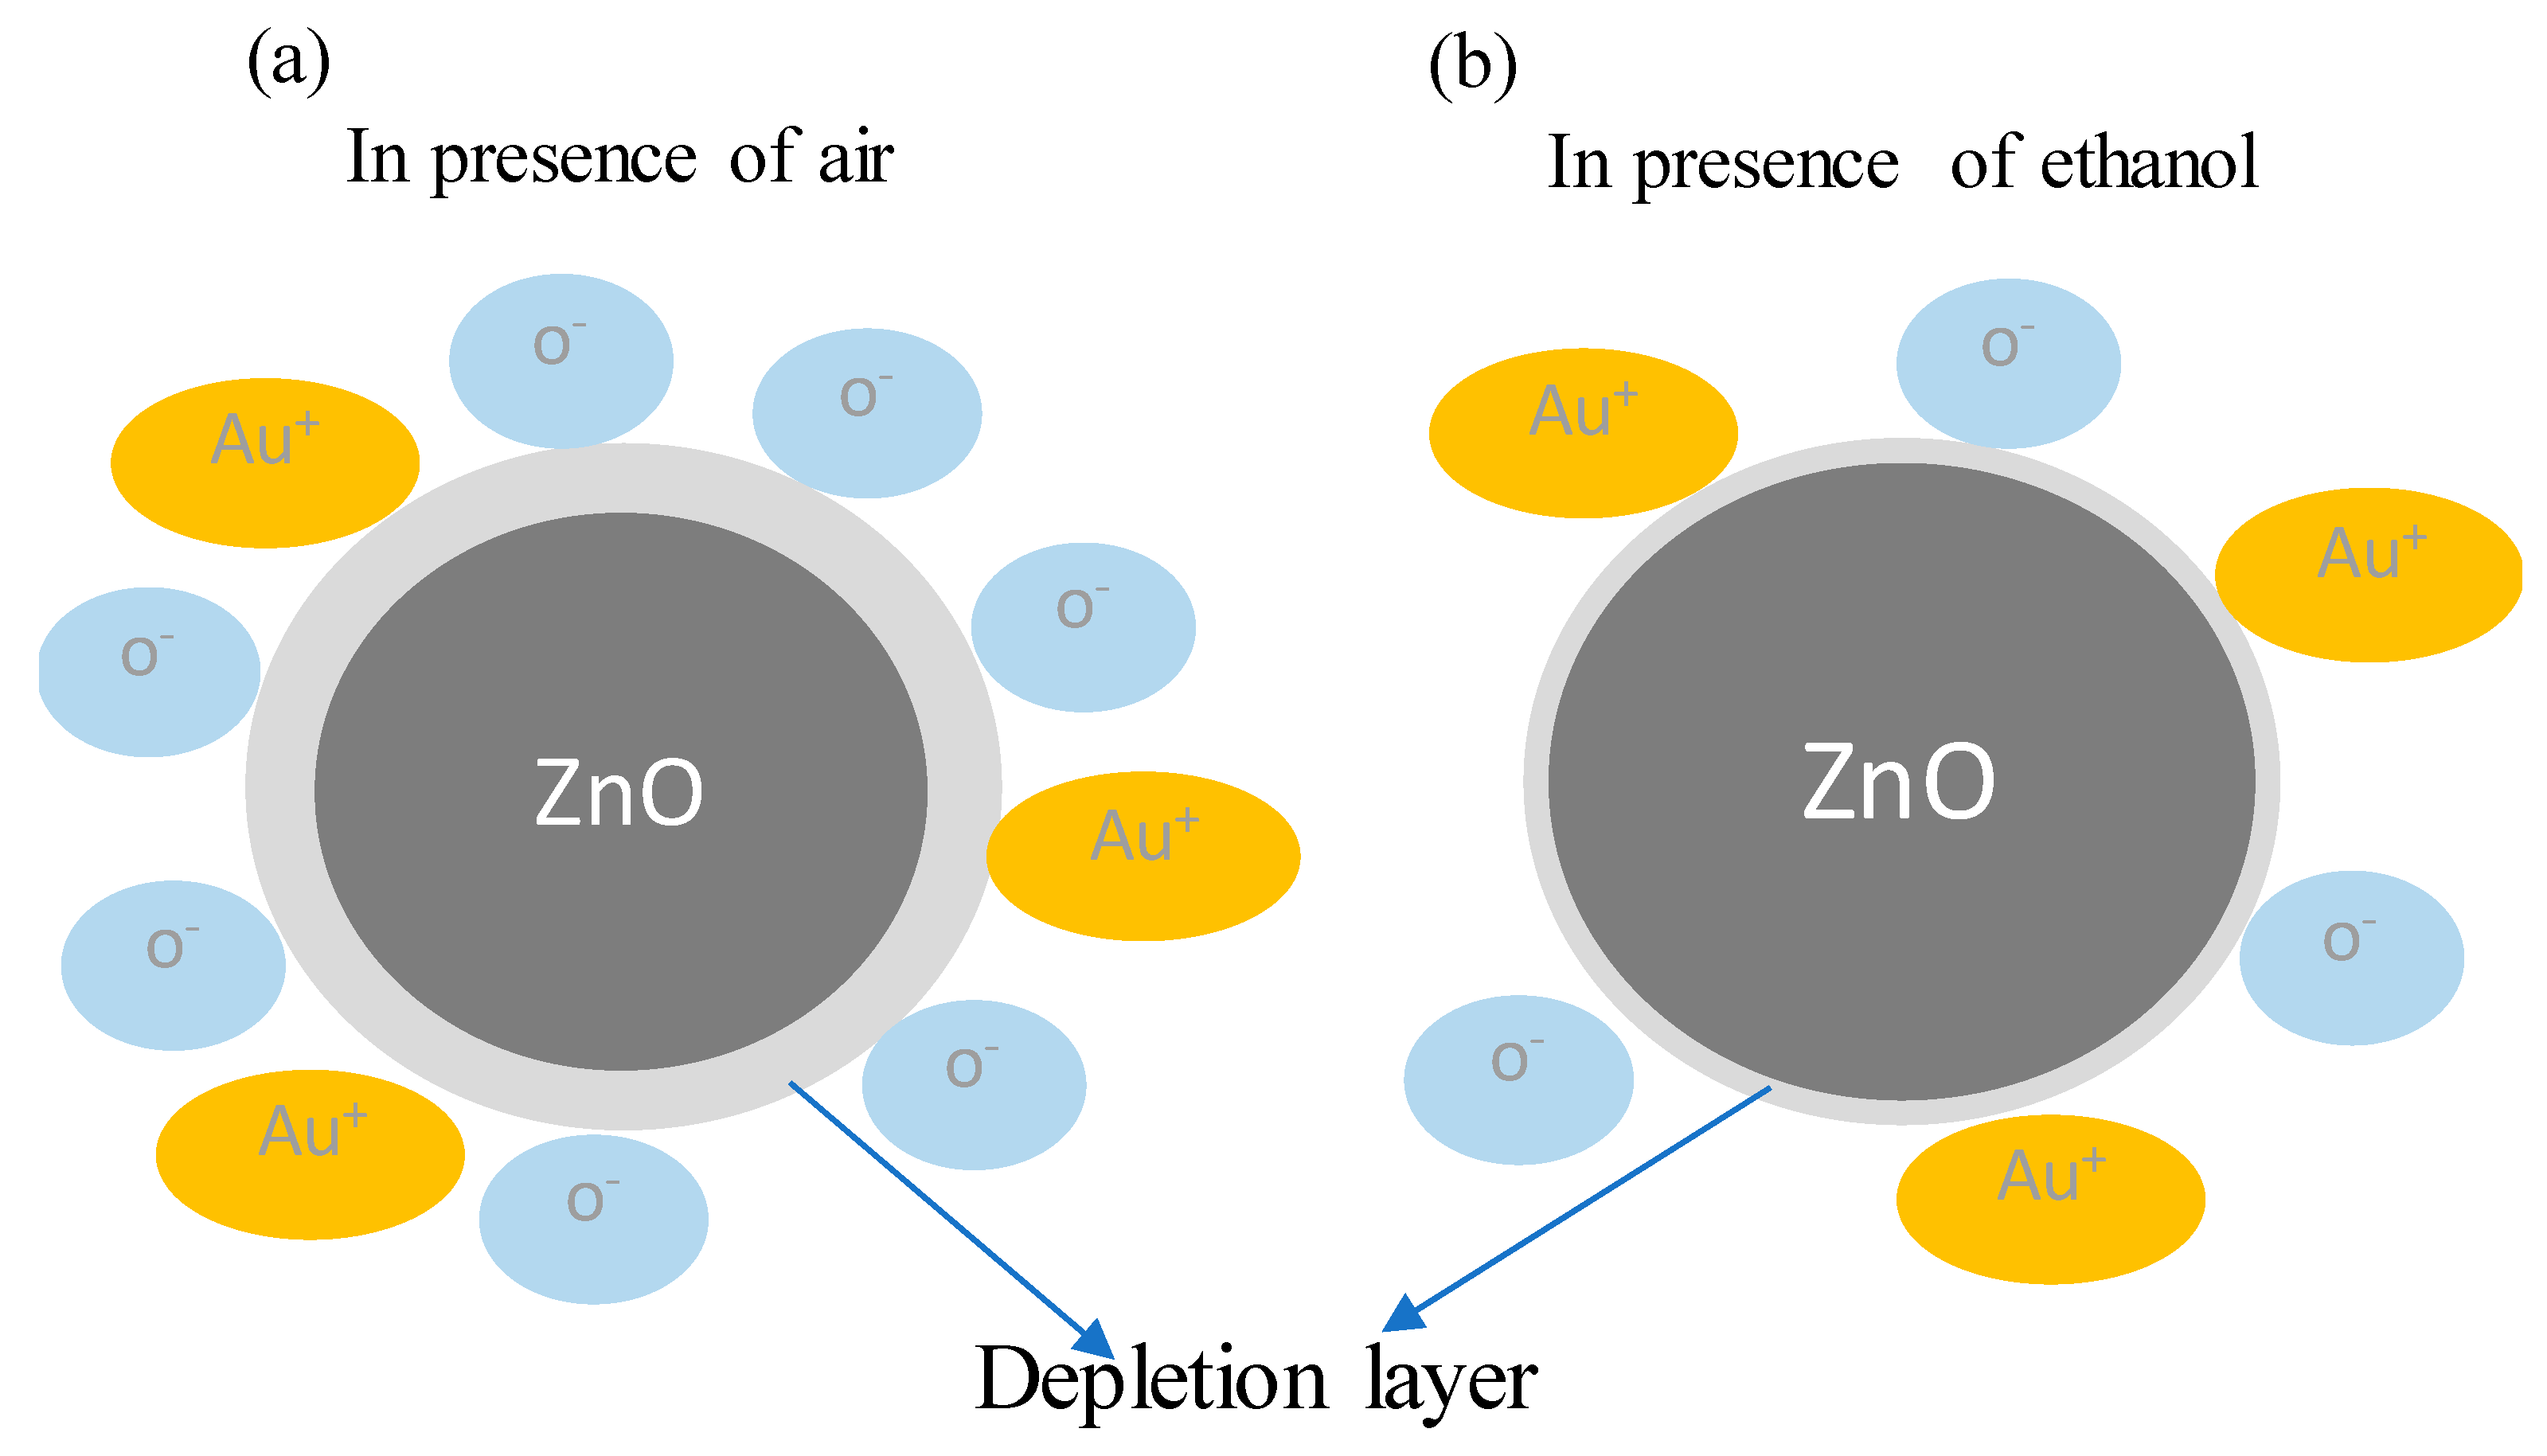
The sensing mechanism for the metal oxide semiconductors occurs due to the change in the resistance which happens due to the interaction of gas molecules and sensing material. ZnO is an n-type semiconductor which contains free electrons, and when the ZnO is treated with Au doping, free electrons from Au are released into the ZnO structure and the number of free electrons will be more in the case of Au doped ZnO. The loss of free electrons leads to formation of Au Anion(Au+). As shown in Figure 11a, When the ZnO sensor is exposed to air, Oxygen will react with the available free electrons and forms Oxygen ions like O−, O2−, and O2−. The reactions are explained as follows [26]:
O2 (gas) → O2 (ads)
O2 (ads) + e− → O2− (ads)
O2− (ads) + e− → 2O− (ads)
O− (ads) + e− → O2− (ads)
After the formation of Oxygen ions, there will be a formation of depletion layer around the ZnO material due to the flow of electrons from ZnO to the formation of Oxygen ions on the surface of the structure. The resistance of the sensor will be increased due to the formation of a depletion layer and the reduction of conductive cross-sectional area. In the presence of a reduction gas like ethanol, the Oxygen molecules react with the ethanol, which releases the free electrons back to the ZnO structure as shown in Figure 11b. When free electrons migrate back to the AZO structure, the depletion layer decreases and increases the conduction cross-sectional area, which in turn reduces the sensor resistance. The reaction of ethanol with oxygen ions are as follows:
C2H5OH (gas) + 3O2− (ads) → 2CO2 + 3H2O + 3e−
C2H5OH (gas) + 6O− (ads) → 2CO2 + 3H2O + 6e−
C2H5OH (gas) + 3O2− (ads) → 2CO2 + 3H2O + 6e−
A list of different ZnO nanostructures and other materials for the ethanol gas sensing is shown in Table 1. From the table, almost all of the studies have used ethanol gas concentration to be more than 100 ppm. Flower NiO/ZnO sensing material with 100 ppm has the 44% sensing response which is highest among the list, and the branch ZnO/NiO structure has a 6.7% sensing response at 50 ppm. In the current study, Au doped ZnO showed a 35% sensing response at 60 ppm ethanol gas concentration, which proved a better sensing material than all of the mentioned study literatures. Since one of the main concerns in preparing a gas sensor is to be able to detect gases at low concentration, our study shows Au doped ZnO prepared by hydrothermal synthesis proves to be a better gas sensor.
4. Conclusions
An Au doped ZnO structure is successfully prepared with hydrothermal synthesis. The structural properties of a ZnO structure and Au doped ZnO are tested and analyzed, such as XRD analysis, SEM and TEM images, and EDS spectrum. Results showed the crystalline properties of the ZnO and Au–ZnO structure. To test the gas sensitivity, MEMS microheater is prepared and the thermal properties have been studied. The gas sensing results have showed that Au doped ZnO has a 35% gas sensing response at 60 ppm ethanol gas concentration, while pure ZnO has a 20% gas sensing response at 60 ppm. The comparative study of ethanol gas sensing is shown in Table 1. From the literature study, our current work showed great sensing response with less than 100 ppm at 300 °C.
Author Contributions
Conceptualization Y.N. and Y.-J.H.; methodology Y.N.; experimental process Y.N.; formal analysis Y.N. and Y.-J.H.; writing and original draft Y.N.; re-writing and editing Y.-J.H. and Y.N. All authors have read and agreed to the published version of the manuscript.
Funding
This work was financially supported by the Ministry of Science and Technology of Taiwan, with project numbers: MOST 109-2622-E-218-002-CC2 and MOST 109-2221-E-218-003.
Acknowledgments
The authors would like to thank the Taiwan Semiconductor Research Institute (TSRI) for the processing of the MEMS devices, which were used in this study, and Hui-Jung Shih with the Instrument Center of National Cheng Kung University for supporting the use of a high-resolution SEM (Hitachi SU8000).
Conflicts of Interest
The authors declare no conflict of interest.
References
- Flammini, A.; Depari, A. Advanced interfaces for resistive sensors. In Smart Sensors and MEMs; University of Brescia: Brescia, Italy, 2018; pp. 171–219. [Google Scholar]
- Kumar, B.; Rajita, G.; Nirupama, M. A Review on capacitive-type sensor for measurement of height of liquid level. Meas. Control 2014, 47, 219–224. [Google Scholar] [CrossRef]
- Hanafi, R.; Mayasari, R.D.; Masmui; Agustanhakri; Raharjo, J.; Nuryadi, R. Electrochemical sensor for environmental monitoring system: A review. AIP Conf. Proc. 2019, 2169, 030007. [Google Scholar] [CrossRef]
- Hsiao, Y.J.; Nagarjuna, Y.; Tsai, C.A.; Wang, S.C. High selectivity Fe3O4 nanoparticle to volatile organic compound (VOC) for MEMS gas sensors. Mater. Res. Express 2020, 7, 065013. [Google Scholar] [CrossRef]
- Maekawa, T.; Tamaki, J.; Miura, N.; Yamazoe, N.; Matsushima, S. Development of SnO2-based ethanol gas sensor. Sens. Actuators B Chem. 1992, 9, 63–69. [Google Scholar] [CrossRef]
- Yamazoe, N. New approaches for improving semiconductor gas sensors. Sens. Actuators B Chem. 1991, 5, 7–19. [Google Scholar] [CrossRef]
- Wan, Q.; Li, Q.H.; Chen, Y.J.; Wang, T.H.; He, X.L.; Li, J.P.; Lin, C.L. Fabrication and ethanol sensing characteristics of ZnO nanowire gas sensors. Appl. Phys. Lett. 2004, 84, 3654. [Google Scholar] [CrossRef] [Green Version]
- Hermida, I.D.P.; Wiranto, G.; Hiskia; Nopriyanti, R. Fabrication of SnO2 based CO gas sensor device using thick film technology. J. Phys. Conf. Ser. 2016, 776, 012061. [Google Scholar] [CrossRef]
- Kim, B.J.; Song, I.G.; Kim, J.S. In2O3-based micro gas sensor for detecting NOx gases. Electron. Mater. Lett. 2014, 10, 509–513. [Google Scholar] [CrossRef]
- Alqahtani, M.M.; Ali, A.M.; Harraz, F.A.; Faisal, M.; Ismail, A.A.; Sayed, M.A.; Al-Assiri, M.S. Highly sensitive ethanol chemical sensor based on novel Ag-doped MESoporous α-Fe2O3 prepared by modified sol-gel process. Nanoscale Res. Lett. 2018, 13, 157. [Google Scholar] [CrossRef]
- Sisman, O.; Poli, N.; Zappa, D.; Comini, E. Synthesis of nanoporous TiO2 with the use of diluted hydrogen peroxide solution and its application in gas sensing. Coatings 2019, 9, 681. [Google Scholar] [CrossRef] [Green Version]
- Pronin, I.; Yakushova, N.; Averin, I.; Karmanov, A.; Moshnikov, V.; Dimitrov, D. Investigation of gas-sensitive properties of thin-film thermovoltaic sensor elements based on zinc oxide. Coatings 2019, 9, 693. [Google Scholar] [CrossRef] [Green Version]
- Laurenti, M.; Valentina, C. Porous zinc oxide thin films: Synthesis approaches and applications. Coatings 2018, 8, 67. [Google Scholar] [CrossRef] [Green Version]
- Wu, W.Y.; Ting, J.M.; Huang, P.J. Electrospun ZnO nanowires as gas sensors for ethanol detection. Nanoscale Res. Lett. 2009, 4, 513–517. [Google Scholar] [CrossRef] [Green Version]
- Sahay, P.P.; Tewari, S.; Jha, S.; Shamsuddin, M. Sprayed ZnO thin films for ethanol sensors. J. Mater. Sci. 2005, 40, 4791–4793. [Google Scholar] [CrossRef]
- Maziarz, W.; Rydosz, A.; Pisarkiewicz, T.; Domanski, K.; Grabiec, P. Gas-sensitive properties of ZnO nanorods/nanowires obtained by electrodeposition and electrospinning methods. Procedia Eng. 2012, 47, 841–844. [Google Scholar] [CrossRef] [Green Version]
- Kim, S.W.; Shizuo, F.; Shigeo, F. ZnO nanowires with high aspect ratios grown by metalorganic chemical vapor deposition using gold nanoparticles. Appl. Phys. Lett. 2005, 86, 153119. [Google Scholar] [CrossRef] [Green Version]
- Aliahmad, M.; Dehbashi, M. Ni-doped SnO2 nanoparticles synthesized by chemical Co-precipitation method. Iran. J. Energy Environ. 2013, 4, 49–52. [Google Scholar] [CrossRef]
- Cao, L.; Kiely, J.; Piano, M.; Luxton, R. A Copper oxide/zinc oxide composite nano-surface for use in a biosensor. Materials 2019, 12, 1126. [Google Scholar] [CrossRef] [Green Version]
- Hjiri, M.; Mir, L.E.; Leonardi, S.G.; Pistone, A.; Mavilia, L.; Neri, G. Al-doped ZnO for highly sensitive CO gas sensors. Sens. Actuators B Chem. 2014, 196, 413–420. [Google Scholar] [CrossRef]
- Deshwal, M.; Arora, A. Enhanced acetone detection using Au doped ZnO thin film sensor. J. Mater. Sci. Mater. Electron. 2018, 29, 15315–15320. [Google Scholar] [CrossRef]
- Li, Y.; Zhang, L.B.; Song, S.; Lian, X.X. Enhanced acetone-sensing performance of Au/Y–ZnO composite prepared using a facile wet chemical method. J. Electron. Mater. 2020, 49, 8. [Google Scholar] [CrossRef]
- Lai, T.Y.; Fang, T.H.; Hsiao, Y.J.; Chan, C.A. Characteristics of Au-doped SnO2–ZnO heteronanostructures for gas sensing applications. Vacuum 2019, 166, 155–161. [Google Scholar] [CrossRef]
- Huang, J.; Zhou, J.; Liu, Z.; Li, X.; Geng, Y.; Tian, X.; Du, Y.; Qian, Z. Enhanced acetone-sensing properties to ppb detection level using Au/Pd-doped ZnO nanorod. Sens. Actuators B Chem. 2020, 310, 127–129. [Google Scholar] [CrossRef]
- Tong, W.; Wang, Y.; Bian, Y.; Wang, A.; Han, N.; Chen, Y. Sensitive cross-linked SnO2:NiO networks for mems compatible ethanol gas sensors. Nanoscale Res. Lett. 2020, 15, 35. [Google Scholar] [CrossRef]
- Zhu, L.; Zeng, W.; Yang, J.; Li, Y. One-step hydrothermal fabrication of nanosheet assembled NiO/ZnO microflower and its ethanol sensing property. Ceram. Int. 2018, 44, 19825–19830. [Google Scholar] [CrossRef]
- Zhu, L.; Li, Y.; Zeng, W. Hydrothermal synthesis of hierarchical flower-like ZnO nanostructure and its enhanced ethanol gas-sensing properties. Appl. Surf. Sci. 2018, 427, 281–287. [Google Scholar] [CrossRef]
- Zhu, L.; Zeng, W.; Li, Y.; Zhang, H. Novel hollow MoO3 cage structure and its gas sensing property. Mater. Lett. 2018, 229, 269–271. [Google Scholar] [CrossRef]
- Wang, J.; Zeng, W.; Wang, Z. Assembly of 2D nanosheets into 3D flower-like NiO: Synthesis and the influence of petal thickness on gas-sensing properties. Ceram. Int. 2016, 42, 4567–4573. [Google Scholar] [CrossRef]
- Umar, A.; Khan, M.A.; Kumar, R.; Algarni, H. Ag-Doped ZnO nanoparticles for enhanced ethanol gas sensing application. J. Nanosci. Nanotechol. 2018, 18, 3557–3562. [Google Scholar] [CrossRef] [PubMed]
- Li, X.Q.; Wei, J.Q.; Xu, J.C.; Jin, H.X.; Jin, D.F.; Peng, X.L.; Hong, B.; Li, J.; Yang, Y.T.; Ge, H.L.; et al. Highly improved sensibility and selectivity ethanol sensor of mesoporous Fe-doped NiO nanowires. J. Nanopart. Res. 2017, 19, 396. [Google Scholar] [CrossRef]
- Kaur, N.; Zappa, D.; Ferroni, M.; Poli, N.; Campanini, M.; Negrea, R.; Comini, E. Branch-like NiO/ZnO heterostructures for VOC sensing. Sens. Actuators B Chem. 2018, 262, 477–485. [Google Scholar] [CrossRef]
- Wang, C.; Zeng, W.; Chen, T. Facile synthesis of thin nanosheet assembled flower-like NiO–ZnO composite and its ethanol-sensing performance. J. Mater. Sci. Mater. Electron. 2016, 28, 1–6. [Google Scholar] [CrossRef]
Figure 1.
Hydrothermal process of ZnO nanosheet deposition.

Figure 2.
(a) Fabricated Micro Electro Mechanical System (MEMS) microheater and (b) ZnO nanosheets deposited microheater.
Figure 2.
(a) Fabricated Micro Electro Mechanical System (MEMS) microheater and (b) ZnO nanosheets deposited microheater.

Figure 3.
XRD analysis of ZnO samples.

Figure 4.
XRD analysis of Au doped ZnO samples.

Figure 5.
SEM image of (a) ZnO sample and (b) Au–ZnO sample.

Figure 6.
(a) TEM analysis of ZnO sample and (b) Au–ZnO sample, (c) SAED pattern for Au–ZnO sample and (d) Elemental analysis of Au–ZnO sample.
Figure 6.
(a) TEM analysis of ZnO sample and (b) Au–ZnO sample, (c) SAED pattern for Au–ZnO sample and (d) Elemental analysis of Au–ZnO sample.

Figure 7.
Power vs. Temperature graph of MEMS microheater.

Figure 8.
(a) Sensing response of ZnO sample sensor and (b) Au–ZnO sample sensor.

Figure 9.
(a) Sensing response of ZnO sample sensor and (b) Au–ZnO sample sensor.

Figure 10.
Gas concentration vs. sensing response graph.

Figure 11.
(a) AZO sensor in presence of air and (b) in presence of ethanol.


Table 1.
Comparison of ethanol gas sensing response from different literature work and current study.
Table 1.
Comparison of ethanol gas sensing response from different literature work and current study.
| Sensing Material | Ethanol Concentration | Operating Temperature | Gas Sensing Response | References |
|---|---|---|---|---|
| ZnO nanoplates | 400 ppm | 350 °C | 23.3% | [27] |
| ZnO nanoflowers | 400 ppm | 350 °C | 30.4% | [27] |
| Hollow MoO3 | 200 ppm | 350 °C | 42% | [28] |
| 3D flower NiO | 400 ppm | 300 °C | 34% | [29] |
| Ag doped ZnO | 200 ppm | 320 °C | 32.8% | [30] |
| Fe doped NiO | 200 ppm | 320 °C | 21% | [31] |
| Branch ZnO/NiO | 50 ppm | 400 °C | 6.7% | [32] |
| Flower NiO/ZnO | 100 ppm | 300 °C | 44% | [33] |
| Au doped ZnO | 60 ppm | 300 °C | 35% | This study |
© 2020 by the authors. Licensee MDPI, Basel, Switzerland. This article is an open access article distributed under the terms and conditions of the Creative Commons Attribution (CC BY) license (http://creativecommons.org/licenses/by/4.0/).
Share and Cite
MDPI and ACS Style
Nagarjuna, Y.; Hsiao, Y.-J. Au Doping ZnO Nanosheets Sensing Properties of Ethanol Gas Prepared on MEMS Device. Coatings 2020, 10, 945. https://doi.org/10.3390/coatings10100945
AMA Style
Nagarjuna Y, Hsiao Y-J. Au Doping ZnO Nanosheets Sensing Properties of Ethanol Gas Prepared on MEMS Device. Coatings. 2020; 10(10):945. https://doi.org/10.3390/coatings10100945
Chicago/Turabian StyleNagarjuna, Yempati, and Yu-Jen Hsiao. 2020. "Au Doping ZnO Nanosheets Sensing Properties of Ethanol Gas Prepared on MEMS Device" Coatings 10, no. 10: 945. https://doi.org/10.3390/coatings10100945
Note that from the first issue of 2016, this journal uses article numbers instead of page numbers. See further details here.