Future Socio-Political Scenarios for Aquatic Resources in Europe: An Operationalized Framework for Aquaculture Projections
 Cornelia M. Kreiss1*
  Eleni Papathanasopoulou2†
  Katell G. Hamon3
  John K. Pinnegar4,5 Sandra Rybicki1
  Giulia Micallef6 Andrzej Tabeau3 Alhambra M. Cubillo7 Myron A. Peck8†
- 1Thuenen Institute of Sea Fisheries, Bremerhaven, Germany
- 2Plymouth Marine Laboratory, Plymouth, United Kingdom
- 3Wageningen Economic Research, The Hague, Netherlands
- 4Centre for Environment, Fisheries and Aquaculture Science, Lowestoft, United Kingdom
- 5School of Environmental Sciences, University of East Anglia, Norwich, United Kingdom
- 6Gildeskål Research Station AS, Inndyr, Norway
- 7Longline Environment Ltd., London, United Kingdom
- 8Institute for Marine Ecosystem and Fisheries Science, Center for Earth System Research and Sustainability, University of Hamburg, Hamburg, Germany
Climate-driven changes in aquatic environments have already started to affect the European aquaculture sector’s most commercially important finfish and shellfish species. In addition to changes in water quality and temperature that can directly influence fish production by altering health status, growth performance and/or feed conversion, the aquaculture sector also faces an uncertain future in terms of production costs and returns. For example, the availability of key ingredients for fish feeds (proteins, omega-3 fatty acids) will not only depend on future changes in climate, but also on social and political factors, thereby influencing feed costs. The future cost of energy, another main expenditure for fish farms, will also depend on various factors. Finally, marketing options and subsidies will have major impacts on future aquaculture profitability. Based on the framework of four socio-political scenarios developed in the EU H2020 project climate change and European aquatic resources (CERES), we defined how these key factors for the aquaculture sector could change in the future. We then apply these scenarios to make projections of how climate change and societal and economic trends influence the mid-century (2050) profitability of European aquaculture. We used an established benchmarking approach to contrast present-day and future economic performance of “typical farms” in selected European production regions under each of the scenarios termed “World Markets,” “National Enterprise,” “Global Sustainability” and “Local Stewardship.” These scenarios were based partly on the IPCC Special Report on Emissions Scenarios framework and their representative concentration pathways (RCPs) and the widely used shared socio-economic pathways (SSPs). Together, these scenarios contrast local versus international emphasis on decision making, more versus less severe environmental change, and different consequences for producers due to future commodity prices, cash returns, and costs. The mid-century profitability of the typical farms was most sensitive to the future development of feed costs, price trends of returns, and marketing options as opposed to the direct effect of climate-driven changes in the environment. These results can inform adaptation planning by the European aquaculture sector. Moreover, applying consistent scenarios including societal and economic dimensions, facilitates regional to global comparisons of adaptation advice both within and across Blue Growth sectors.
Introduction
The impacts of climate change threaten future global food production including seafood production. While effects of climate change on fish resources have already been observed (e.g., Free et al., 2019), more markedly consequences on fish production are expected in the future. In 2013, aquaculture overtook fisheries as a source of aquatic products for human consumption and the continued per capita supply of seafood is expected to be completely fueled by increases in aquaculture (OECD-FAO, 2018). The impacts of climate change on fish stocks and their consequences for wild-capture fisheries have been investigated both globally and for specific, regional fisheries (Allison et al., 2009; Sumaila et al., 2011; Dey et al., 2015). There are comparably few studies, however, examining the biological and economic effects of climate change to the aquaculture industry (Ekstrom et al., 2015; Froehlich et al., 2018).
Water temperature is a key factor influencing the physiology and ecology of fish species (Pörtner and Peck, 2010; Frost et al., 2012; Neubauer and Andersen, 2019). Anthropogenic-induced warming of aquatic habitats (marine and freshwater) as well as altered precipitation patterns are expected to have direct and indirect implications for aquaculture such as altering health status, growth performance, and/or feed conversion efficiency of farmed fish (Reid et al., 2019). The impacts of climate change on aquaculture are not necessarily all negative. Warmer temperatures may also be associated with longer growing seasons, faster growth rates, and lower natural winter mortality depending on the region, species and farm (Li et al., 2016; Weatherdon et al., 2016). On the other hand, climate change could alter the intensity and/or frequency of extreme weather events such as storms (Seneviratne et al., 2012; Bouwer, 2019) increasing damage to farm infrastructure (Reid et al., 2019). The potential economic consequences of these physical changes in marine and freshwater systems range from increases in the costs of investments (e.g., new equipment, increased insurance coverage, amount and type of feed, treatments against disease) to reduced marketable volumes and consequently lower returns.
The availability of aquaculture feed components rich in omega-3 fatty acids, such as fishmeal and fish oil (FMFO), will not only depend on future changes in climate but also societal and political factors (Mullon et al., 2009; Merino et al., 2012). These will, in turn, impact feed costs. Furthermore, energy costs are subject to change, especially in the long term (Sato et al., 2019) with direct effects on the aquaculture sector as a primary energy user as well as indirect impacts on feed costs. Electricity prices depend on fuel and CO2 prices (Panos and Densing, 2019). Fuel prices, on the other hand, are inherently volatile due to the influence of various technological, political, and economic factors including tax policies (Heat Roadmap Europe D 6. 1., 2017). Finally, fish prices (market returns), are another key factor determining profitability. Similar to other commodities, fish prices depend on supply and demand with the latter a function of the size of the global population, the level of income and the extent of urbanization (Delgado et al., 1997; Béné et al., 2015) as well as dietary habits. Furthermore, profit and infrastructural development of fish farming depends, in some cases, on public subsidies. Although public payments vary considerably among countries (Guillen et al., 2019) and between regions and species, for some production systems, subsidies can substantially contribute to overall returns (e.g., Lasner et al., 2020).
Few studies have quantitatively analyzed the economic consequences of climate change on aquaculture production. Previous studies have focused on regional assessments in emerging or developing countries, or have often used qualitative methods and have not compared impacts based on broadly applicable scenario frameworks (e.g., Li et al., 2016; Chan et al., 2017; Asiedu et al., 2019). Some previous studies have concentrated on how shifts in specific markets or environmental drivers affect aquaculture production and trade on global or European levels (Delgado et al., 2003; World Bank Report, 2013; Kobayashi et al., 2015; Narita and Rehdanz, 2016). We suggest that the most robust approach is to conduct more holistic analyses that are based on a consistent set of plausible alternative futures including future developments in political, economic, social, technological, legal, and environmental factors, also known as a ‘PESTEL’ approach (Aguilar, 1967; Johnson and Scholes, 2002).
Four different climate change future scenarios were developed within the EU H2020 project climate change and European aquatic resources (CERES), based on selected combinations of the Intergovernmental Panel on Climate Change (IPCC) Special Report on Emissions Scenarios framework and their representative concentration pathways (RCPs) and the more recent ‘Shared Socio-economic Pathways’ (SSPs; O’Neill et al., 2014; van Vuuren and Carter, 2014). While the RCPs describe possible trajectories of future greenhouse gas (GHG) concentrations, the SSPs describe future societies in which climate change mitigation and climate change adaptation are more or less easily accomplished, without explicitly considering climate change itself (Pinnegar et al., under review). RCP8.5 was chosen as a worst-case scenario while RCP4.5 represents climate mitigation strategies that lead to about half of the GHG emissions and atmospheric concentrations compared to RCP8.5 by 2100. Each was combined with two SSPs to define and analyze feedbacks between climate change and socioeconomic factors: World Markets (RCP8.5, SSP 5), National Enterprise (RCP8.5, SSP3), Global Sustainability (RCP4.5, SSP1), and Local Stewardship (RCP4.5, SSP2) and are described in detail by Pinnegar et al. (under review).
A condensed overview of these four scenarios, including their contrasting elements with regard to environmental, technological, or economic developments as well their global or local focus, is provided in Figure 1. The essences of these scenarios were co-created with stakeholders using both internal and external International Council for the Exploration of the Sea (ICES)/ North Pacific Marine Science Organization [PICES (as this is a nickname for a Pacific ICES)] Working Groups (WGs) CERES project workshops (see Pinnegar et al., under review). The World Markets (WM, RCP8.5, SSP5) scenario corresponds to a future with open markets where the primary objective is generation of wealth with high fossil fuel utilization and, consequently, less regard for the environment consequences. This global scenario is characterized by a rapid technological progress and few legal restrictions on business. In the National Enterprise (NE, RCP8.5, SSP3) scenario, the primary objective is national food security and maintaining employment opportunities with declining investments in education and technological development. Fossil fuel dependency is high and resource intensity growing. In the Global Sustainability (GS, RCP4.5, SSP1) scenario, society embraces a global approach to sustainability with improved resource productivity, investment in environmental friendly technology and strong international collaboration facilitating climate change mitigation. The Local Stewardship (LS, RCP4.5, SSP2) scenario emphasizes local solutions for self-sufficiency including environmental values and actions to sustainably utilize local resources. Technological development is low and less focus is placed on using international mechanisms to combat environmental issues.
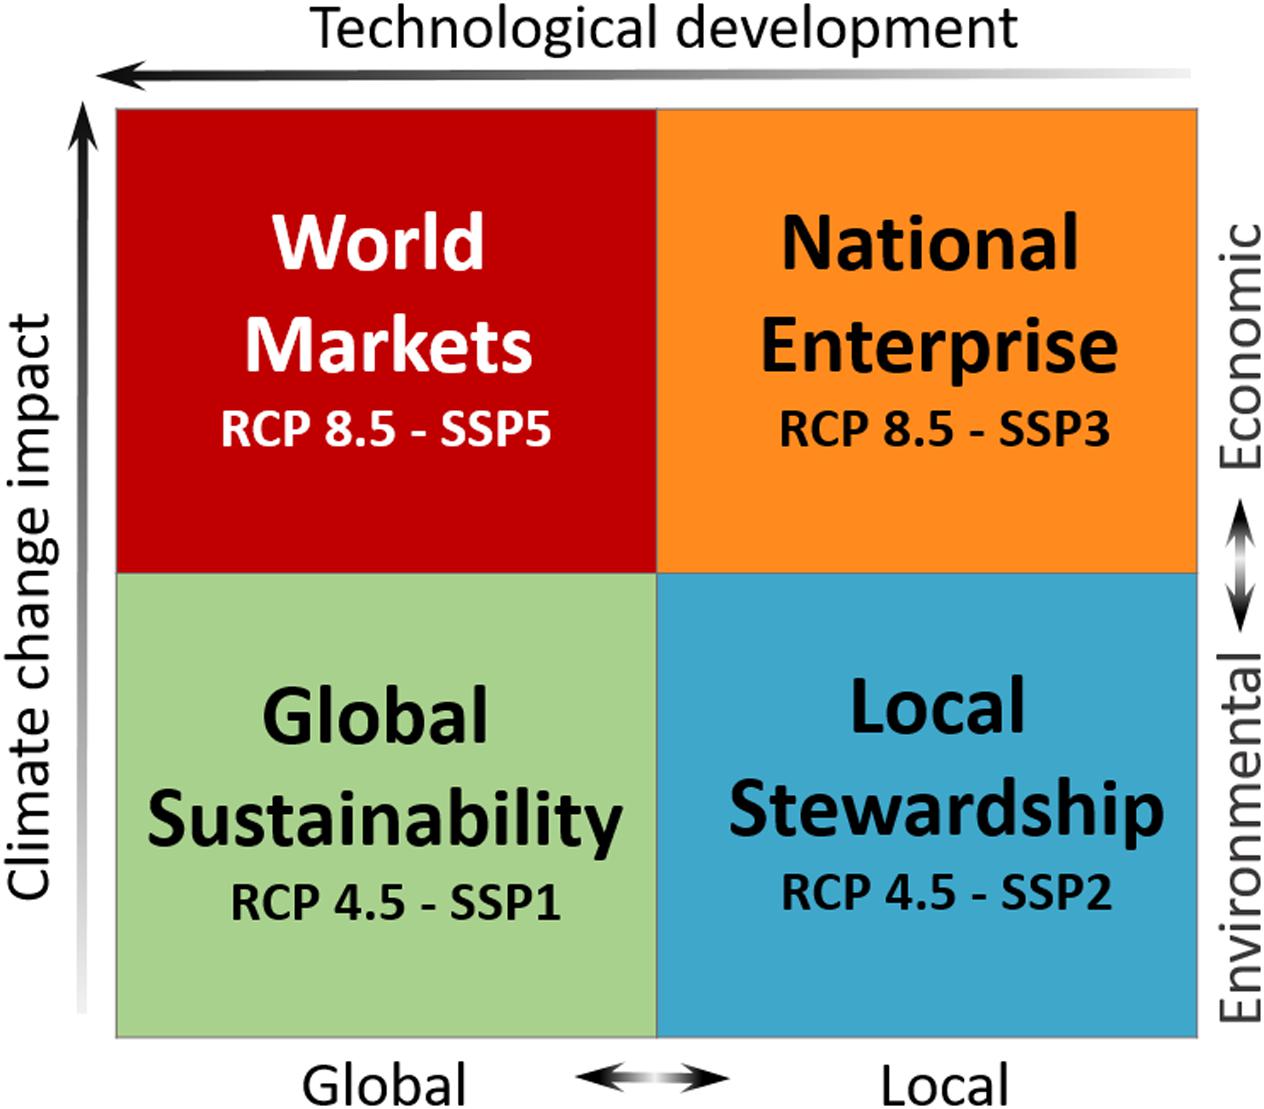
Figure 1. Conceptualization of the four climate change and European aquatic resources (CERES) scenarios in terms of impact and adaptation. Direction of the arrows indicates an increasing development/impact. Double arrows indicate diverging socio-political focus.
Based on these four socio-political scenarios, stakeholder perceptions and model outputs (for future price developments for feed ingredients, production costs and market returns) were combined to create plausible future conditions for Europe’s most commercially and/or culturally important components of the aquaculture farming sector (Figure 2). Future price trends for each of the four CERES scenarios were derived from the global MAGNET model [see Woltjer and Kuiper (2014) for the model description and van Meijl et al. (2020) for the assumptions for each of the SSP scenarios and results for the agricultural sector] as well as the FMFO model (based on Mullon et al., 2009). These scenario-specific price trends were then applied to “typical farm models” (Lasner et al., 2017) to estimate profitability in the year 2050 for Norwegian salmon and German carp farms, two case studies providing good contrasts in PESTEL elements.
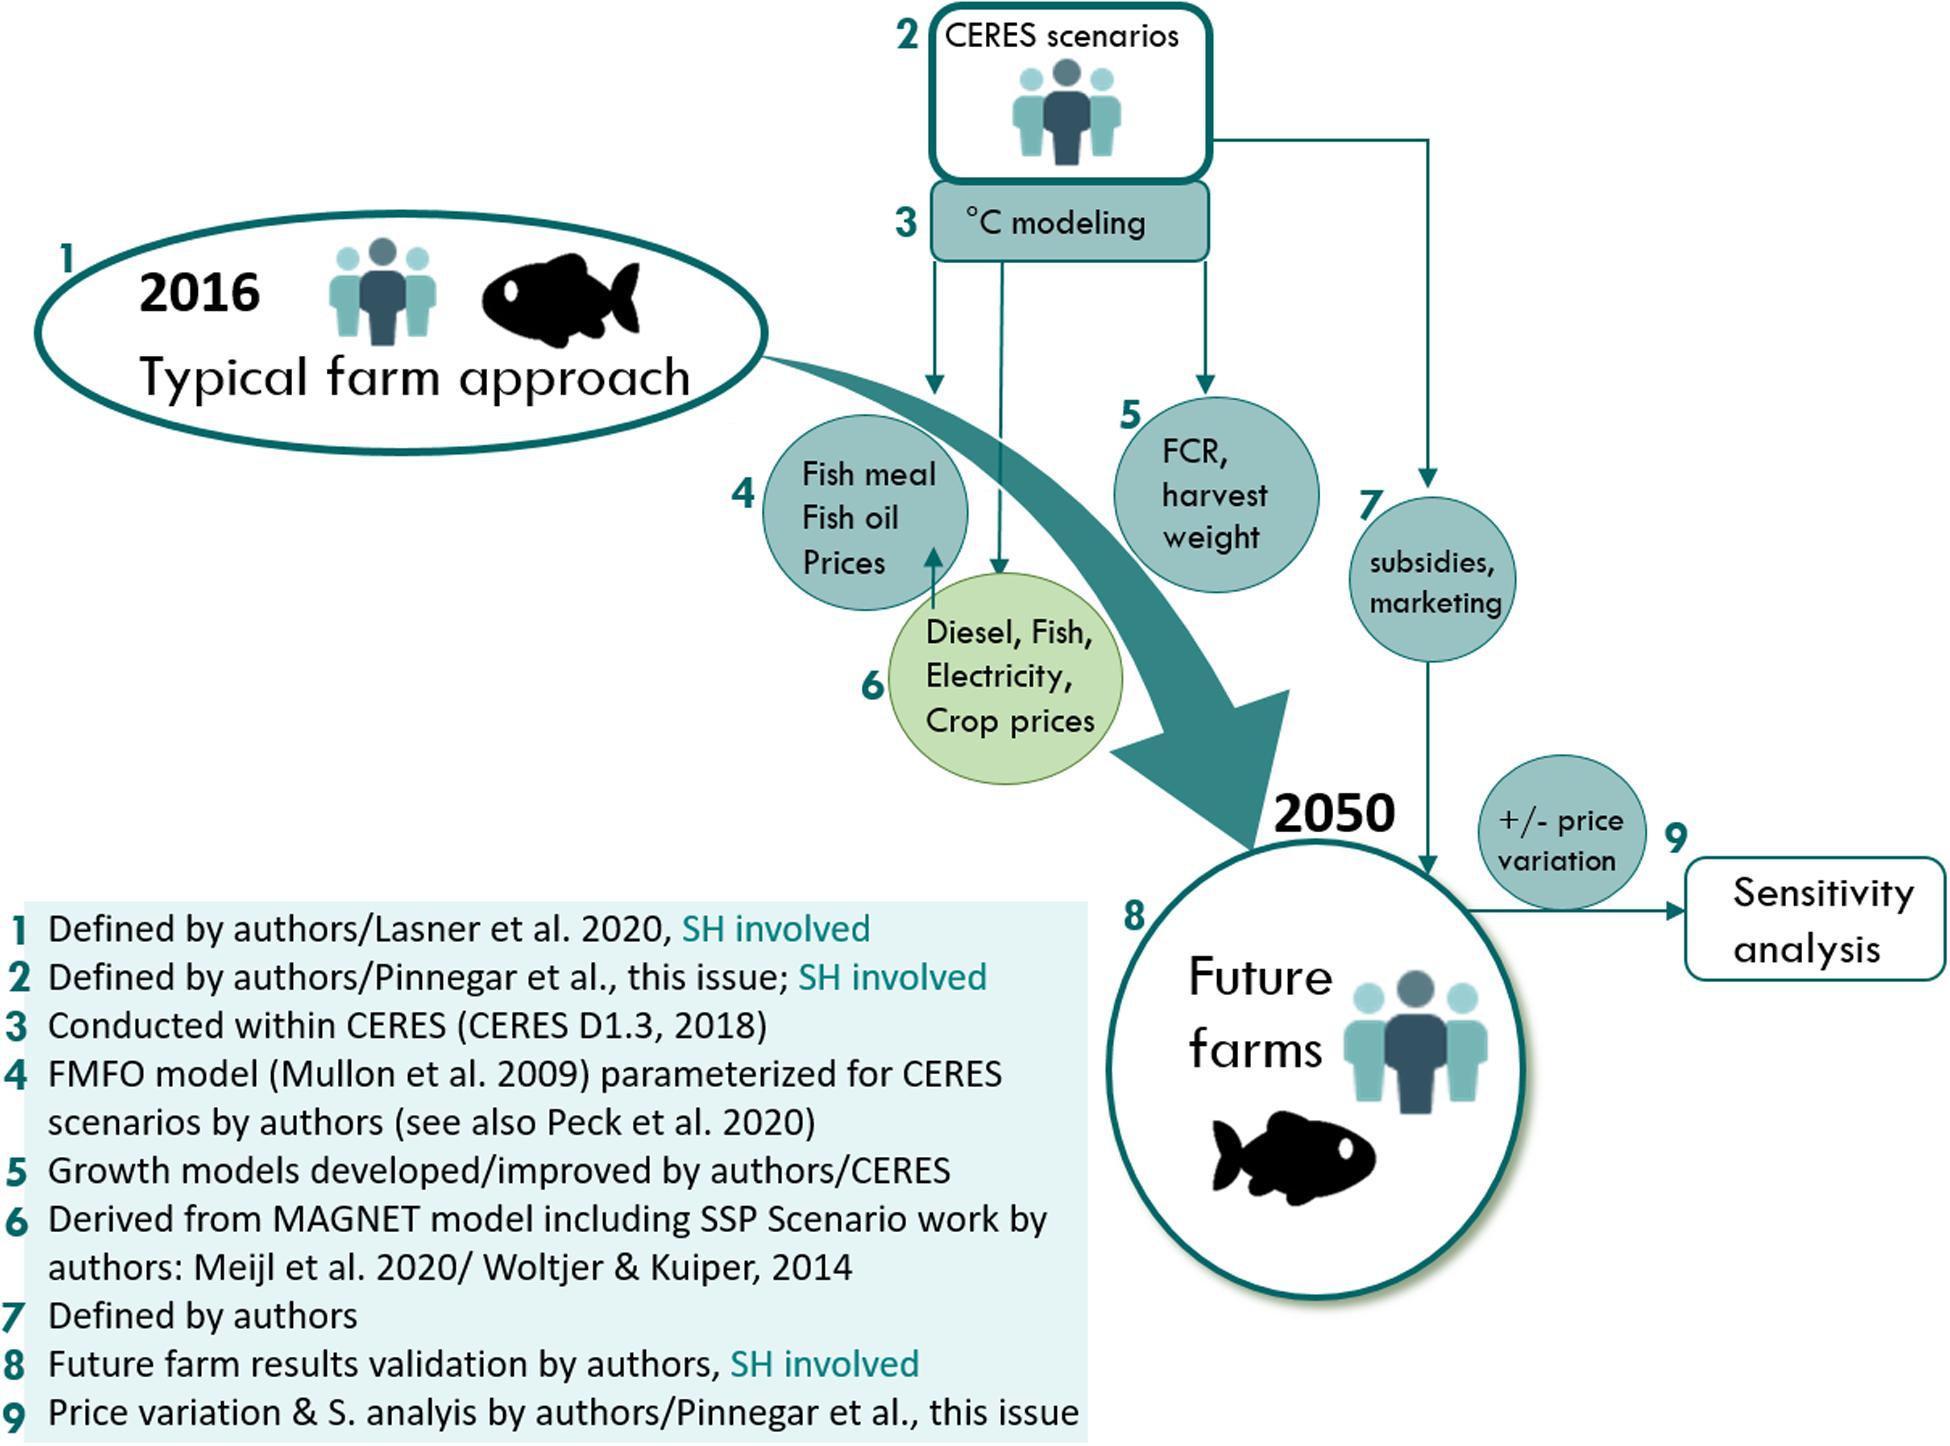
Figure 2. Dataflow and models involved in the application of climate change and European aquatic resources (CERES) aquaculture scenarios. Stakeholder (SH) engagement within different steps is indicated as “SH” and by related icon. FCR, feed conversion ratio; S. analysis, sensitivity analysis.
Summarizing the three objectives of the present study, we will (1) introduce a flexible scenario framework that can be applied to a wide range of aquaculture production systems; (2) define semi-quantitative model input parameters from the scenario narratives, (3) explain how these scenarios were applied for the typical farm approach in two cases. Using this scenario framework, we hope to provide improved advice for climate adaptation planning to both the industry and policymakers. Although the majority of the European aquaculture sector has shown little growth in the last decade and contributes relatively little compared to global leaders, Europe is the largest consumer of seafood in the world (FAO, 2018) and the gap between this consumption and the amount provided by wild fisheries continues to increase.
Methods – Operationalization of the Scenarios
The general framework of the socio-political scenarios developed in CERES is described by Pinnegar et al. (under review). When defining the scenarios, not only the IPCC RCPs and SSPs were considered, but also the ‘PESTEL’ framework (Johnson and Scholes, 2002) was taken into account as a reminder of the factors that might have an impact on aquaculture in these different envisioned futures. These scenarios narratives were operationalized for use in specific economic models by further developing quantitative aspects of future trends and changes in key aquaculture variables. Details needed in these scenarios to run economic models were sourced from unpublished (gray) literature, outcomes of an aquaculture workshop conducted by CERES, taken from unpublished model results, and scenarios were co-developed and later interrogated by expert stakeholders. The following sections outline relevant aspects to be considered when building scenarios using the PESTEL approach (Table 1).
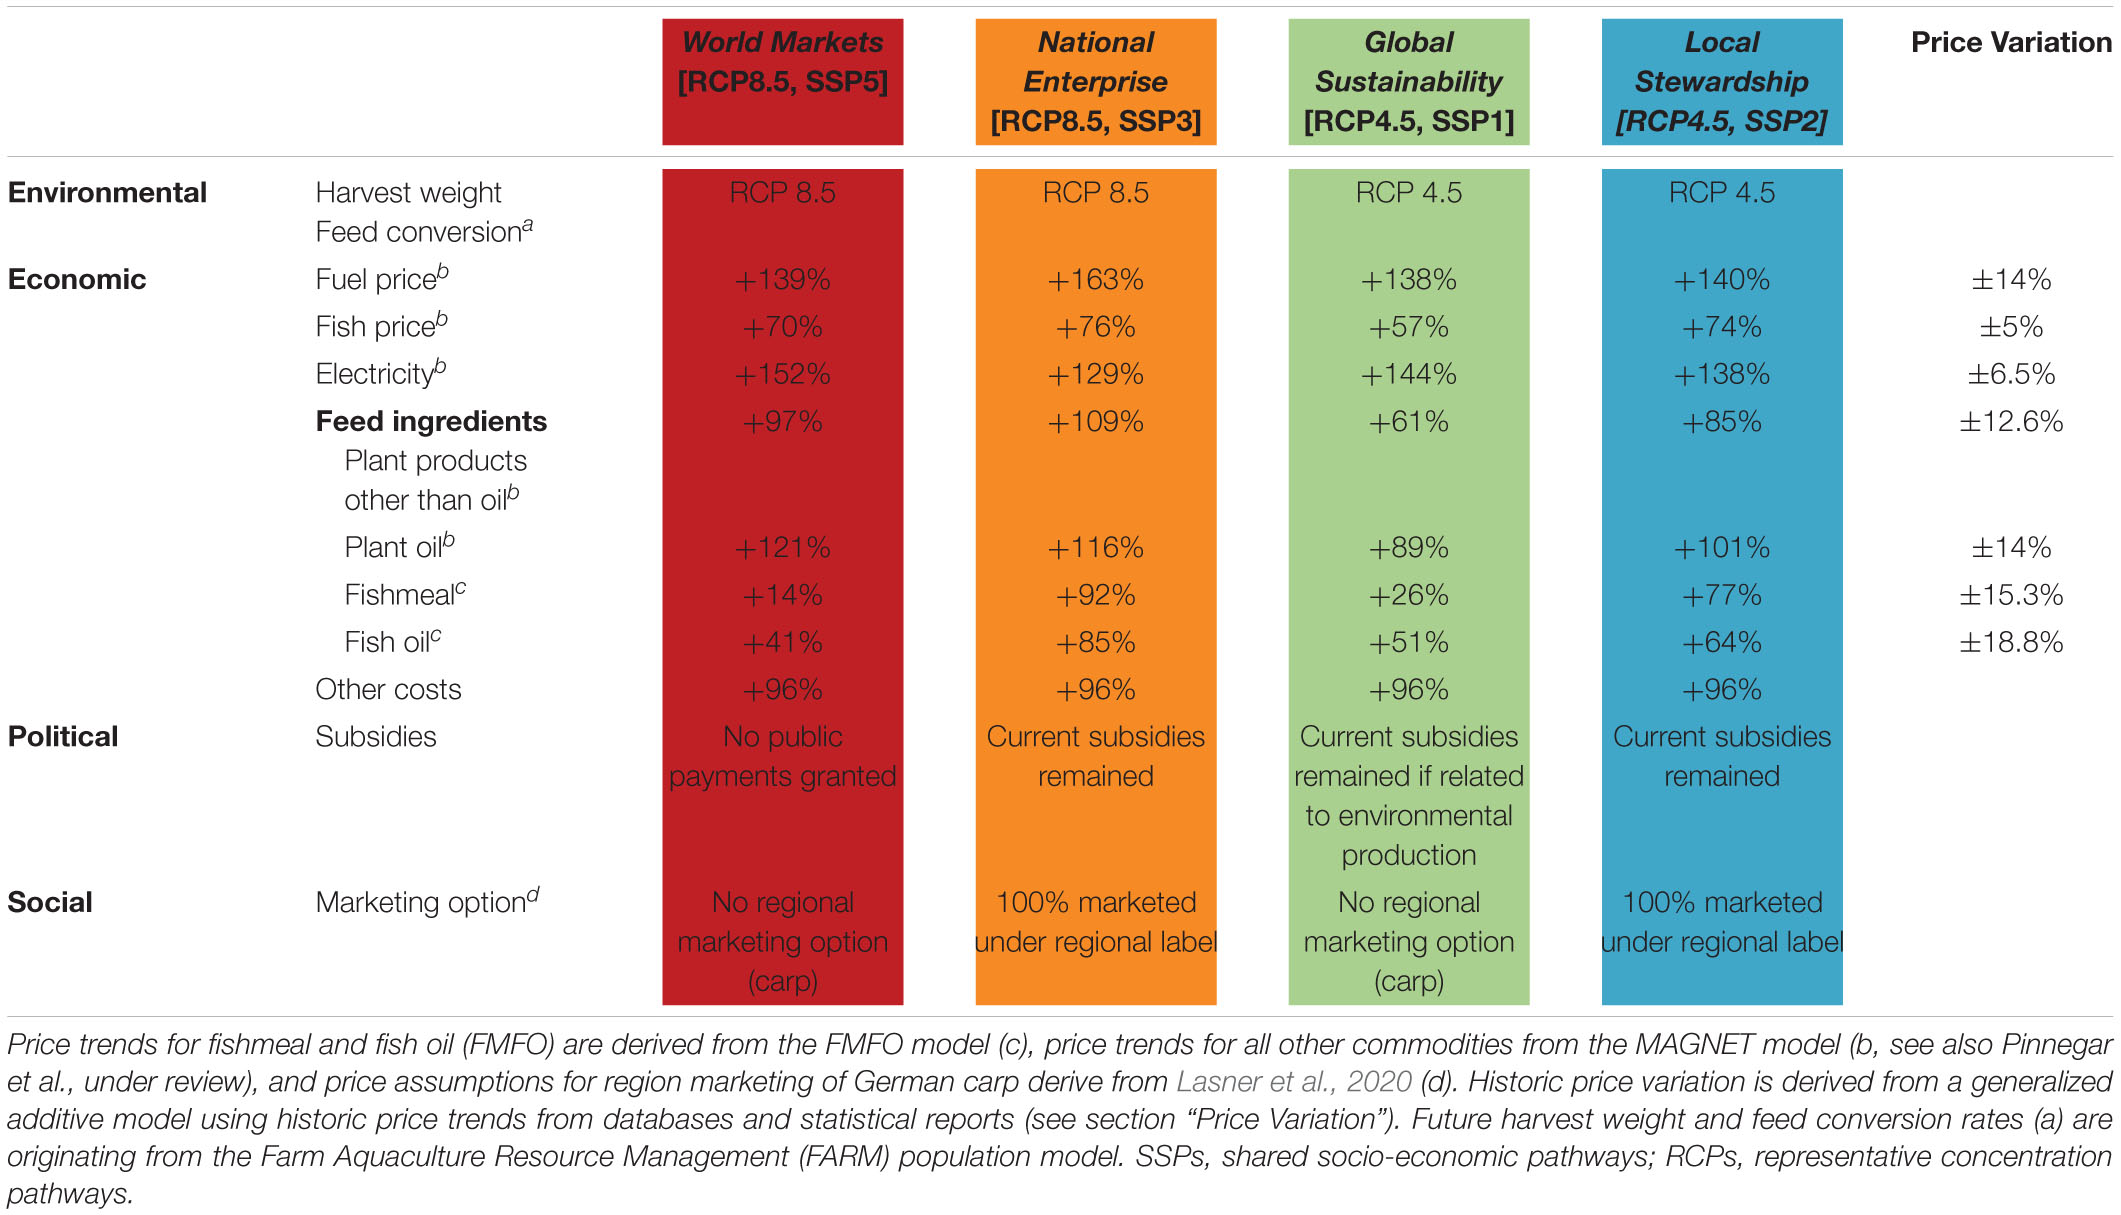
Table 1. Summary of the variables applied within typical fish farms for the four climate change and European aquatic resources (CERES) scenarios: Overall future nominal price trends for fish, fuel, electricity, and fish feed ingredients are given for the year 2050 relative to 2016.
P – Political Factors
European Union structural funds [e.g., European maritime and fisheries fund (EMFF)] or direct payments may provide support to aquaculture producers. Although the situation across the different EU countries is diverse (see Guillen et al., 2019), a number of production systems receive public payments as additional returns. These payments can, for example, be provided for extensive production or to compensate for insularity. As globalization is expected to lead to a de-regulation of markets and decreased taxes, we assumed that subsidies were eliminated under the global, profit oriented World Markets scenario. Under the Global Sustainability scenario, subsidies were only maintained if culture techniques related to environmental goals (e.g., extensive production). Under the two local scenarios, National Enterprise and Local Stewardship, current subsidies were assumed to remain unchanged (reference year 2016).
Energy or carbon emission reduction policies might have effects on industries dependent on energy and agricultural commodities (in fish feed) such as aquaculture. Thereby, land-use changes like the extents of forested land or land utilized for bioenergy purposes may affect agriculture in different ways. Within the CERES scenarios, land-use changes become most effective under the Global Sustainability scenario with an increase in protected areas, whereas the present-day extent of protected areas was maintained in the future under the World Markets and Local Stewardship scenarios. For the National Enterprise scenario only current strictly protected areas were maintained [according to categories 1–4 of the World Database on Protected Areas (WDPA)].
Trade policy sets the direction of trade and often has substantial influence on prices. Under the two global scenarios (World Markets and Global Sustainability) the current import tariffs and export subsidies for all commodities are abolished. For the World Markets scenario, non-tariff barriers for exports of agri-food products from low-income countries to high-income countries are introduced. For the Local Stewardship scenario, no change in tariffs or subsidies is assumed, whereas under the National Enterprise scenario an increase of import tariffs for agri-food products by 10% points is introduced by 2050. These assumptions have subsequent effects on all future price trends applied within the CERES model simulations (crude oil, electricity, fish, and agricultural commodities).
E – Economic Factors
Besides the prices of the aforementioned input factors, fish price itself is influenced by global commodity markets and changes in supply and demand. Projections of change in the price of energy, as well as fish and plant ingredients in fish feed, were derived from the general equilibrium MAGNET model (Woltjer and Kuiper, 2014). Similar to our study, that model is also based on the SSPs and uses the same assumptions for Gross Domestic Product (GDP) and population development (Doelman et al., 2018) that underlie the four CERES scenarios. Pinnegar et al. (under review) provide a more detailed description of how future price trends of crude oil (fuel) and fish price were implemented and the comparison to other sources for these projections. We apply the same method to price projections for electricity and plant-based commodities. Unlike fuel which is globally traded, power and electricity are traded on the European market, where changes in prices for electricity and oil, however, were found to be correlated (Madaleno et al., 2015). Hence, an indirect impact by global market developments was expected. Moreover, no other suitable source was available that matched the scenarios and mid-century RCP time slice. The following sections provide details on price projections for ingredients of fish feed and the calculation of future prices of fish feed.
Fishmeal and Oil
Future FMFO prices under each of the four CERES scenarios were taken from mid-century projections made by the FMFO model. This model (Mullon et al., 2009) captures the geographically dispersed global FMFO market representing 80% of all production and consumption flows and was parameterized for the CERES scenarios. In addition to the ecological and societal factors already mentioned in the above sections, further economic elements were included to explicitly account for future changes in FMFO prices. First, fuel price assumptions (see Hamon et al., under review, Pinnegar et al., under review) were used for fishing fleets to enable variation in operation costs to be considered. Rates of investment, depreciation, and capital remuneration depended on the amount of technological progress assumed by a scenario. In particular, rates of investment were considered to be higher in the World Markets and Global Sustainability scenarios due to the openness of economies and the race to maintain competitiveness in the global market. A similar argument also supported the higher rate of depreciation costs used in the World Markets and Global Sustainability scenarios due to the technological progress under these specific scenarios.
Fish Feed Price
The composition of species-specific diets and their ingredient’s proportions based on literature were verified by relevant stakeholders from the fish feed and farming industry. All plant protein and plant sourced ingredient shares other than vegetable oil were combined as “plant products other than oil.” This simplification was necessary as future price projections were not available specifically for fish feed ingredients, but an average of the available price projections for “wheat and meslin,” “other grains,” and “oilseeds,” based on the Global Trade Analysist Project [GTAP] (2007) database (Version 8), were used. The current raw material prices for plant commodities per unit weight were obtained from European Commission (2019), Food and Agriculture Organization of the United Nations (2019), and The World Bank (2019) databases and those for FMFO from the IndexMundi, 2019 database and a commodity statistics report (Globefish, 2019). Based on these prices, raw material costs per ingredient share (according to the fish feed composition defined within the first step) were calculated. For the merged category of “plant products other than oil,” the prices for wheat, grains and oilseeds were averaged. No difference between the prices for conventional marine ingredients and those deriving from by-products (raw material recycled from food fish processing) was made due to a lack of available data. The difference between total raw material cost and price per kg feed was categorized as “other costs” including those for other specific ingredients (e.g., land animal protein, vitamins, minerals) and those associated with the production of the feed as well as the profit margin of the fish feed producers.
In a final step, the future changes in price for fish feed ingredients were applied to the absolute cost allocation per fish feed ingredient previously calculated. For the category “other costs” an inflation factor of 2% per year was implemented (see section “Inflation Rates and Other Costs”). The overall percentage change for nominal prices for fish feed ingredients between the year 2016 and 2050 derived from the MAGNET and the FMFO model is given in Table 1.
Inflation Rates and Other Costs
Future inflation rates will likely vary among our four scenarios characterized by different underlying assumptions on how trade and GDP will develop in the future. Inflation, however, is difficult to predict (Berkhout et al., 2002) and in the absence of respective modeling, we applied a consistent inflation factor of 2% per year for all scenarios, continuing projected trends (United States Department of Agriculture [USDA], 2019). This was implemented for all costs where future price trends under the selected SSPs and RCP’s were not available. Among them are aquaculture input costs, such as labor or fingerling costs and feed price shares deriving not from raw material.
Price Variation
As mentioned above, factors such as income, urbanization, taxation, or land-use changes may influence future commodity price trends and were considered within our four scenarios. In addition, there are further impacts on price developments and a certain volatility has to be taken into account when projecting future prices. Agricultural commodity markets are particularly volatile due to price fluctuations caused by natural shocks such as inclement weather or pests; the fact that demand elasticities are small, and a lagged response between supply and price exists (FAO et al., 2011). With respect to our scenarios, price volatility is assumed to be higher under the two scenarios with more pronounced physical and biogeochemical effects of climate change as associated with RCP8.5 (Diffenbaugh et al., 2012). This might be further pronounced in the National Enterprise scenario in which adaptive capacity is assumed to be low.
In order to consider potential price variation around the 2050 price trends used, a range was set around the MAGNET energy, fish and fish feed component price trends as well as those derived from the FMFO model. As described by Pinnegar et al. (under review), historical price variability was used to define the future range in fish (FAO Fishery and Aquaculture Commodities statistics, 2019) and crude oil prices (Organisation for Economic Co-operation and Development [OECD], 2019). Future price variation in different fish feed ingredients was based on historical variability captured in the databases for current prices. Variation in the price of electricity within Europe was based on the Eurostat database (2019) database. Historic data coverage was commodity-specific. Annual data were mostly available from 1980 to 1990 onward, for European electricity prices, however, data were only available from 2008 onward. A generalized additive model (GAM) with a gamma distribution was fit to the general trend of the non-normally distributed historic price data. The upper and lower 95% confidence limits were calculated by determining the standard error of the model fit. Further, the proportional deviation of the highest fit value was used to build the upper and lower range of the projected future price output of the MAGNET and FMFO model (see Pinnegar et al., under review) and applied within a sensitivity analysis as explained in the following.
The historical range in the various prices was implemented to conduct Monte Carlo simulations for costs and returns in Microsoft Excel (2016 version). In total, 1,000 iterations of typical farm operating earnings [returns (= fish prices) minus cash costs (including feed and energy prices)] were calculated with energy, feed and fish prices varying randomly between the pre-defined price ranges superimposed on the price projected for 2050. From the average of the resulting operating earnings, twice the standard deviation was added/subtracted in order to cover > 95% of the expected future operating earnings between the defined price ranges and thereby their sensitivity to price changes.
S – Social Factors
Social factors focused on representing future changes in consumer acceptance and associated buying trends. The domestic focus of the two local (National Enterprise and Local Stewardship) scenarios is reflected in increased opportunities for regional marketing. These opportunities were not assumed to be available under the two globally operating (Global Sustainability and World Markets) scenarios. Regional marketing strategies were assumed to achieve premium prices for species or products with regional market demand that are attributable to their geographical origin certified as “protected geographic indications” (PGI).
Consumer acceptance of feed ingredients is also shaping the sector’s practices and, hence, the sector’s profitability. Acceptance of genetically modified (GM) organisms or the source of protein (land animal, versus marine animal versus vegetable meal) may change prices of fish feed (Shepherd et al., 2017; Sprague et al., 2017). The impact of protein source substitution was included in the CERES scenarios by using a demand flexibility parameter in the FMFO model, which accounted for the presence of substitutes to the FMFO commodities. In the World Markets and Global Sustainability scenarios, demand flexibility was assumed to be high (greater substitutes for expensive FMFO) due to a wider range of available alternatives, while demand flexibility was considered to be low in the local (National Enterprise and Local Stewardship) scenarios (World Economic Forum, 2018). The future demand for fish was scenario-specific and linked to population growth. The National Enterprise and Global Sustainability scenarios had the highest and lowest global population growth rates, respectively (Kc and Lutz, 2017).
T – Technological Factors
The four CERES scenarios made different assumptions on technological progress consistent with the SSP narratives (Popp et al., 2017; Pinnegar et al., under review, Figure 1). The World Markets scenario was characterized by a high technological development, as well as under Global Sustainability, where best practices are rapidly and globally distributed. Technological advancement is slower under the Local Stewardship and even more under the National Enterprise scenario.
Similar assumptions have been made for the agriculture sector including feed crops where the most pronounced increase in crop productivity occurs under the World Markets and Global Sustainability scenarios. Advances in technology are driven by the limited availability of land (Global Sustainability, more land is protected) or via increased GDP (World Markets) which indirectly stimulates technological development.
The technological progress was also embedded indirectly within feed technology and development of marine protein and oil substitution. Technological progress in FMFO production was included within the FMFO model through economic variables. Specifically, variation in the cost of meal and oil production, depreciation and return on investment was varied and described in more detail under section “E-Economic Factors”.
E – Environmental Factors
Environmental concerns of the industry include impacts of climate change on the growth physiology of cultured animals as well as consequences on farming systems and the maintenance of production. Water temperature and quality can directly alter growth performance, feed conversion efficiency and the health status of cultured poikilothermic animals or can indirectly influence farm performance through changes in the occurrence of pathogens or harmful algal blooms (Brander, 2007; Neuheimer et al., 2011; Barange et al., 2018; Froehlich et al., 2018; Reid et al., 2019). To reflect environmental changes, physical and biochemical model results (CERES D1. 3, 2018) and individual growth models for selected target species were integrated into the well-tested FARM population model for simulating future harvest weight and feed conversion rate (FCR) ranges (Ferreira et al., 2009, 2012; Nunes et al., 2011; Saurel et al., 2014; Cubillo et al., 2018) under the two different GHG concentration trajectories RCP 4.5 and 8.5.
The FCR measures the feeding efficiency and was estimated for the grow-out production starting at fingerling size for typical farms. Final harvest weight attained at the end of the production cycle was chosen as an indicator for growth performance. The duration of the production cycle was fixed based on data obtained for a reference year (2016). Within a 20-year time slice [model-dependent 2030–2050 (Norwegian waters) or 2040–2060 (other European waters)], the warmest and coldest year was used to model harvest weight and FCR in order to capture the effects of future temperature variability.
The FMFO model (Mullon et al., 2009, 2016), a coupled ecological-economic model, captured climate impacts on small pelagic fish within RCP4.5 and RCP8.5 in the four CERES scenarios. Thereby, more severe latitudinal shifts of small pelagics were projected under RCP8.5 (Jones and Cheung, 2014; Jones et al., 2015) compared to RCP4.5 (Weatherdon et al., 2016). The model also accounted for differences in intrinsic rates of growth of populations of pelagic fish based on life history traits (e.g., small, fast-growing pelagics fished in Peru and Chile compared with slower-growing species fished in Nordic countries such as Denmark, Norway and Iceland; Mullon et al., 2009, 2016).
L – Legal Factors
A number of scenario-specific regulatory factors are of concern to the aquaculture sector. One indirect legal factor that was considered is the total allowable catch (TAC) of small pelagic fish used for FMFO production. These TACs were aligned with the levels of exploitation rates developed in the CERES scenarios created for fisheries (Hamon et al., under review) and ranged from 0.6 of the exploitation rate associated with the maximum sustainable yield (MSY) in the Global Sustainability scenario to 1.1 of the exploitation rate associated with MSY in the National Enterprise scenario. No additional direct factors (discussed in section “Discussion”) were included within our analysis.
Economic Model Approach
For the economic assessment of climate change impacts on the most important finfish species to European aquaculture, the typical farm approach was applied as a baseline for farm-level projections. Essentially an engineering approach, cost and return structures of typical farms were modeled applying empirically grounded, realistic price, and volume structures for farm inputs and outputs (Isermeyer, 2012; Walther, 2014). Representative farm datasets for selected production regions were built using both qualitative sampling methods, such as focus groups and expert interviews, and from quantitative farm statistics. Each farm-level dataset was comprised of a maximum of 548 variables and allows micro-economic analyses after the structure is discursively validated with stakeholders for its coherence (see Lasner et al., 2017). Within CERES, future price trends, assumptions on subsidies and regional marketing (Table 1), as well as temperature-driven changes in harvest and feed volumes, were applied to typical farms defined for a reference year (2016) to calculate mid-century profitability. These included multiple species (rainbow trout, carp, Atlantic salmon, European sea bass, sea bream, and blue mussel) farmed across a total of ten countries in the European region (Germany, Denmark, Ireland, Norway, United Kingdom, Netherlands, Spain, Poland, and Turkey) within various production systems. The present study provides results for two typical farms as case studies: Atlantic salmon grown in Norwegian farms and carp grown in German farms.
Results
Application of the Scenarios
Fishmeal and Fish Oil
An increase in nominal prices across all scenarios is observed for both fishmeal and fish oil (Figures 3A,B). The magnitude, however, varies between scenarios with the local scenarios (National Enterprise and Local Stewardship) showing higher prices compared with the global scenarios (World Markets and Global Sustainability). More specifically, the National Enterprise scenario generates the highest prices for fishmeal at 3,030 U.S. Dollar (USD) per ton and fish oil at 2,551 USD per ton in 2050 followed by the Local Stewardship scenario. While the Global Sustainability scenario shows the lowest prices for fishmeal prices at 1,685 USD and fish oil at 1,734 USD in 2050 with the World Markets prices slightly higher.
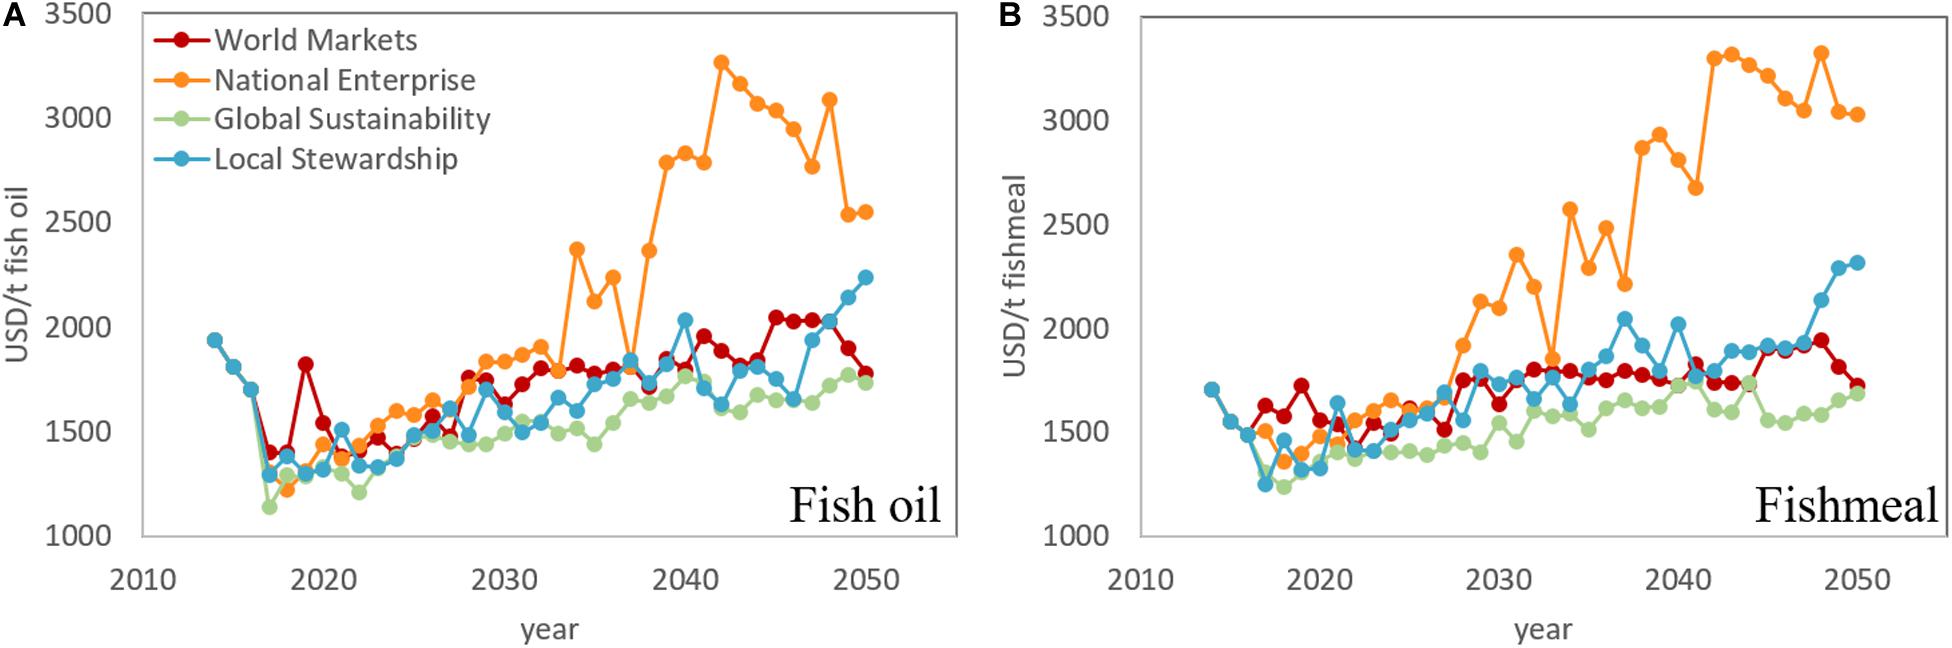
Figure 3. Future price development of fish oil (A) and fishmeal (B) in USD/ton under the four climate change and European aquatic resources (CERES) scenarios.
One of the main explanatory variables for these observed price differences between the global and local scenarios is the assumption of demand flexibility. In the global scenarios (World Markets and Global Sustainability) it is assumed there would be an increased presence of substitutes to the FMFO commodities from more extensive competition. This puts downward pressure on prices keeping them low. In the local scenarios (National Enterprise and Local Stewardship), demand flexibility is assumed restricted and introduces scarcity into the model which becomes further pronounced with increasing demand from growing human populations.
Fluctuations in price can also be seen across time and scenarios. This is explained by the dynamic and recursive nature of the model which is run sequentially over 1-year periods until mid-century (2050). The model solves for the ecological variables, such as recruitment and latitudinal shifts, and the economic variables such as investment, depreciation and consumer demand for each year and then uses these results as the starting point for the next 1-year period. Allowing the variables to evolve in this way and to be constantly updated in the model results in the variability observed.
A sensitivity analysis of the results was carried out by changing fuel prices, which was considered to be one of the most uncertain variables in the model. The model was run across the scenarios at a price increase of 1% per year and 4% increase per year compared to the base run which considered a price increase of 2.6% per year. Large variations in the results are observed ranging from a 13% decrease to a 30% increase for the year 2050 across scenarios. These uncertainties require the projected FMFO prices to be used with caution but still seen as useful for exploring possible futures and ranges in prices.
Energy and Plant Fish Feed Ingredient Price Trends
When considering all future price trends, the most pronounced increase was for energy resources including crude oil and electricity with, over all scenarios, 130–160% higher prices than today. Fish price trends were comparably consistent over the four scenarios (57–76%). Together with FMFO price projections (14–92%), and in contrast to the other commodities, these were at the lower range of price increase. The price development of electricity prices was strongest under the two global scenarios. The prices of all other commodities markedly increased in both local scenarios (Table 1). Electricity price is mostly dependent on demand and supply, whereas the dependency on primary energy carrier prices is around one third of the price of electricity.
As mentioned above, scenario-specific differences in future world population size, income, capital, international trade, agricultural expansion, and technological progress are the major drivers of future prices in food commodities. The smallest increase in price for agricultural commodities was in Global Sustainability in which future demand was lowest, agricultural yield per unit area was relatively high and global trade was encouraged by low tariffs. The prices for agricultural commodities increased the most in the National Enterprise Scenario in which world population growth was high, increases in agricultural productivity were modest and international trade was restricted.
Fish Feed Composition and Price Development
The composition of fish (grower) feed was, to some degree, species-specific (Figure 4), but the overall composition of the diets for rainbow trout, sea bass/sea bream and Norwegian salmon was similar. In Europe, land animal protein was not part of salmon feed but included in diets of rainbow trout and sea bass/sea bream (Figure 4). Moreover, the feed used for sea bass and sea bream consisted of a higher proportion of fishmeal compared to other species. The comparably high share of marine ingredients for organic salmon was due to the use of fish by-products. Because these by-products are lower in protein, greater amounts were used in feed formulations. As to the traditional carp production in ponds, they were characterized by supplementary feeding of grains and wheat in addition to naturally occurring feed within the pond.
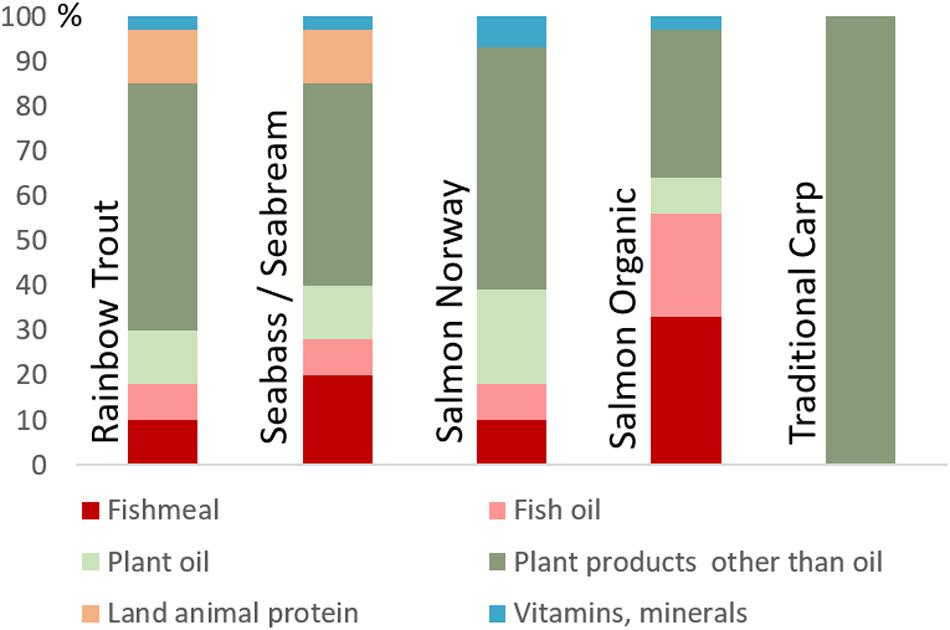
Figure 4. Grower fish feed composition assumptions for selected species and the reference year 2016 based on literature and stakeholder feedback. Fishmeal and oil within organic salmon feed is deriving from fish trimmings.
A finer resolution of ingredients, for example distinguishing further between shares of plant commodities and their products such as soy protein concentrates or wheat gluten, was not feasible because we lacked future price trends for these commodities. We are well aware that the composition of feed by mid-century will be different compared to 2016 (our reference year), with potential influence on feed conversion and price. Ingredients, such as insect meal (Henry et al., 2015; Moon and Lee, 2015) or omega-3 rich oil deriving form marine microalgae or genetically modified terrestrial plants expressing algal genes (Tocher, 2015), already show high potential in substituting marine ingredients. Nevertheless, there are roadblocks to the successful market upscaling of these substitutes such as often low production volumes, high cost, and negative societal perceptions of GM ingredients in the European market (Tocher, 2015; Shepherd et al., 2017). According to stakeholder feedback, price developments of marine ingredient substitutes are not expected to lead to lower feed prices compared to the reference year 2016. This is particularly the case, if market prices between marine ingredients and their substitutes are linked, as previously suggested for soybean meal and fishmeal markets (Asche et al., 2013). As to future FMFO price trends, a demand flexibility that accounts for the presence of substitutes or alternatives to FMFO was included (see section “S – Social Factors”). This was also indirectly reflected within the future fish feed price.
When applying future price developments of single components (Table 1) to species-specific feed compositions, the general pattern of strong price increase under the National Enterprise scenario and weakest price increase under Global Sustainability was maintained. On species level, however, feed prices increased more for trout, carp and Norwegian salmon compared to sea bass/sea bream and organic salmon (Table 2) because the former three species had higher proportions of vegetable components (Figure 4).
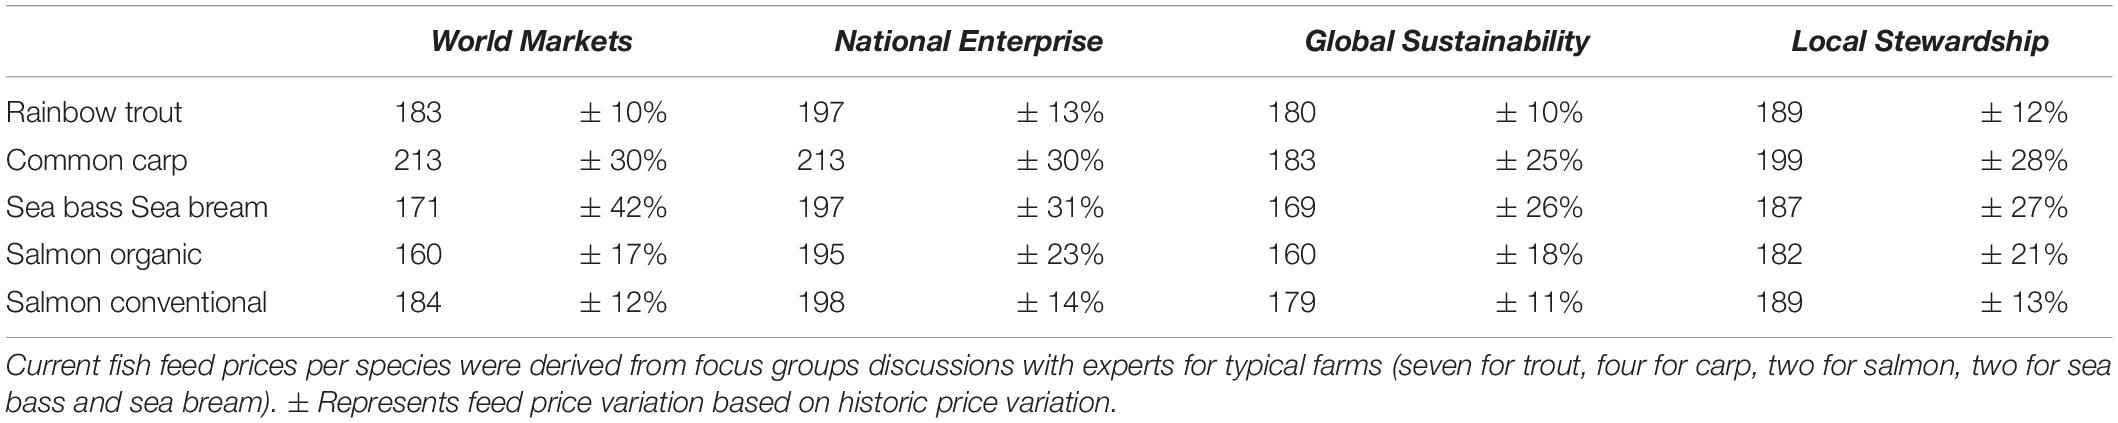
Table 2. Percentage change (%) in fish feed price from the reference year 2016–2050 for all species analyzed within climate change and European aquatic resources (CERES) under the four scenarios: World Markets, National Enterprise, Global Sustainability, and Local Stewardship.
Price Variation
Considering historical variation in prices helps define the potential volatility of prices in the future. Historical variation in fish and electricity prices were relatively small (5–6%) while those in agricultural fish feed ingredients, FM and fuel prices were more pronounced (12–15%). Historic price variation for FO was highest (19%). It is well known that most agricultural markets are characterized by a high degree of volatility tracing back to the relationship between demand, harvest variation and lagged supply response to price changes (FAO et al., 2011; Wright, 2011; Diffenbaugh et al., 2012; Figure 5A). Fish prices show less volatility and fewer price spikes than other foodstuffs and are less variable for aquaculture than capture fisheries (Tveteras et al., 2012). Asche et al. (2015) and Dahl (2017) postulated that the lower price volatility for aquaculture products reflects lower risks in output and supply compared to wild fisheries.
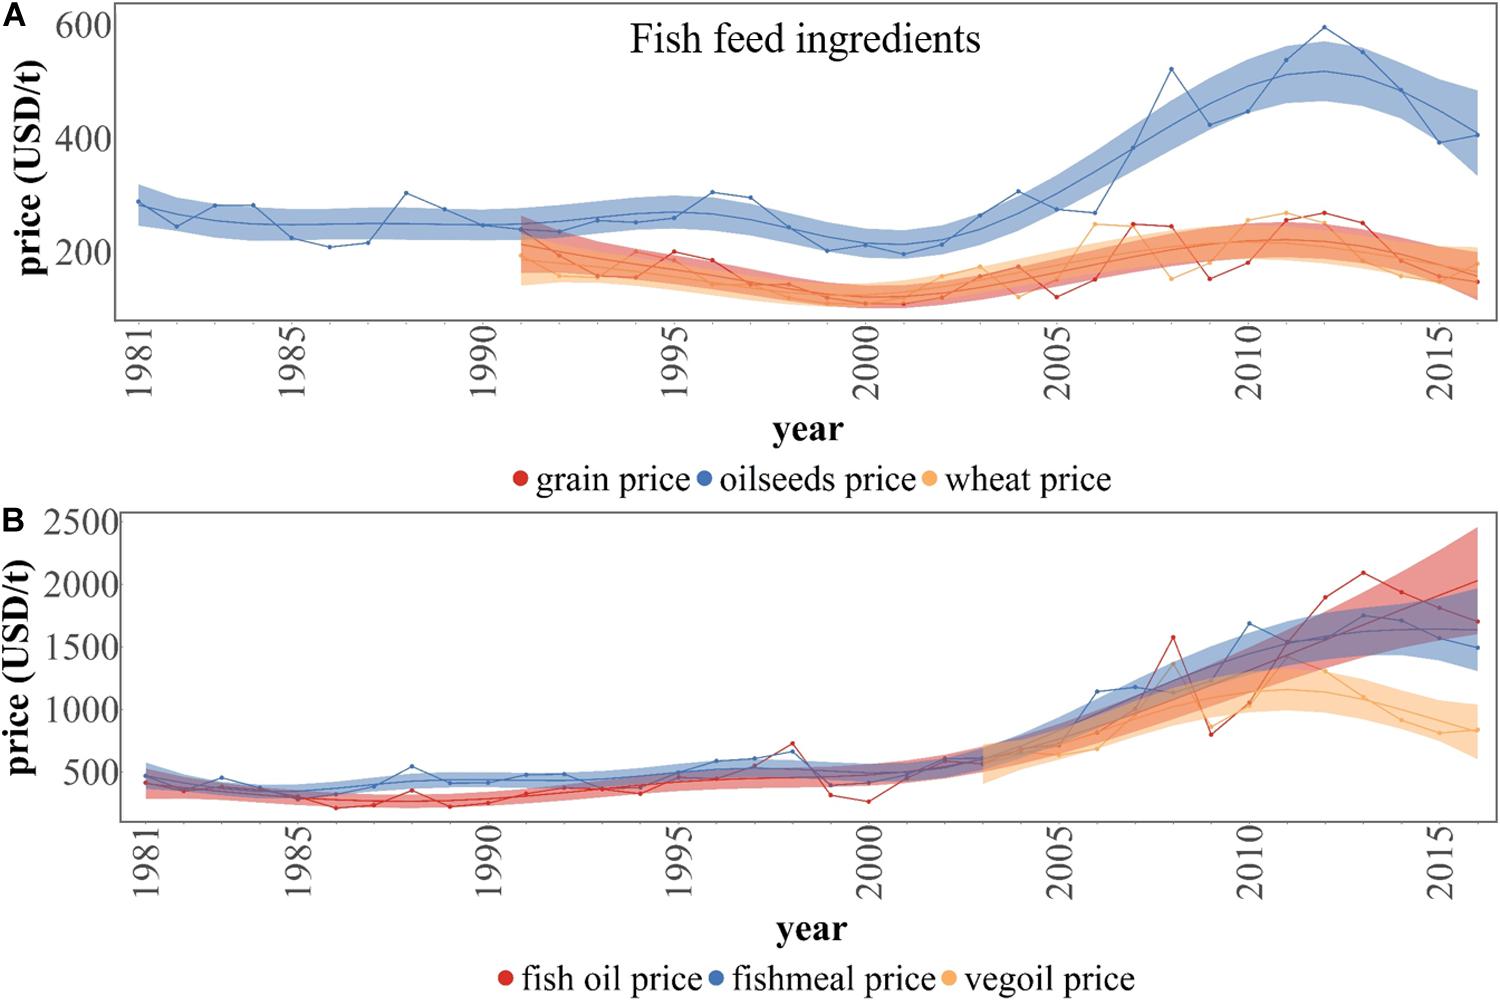
Figure 5. Historical fish feed ingredient price trends for grains, wheat, and oilseed (A), fishmeal, fish oil, vegetable oil (B) for the respective available historical data coverage (line with dots) in USD/unit with the generalized additive model (GAM) fit (solid line) and the 95% confidence interval corresponding to the predicted standard error of the model fit (shade). Data sources: crop prices: FAO Food Price Monitoring and Analysis Tool, World Bank Commodity Price Data and EC Commodity Price Dashboard, fishmeal: Indexmundi database, fish oil: commodity statistics report (Globefish, 2019).
FM volatility was found to be very low by an earlier study (Asche et al., 2015), whereas maximum fit values in historic prices resulted in potential future price variability of about 15% in the present study. Both FM and FO prices depend largely on wild fish underlying stock variation, e.g., due to the El Niño Southern Oscillation (Ubilava, 2014). Consequently, FO production is dictated by the oil-content of resource species (Tocher, 2015) and its product increasingly marketed in human supplement industry (Misund et al., 2017). During the last years, this has led to higher fish oil prices compared to FM. Additionally, this might have effected maximum price variability, which was most pronounced for FO (19%) among all feed ingredients included within the present study (Figure 5B).
With fish and feed price as key drivers of future aquaculture profitability, their price trends were also examined for single species. Historical variation in overall fish (Figure 6A) and Norwegian salmon (Figure 6B) share similar trends; variation increased with increasing price. The maximum variation was higher for Norwegian prices (13%) compared to overall fish prices (5%). Price development of a single species from a maturing commodity industry, such as Norwegian salmon, is expected to reflect the relation between input-factor and output prices or other factors such as fluctuations in production volume. Thus, Asche and Oglend (2016) reported emergent protein co-integration relationships between salmon, fishmeal and soybean prices. Exceptionally high prices in 2016 were related to deleterious impacts of sea lice and harmful algae blooms on the global salmon sector (Globefish, 2018). In addition, it does not come as surprise that the variation of historic overall fish price is lower than for a single species such as Atlantic salmon. An averaging effect of opposing price trends can be expected when these are summarized over a large number of species.
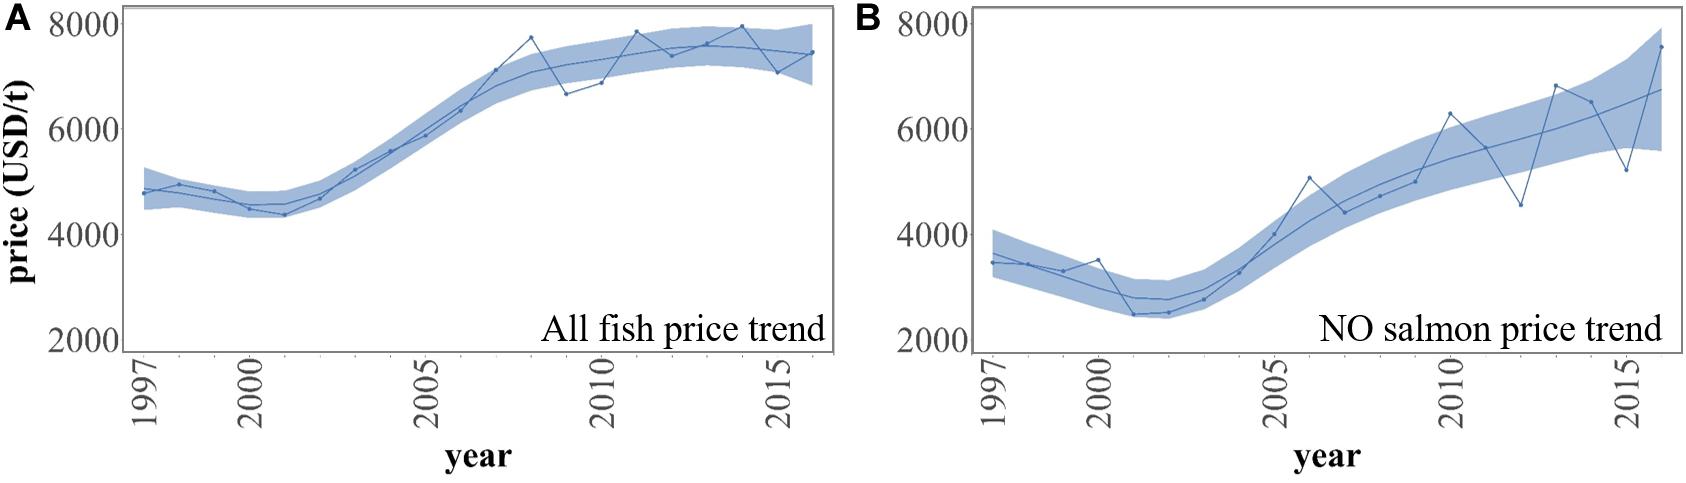
Figure 6. Historical price trends for overall fish prices (A), and Norwegian salmon (B) for the respective available historical data coverage (line with dots) in USD/ton with the generalized additive model (GAM) fit (solid line) and the 95% confidence interval corresponding to the predicted standard error of the model fit (shade). Data sources: FAO Fishery and Aquaculture Commodities statistics (fish price), NQSALMON, 2020 (salmon price).
When comparing the price variation of salmon compound feed with the allocated sum of historic single feed ingredient price variability for the same historic period, we obtained results ranging from 5.37% to 6.85% maximum variation (Figure 7). Thereby, the variation of single feed components related to Norwegian salmon feed and was very close to the price variation of the Norwegian salmon feed (6.80% vs. 6.85%). The price variation of global salmon pellet feed compared to the single feed components from Norwegian salmon feed, differed by about 15%. This could be, amongst others, explained by an averaging effect through the combination of different pellet feed mixtures and prices for the global market and/or by related currency effects. In general, there might be a delayed transfer of single raw material price changes to pellet feed prices on the market, however, the results in Figure 7 reflect that price variation based on single feed components is not very far from feed pellet price variation for the considered period.
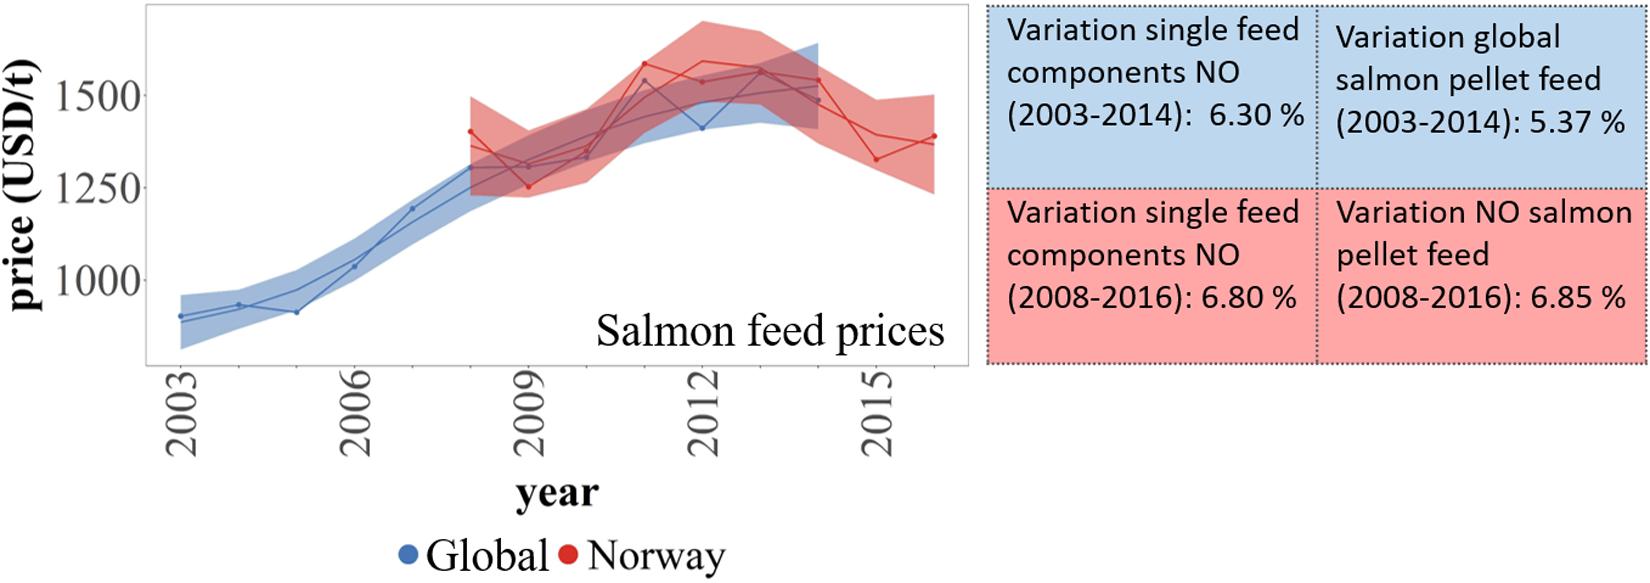
Figure 7. Historical fish feed price trend covering global feed prices from the company EWOS® as a feed supplier in the international aquaculture industry and Norwegian (NO) feed prices for the respective available historical data coverage (line with dots) in USD/unit with the generalized additive model (GAM) fit (solid line) and the 95% confidence interval corresponding to the predicted standard error of the model fit (shade). Maximum price variability of the fit is given within table on the right and compared to that of single feed components deriving from Figures 5A,B, each for the same time period. Data sources: Salmon pellet feed prices in Norway: Norwegian Directorate of Fisheries (2020), Global salmon pellet feed prices from EWOS: (Aquaflashblog, 2015).
The magnitude of price variation applied within our analysis reflected the overall pattern of sector price volatilities described in earlier studies (Wright, 2011; Tveteras et al., 2012). However, variability in prices for specific aquaculture fish species, as shown in the example of Norwegian salmon, might markedly differ from that in overall fish price. In general, we expect the market prices of both feed and fish to increase with potential higher variability than historically observed. Additionally, fish market prices might vary more under the two economic focused scenarios (World Markets and National Enterprise, see Figure 1) due to potentially higher increases in disease and frequency of harmful algae blooms compared to the more environmental scenarios (Global Sustainability and Local Stewardship, see Figure 1). Feed price variation depends on demand and supply and if the latter originates from controlled production, such as insect meal or omega 3 rich micro algae, variation is expected to be lower than when production is based on agricultural or wild fish ingredients.
Impacts of the Different Scenario Aspects on Typical Farm Profitability
The four scenarios developed in CERES (Table 1) were applied to two, different aquaculture sectors including a highly professionalized industry (Norwegian salmon) and a rather artisanal sector (German carp) with high cultural value. The effect of future price trends and biological impact (harvest weight and feed conversion ratio changes) were examined for a typical Norwegian salmon farm with a production volume of 3,680 tons located in Nordland. Future price trends in combination with assumptions on subsidies and marketing options were applied to a German carp farm producing 20 tons per year, which can be seen as a good practice farm for this sector that predominantly consists of very small family owned farms (Lasner et al., 2020). In the following, we discuss the effect of different factors on profitability (market returns against cash costs without interests).
Norwegian Salmon Farm
For the Norwegian typical farm, changes in feed costs had the strongest negative effect on profitability, whereas the most pronounced positive effect was observed for fish price trends (Figure 8). Trends on the price of fuel, mostly used to power boats, had only a marginal effect lowering operating earnings of about 4–5% for all scenarios. The impact of changes in future electricity prices was about three times larger compared to that of fuel price trends. Other costs including, e.g., fingerling costs and labor, which were assumed to increase according to inflation rates of 2% per year, had a profound effect on profitability as well. Climate change had a positive effect on both future harvest weight and feed conversion ratio (“bio”) and increased profitability by 15–27% for the two environmental focused scenarios (Global Sustainability and Local Stewardship). When combining this effect with future prices, the overall impact was small for the Global Sustainability scenario but not for the Local Stewardship scenario where 20–50% of the effect was transferred to changes in overall profitability.
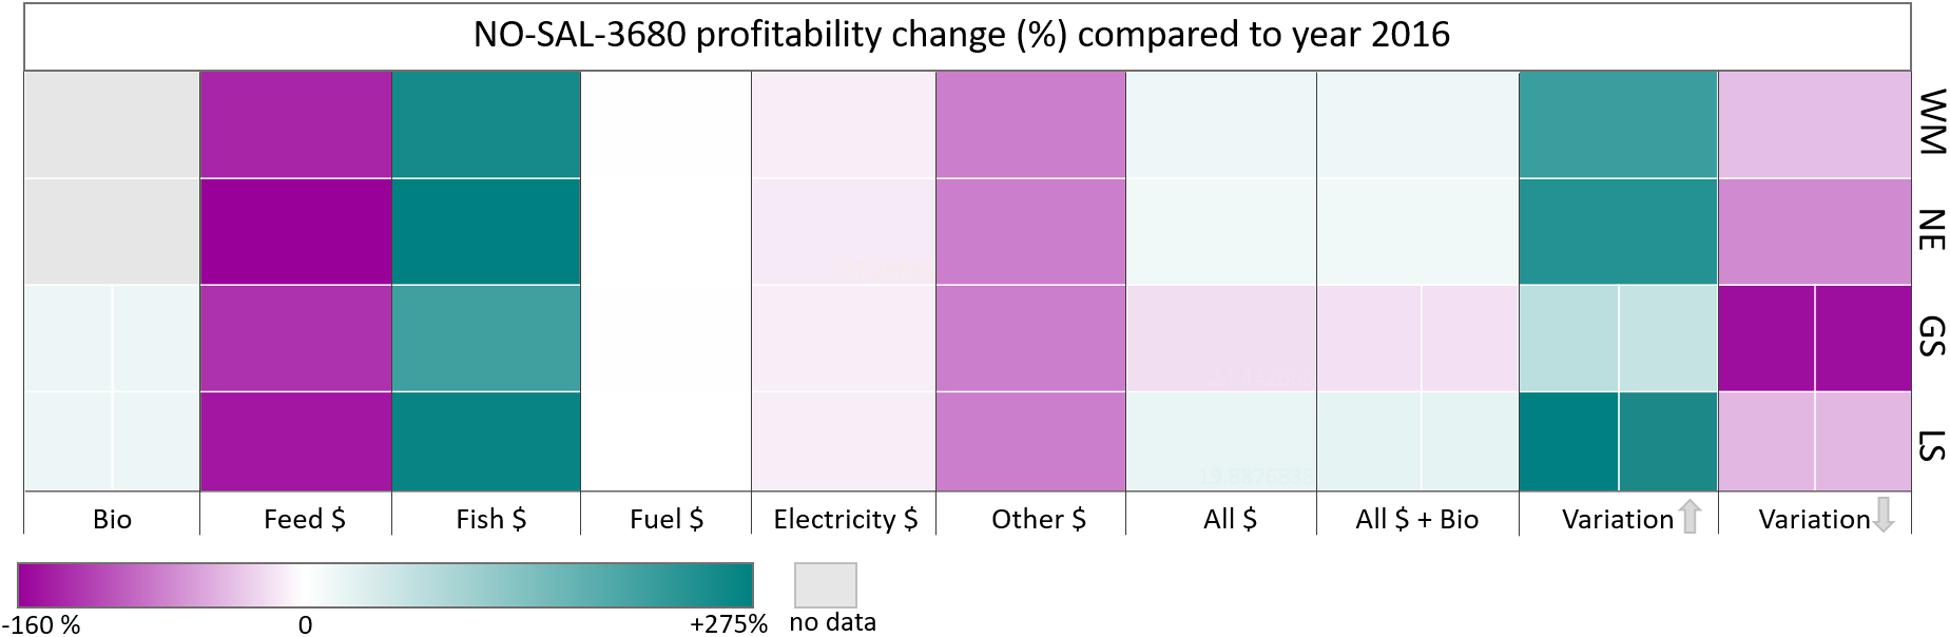
Figure 8. Separate effects of different factors on profitability (market returns against cash costs without interests) of a typical Norwegian salmon farm under the four scenarios World Markets (WM), National Enterprise (NE), Global Sustainability (GS) and Local Stewardship (LS). Bio = harvest and feed conversion ratio changes, for an extreme cold (left column) and warm year (right column), $ = price. Upper and lower variation refers to 95% upper and lower probability ranges from Monte Carlo simulation of future price variation.
Overall, the observed changes in future profitability for mid-century under the four scenarios are not expected to be severe. Future profitability, however, was very sensitive to variation in input- and output prices based on historic price variation. With the most favorable combination of prices, a maximum increase in future (2050) profitability was possible under World Markets, National Enterprise and Local Stewardship scenarios whereas profits only slightly increased in the Global Sustainability scenario compared to 2016 (11–14%). The opposite was true under the most adverse future price development with a 70% decrease in profitability compared to 2016 under the Global Sustainability scenario and less severe losses under the other three scenarios. When considering the effect of price variability on future profitability, especially fluctuating feed and fish prices had a large impact. Most pronounced was this sensitivity for the Global Sustainability scenario reaching deviations of ± 27% from future profitability for feed price and ± 43% for fish price.
German Carp Farm
The effects of perturbations in single factors on the profitability of a good practice 20 ton carp farm in Germany (Aischgrund region, Bavaria) were different compared to the Norwegian salmon farm (Figure 9). Although the future costs of carp feed (grains and wheat), increased more pronounced than that of formulated feed (see Table 2), the effect on profitability was weaker compared to Norwegian salmon. This can be traced back to the absolute lower costs for cereal compared to formulated feed that resulted in a lower dependency on feed prices for carp farms.
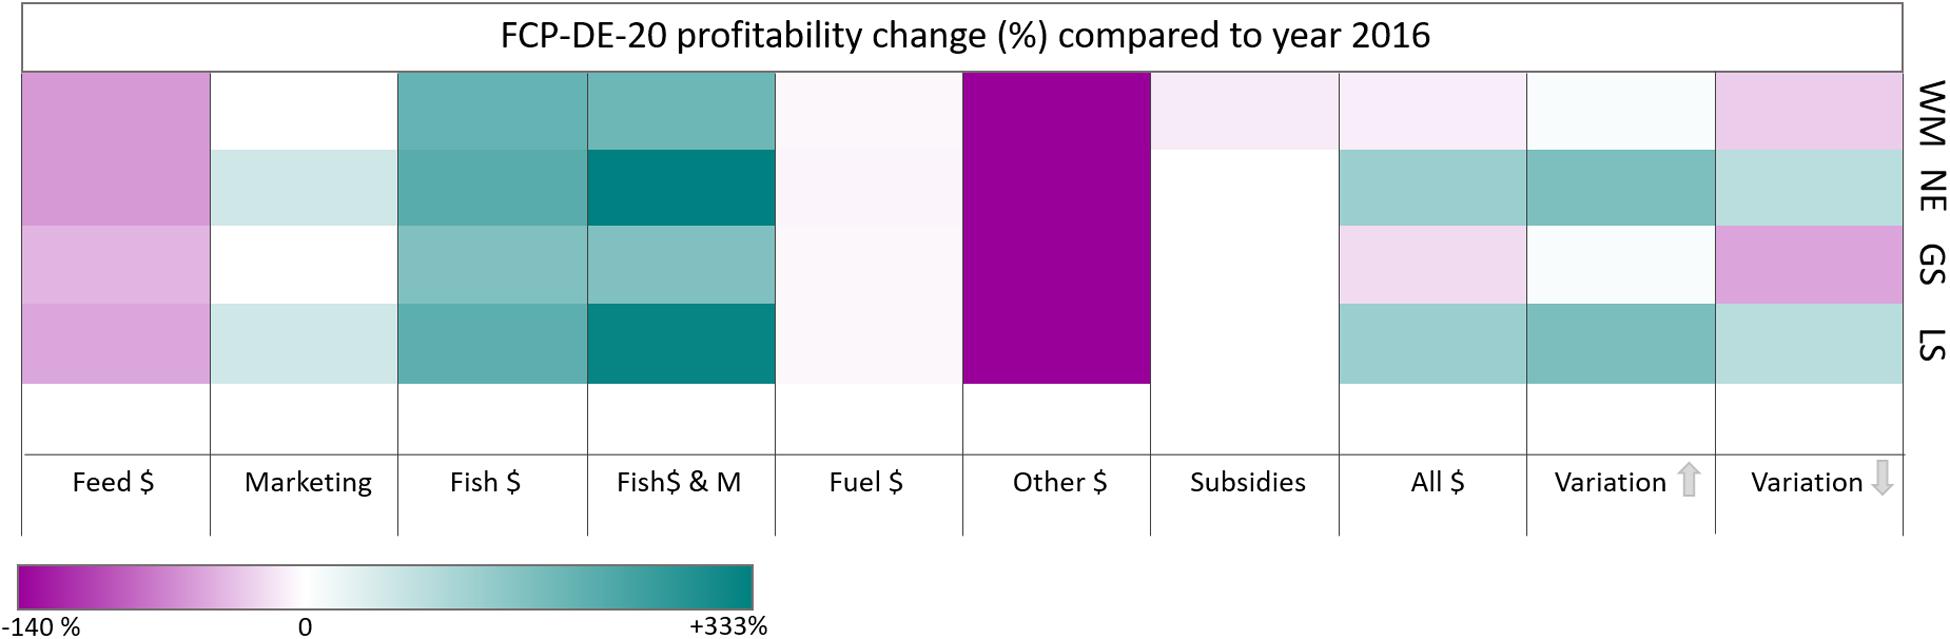
Figure 9. Separate effects of different factors on profitability (market returns against cash costs without interests) of a best practice German carp farm under the four scenarios World Markets (WM), National Enterprise (NE), Global Sustainability (GS) and Local Stewardship (LS). $ = price, M = Marketing referring to region marketing options under Protected Geographic Indications label. Upper and lower variation refers to 95% upper and lower probability ranges from Monte Carlo simulations of future price variation.
The main costs for the good practice German carp farm were fingerling costs, which were included within “other costs,” and thus, explaining part of the pronounced negative impact on profitability of this cost category. The elimination of subsidies under the World Markets scenario did not lead to more severe effects on future profitability compared to the effect of fish price developments under Global Sustainability. However, it has to be kept in mind that subsidies were maintained to the amount of 2016 and additional mid- and long-term costs were not taken into account. The impact of future fuel price trends was very similar to that of the Norwegian salmon farm (4–5% losses in profitability) and played only a marginal role. Fuel is used for vehicles and was a minor cost category in 2016 as well. Future fish price had the most positive, single effect on profitability, which was amplified in the two local (National Enterprise, Local Stewardship) scenarios, when regional marketing was taken into account. Consequently, this produced an increase in future profitability under the two local scenarios, which persisted also under unfavorable future price trends. This was attributed to the assumption that the total production volume was marketed as PGI certified carp (“Aischgründer Karpfen”), which can achieve between 15 and 30% higher returns than unlabeled carp (see Lasner et al., 2020). The opposite could be observed for the two global scenarios, where the carp farm would be less profitable when combining all future price trends and assumptions. Under optimal future price development, there was a good chance to maintain the profitability of the reference year 2016. Considering price variation per commodity, a similar effect was observed as for Norwegian salmon, as future profitability was most sensitive to the assumed price variation based on historic data for fish and feed price. Again, this effect was most pronounced under the Global Sustainability Scenario reaching deviations of ± 18% for feed and ± 32% for fish price (returns) compared to future profitability based on the projected price trends.
Discussion
Climate change is and will continue to impact on food production including seafood production in complex ways. Through both direct and indirect pathways, climate change will have economic implications for growth and distribution of incomes and thus demand. In addition, aquaculture is expected to play a critical role in meeting growing global food demands in the future. Within this study, we provide an operationalized framework of plausible yet contrasting future scenarios to explore consequences of climate change as well as societal and economic trends on the aquaculture sector. The two examples of different production systems provide a first impression of the wide applicability of the presented climate change scenario implementations for the aquaculture sector. Future profitability of the typical farms examined here was less sensitive to future environmental change (warming effects on the salmon farm) and more sensitive to the future development of costs, returns (both farms) and marketing options (carp farm). These results highlight the importance of using future scenarios that include not only environmental but also, political, economic, social, technological and legal (PESTEL) dimensions. There is, however, uncertainty associated with future price developments as price dynamics presented here do not consider inter-annual strong fluctuations and describe rather general trends in commodity prices that potentially underestimate sector-specific differences. Supply shortages triggered by political events or crises may generate rapid price fluctuations with the COVID-19 pandemic being a recent example. Lower demand at restaurants led to a 30% decrease in the price of imported live-fresh seafood within the EU, but for example no significant changes in volume or prices were observed for Norwegian salmon until mid-May 2020 (Love et al., 2020). Crude oil price response varied between different phases of the pandemic and fell together with other political developments (Aloui et al., 2019). In general, responses to COVID-19 will have complex impacts on the demand and prices for fish products and other commodities (e.g., feed) and synergistic effects with climate change or other factors are conceivable as well as a (potentially long-term) focus to more locally sourced products. Moreover, in terms of building contrasting scenarios, the current magnitude of the impact of COVID-19 has likely set a new baseline on what society may define as a “plausible” future.
The results above represent future profitability of selected typical farms and are not scalable to the whole sector nor provide statistical representations. However, they allow in-depth analyses of changes and comparable benchmarking on interregional basis (Lasner et al., 2017), which we regard as valuable basis, e.g., for decision- makers. Further, environmental small-scale differences such as those observed for Norwegian salmon farms, where production occurs across a large latitudinal range (e.g., within and outside specific fjords), underscore the importance of making local projections at the farm site level (Falconer et al., 2020). In Norway, farms in the southernmost parts are expected to have a narrower safety margin with respect to temperature increase compared to those located further north (Lorentzen, 2008), and therefore would be important to be included in similar future studies in addition to the northern farm examined in the present study. Moreover, within the present study we could only include RCP4.5 model results for future harvest weight and FCR changes for Atlantic salmon reared in Norwegian waters. Effects might be different under more severe GHG emission scenarios as indicated by the study of Froehlich et al. (2018) reporting a major decline in suitable aquaculture areas for the Norwegian EEZ under RCP8.5.
Further, although farms in the north may not be exposed to conditions above the temperature tolerance of salmon, increased temperatures, may also increase the prevalence of disease and parasites, which, historically, were not an issue (Falconer et al., 2020). The colder northern regions of Norway have currently less sea lice occurrence than more southern regions of the country (Jansen et al., 2012). Potential climate-related changes in disease and parasite risk and their consequences on profitability were not included within the present study. Health impacts reducing growth and the efficiency of feed conversion and/or increasing mortality are conceivable that would decrease the available biomass for marketing and increase costs for monitoring or veterinary intervention. Abolofia et al. (2017) estimated that one additional lice per fish produced in northern Norway (the location of our typical salmon farm), could cause a ∼3% reduction in growth with related economic consequences.
Although these risks are important to consider, adapting to changes in the future environment will likely be easier for aquaculture compared to fisheries because the former sector has a greater level of control over its production. In aquaculture, feeding, breeding, disease mitigation, and within freshwater or closed systems, water availability, temperature, and quality, can be (partly) controlled. Increasing the control of specific attributes of farms, however, is often accompanied by additional costs (financial resources must be available) and sometimes technological progress.
It should be noted that a specific regional adaptation plans of the aquaculture sector were not taken into account within the present analysis. For example, the Norwegian salmon sector has already invested in innovative production systems allowing a higher level of automation or to move production further offshore (e.g., “Havfarm”) and apply semi-closed or closed systems (Lekang et al., 2016; Fløysand and Jakobsen, 2017; Fish Farmer, 2019). Especially within scenarios where emphasis is placed on economic competitiveness and profits with larger departures from today’s climate (World Markets and National Enterprise), such investment in technological solutions will be critical whether in new cage systems to withstand rougher weather conditions or better breeding/environmental monitoring to offset increased disease risk due to warming waters. In addition, the introduction of hybrid vessels [e.g., Edel aquaculture boat, Danfoss (2019)] will contribute to a lower dependency on fuel prices, which would be of particular interest under the National Enterprise scenario. On the other hand, such investments will most likely increase long-term costs.
While the Norwegian salmon sector is highly capitalized, this could be even more critical to sub-sectors with lower profit margins such as German carp farms. Here, further investments might be necessary to balance a potential increased frequency and intensity of droughts or extreme flow events in freshwater systems (Woodward et al., 2010) or potentially increased disease risk, again with different regional level impacts. The latter may have implications on mortality, growth, costs of monitoring, veterinary intervention, and, the implementation of statutory control measures, which may require the culling of stock. Strategies to remedy water shortages could include investment into additional wells, water pumps or pipelines. Such additional financial burdens, however, could lead to significant long-term losses in profitability if not balanced by higher market returns (e.g., as assumed for region marketing opportunities under the National Enterprise scenario). In addition, carp farms in Germany have high opportunity costs relying on factors such as unpaid labor (i.e., employing family members), which must also be considered in the long-term (Lasner et al., 2020). On the other hand, carp farms such as the good practice farm are often combined with crop production (Lasner et al., 2020) and are, therefore, more independent from future price developments in the cereal market than assumed in the analysis.
Besides environmental adaptive investments, further developments might be worth being considered in order to capture the multidimensional nature of aquaculture under socio-political climate change scenarios. The regulatory environment and its uncertainty may result in a substantial cost burden for aquaculture producers (Anderson et al., 2019), for example state-legislated, environmental impact studies might become obligatory for aquaculture operations if future society more closely resembles as depicted by the Global Sustainability and Local Stewardship scenarios. On the other hand, regulatory changes might offer new chances. Focusing on economic growth, the World Markets scenario was characterized by less regulated markets. This could create opportunities for new aquaculture licenses such as for recirculating or offshore systems as well as for novel feed ingredients derived for example from GM terrestrial crops (Shepherd et al., 2017). Likewise, political openness towards genetic engineering of aquaculture animals itself, for instance AquAdvantage Salmon decending from wild salmon stocks (Waltz, 2017), would also be imaginable under some scenarios. Concerning the National Enterprise scenario, the use of already existing GM species could be conceivable for European countries that are currently less restrictive regarding GMO (e.g., Bongoni, 2015), assuming that a higher regionalization in regulation is becoming effective. Under Global Sustainability and Local Stewardship, no legal push toward GMO would be expected, for political but also social and ethical reasons. Other social aspects that might contribute to regulatory elements are, for example, animal welfare criteria and related effort for producers. Beyond that, social acceptability in the context of aquaculture could also be extended to the community’s role in shaping the sector and determining its operation when issuing new licenses or renewing old ones. Such a community’s engaging role is increasingly discussed as social license to operate for the aquaculture sector (e.g., Baines and Edwards, 2018; Mather and Fanning, 2019) and would be conceivable under the two low resource scenarios with cooperative society structures (Global Sustainability and Local Stewardship). It may even become effective in combination with legal requirements for licensing.
Again, the complex interaction of different socio-political dimensions highlights the importance of considering the different PESTEL elements, and provides a more comprehensive picture of the potential impacts of climate change on (and adaptation pathways for) the sector. We urge other bio-economic studies to apply the scenarios developed here to facilitate comparison of climate change impacts on different components of the aquaculture sector. Although it is important to note that no single scenario will ever come true in its entirety (see Pinnegar et al., under review), scenarios are important tools to create awareness of potential futures.
Conclusion
Aquatic systems that sustain aquaculture are already effected by climate change induced alterations and projections indicate that these will be accentuated in the future. In contrast, related economic and societal trends on the sector, such as the development of production costs or marketing options, have received less attention. Recognizing that the overall adaptive capacity of the sector will determine the impact of climate change, we provide an operationalized multidimensional framework of contrasting future scenarios that aims at improving advice for adaptation planning. The presented case study results indicate that the sector might be more sensitive to the future development of feed costs, returns and marketing options compared to future environmental change (e.g., warming). Future scenarios should therefore also include political, social, legal and economic dimensions alongside the anticipated changes in the aquatic environment. We recommend the application and extension of the provided framework in order to allow comparison of different species and production systems across regions and climatic zones. The identification of the sector’s potential winners and losers is thereby especially important in the light of its expected significant contribution to providing the growing world’s population with valuable protein.
Data Availability Statement
The raw data supporting the conclusions of this article will be made available by the authors, without undue reservation.
Author Contributions
CK, KH, JP, and MP contributed to conception and design of the study. CK conducted the profitability and sensitivity analysis and wrote the first draft of the manuscript. EP conducted the FMFO analysis and wrote sections of the manuscript. AC contributed to the biological analysis. AT contributed to future price projections (MAGNET). CK and SR conducted the price variation analysis. GM defined the typical salmon farm. All authors contributed to drafting of the manuscript and approved the submitted version.
Funding
This project received funding from the European Union’s Horizon 2020 research and innovation program under grant agreement No 678193 (CERES – Climate change and European Aquatic Resources). This document reflects only the authors’ view. The European Commission is not responsible for the dissemination of CERES project results and for any use that may be made of the information.
Conflict of Interest
AC was employed by the company Longline Environment, Ltd.
The remaining authors declare that the research was conducted in the absence of any commercial or financial relationships that could be construed as a potential conflict of interest.
Acknowledgments
The authors would like to acknowledge Dr. Tobias Lasner and the agri benchmark network for the support and providing the typical German carp farm data. They extend their thanks and gratitude to all stakeholders and farmers that contributed to this work as well as CERES partners attending the aquaculture workshop and for providing feedback throughout the analysis.
References
Abolofia, J., Wilen, J. E., and Asche, F. (2017). The cost of lice: quantifying the impacts of parasitic sea lice on farmed salmon. Mar. Res. Econ. 32, 329–349. doi: 10.1086/691981
Allison, E. H., Perry, A. L., Badjeck, M. C., Adger, W. N., Brown, K., Conway, D., et al. (2009). Vulnerability of national economies to the impacts of climate change on fisheries. Fish Fish. 10, 173–196. doi: 10.1111/j.1467-2979.2008.00310.x
Aloui, D., Goutte, S., Khaled, G., and Hchaichi, R. (2019). COVID 19’s impact on crude oil and natural gas S&P GS Indexes. Energy Economics in Sustainability [Preprint], Available online at: https://papers.ssrn.com/sol3/papers.cfm?abstract_id=3587740 (assessed August 21, 2020).
Anderson, J. L., Asche, F., and Garlock, T. (2019). Economics of aquaculture policy and regulation. Annu. Rev. Resour. Econ. 11, 101–123. doi: 10.1146/annurev-resource-100518-093750
Aquaflashblog (2015). First Quarter Currency Environment Drags Feed Prices Above 11 NOK. Available online at: https://aquaflashblog.wordpress.com/2015/06/01/first-quarter-currency-environment-drags-feed-prices-above-11-nok/ (accessed February 2020).
Asche, F., Dahl, R. E., and Steen, M. (2015). Price volatility in seafood markets: farmed vs. Wild Fish. Aquac. Econ. Manag. 19, 316–335. doi: 10.1080/13657305.2015.1057879
Asche, F., and Oglend, A. (2016). The relationship between input-factor and output prices in commodity industries: the case of Norwegian salmon aquaculture. J. Commod. Mark. 1, 35–47. doi: 10.1016/j.jcomm.2015.11.001
Asche, F., Oglend, A., and Tveteras, S. (2013). Regime shifts in the fish meal/soybean meal price ratio. J. Agric. Econ. 64, 97–111. doi: 10.1111/j.1477-9552.2012.00357.x
Asiedu, B., Malcolm, D., and Iddrisu, S. (2019). Assessing the economic impact of climate change in the small-scale aquaculture industry of Ghana, West Africa. AAS Open Res. 1, 26. doi: 10.12688/aasopenres.12911.2
Baines, J., and Edwards, P. (2018). The role of relationships in achieving and maintaining a social licence in the New Zealand aquaculture sector. Aquaculture 485, 140–146. doi: 10.1016/j.aquaculture.2017.11.047
Barange, M., Bahri, T., Beveridge, M. C. M., Cochrane, K. L., Funge-Smith, S., and Poulain, F. (2018). Impacts of Climate Change on Fisheries and Aquaculture - Synthesis of Current Knowledge, Adaptation and Mitigation Options. FAO Fisheries and Aquaculture technical Paper 627. Rome: FAO.
Béné, C., Barange, M., Subasinghe, R., Pinstrup-Andersen, P., and Merino, G. (2015). Feeding 9 billion by 2050 - Putting fish back on the menu. Food Sec. 7, 261–274. doi: 10.1007/s12571-015-0427-z
Berkhout, F., Hertina, J., and Jordan, A. (2002). Socio-economic futures in climate change impact assessment: using scenarios as ‘learning machines’. Glob. Environ. Chang. 12, 83–95. doi: 10.1016/s0959-3780(02)00006-7
Bongoni, R. (2015). East versus West: acceptance of GM foods by European and Asian consumers. Nutri. Food Sci. 46, 628–636. doi: 10.1108/nfs-10-2015-0121
Bouwer, L. M. (2019). “Observed and projected impacts from extreme weather events: implications for loss and damage,” in Loss and Damage from Climate Change: Concepts, Methods and Policy Options, eds R. Melcher, T. Schinko, S. Surminski, and J. Linnerooth-Bayer (Cham: Springer), 63–82. doi: 10.1007/978-3-319-72026-5_3
Brander, K. M. (2007). Global fish production and climate change. Proc. Natl. Acad. Sci. U.S.A. 104, 19709–19714.
CERES D1. 3 (2018). Deliverable Report 1.3: Projections of Physical and Biogeochemical Parameters and Habitat Indicators for European Seas, Including Synthesis of Sea Level Rise and Storminess. Kay, S., Andersson, H., Catalán, I.A., Drinkwater, K.F., Eilola, K., Jordà, G., Ramirez-Romero. Available online at: ceresproject.eu (accessed February, 2020).
Chan, C. Y., Tran, N., Dao, C. D., Sulser, T. B., Phillips, M. J., Batka, G., et al. (2017). Fish to 2050 in the ASEAN Region. Working Paper: 2017-2011. Washington DC: International Food Policy Research Institute (IFPRI).
Cubillo, A. M., Ferreira, J. G., Robinson, S. M. C., Pearce, C. M., Corner, R. A., and Johansen, J. (2018). Role of deposit feeders in integrated multi-trophic aquaculture - A Model analysis. Aquaculture 453, 54–66. doi: 10.1016/j.aquaculture.2015.11.031
Dahl, R. E. (2017). A study on price volatility in the aquaculture market using value-at-Risk (VaR). Aquac. Econ. Manag. 21, 125–143. doi: 10.1080/13657305.2017.1262475
Danfoss (2019). Norway’s Leading Producer of Sustainable Salmon Unveils First Hybrid Fish Farming Boat. Available online at: https://www.danfoss.com/en/about-danfoss/news/dps/edel-aquaculture-boat/ (accessed January 2020).
Delgado, C. L., Crosson, P., and Courbois, C. (1997). The Impact of Livestock and Fisheries on Food Availability and Demand in 2020. MSSD Discussion Paper, No.19. Washington, DC: IFPRI.
Delgado, C. L., Wada, N., Rosegrant, M. W., Meijer, S., and Ahmed, M. (eds) (2003). Fish to 2020: Supply and Demand in Changing Global Markets. Penang: WorldFish.
Dey, M. M., Rosegrant, M. W., Gosh, K., Chen, O. L., and Valmonte-Santos, R. (2015). Analysis of the economic impact of climate change and climate change adaptation strategies for fisheries sector in Pacific coral triangle countries: model, estimation strategy and baseline results. Mar. Policy 67, 156–163. doi: 10.1016/j.marpol.2015.12.011
Diffenbaugh, N. S., Hertel, T. W., Scherer, M., and Verma, M. (2012). Response of corn markets to climate volatility under alternative energy futures. Nat. Clim. Chang. 2, 514–518. doi: 10.1038/nclimate1491
Doelman, J. C., Stehfest, E., Tabeau, A., van Meijl, H., Lassaletta, L., Gernaat, D. E. H. J., et al. (2018). Exploring SSP land-use dynamics using the IMAGE model: regional and gridded scenarios of land-use change and land-based climate change mitigation. Glob. Environ. Chang. 48, 119–135. doi: 10.1016/j.gloenvcha.2017.11.014
Ekstrom, J. A., Suatoni, L., Cooley, S. R., Pendleton, L. H., Waldbusser, G. G., Cinner, J. E., et al. (2015). Vulnerability and adaptation of US shellfisheries to ocean acidification. Nat. Clim. Chang. 5, 207–214. doi: 10.1038/nclimate2508
European Commission (2019). Commodity Price Dashboard. Available online at: https://ec.europa.eu/agriculture/markets-and-prices/price-monitoring/monthly-prices_en (accessed March 2019).
Eurostat database (2019). Statistical Office of the European Communities (EUROSTAT). Available online at: https://ec.europa.eu/eurostat/data/database (accessed March 2019).
Falconer, L., Hjøllo, S. S., Telfer, T. C., McAdam, B. J., Hermansen, O., and Ytteborg, E. (2020). The importance of calibrating climate change projections to local conditions at aquaculture sites. Aquaculture 514:734487. doi: 10.1016/j.aquaculture.2019.734487
FAO (2018). The State of World Fisheries and Aquaculture 2018 - Meeting the Sustainable Development Goals. Licence: CC BY-NC-SA 3.0 IGO. Rome: Food and Agriculture Organization of the United Nations (FAO).
FAO, IFAD, IMF, OECD, UNCTAD, WFP, et al. (2011). Price Volatility in Food and Agricultural Markets: Policy Responses. License: CC BY 3.0 IGO. Washington, DC: World Bank.
FAO Fishery and Aquaculture Commodities statistics (2019). Food and Agriculture Organization of the United Nations (FAO). Rome. Available online at: http://www.fao.org/fishery/statistics/global-commodities-production/en (accessed March 2019).
Ferreira, J. G., Saurel, C., and Ferreira, J. M. (2012). Cultivation of gilthead bream in monoculture and integrated multi-trophic aquaculture. Analysis of production and environmental effects by means of the FARM model. Aquaculture 358/359, 23–34. doi: 10.1016/j.aquaculture.2012.06.015
Ferreira, J. G., Sequeira, A., Hawkins, A. J. S., Newton, A., Nickell, T. D., Pastres, R., et al. (2009). Analysis of coastal and offshore aquaculture: application of the FARM model to multiple systems and shellfish species. Aquaculture 289, 32–41. doi: 10.1016/j.aquaculture.2008.12.017
Fish Farmer (2019). Making waves - Nordlaks strategy will “revolutionise fish farming” BY Vince McDonagh. Fish Farmer 42, 60–61.
Fløysand, A., and Jakobsen, S.-E. (2017). Industrial renewal: narratives in play in the development of green technologies in the Norwegian salmon farming industry. Geogr. J. 183, 140–151. doi: 10.1111/geoj.12194
Food and Agriculture Organization of the United Nations (2019). Food Price Monitoring and Analysis Tool. Rome: Food and Agriculture Organization of the United Nations (FAO).
Free, C. M., Thorson, J. T., Pinsky, M. L., Oken, K. L., Wiedenmann, J., and Jensen, O. P. (2019). Impacts of historical warming on marine fisheries production. Science 363, 979–983. doi: 10.1126/science.aau1758
Froehlich, H. E., Gentry, R. R., and Halpern, B. S. (2018). Global change in marine aquaculture production potential under climate change. Nat. Ecol. Evol. 2, 1745–1750. doi: 10.1038/s41559-018-0669-1
Frost, M., Baxter, J. M., Buckley, P. J., Cox, M., Cye, S. R., and Harvey, N. W. (2012). Impacts of climate change on fish, fisheries and aquaculture. Aquat. Conserv. Mar. Freshw. Ecosyst. 22, 331–336. doi: 10.1002/aqc.2230
Global Trade Analysist Project [GTAP] (2007). Database, Version 8. Available online at: https://www.gtap.agecon.purdue.edu/databases/v8/default.asp (assessed June, 2019).
Globefish (2018). Globefish Highlights, Issue 4/2018, Quaterly Update on World Seafood Markets. Rome: FAO.
Guillen, J., Asche, F., Carvalhoa, N., Polancod, J. M. F., Llorented, I., Nielsen, R., et al. (2019). Aquaculture subsidies in the European Union: evolution, impact and future potential for growth. Mar. Policy 104, 19–28. doi: 10.1016/j.marpol.2019.02.045
Heat Roadmap Europe D 6. 1. (2017). Deliverable 6.1 EU28 Fuel Prices for 2015, 2030 and 2050. Duiæ, N., Štefaniæ, N., Luliæ, Z., Krajaèiæ, G., Pukšec, T. Novosel, T. Available online at: heatroadmap.eu (accessed January, 2020).
Henry, M., Gasco, L., Piccolo, G., and Fountoulaki, E. (2015). Review on the use of insects in the diet of farmed fish: past and future. Anim. Feed Sci. Tech. 203, 1–22. doi: 10.1016/j.anifeedsci.2015.03.001
IndexMundi (2019). IndexMundi Statistics Data Portal. Available online at: https://www.indexmundi.com/ (accessed March, 2019).
Isermeyer, F. (2012). “Methodologies and comparisons of production costs - a global overview,” in Sustainability and Production Costs in the Global Farming Sector: Comparative Analysis and Methodologies, eds S. Langrell, P. Ciaian, and S. Gomez y Paloma (Brussels: Joint Research Centre (JRC)), 21–50.
Jansen, P. A., Kristoffersen, A. B., Viljugrein, H., Jimenez, D., Aldrin, M., and Stien, A. (2012). Sea lice as a density-dependent constraint to salmonid farming. Proc. R. Soc. B 279, 2330–2338. doi: 10.1098/rspb.2012.0084
Johnson, G., and Scholes, K. (2002). Exploring Corporate Strategy, 6th Edn, Upper Saddle River, NJ: Prentice-Hall.
Jones, M. C., and Cheung, W. W. L. (2014). Multi-model ensemble projections of climate change effects on global marine biodiversity. ICES J. Mar. Sci. 72, 741–752. doi: 10.1093/icesjms/fsu172
Jones, M. C., Dye, S. R., Pinnegar, J. K., Warren, R., and Cheung, W. W. L. (2015). Using scenarios to project the changing profitability of fisheries under climate change. Fish Fish. 16, 603–622. doi: 10.1111/faf.12081
Kc, S., and Lutz, W. (2017). The human core of the shared socioeconomic pathways: population scenarios by age, sex and level of education for all countries to 2100. Glob. Environ. Chang. 42, 181–192. doi: 10.1016/j.gloenvcha.2014.06.004
Kobayashi, M., Msangi, S., Batka, M., Vannuccini, S., Dey, M., and Anderson, J. L. (2015). Fish to 2030: the role and opportunity for aquaculture. Aquacult. Econ. Manag. 19, 282–300. doi: 10.1080/13657305.2015.994240
Lasner, T., Brinker, A., Nielsen, R., and Rad, F. (2017). Establishing a benchmarking for fish farming -Profitability, productivity and energy efficiency of German, Danish and Turkish rainbow trout grow-out systems. Aquac. Res. 48, 3134–3148. doi: 10.1111/are.13144
Lasner, T., Mytlewski, A., Nourry, M., Rakowski, M., and Oberle, M. (2020). Carp land: economics of fish farms and the impact of region-marketing in the Aischgrund (DEU) and Barycz Valley (POL). Aquaculture 519:734731. doi: 0.1016/j.aquaculture.2019.734731
Lekang, O. I., Salas-Bringas, C., and Bostock, J. C. (2016). Challenges and emerging technical solutions in on-growing salmon farming. Aquacult. Int. 24, 757–766. doi: 10.1007/s10499-016-9994-z
Li, S., Yang, Z., Nadolnyak, D., and Zhang, Y. (2016). Economic impacts of climate change: Profitability of freshwater aquaculture in China. Aquac. Res. 47, 1537–1548. doi: 10.1111/are.12614
Lorentzen, T. (2008). Modeling climate change and the effect on the Norwegian salmon farming industry. Nat. Resour. Model. 21, 416–435. doi: 10.1111/j.1939-7445.2008.00018.x
Love, D. C., Allison, E. H., Asche, F., Belton, B., Cottrell, R., Froehlich, H. E., et al. (2020). Emerging COVID-19 impacts, responses, and lessons for building resilience in the seafood system. SocArXiv [Preprint], Available online at: https://osf.io/preprints/socarxiv/x8aew/ (accessed August 21, 2020).
Madaleno, M., Moutinho, V. M. F., and Mota, J. H. (2015). Time relationships among electricity and fossil fuel prices: industry and households in Europe. Int. J. Ener. Econom. Policy 5, 525–533.
Mather, C., and Fanning, L. (2019). Social licence and aquaculture: towards a research agenda. Mar. Policy 99, 275–282. doi: 10.1016/j.marpol.2018.10.049
Merino, G., Barange, M., Blanchard, J. L., Harle, J., Holmes, R., Allen, I., et al. (2012). Can marine fisheries and aquaculture meet fish demand from a growing human population in a changing climate? Glob. Environ. Chang. 22, 795–806. doi: 10.1016/j.gloenvcha.2012.03.003
Misund, B., Oglend, A., Beatriz, R., and Pincinato, M. (2017). The rise of fish oil: from feed to human nutritional supplement. Aquacul. Econ. Manag. 21, 185–210. doi: 10.1080/13657305.2017.1284942
Moon, S. J., and Lee, J. W. (2015). Current views on insect feed and its future. Entomol. Res. 45, 283–285. doi: 10.1111/1748-5967.12138
Mullon, C., Mittaine, J. F., Thébaud, O., Péron, G., Merino, G., and Barange, M. (2009). Modeling the global fishmeal and fish oil markets. Nat. Resour. Model. 22, 564–609. doi: 10.1111/j.1939-7445.2009.00053.x
Mullon, C., Steinmetz, F., Merino, G., Fernandes, J. A., Cheung, W. W. L., Butenschön, M., et al. (2016). Quantitative pathways for Northeast Atlantic fisheries based on climate, ecological-economic and governance modelling scenarios. Ecol. Modell. 320, 273–291. doi: 10.1016/j.ecolmodel.2015.09.027
Narita, D., and Rehdanz, K. (2016). Economic impact of ocean acidification on shellfish production in Europe. J. Environ. Plan. Manag. 60, 500–518. doi: 10.1080/09640568.2016.1162705
Neubauer, P., and Andersen, K. H. (2019). Thermal performance of fish is explained by an interplay between physiology, behaviour and ecology. Conserv. Physiol. 7:coz025. doi: 10.1093/conphys/coz025
Neuheimer, A. B., Thresher, R. E., Lyle, J. M., and Semmens, J. M. (2011). Tolerance limit for fish growth exceeded by warming waters. Nat. Clim. Chang. 1, 110–113. doi: 10.1038/nclimate1084
Norwegian Directorate of Fisheries (2020). Available online at: https://www.fiskeridir.no/ (accessed February 2020). doi: 10.1038/nclimate1084
NQSALMON (2020). National Association of Securities Dealers Automated Quotations Salmon (NQ SALMON), Copenhagen. Available online at: https://salmonprice.nasdaqomxtrader.com/public/report (accessed March 2020).
Nunes, J. P., Ferreira, J. G., Bricker, S. B., O’Loan, B., Dabrowskie, B., Dallaghan, A. J. S., et al. (2011). Towards an ecosystem approach to aquaculture: assessment of sustainable shellfish cultivation at different scales of space, time and complexity. Aquaculture 315, 369–383. doi: 10.1016/j.aquaculture.2011.02.048
OECD-FAO (2018). OECD-FAO Agricultural Outlook 2018-2027. Rome: Food and Agriculture Organization of the United Nations (FAO).
O’Neill, B. C., Kriegler, E., Riahi, K., Ebi, K. L., Hallegatte, S., Carter, T. R., et al. (2014). A new scenario framework for climate change research: the concept of shared socioeconomic pathways. Clim. Chang. 122, 387–400. doi: 10.1007/s10584-013-0905-2
Organisation for Economic Co-operation, and Development [OECD] (2019). OECD Crude Oil Import Prices (Indicator). Paris: Organisation for Economic Co-operation and Development (OECD).
Panos, E., and Densing, M. (2019). The future developments of the electricity prices in view of the implementation of the Paris AGREEMENTS: will the current trends prevail, or a reversal is ahead? Energy Econ. 84:104476. doi: 10.1016/j.eneco.2019.104476
Peck, M. A., Catalán, I. A., Damalas, D., Elliott, M., Ferreira, F. G., Hamon, K. G., et al. (2020). 968 “Climate Change and European Fisheries and Aquaculture: ‘CERES’ Project Synthesis 969 Report. Hamburg: CERES.
Popp, A., Calvin, K., Fujimori, S., Havlik, P., Humpenöder, F., Stehfest, E., et al. (2017). Land-use futures in the shared socio-economic pathways. Glob. Environ. Chang. 42, 331–345.
Pörtner, H. O., and Peck, M. A. (2010). Climate change impacts on fish and fisheries: towards a cause and effect understanding. J. Fish Biol. 77, 1745–1779. doi: 10.1111/j.1095-8649.2010.02783.x
Reid, G. K., Gurney-Smith, H. J., Marcogliese, D. J., Knowler, D., Benfey, T., Garber, A. F., et al. (2019). Climate change and aquaculture: considering biological response and resources. Aquac. Environ. Interact. 11, 569–602. doi: 10.3354/aei00332
Sato, M., Gregor Singer, G., Dussaux, D., and Lovo, S. (2019). International and sectoral variation in industrial energy prices 1995-2015. Energy Econ. 78, 235–258. doi: 10.1016/j.eneco.2018.11.008
Saurel, C., Ferreira, J. G., Cheney, D., Suhrbier, A., Dewey, B., Davis, J., et al. (2014). Ecosystem goods and services from manila clam culture in puget sound: a modelling analysis. Aquac. Environ. Interac. 5, 255–270. doi: 10.3354/aei00109
Seneviratne, S. I., Nicholls, N., Easterling, D., Goodess, C. M., Kanae, S., Kossin, J., et al. (2012). “Changes in climate extremes and their impacts on the natural physical environment,” in Managing the Risks of Extreme Events and Disasters to Advance Climate Change Adaptation of Working Groups I and II of the Intergovernmental Panel on Climate Change (IPCC), eds C. B. Field, V. Barros, T. F. Stocker, D. Qin, D. J. Dokken, K. L. Ebi, et al. (Cambridge: Cambridge University Press), 109–230.
Shepherd, C. J., Monroig, O., and Tocher, D. R. (2017). Future availability of raw materials for salmon feeds and supply chain implications: the case of Scottish farmed salmon. Aquaculture 467, 49–62. doi: 10.1016/j.aquaculture.2016.08.021
Sprague, M., Betancor, M. D., and Tocher, D. R. (2017). Microbial and genetically engineered oils as replacements for fish oil in aquaculture feeds. Biotechnol. Lett. 39, 1599–1609. doi: 10.1007/s10529-017-2402-6
Sumaila, U. R., Cheung, W. W., Lam, V. W., Pauly, D., and Herrick, S. (2011). Climate change impacts on the biophysics and economics of world fisheries. Nat. Clim. Chang. 1, 449–456. doi: 10.1038/nclimate1301
Tocher, D. R. (2015). Omega-3 long-chain polyunsaturated fatty acids and aquaculture in perspective. Aquaculture 449, 94–107. doi: 10.1016/j.aquaculture.2015.01.010
Tveteras, S., Asche, F., Bellemare, M. F., Smith, M. D., Guttormsen, A. G., Lem, A., et al. (2012). Fish is food - the FAO’s fish price index. PLoS One 7:e036731. doi: 10.1371/journal.pone.0036731
Ubilava, D. (2014). El Nino southern oscillation and the fishmeal - soya bean meal price ratio: regime-dependent dynamics revisited. Eur. Rev. Agric. Econ. 41, 583–604. doi: 10.1093/erae/jbt033
United States Department of Agriculture [USDA] (2019). USDA Economic Research Service Macroeconomic Data Set. Washington, DC: United States Department of Agriculture (USDA).
van Meijl, H., Tabeau, A., Stehfest, E., Doelman, J., and Lucas, P. (2020). How food secure are the green, rocky and middle roads: food security effects in different world development paths. Environ. Res. Commun. doi: 10.1088/2515-7620/ab7aba [Epub ahead of print].
van Vuuren, D. P., and Carter, T. R. (2014). Climate and socio-economic scenarios for climate change research and assessment: reconciling the new with the old. Clim. Chang. 122, 415–429. doi: 10.1007/s10584-013-0974-2
Walther, S. (2014). Determinants of Competitiveness of Agriholdings and Independent Farms in Ukrainian Arable Production. Thuenen Reports, 15. Braunschweig: Johann Heinrich von Thünen Institute.
Waltz, E. (2017). First genetically engineered salmon sold in Canada. Nature 548:148. doi: 10.1038/nature.2017.22116
Weatherdon, L. V., Magnan, A. K., Rogers, A. D., Sumaila, U. R., and Cheung, W. W. (2016). Observed and projected impacts of climate change on marine fisheries, aquaculture, coastal tourism and human health: an update. Front. Mar. Sci. 3:48. doi: 10.3389/fmars.2016.00048
Woltjer, G. B., and Kuiper, M. H. (2014). The Magnet Model: Module Description. Wageningen: LEI Wageningen UR.
Woodward, G., Perkins, D. M., and Bown, L. E. (2010). Climate change and freshwater ecosystems: impacts across multiple levels of organization. Philos. Trans. R. Soc. B. 365, 2093–2106.
World Economic Forum (2018). The Global Competitiveness Report. World Economic Forum Reports. Geneva: World Economic Forum.
World Bank Report (2013). Fish to 2030, Prospects for Fisheries and Aquaculture World Bank Report Number 83177-GLB. Washington, DC: World Bank.
Keywords: climate change, aquaculture, scenario, socio-political, economic, Atlantic salmon, carp, typical farm
Citation: Kreiss CM, Papathanasopoulou E, Hamon KG, Pinnegar JK, Rybicki S, Micallef G, Tabeau A, Cubillo AM and Peck MA (2020) Future Socio-Political Scenarios for Aquatic Resources in Europe: An Operationalized Framework for Aquaculture Projections. Front. Mar. Sci. 7:568159. doi: 10.3389/fmars.2020.568159
Received: 31 May 2020; Accepted: 03 September 2020;
Published: 29 September 2020.
Edited by:
Alistair James Hobday, Commonwealth Scientific and Industrial Research Organisation (CSIRO), AustraliaReviewed by:
Fabio Boschetti, Commonwealth Scientific and Industrial Research Organisation (CSIRO), AustraliaNazli Demirel, Istanbul University, Turkey
Copyright © 2020 Kreiss, Papathanasopoulou, Hamon, Pinnegar, Rybicki, Micallef, Tabeau, Cubillo and Peck. This is an open-access article distributed under the terms of the Creative Commons Attribution License (CC BY). The use, distribution or reproduction in other forums is permitted, provided the original author(s) and the copyright owner(s) are credited and that the original publication in this journal is cited, in accordance with accepted academic practice. No use, distribution or reproduction is permitted which does not comply with these terms.
*Correspondence: Cornelia M. Kreiss, Cornelia.kreiss@thuenen.de
†Present address: Eleni Papathanasopoulou, Department for Accounting, Economics and Finance, University of the West of England, Bristol, United Kingdom; Myron A. Peck, Department of Coastal Systems, Royal Netherlands Institute for Sea Research, Texel, Netherlands