Long-Term Population and Distribution Dynamics of an Endangered Irrawaddy Dolphin Population in Balikpapan Bay, Indonesia in Response to Coastal Development
 Danielle Kreb
 Stanislav Lhota
 Lindsay Porter
 Alexandra Redman
 Imelda Susanti1
  Milan Lazecky
- 1Yayasan Konservasi RASI/Laboratory of Hydro-Oceanography, Faculty of Fisheries, Mulawarman University, Samarinda, Indonesia
- 2Czech University of Life Sciences/Ústí nad Labem ZOO, Prague, Czechia
- 3SMRU Hong Kong, University of St Andrews, St Andrews, United Kingdom
- 4Port Townsend Marine Science Center, Port Townsend, WA, United States
- 5IT4Innovations/VSB-TUO, Ostrava, Czechia
Worldwide, cetaceans are impacted by human activities, and those populations that occur in shallow-nearshore habitats are particularly vulnerable. We present the results of the first long-term study on the responses of a coastal population of endangered Irrawaddy dolphins to widespread habitat changes. We particularly investigated their responses in terms of distribution and abundance. Boat-based, line-transect surveys were conducted during 12 discrete survey periods in 7 survey years spanning a 15-year period (totaling 78 days and 4,630 km of effort) in Balikpapan Bay, East Kalimantan, Indonesia. Irrawaddy dolphins were sighted on 136 occasions. Through DISTANCE analysis, a decrease in population density in the inner Bay area was observed from 0.45 dolphins/km2 in 2000–2001 (CV = 24%) to 0.34 and 0.32 dolphins/km2 in 2008 and 2015 (CV = 31% and 25%). A shift in distribution was noted between the periods 2000–2002 and 2008–2015 with significantly lower occurrence in the lower Bay segment compared to upper Bay segments. No sightings were made in the outer Bay area in later years, which coincided with increased shipping traffic in these areas. A peak in stranding events in 2016 and 2018 followed extremely high phenol levels within Bay waters in 2015 and a large-scale oil spill in 2018. The mean annual mortality rates of 0.67 Irrawaddy dolphins/year is unsustainable based on the lower potential biological removal (PBR) values for best abundance estimates of 2015 (Ndistance = 45 and Nmark–recapture = 73). Other threats to local dolphins include unsustainable fishing, underwater noise caused by construction, particularly piling activities. The research helped to identify Balikpapan Bay as an Important Marine Mammal Area by the IUCN MMPA Taskforce. Serious concerns remain for the concrete plans to move Indonesia’s capital city to the area north of the Bay, in terms of increased shipping traffic and harbor construction in the upper Bay segments that represent primary dolphin habitat. We recommend that protected areas be assigned for marine mammals and artisanal fisheries and shipping traffic and piling activities be excluded from these areas. We also recommend a legislated requirement of a mitigation protocol compulsory for piling and seismic activities within Indonesia.
Introduction
Worldwide, cetaceans are facing multiple and increasing threats and, in some areas, are threatened with local extinction (Reeves et al., 2003). In Asia particularly, the increased pressure on cetaceans that occur in restricted riverine or nearshore habitats led the International Whaling Commission to focus its attention on the conservation and management of these species (IWC, 2017). Rivers, estuaries and coastal marine ecosystems are becoming increasingly compromised by rapid human population growth and the concomitant pressure from pollution, resource extraction, infra-structure development and competition for prey species (Jefferson and Smith, 2002). Detailed assessments of the impact of habitat modification and degradation on cetaceans are often lacking, while rigorous population size estimation of small, coastal populations remain challenging (Dawson et al., 2008; Jefferson et al., 2009). Ship movements and pile driving constructions to build jetties or oil and gas platforms in coastal and ship harbor areas cause underwater pollution and may impact small cetaceans, which live in constrained environments such as relatively narrow coastal-shelf areas, bays and estuaries (David, 2006; Wilcock et al., 2014; Veirs and Wood, 2016). Different species of dolphins have been reported to avoid loud noise because they rely on sound to find prey, moderate social interactions, and facilitate mating (Miller et al., 2005; Bain and Williams, 2006; Tyack, 2008) while other populations may tolerate noisy environments if these areas overlap with prey hotspots critical for survival (Pine et al., 2017). Increased coastal development often leads to mangrove conversion and increased sediments loads, which in turn affects turbidity. Increased turbidity may result in biological effects on aquatic organisms such as disruptions in migrations and spawning, movement patterns, sublethal effects (e.g., disease susceptibility, growth, and development), reduced hatching success, and direct mortality (Kjelland et al., 2015). Increases in sediment load (both suspended and deposited) can also have negative effects at a system level (e.g., decreased species richness) (Chapman et al., 2014). As these areas are increasingly impacted, gaps in knowledge of population abundance and distribution must be addressed so that effective management and conservation plans can be implemented (Dawson et al., 2008; Dick and Hines, 2011). Van Bressem et al. (2014) reported on the emergence of a new disease in the form of cutaneous nodules in populations of Irrawaddy dolphins in Malaysia, India, and Bangladesh and recommended that diseases should be taken into account in action plans for this species. This will be the first study on the presence of cutaneous nodules for a coastal Irrawaddy population in Indonesia.
The Indonesian Archipelago has the fourth largest coastline of anycountry worldwide with a total length of c. 99.000 km. At least 34 cetacean and one sirenian species have been reported from Indonesianwaters; 27 of which are odontocete species (Rudolph et al., 1997; Kreb et al., 2015). The most vulnerable are those that reside in nearshore waters; the Irrawaddy (Orcaella brevirostris), the Indo-Pacific humpback (Sousa chinensis), the Indo-Pacific bottlenose (Tursiops aduncus), the Indo-Pacific finless porpoise (Neophocaena phocaenoides) and dugongs (Dugon dugong). There is little published information on these populations (Kreb, 2004; Kreb and Rahadi, 2004; Kreb and Budiono, 2005) and no current estimates of coastal population sizes or impacts from anthropogenic activities within Indonesia have been described although some findings on Irrawaddy dolphins are beginning to appear from West Kalimantan Province (on the island of Borneo), e.g., Kubu Raya, Kayong Utara, and Banten Bay (Yanuar, 2011; Yanuar et al., 2011; Khalifa et al., 2014). The Irrawaddy dolphin occurs in freshwater and shallow, coastal waters including lagoons of the tropical and subtropical Indo-Pacific and in the Mahakam, Ayeyarwady, and Mekong Rivers (Stacey and Arnold, 1999). The species occurs in both coastal areas and the Mahakam River of East Kalimantan and has been adopted as a symbol of the Province. This paper focuses on a long-term study of the distribution and abundance of a population of Irrawaddy dolphin that inhabit Balikpapan Bay, East Kalimantan, Indonesia. We commenced our research in 2000, with the broad aim of comparing the behavioral ecology of coastal Irrawaddy populations to those that inhabit riverine systems (Kreb, 2004; Kreb and Rahadi, 2004), to identify preferred habitat within Balikpapan Bay and to understand the populations response to habitat degradation. The broad findings from this study have been incorporated in other studies which have assessed the biodiversity and eco-tourism potential of the Bay and the impacts of construction (Hance, 2010; Clements et al., 2014; Hardansyah et al., 2016).
Our specific objectives of this study were to: (1) Conduct vessel-based surveys and use both photo-identification techniques and line transect sampling methodology to estimate population parameters, (2) Assess site-fidelity of the Irrawaddy dolphin population in Balikpapan Bay, (3) Analyze trends in dolphin distribution, density and abundance, (4) Evaluate environmental quality and assess threats to dolphins, (5) Provide conservation recommendations to management authorities and policy makers, and (6) Provide information which will assist in public awareness programs and will be suitable for local school curriculums.
Methodology
Study Area
Balikpapan Bay is located at 1°17′41.70′′S, 116°47′26.00′′E (Figure 1). The inner Bay area is approximately 138 km2, with a total watershed of 2,114 km2, including 56 rivers and creeks. The width of the Bay ranges from 0.5 to 7.0 km, and the passage way to open water is 5.6 km wide. The Bay’s coastal habitat comprises 16,900 ha mangrove forest and is an important nursery ground for fishes. The Bay is tidal and is influenced seasonally by wet and dry seasons. Fish availability is at its highest between September until April, and lowest from May to August (during the dry season June – August). There are four cities on the shores of the Bay area; Balikpapan City (c. 700,000) which also has an oil refinery; Penajam (c. 70,000 inhabitants); Jenebora (c. 3000 inhabitants) and Pantai Lango (c.1500 inhabitants). Commercial vessels, including oceanic tankers, coal barges tugboats, ferries and speedboats are restricted to a shipping lane (B South, Figure 1). Industrial development along the Bay shores has been increasing since 2007 especially in the middle part of the Bay (B North, Figure 1). Only artisanal and small-scale fishing-practices are undertaken by individual fishing households inside the Bay, utilizing trammel nets, gillnets, trawls (<24 m width of net), lift nets, fish traps, cast nets and long-line fishing.
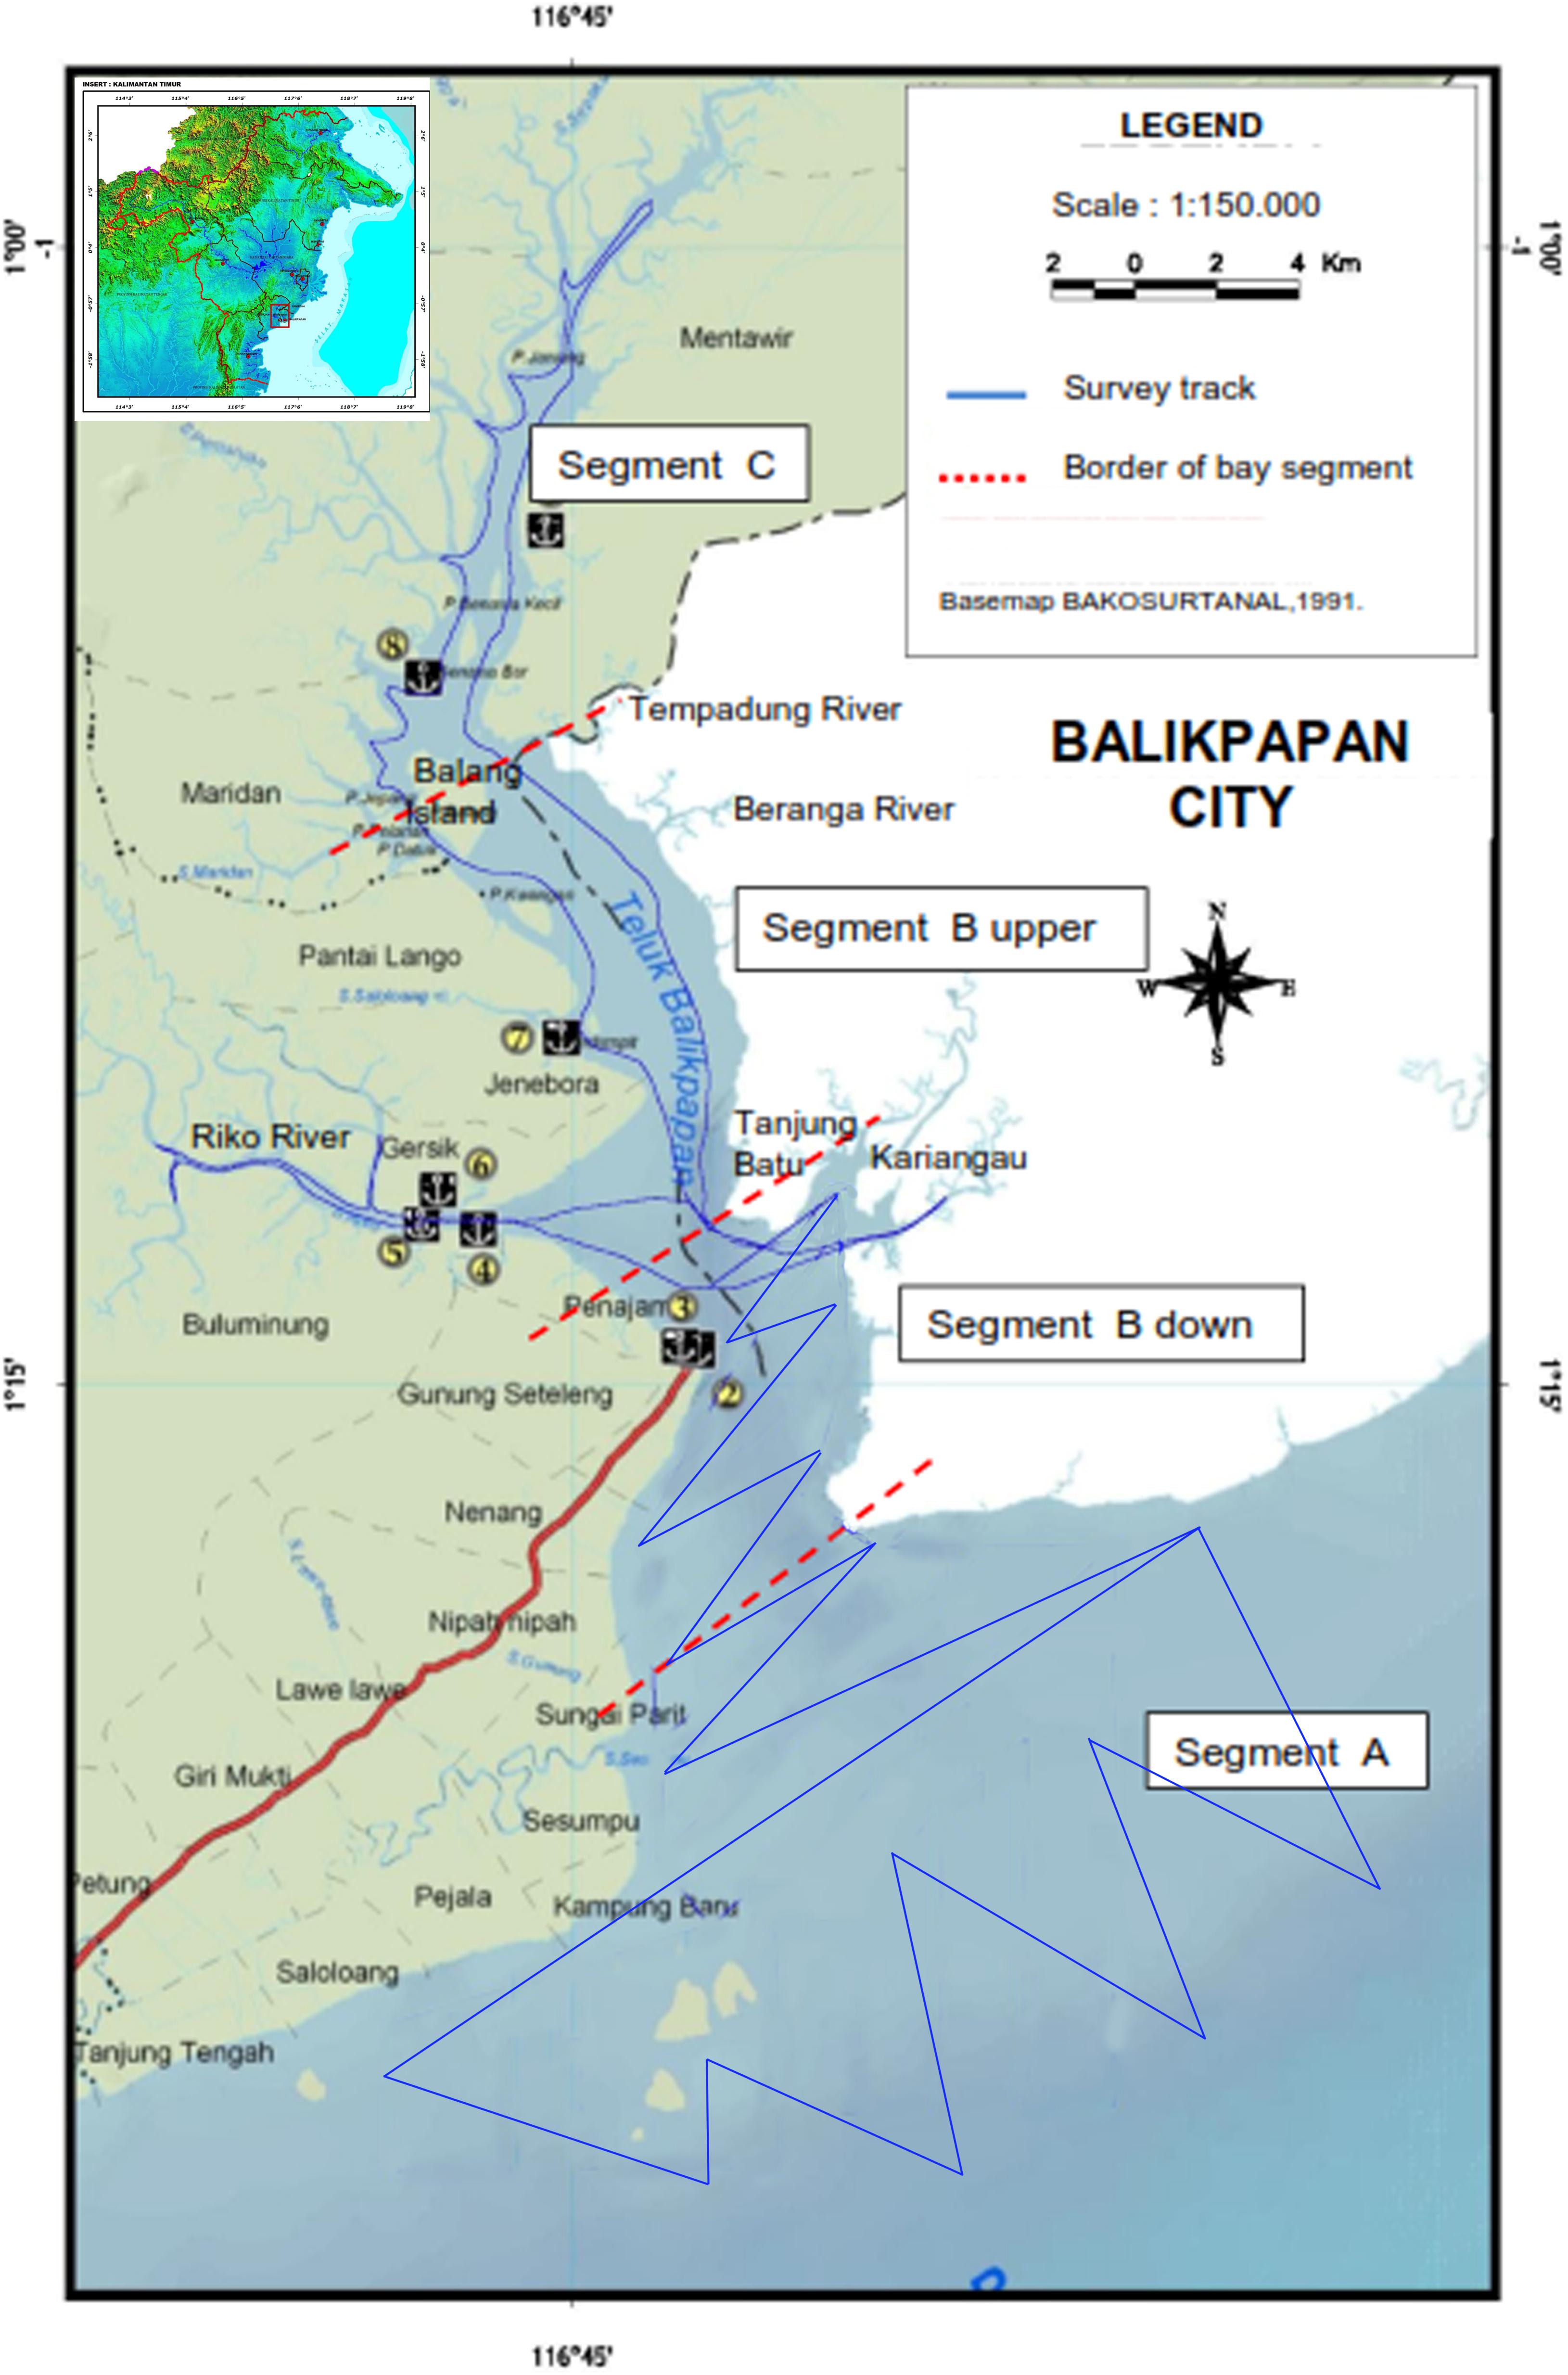
Figure 1. Survey track lines followed during 2000–2001, 2008, and 2015 surveys.
Field Methods
Boat Surveys
We conducted a total of 4,000 km on-effort boat-based surveys between 2000 and 2015 across 78 days in 12 discrete survey periods (Table 1) in order to collect data on abundance, individual occurrence and distribution of marine mammals. Each survey lasted between 5 and 12 days. In addition, in 2018, we conducted a 3-day survey of 181 km track length following a major oil spill. This occurred on 1 April 2018 within Balikpapan Bay and the purpose of this dedicated survey was to assess the extent of the oil spill damage and to collect water and sediment samples.
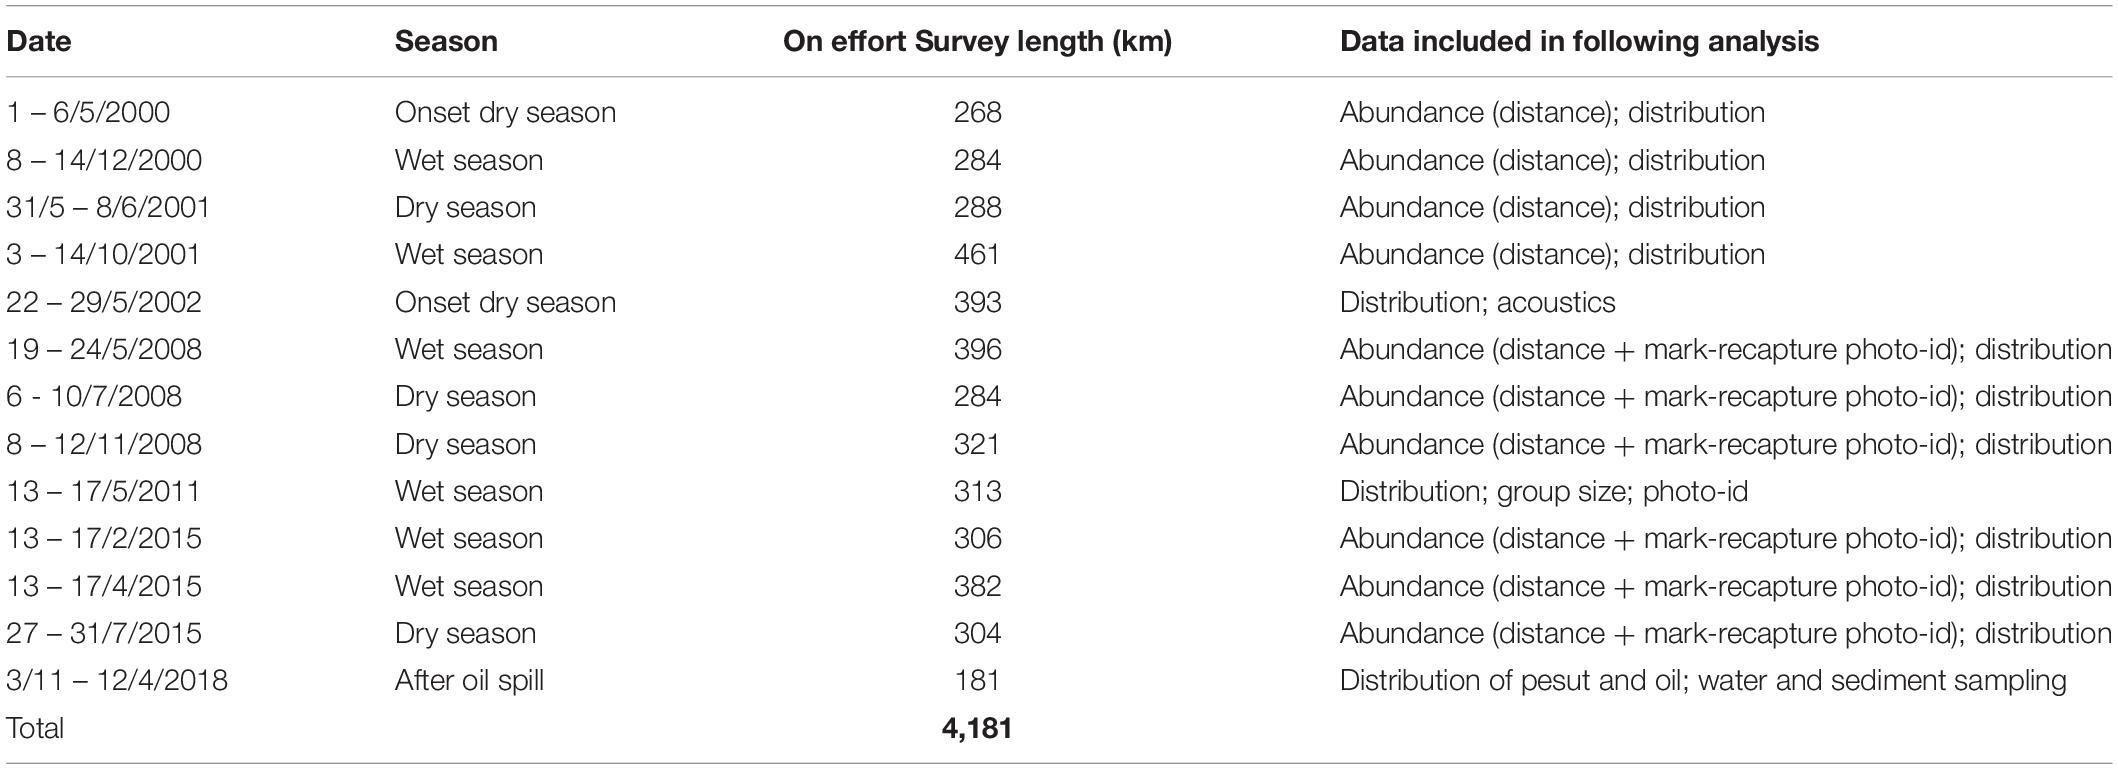
Table 1. Survey periods, boat-based survey effort and data usage.
We divided the Bay into four segments with approximately 30 km transects in each segment (except for segment A, which measured 60 km); A (outer Bay), B South (lower Bay area including Wain River mouth), B North (upper Bay area including Riko River) and C (uppermost part of Bay) (Figure 1). To augment effort in the upper Bay area (B North and C) where during the first survey more dolphins concentrated, we reduced transect length in the lower segment (B South) to 30 km. This was achieved by having transect lines following a zig-zag pattern, which also aided in avoiding too much sideward tidal wave action. The distance between turning points was 2.4 km. We also used a zig-zag transect approach to sample in the outer segment of the Bay (A) to be able to cover a wider area while also maintaining reasonably even coverage of the preferred habitat of Irrawaddy dolphin (brackish, muddy). Distance between turning points was further, i.e., 4 km than in the inner Bay’s southern section. We adjusted the lines to avoid shallow or impassable areas. In segment B north and C (where Bay width varied between 1.5 and 3 km), we placed two transect lines parallel to each shore, at 500 m from the shore with 1–2 km distance between each transect line. Here a zig-zag transect was not used as it would cross shallow areas and coral reefs and/or allowed for searches in tributaries (mouths) (Figure 1). Two segments were surveyed in one day, except for segment A that took an entire day of survey. Each transect was at least repeated once on another day during each survey period while the survey route was reversed on the next occasion, in order to minimize bias and make sure that different tidal states applied. We only conducted surveys in Beaufort 4 or better and the survey vessel maintained an average speed of 11.8 km/h.
Two different survey vessels were used but were of similar configuration with observers positioned 2.5–3 m (eye height) above the water. The survey team comprised four people, rotating three observers and one data recorder. Two of the observers continuously scanned the sea surface 180o degrees in front of the vessel using binoculars (7 × 50 Binolyt and Fujinon) with built in compass and the third observer searched with the unaided eye. All effort and environmental data were recorded every 30 min. Environmental data included sea state (Beaufort, based on sea descriptive terms), tide (referenced from the tide tables available from the Balikpapan Harbour Office) and visibility (fog, rain, sun glare, scaled into three categories, i.e., where score 1 indicated a slight reduction in visibility, score 2 quite reduced and score 3, very much reduced. All observers agreed on visibility status). Survey tracks were recorded using a Global Positioning System (GPS). When a marine mammal was sighted, we immediately recorded the estimated radial distance to the sighting by naked-eye, the boat heading and the bearing of the sighted individuals to the boat using binoculars with built-in compass. All observers practiced distance estimation regularly by estimating distances by eye to objects at a known distance, e.g., buoys, fishing traps, boats, measured by using a laser range finder (Nikon 1100 m accuracy) or verification of objects’ at larger distances by means of a GPS. To standardize error where possible, the first author, as the most experienced person, and present on every survey, agreed the final distance measurement. All angle measurements were noted using the binoculars built-in compass. After these data were collected, the vessel left the track line to mark the dolphins exact location on the GPS, verify species identification, estimate best, minimum and maximum group size and record group composition. We defined four age classes: (i) “neonates” were individuals of less than half the average length of an adult, spent all their time in close proximity to an adult and exhibited a lack of coordination with regards to surfacing; (ii) “calves” were animals between a half and three-quarters the average length of an adult and they also spent most of their time in close proximity to an adult; (iii) “juveniles” were animals of three-quarters the average length of an adult and swam more independently than calves; (iv) individuals were deemed to be “adults” when they were larger than an estimated 2 m in length (Kreb, 2005). For group size estimation, we considered all dolphins that were located within a 100 m radius, moving in the same direction and (usually) engaged in the same activity to be part of the same group (Shane, 1990; Wilson et al., 1993).
During each sighting, we also attempted to photograph both the left and right dorsal fin of all individuals from a perpendicular angle using two DSLR cameras with zoom lenses up to 500 mm and 18–200 mm. In addition, video footage was taken that also assisted in individual identification as well as group size estimation. We also recorded depth (using a hand-held echo-sounder), turbidity (using a Secchi disk), temperature (using a liquid thermometer submerging at approximately 60 cm depth for 1 min) and salinity (using a portable salinity meter) at the sighting location.
Water and sediment samples were obtained on the fourth, eleventh, and twelfth days after the major oil-spill that occurred on 1 April 2018, and these were analyzed for oil presence. Water quality data for the years 2012–2015 were obtained from the Center for Controlling Ecoregional Development of Kalimantan (PPEK, 2015) and from water quality sampling published in Hardansyah et al. (2016).
Land-Based Observation Study
Land-based dolphin monitoring was conducted by the first author and two observation assistants for 29 days during pile driving activities for the construction of a jetty for PT Dermaga Kencana Indonesia (DKI) at the Muara Tempadung/Pulau Balang area, between 25 May and 30 July 2010. This was the first time that mitigation monitoring based on Joint Nature Conservation Committee (JNCC) protocols were implemented during piling activities in Balikpapan Bay. Prior to piling commencement, five buoys were placed at 500 m radius from the piling barge, separated by 45° angle, to demarcate the mitigation zone. Two Marine Mammal Observers (MMO) observed the area surrounding the piling works from a vantage point of 7–8 m (eye-height) above sea level. Distances from the piling barge to fixed land points or stationary objects in the water such as fishing gear, were measured using a laser-range finder and marked on a reference map so that zones from 100 to 1500 m were easily distinguished by the MMO. Distances were estimated to the nearest 100 m where 100 m would include the distance 0–100 m, 200 m would include <100–200 m etc. Each MMO scanned different sectors of the area adjacent to the pile driving so that all sea areas were consistently observed. The mitigation zone was monitored at least one hour prior to piling commencement and piling could only start if there were no dolphins in the area for 20 min. Every 30 min, MMO recorded piling activity (on or off), visibility, sea and tidal states When dolphins were observed, time, distance to piling, dominant behavior (swim speed, playing, milling, probable feeding or combination), group size estimate, direction of travel (upstream or downstream) as well as piling status, visibility, sea and tidal states. Each time a change in group size, behavior or distance from piling source (100 m radius increments) occurred, this would be noted in the datasheet.
Community Interviews
During all survey years we conducted randomized and informal interviews with local fishermen as we encountered themin the Bay during off effort survey periods. Our aim was to obtain information on fisheries type, catches, presence of live and/or stranded marine mammals, habitat changes etcetera. In addition, we conducted semi-structured, in-depth interviews and purposed sampling in 2011 and 2015 with fishermen (n = 22) who had been active for at least 15 years (Supplementary Table S1). Prior to interviews village heads and the selected respondents gave their verbal consent to conduct interviews in each village. During each interview, the interviewer was accompanied by a local fishermen from one of the villages to translate the local dialect. Respondents could provide more than one answer for each question and questions could be expanded based on the respondent’s interest and knowledge so that additional, pertinent information could be documented.
Analysis
Relative Abundance and Distance Analyis
For the analysis of population density and abundance estimates of the population we included a total of 10 surveys (4 surveys for the years 2000–2001, 3 surveys in 2008 and 3 survey periods in 2015, Table 1). Total track length including all Bay segments for these 10 survey periods totaled 3,294 km. However, we only included 2,861 km of total transect lines in the distance analysis based on the discarding of outer Bay transects for years 2008 and 2015 because no Irrawaddy dolphin sightings were made here. These transects were included though for the calculation of sighting and individual encounter rates of other cetacean species. Because the number of other marine mammal species did not exceed 3 sightings per survey year, we did not perform distance analyses for these species. We did not include distribution data from 2002 and 2011, as surveys did not cover the whole area but we still plotted sighting data on the distribution map (Figure 2). To investigate temporal changes in distribution within the four Bay segments, A, B South, B North and C (Figure 1), we calculated sighting rates (per 100 km) and encounter rates (individuals per km transect) per Bay segment and per survey period.
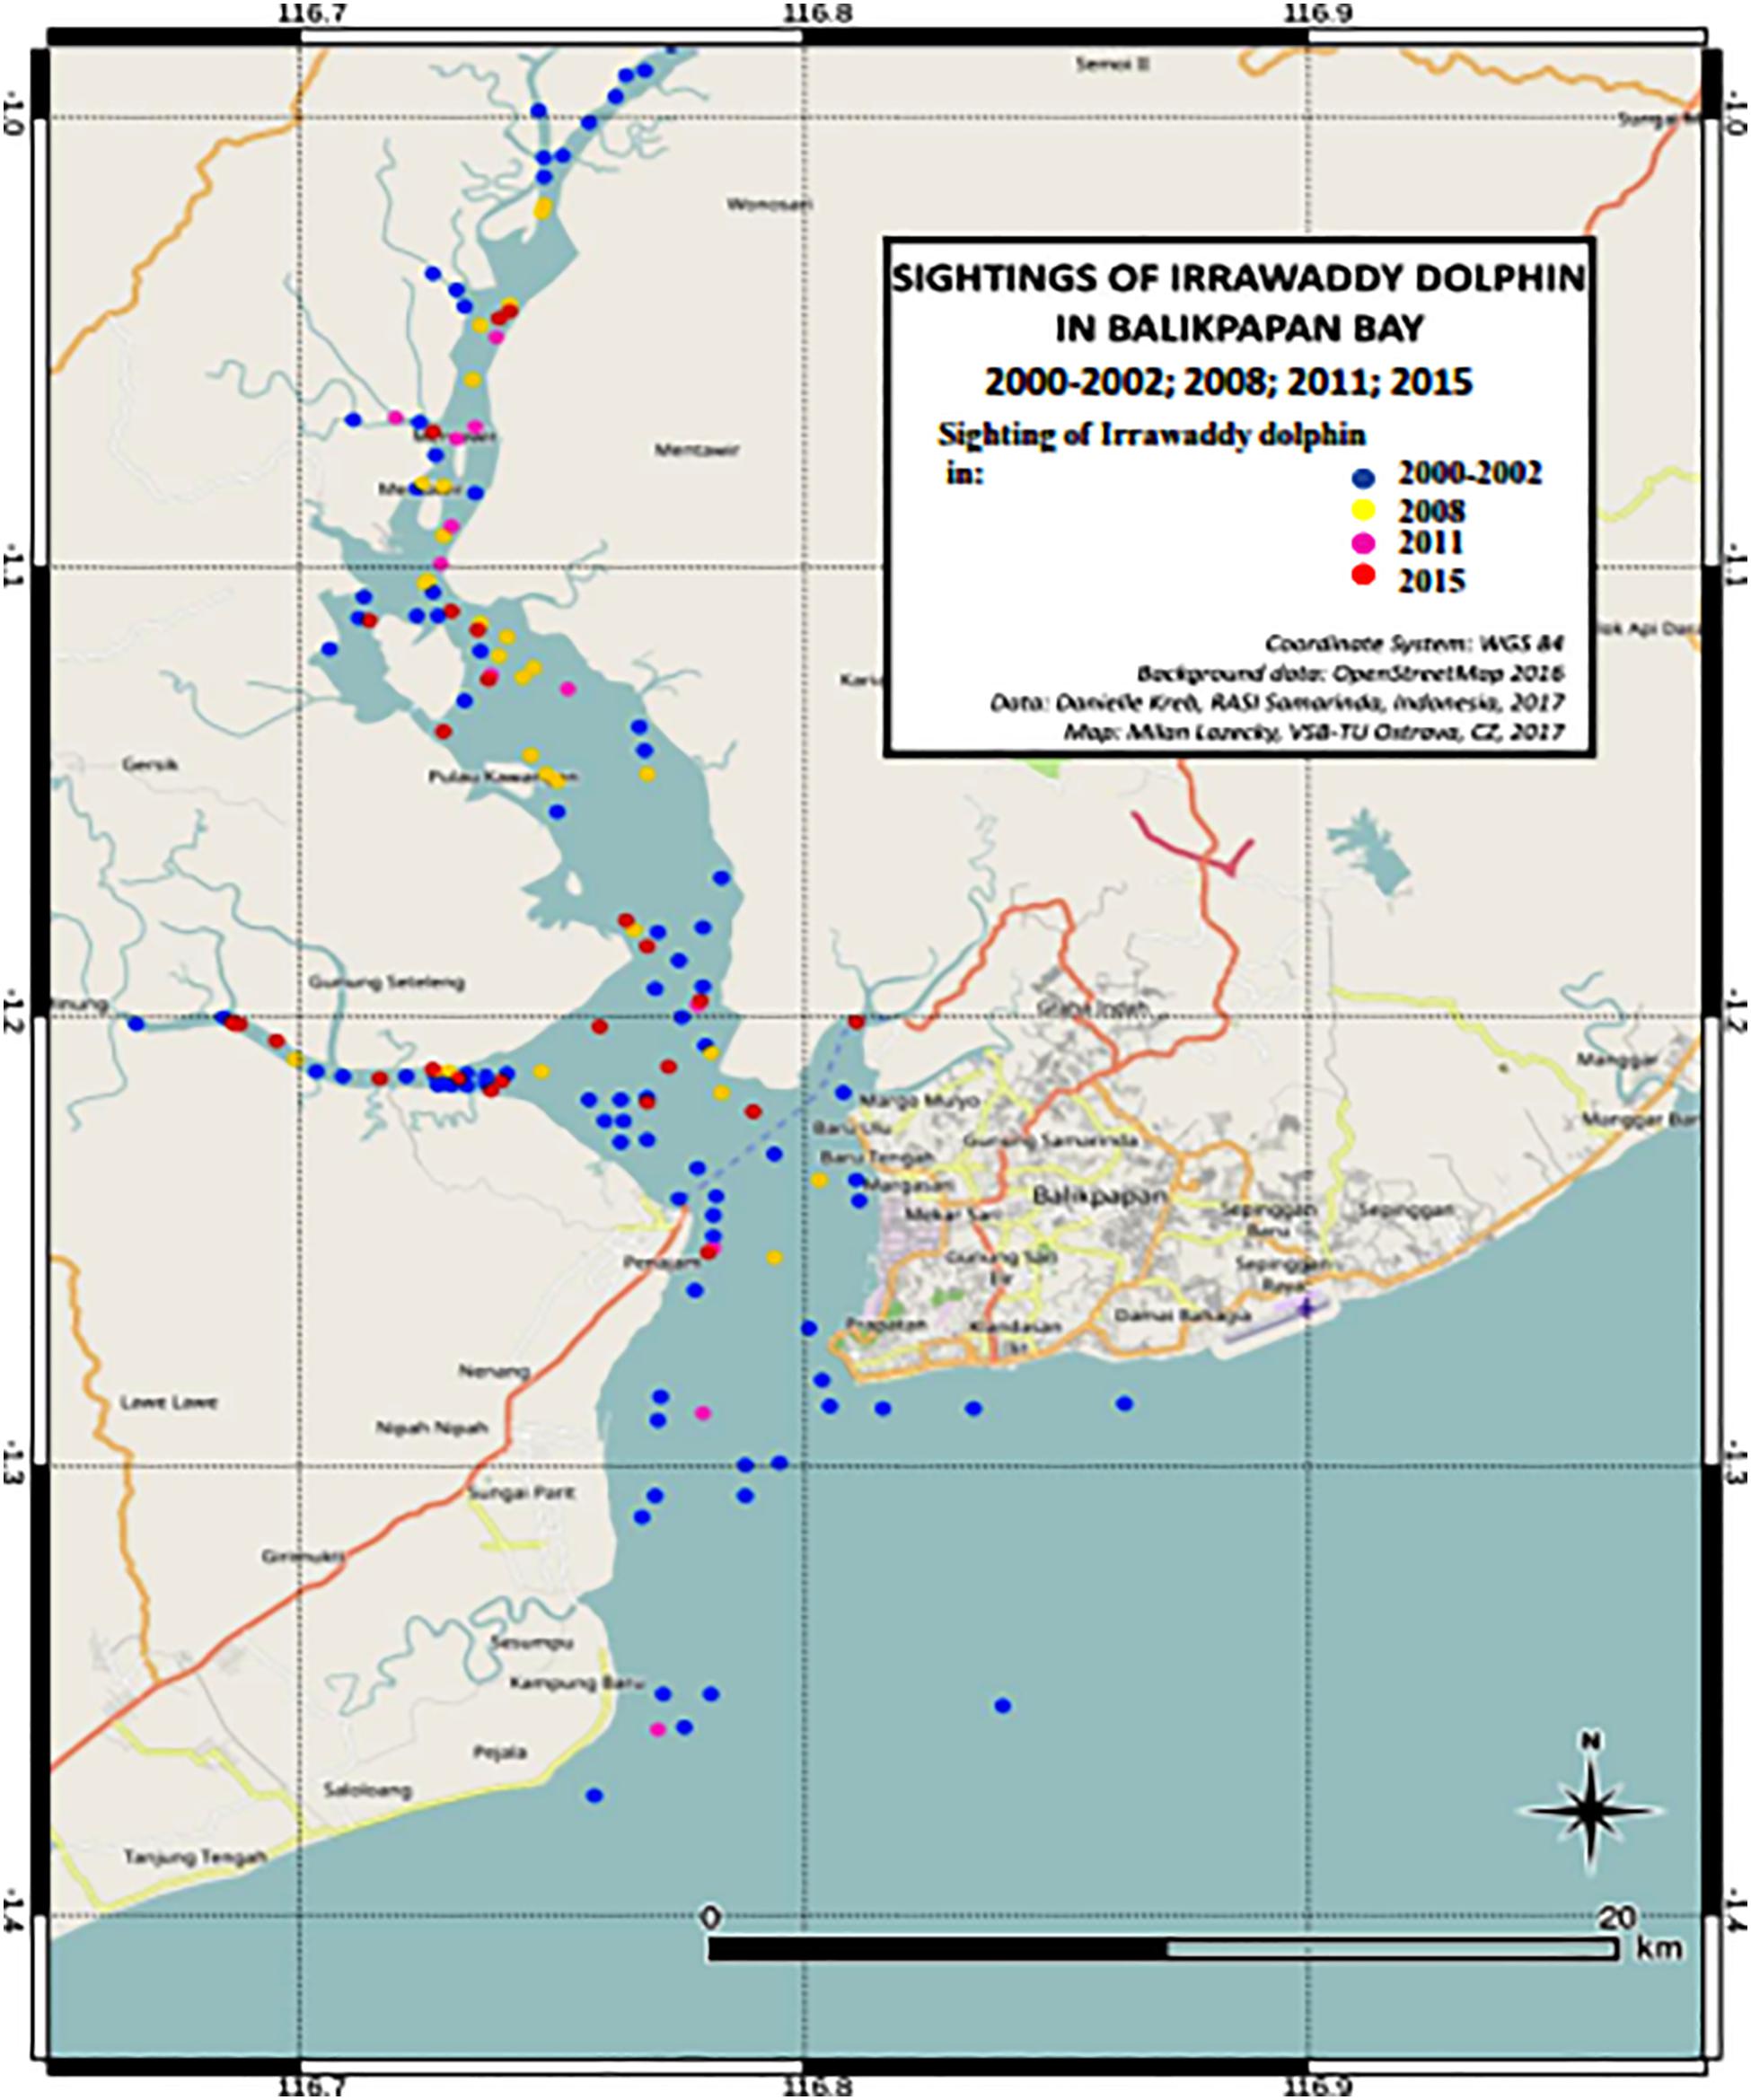
Figure 2. Map of Irrawaddy dolphin sightings in the years 2000, 2001, 2002, 2008, 2011, 2015.
Survey data were entered in several text files that were tab delimited to be become projects for further analysis in the software program DISTANCE 7.0 (Thomas et al., 2010). We divided columns into the stratum Region (Bay area, area size, year), Line transects (km on effort survey), Observations (perpendicular sighting distance, cluster size, beaufort and visibility). In order to maximize our sample size for comparisons of the inner Bay area among different survey year periods, i.e., 2000–2001; 2008 and 2015, we combined the data for 2000 and 2001 into a one-year period (2000–2001). Only in the 2000–2001 period observations of Irrawaddy dolphins were made also in the outer Bay area in spite of survey effort here in other years. Therefore, for this period, we performed a separate analysis to compare densities and abundance among outer and inner Bay. Total area size for the outer Bay area was 60 and 138 km2 for the inner Bay area.
Conventional distance sampling (CDS) analyses were performed as suggested by Thomas et al. (2010). In order to fit the detection function, which describes the relationship between distance and the probability of detection, three different approaches were considered such as stratifying by year and/or Bay area and data pooling as follows: (1) detection function based on pooling of all years including pooling of Bay areas for 2000–2001 (inner and outer Bay), (2) pooling of all years and excluding outer Bay for better density comparisons of the inner Bay, (3) pooling of year periods 2008 and 2015 with a separate detection function for 2000–2001 and stratification by inner and outer Bay, and (4) un-pooled and generating detection function for each period. In order to model the detection function, various combinations of key functions and adjustment terms were considered including uniform + cosine, half-normal + cosine, half-normal + hermite polynomial, hazard rate + simple polynomial). Model fit was assessed based on the lowest Aikake Information Criterion (AIC). We considered various goodness-of-fit measures to test the robustness of the model to fit a wide variety of plausible shapes for the detection function: chi-squared test (plausible if there is a high P that X2 is greater), q-q plots (perfect if all red dots lie on the blue line), Kolmogorov–Smirnov (using the biggest difference between the red and blue dots) and Cramer-von Mises tests (taking uniform and cosine weighted averages). For these last tests, a high likelihood (close to 1) means the detection function model fits well. As part of the model selection, a suitable truncation distance for the distance data was selected through goodness of fits tests as well as defining intervals and cut-off points to reduce the impact of radial distance rounding (Thomas et al., 2010). Group size biases were incorporated by using a size-bias regression model if a significant alpha level of 0.15 was returned. If there was no significant size bias detected regression then the group mean size was used. For the density estimates calculation, group sizes were treated per year period or pooled over years. We performed additional multiple covariates distance sampling (MCDS) with beaufort sea states, visibility and tidal state as covariates to assess how they influenced the detection function. Beaufort and visibility were treated as non-factorial while tidal state was treated as factor. For these analyses all observation data were grouped from all years and strata because the purpose was to see how the shape or scale of the detection curve changed. If the analyses proved to improve model fit, the covariates would be applied to the final models.
Mark-Recapture Analysis of Photo-Identified Individuals
We estimated population size using mark-recapture analysis of photo-identified dorsal fins. We sorted images by focus, clarity, lighting, dorsal fin angle and proportion of fin captured in the frame and used only the clearest images that had captured the dorsal fin at a perpendicular angle. We then assigned each selected image into folders that represented individuals. Identification of individuals was determined using a combination of notches, injuries, and unique fin shapes, which were considered to be long-lasting marks so that the suite of identifiers for individual was unique and unlikely to be lost or obscured between sampling occasions (Wilson et al., 1999). Then we assigned each unique individual an ID code plus a sighting code of which the unique ID code either matched an individual within the existing catalog or a new ID code was assigned. Scars and discolorations were only used as unique markers in combination with features deemed to be more long lasting. The catalog was further developed by matching left and right side fins to a particular individual within a sighting, if possible. The individual ID database therefore consisted of individual ID folders, in which each sighting of the identified individual was placed in sighting-coded sub-folders. In order to facilitate rapid matching, an excel field map table was used where the best left and right images of each identified individual was inserted and in a sequence that displayed similarly shaped fins next to each other. After a tentative match was made, comparison continued with all other identified individuals. Each individual sighting history (date, time, location, group composition) was stored in an excel spreadsheet. All identifications were verified independently by at least two persons, and a final confirmation was made by the first author, who worked on every survey. This system and final verification by the scientist most familiar with the population assured us that individuals were correctly recognized and reported in each sampling occasion. The catalog comprised images from seven surveys conducted in 2008, 2011, and 2015 and consisted of 85 individuals. For 76 individuals, both left and right dorsal fin sides were paired, eight individuals only had left-side pictures and two individuals only had right-side images. Thus, a total of 78 right-side identified dorsal fins (91% of total identified individuals), however, as the eight left-side fins were clearly distinct from the right-side images, these were also included in the mark-recapture analyses.
Good-quality fins that were photographed per sighting but didn’t have sufficiently distinctive features, were still kept in the catalog under a special sighting-related code number. When estimating population size, estimates need to account for the proportion of unmarked individuals within the population (Jolly, 1965; Seber, 1965). Therefore, the number of identifiable fins per sighting were summed for all sightings and divided by the total sum of both identified and unidentified fins per sighting for all sightings (Minton et al., 2013). The resulting mean proportion, p, was used as a correction factor for mark-recapture estimates (N) that only used sighting histories of distinctive individuals. The corrected estimate used a simple formula:
The selected sighting histories were consolidated for years 2008, 2011, and 2015. Selected sighting histories were also consolidated for each of three seasons within year 2018 and similarly for year 2015. 2011 was excluded as only one survey was conducted. Sighting histories for 2008 and 2015 were separately analyzed inprogram MARK7.0 (Cooch and White, 2008) to estimate population size for each year. The limited number of surveys (three sessions in total) for each year, resulted in wide confidence limits using open population models. Therefore, we selected a closed population model based on Otis et al. (1978) with full likelihood parameterization with three types of parameters; pi is the probability of first capture (i.e., the probability that an animal in the population will be captured and marked for the very first time), ci is the probability of recapture (conditional on having been captured at least once before), and N is abundance. Although the assumptions made for closed models, such as, there should be no deaths or births, immigration or emigration, was likely violated, we considered the bias to be low within one year and was offset by the better fit of a closed population model. Calves that may have been born after the first sampling occasion were unlikely to have sufficient marks to be included in the photo-identification catalog and had an unequal capture probability. Mortality was also low, i.e., 0.7 dolphins per year (see Threats, 3.5). If significant births and deaths do occur, there is a risk of over-estimating the population size, however, the better precision of the closed population model and by understanding these potential biases still enables practical conservation recommendations to be formulated. Three models were run, with equal capture and recapture probabilities (p = c) to exclude behavioral variation. The three models selected were: (1) closed population with time varying capture probabilities, (2) closed population with heterogeneity with constant capture probabilities but allowing for individual heterogeneity, and (3) closed population with full heterogeneity and time varying capture probabilities. The final model for each year was selected based on the smallest Akaike’s Information Criterion (AIC) value.
Threats Identification and Habitat Condition
We conducted a qualitative compilation of identified threats and habitat condition and impacts on dolphins using interview data, stranding data, direct observation, existing reports from other studies of changes in human habitat use and maps of current and future land-use and development to identify the following threats:
(1) Unsustainable mortality. Stranding data have been recorded since 2008 after a local reporting network was established, that includes all marine mammal species. We sorted data over the years to identify whether there was any trend in the number of stranding events in response to two major pollution events, i.e., high phenol values for year 2015 and a major oil spill in April 2018.
In order to understand the sustainability of the population of Irrawaddy dolphin in Balikpapan Bay, we calculated the potential biological removal (PBR) (Wade, 1998) using the following equation for the population estimates obtained from density and mark-recapture analyses:
The equation is based on max half of the theoretical maximum growth rate at low population density (the default for cetaceans is 0.04; Wade, 1998), Nmin, the minimum population estimate using the lower bound of the 95% confidence interval following Taylor (1993), and a recovery factor FR of 0.1, which was recommended by Wade (1998) and Taylor et al. (2000) for endangered species. We also performed additional calculations for a recovery rate of 0.5, which was considered by Wade (1998) to be the least biased. Besides minimum populations sizes we also calculated less conservation PBR values using best population estimates following Hines et al. (2015). Mean annual anthropogenic mortality that is higher than the PBR values indicate that the mortality is unsustainable.
(2) Underwater noise. As an indicator of underwater noise, large-sized shipping traffic (i.e., tankers, coal barges both stationary or moving) was documented during boat surveys and a mean was calculated for the two day survey period for the lower Bay segment for years 2001, 2008, and 2015.
In addition, in order to assess the impacts of unmonitored pile driving activities on the movements of Irrawaddy dolphins, we analyzed the results of the land-based observation study during the piling driven construction work in Muara Tempadung/Pulau Balang. To better understand how dolphins occupied the habitat adjacent to the piling area, we calculated the following parameters for active and non-active piling periods: (1) the mean estimated distance to barge, (2) total dolphin time (min) within 0–1.7 km distance of barge during active and non-active piling, (3) total dolphin time (min) and % time spent within 0–500 m distance range, (4) total dolphin time (min) and % time spent within 500 m-1 km distance range and (5) the total dolphin time (min) and % time spent 1.1 km-1.7 km distance range. In addition, we sorted the time and percentage of time that dolphins engaged in different behaviors during and between piling activities. Behaviors were only recorded within 1000 m of the barge. A chi-square test with 2 × 4 contingency table was used to determine if there were significant differences in the proportion of time that dolphins were engaged in certain behaviors during active and non-active piling periods.
(3) Coastal development impacts. Calculation of mangrove loss was based on data from Prayoga et al. (2019), where we subtracted data on the total mangrove area in Balikpapan Bay based on satellite images for 1995 with mangrove data for 2018. In addition, we compared satellite images from years 2001 and 2015 to detect in which Bay segments significant shoreline mangrove conversion had occurred.
(4) Pollution. Available reports on water quality with data from 35 chemical, physical and microbiological parameters for the years 2012 – 2016 were used as an indication for habitat condition. In addition, we collected sediment and water samples on 11and 12 April after a major oil spill on 1 April 2018 inside the Bay, which was then analyzed for the presence of oil. We collected samples at nine locations where dolphins were encountered on that survey, as well as at chosen locations where on previous surveys dolphins were often occurred. At each of those locations, water samples were taken from the surface and middle depths and bottom sediment was also sampled.
In order to investigate the prevalence of cutaneous nodules inside the population of Irrawaddy dolphins in Balikpapan Bay, all pictures for years 2008, 2011, and 2015 that showed enough detail and had the correct lighting were assessed for nodules. If nodules were present, we recorded the corresponding identity of the animal, year as well as the frequency of nodules observed (sparse ≤ 10 or numerous ≥10) and their relative size [following the same method as applied in Van Bressem et al. (2014) who estimated the greatest diameter photogrammetrically on the comparative basis of a mean dorsal fin height of 62 mm in Orcaella brevirostris (Beasley et al., 2005)]. Nodule size was classified as small (<7 mm), medium-sized (7–15 mm), or large (>15 mm).
(5) Unsustainable fisheries. For the analysis of the interviews with local senior fishermen (see Section “Community Interviews”), answers of questionnaires were entered in an excel database while similar answers per question were grouped into answer categories. Since more than one answer could be provided per question, we used the total number of answers per question when calculating percentages for the number of answers in each answer category.
Results
Distribution Patterns of Irrawaddy Dolphins
We recorded a total of 136 sightings of Irrawaddy dolphins during all 12 surveys between 2000 and 2015 (Figure 2). Mean group sizes of all sightings was 4.5 individuals (min = 1; max = 14; median = 4; SD = 3.16). Relative abundance expressed as the number of sightings/100 km transect (R) in different segments for survey years 2000 and 2001 was significantly higher in the inner Bay area compared to the area outside the Bay (Table 2) (Two-tailed t-test = 2.60, p = 0.04, df = 6). Moreover, in the later survey years from 2008 onward, no sightings were made outside the Bay at all in spite of similar survey coverage in this area as the years 2000 and 2001 (Figures 2–4). Additionally, R in the southern part of the inner Bay (B South) was also significantly lower in 2008 and 2015 compared to the upper Bay area B North (Two-tailed t-test = -20.33, p = 0.002, df = 2), whereas in years 2000 and 2001 no significant differences were found among both segments. The segment with the largest number of sightings and individuals per km transect compared to other transects was C, with significantly higher rates compared to segment B North for all years when excluding year 2015 (Two-tailed t-test = 4.34, p = 0.01, df = 4). In 2015 R and N/L were higher in segment B North. Finally, N/L for the combined inner Bay segments did not differ significantly among years, but the mean R for these combined inner segments for years 2000–2008 was significantly higher compared to the mean R for 2015 (Two-tailed t-test = 2.36, p = 0.046, df = 10).
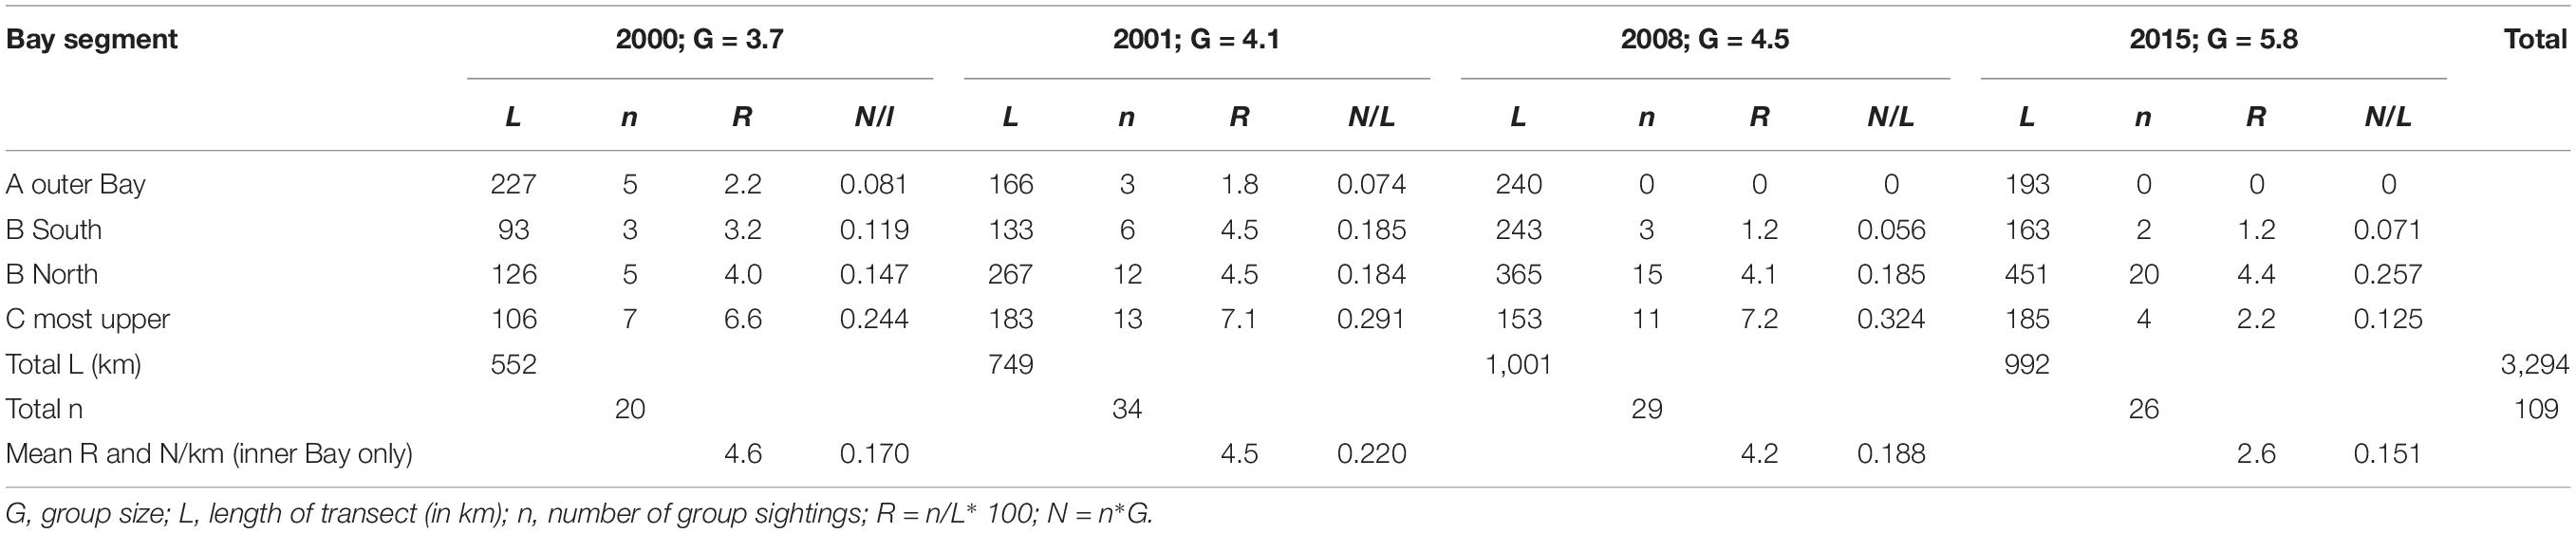
Table 2. Mean annual sighting and individual encounter rates of Irrawaddy dolphins per km segment in Balikpapan Bay in the years 2000, 2001, 2008, and 2015 as illustrated in Figures 3, 4.
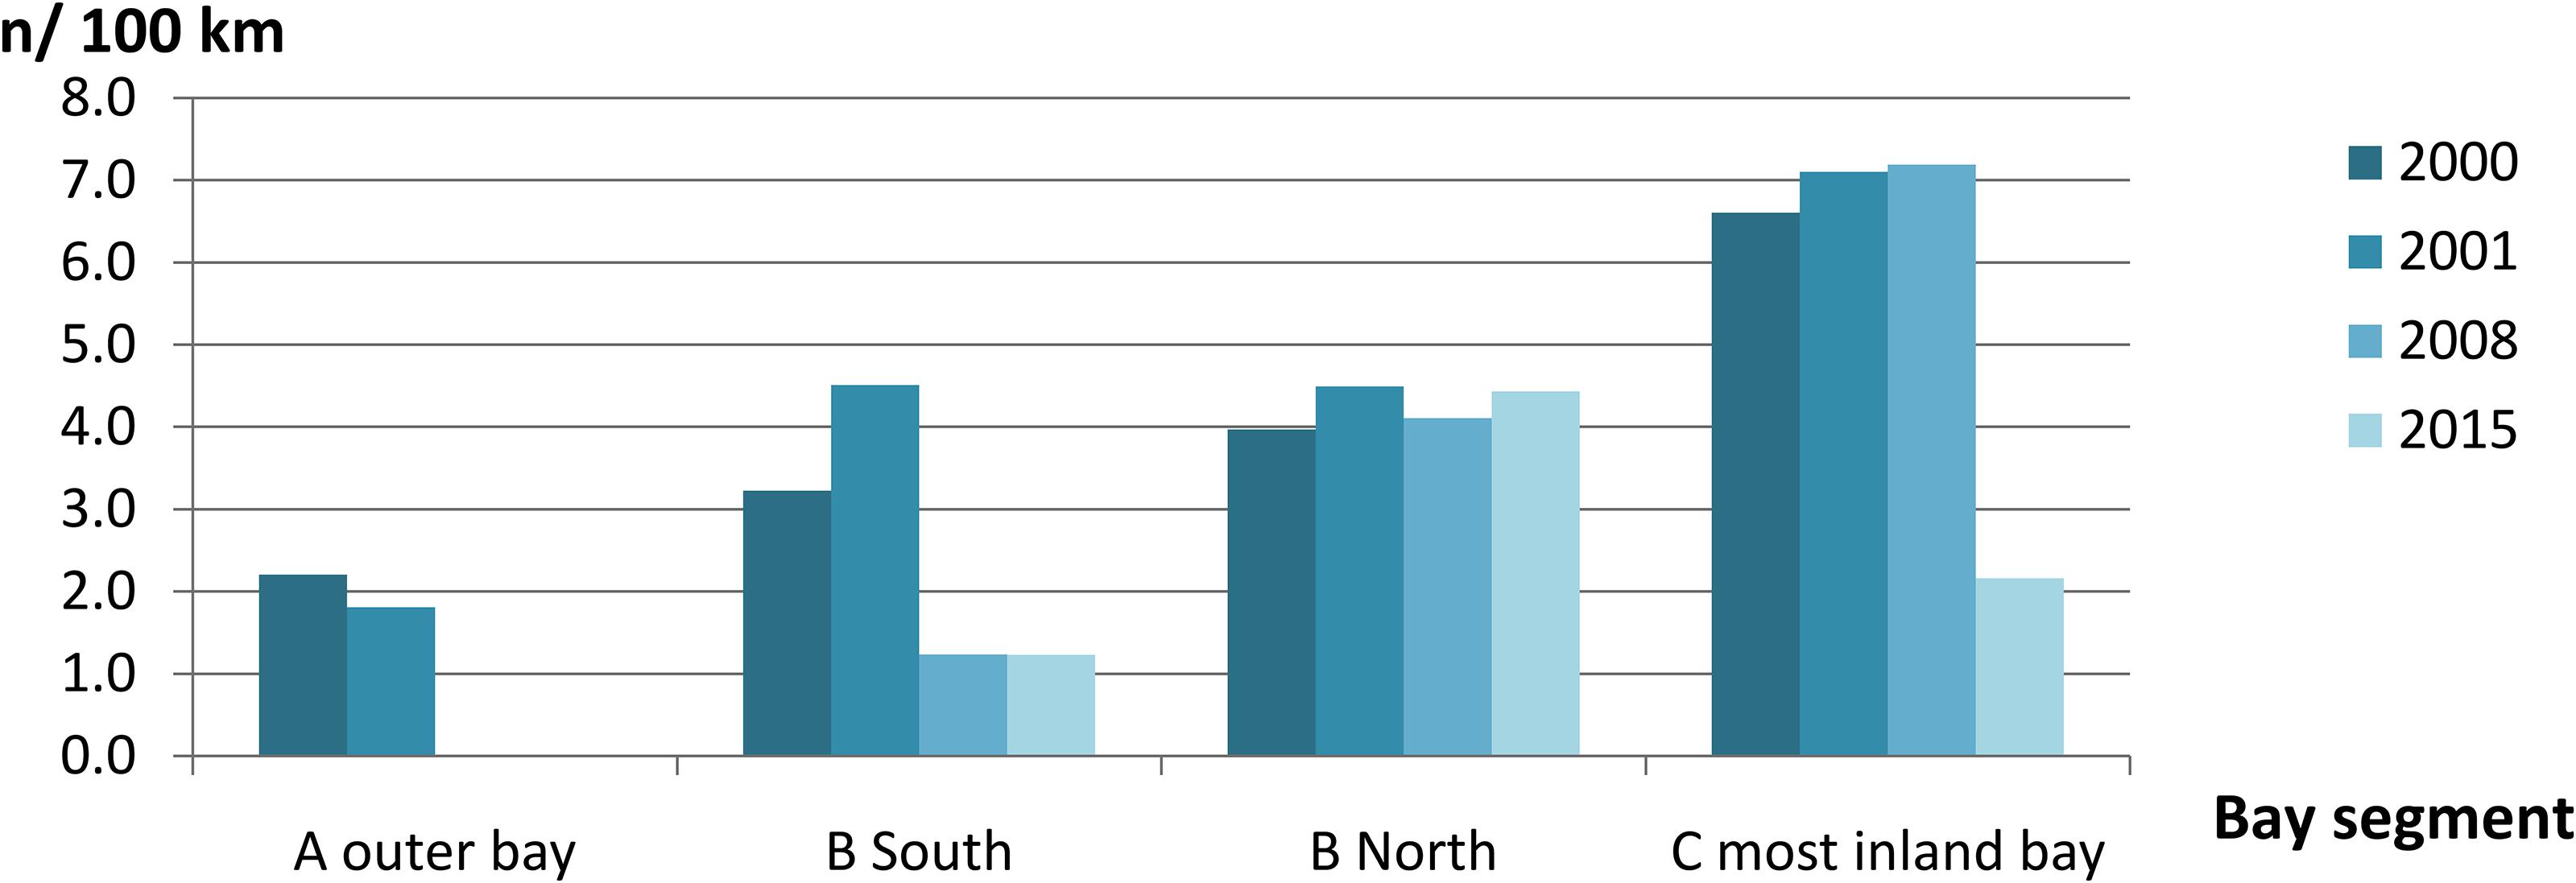
Figure 3. Mean annual group sighting rate per 100 km transect line of Irrawaddy dolphins per Bay segment in the years 2000, 2001, 2008, and 2015 (n = 109).
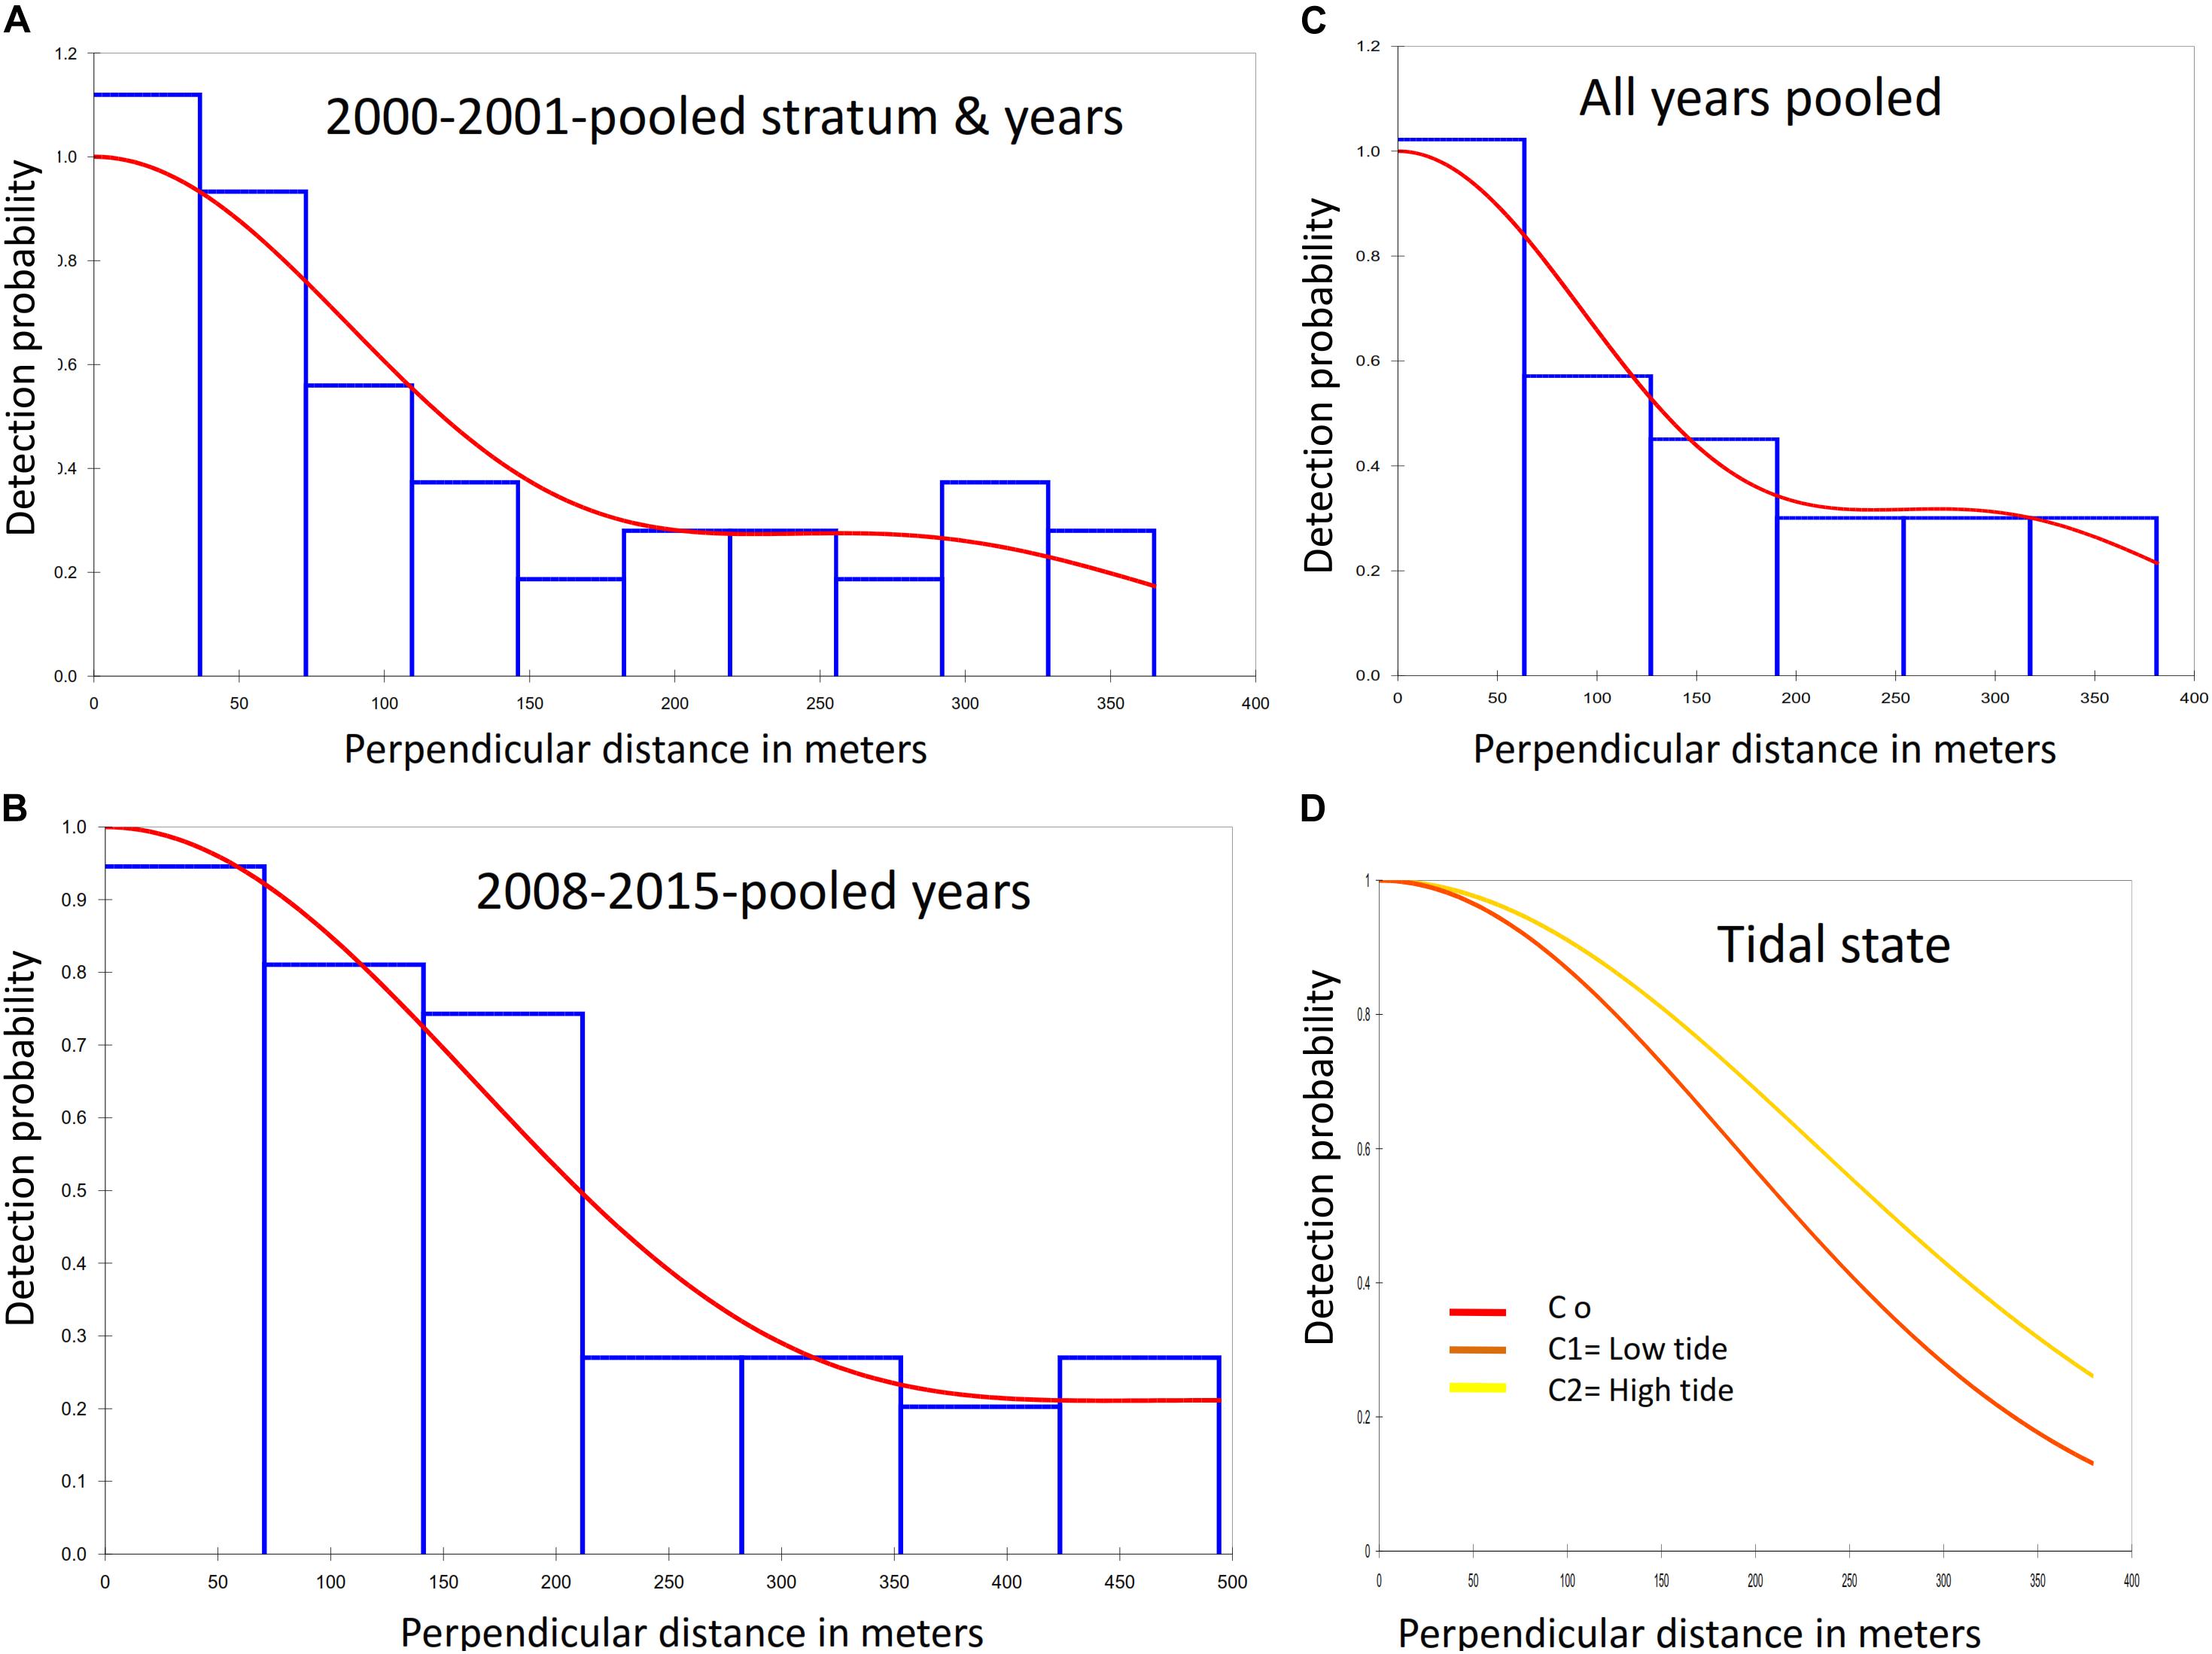
Figure 4. Detection functions fitted to the perpendicular distances of observations of groups of Irrawaddy dolphins. (A) Best fitted detection function for years 2000–2001 with pooled survey stratum and years providing the probability of a greater chi-square value, P = 0.916. Data were grouped using 10 equal-spaced intervals and 10% truncation. The curve. (B) The detection function for years 2008 and 2015 with pooled survey years provided the probability of a greater chi-square value, P = 0.852. (C) Pooled years and stratum for 2000–2015. Data were grouped using 6 equal-spaced intervals and 10% truncation with the probability of a greater chi-square value, P = 0.807. (D) Detection function for covariates low and high tidal states.
Irrawaddy dolphins occurred in locations with an average water depth of 14.6 m (n = 94; SD = 9.3; 2–46), mean salinity of 26 ppt (n = 35; SD = 3.1; 20.7–32.8), mean temperature of 30.3°C (n = 17; SD = 1.2; 28.1–32.4) and mean clarity of 172 cm (n = 36; SD = 85; 57–500).
Irrawaddy Dolphin Density and Abundance Estimates
Distance Analysis
Survey effort, number of Irrawaddy dolphin sightings per year period, density and abundance estimates with their associated variation and probability of detection for both inner and outer Bay are summarized in Table 3. The final models, which are highlighted gray in the table, were based on the pooling of detection function and expected cluster size for inner and outer Bay strata for 2001 and pooling of years for 2008 and 2015. Best population estimates were 75 (95% CL = 46–122; CV = 23.9%), 47 (95% CL = 25–86; CV = 30.6%), and 45 (95% CL = 27–75; CV = 25.3%) for survey periods 2001–2002, 2008, and 2015, respectively with detection probabilities of 0.46 for 2000–2001 and 0.50 for 2008 and 2015. We consider that these models compared to other models had the best fitted detection function curves (Figures 4A–C), and highest likelihood outcomes of the goodness of fit tests for the survey year periods (2000–2001 and 2008–2015) with respective probabilities (P) of greater chi-square values of 0.92 and 0.85, likelihood Ps of 0.61 and 0.92 for Kolmogorov–Smirnov (KS) tests, and Ps between 0.5–0.7 and 0.8–0.9 [Cramer von Mises (CM), uniform and cosine weighting] for both survey year periods. For year period 2000–2001, the model with the best fitting detection function, a 10% truncation at the right, and lowest AIC value (565) was the half-normal cosine with a maximum of two adjustments. For year periods 2008 and 2015, the best model with 5% truncation and lowest Akaike’s Information Criterion (AIC) of 631, was the uniform cosine with two adjustments, whereas the default half-normal cosine model had an AIC score of 633. Average group sizes were used in the chosen models as the P-value of size-bias regression tests were greater than the specified significance level of 0.150.
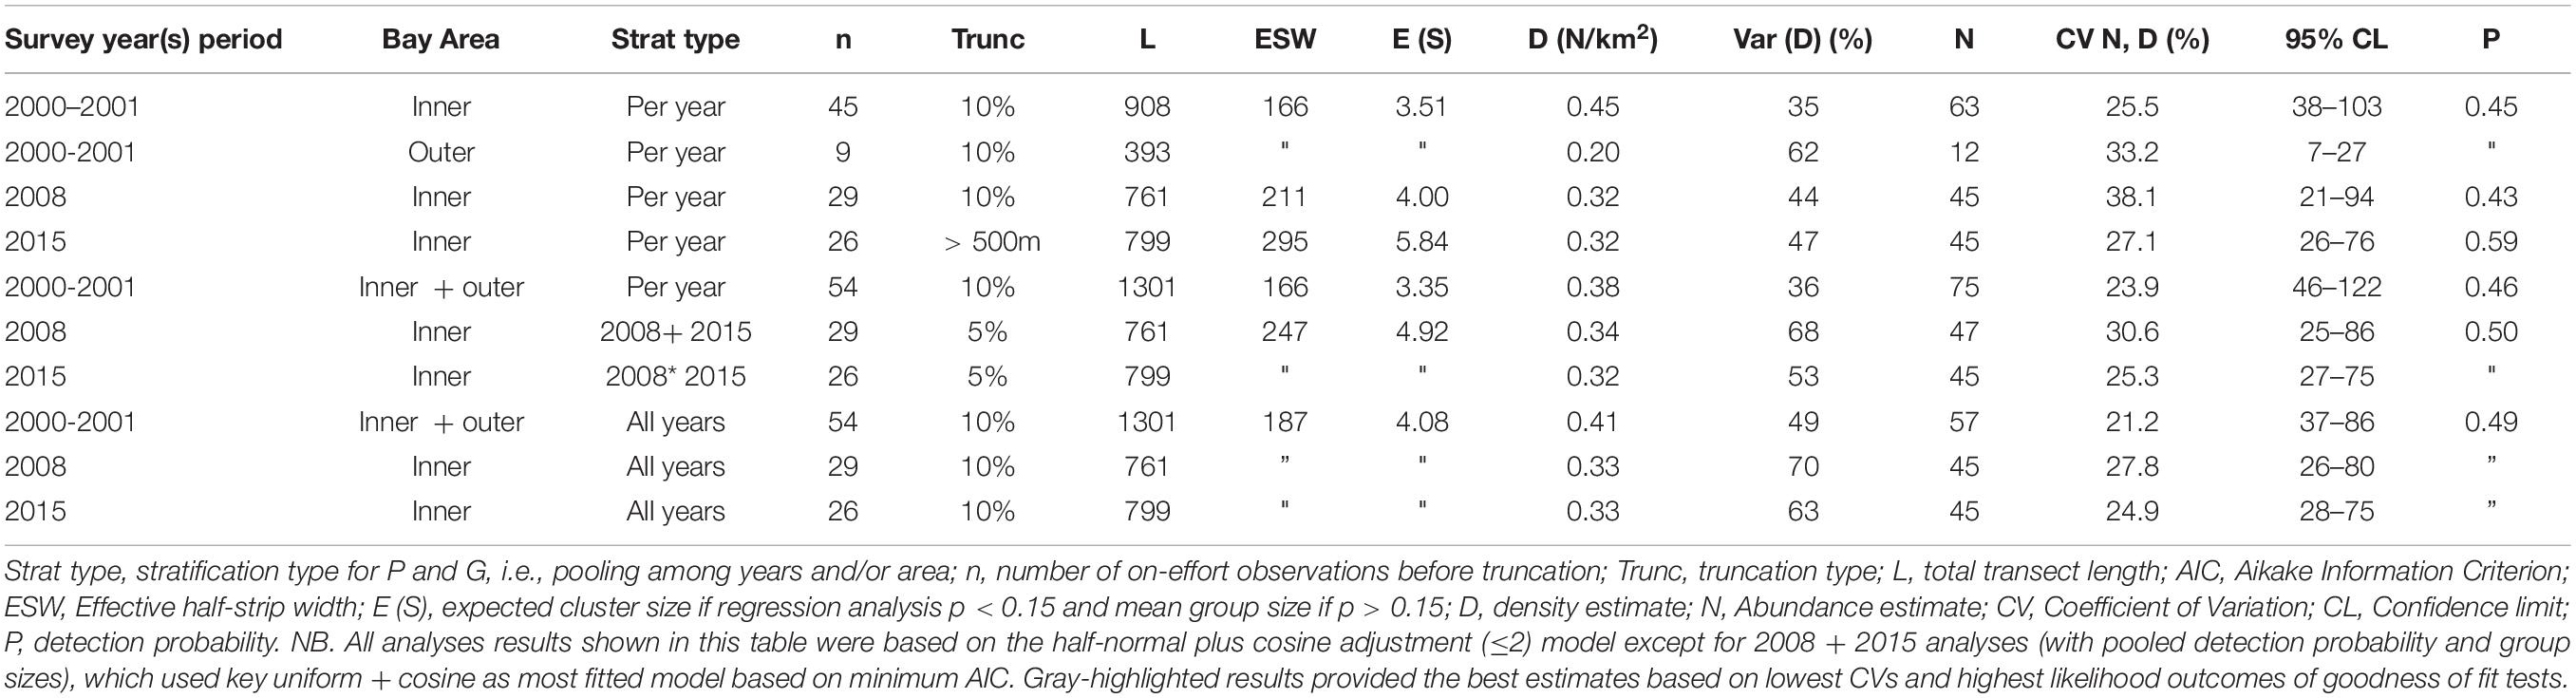
Table 3. Irrawaddy dolphin abundance and density estimates based on different types of pooling of years with their corresponding variation and detection probability.
Detection curves for covariate visibility did not differ among different scales, whereas the differences between Beaufort scales were only slightly different for Beaufort 2 sea states compared to states 0 and 1. Inclusion of covariates visibility and Beaufort both increased the detection probability (P = 0.62 and 0.63) but did not improve the model fit with low likelihoods of KS and CM tests and a probability of P < 0.05 that Chi-square value is greater. AC value was also 5 and 7 points higher than the same model without covariates. Tidal condition on the other hand did show different detection curves for low and high tide (Figure 4D), with the high tide curve showing a higher detection probability (P = 0.63). However, the model had a low likelihood of KS and CM tests and a probability of P < 0.05 that Chi-square value is greater. AIC value was also 6 points higher than the same model without covariates.
We only observed Irrawaddy dolphins in the outer Bay area (A) in 2000–2001 while in 2008 and 2015 we only observed these dolphins in the inner Bay segments (B and C) (Figures 1, 2). Encounter rates for 2000–2001 that were not stratified for Bay area resulted in 0.38 individuals/km2, while encounter rates that were stratified for Bay area resulted in much lower rates for outer Bay area (0.20 individuals/km2) compared to inner Bay area (0.45 individuals/km2). Encounter rates for the inner Bay area in years 2008 and 2015 of 0.32 and 0.32 individuals/km2 were lower (although not significant) than the stratified rates for the inner Bay estimates and area-pooled estimates for 2000–2001 (One-tailed t-test = 2.226; p = 0.078; df = 1). Although the variances of density estimates within each survey year period were quite high, i.e., 36, 44, and 47%, variances of estimates among different year periods were significantly higher, i.e., 49, 70, and 63% [t-test = −2.622; p = 0.029 (one-tailed) and p = 0.058 (two-tailed); df = 4].
Mark Recapture Population Size Estimate
We identified 85 dolphins based on the unique feautures of their dorsal fins and by using marks we deemed to be long-lasting, to be more confident that marks were not ‘lost’ between sampling occasions. In 2008, we identified 45 individuals and, in 2015, we identified 51 individuals. We obtained photographs of dorsal fins during 67% of Irrawaddy dolphin sightings (n = 30) in 2008 and 65% of sightings (n = 26) in 2015. No pictures were taken during sightings where dolphins only surfaced briefly and disappeared quickly. For each group size that was visually estimated in the field and photographs were taken, the number of dorsal fins identified per sighting represented 99% of the visually estimated group size in 2008 and 82% of estimated group sizes in 2015. Identification rates for 2008 for each consecutive capture session, i.e., 3 survey periods, comprised 22,17 and 38 individuals whereas in 2015 these rates comprised 34,28 and 11 individuals.
Population estimates for 2008 and 2015 were based on mark-recapture analysis from three survey periods for each year. The mark-recapture model that fitted the data best was the closed capture model with equal capture probabilities based on the lowest AICs (Akaike’s Information Criterion) and least parameters used (Table 4). This model provided estimates of 48 individuals (95% CI = 46–57) for 2008 and 69 individuals (95% CI = 58–93) for 2015. The proportion of animals with no distinctive dorsal fin features was 0.05 of a total sum of 305 marked and unmarked identified fins per sighting so the proportion of marked animals, p was 0.95. Corrected population estimates were 51 (95% CI = 44–60) for 2008 and 73 (55–98) for 2015, which we consider the best estimate of the Irrawaddy dolphin population in Balikpapan Bay based on the photo-identification data.
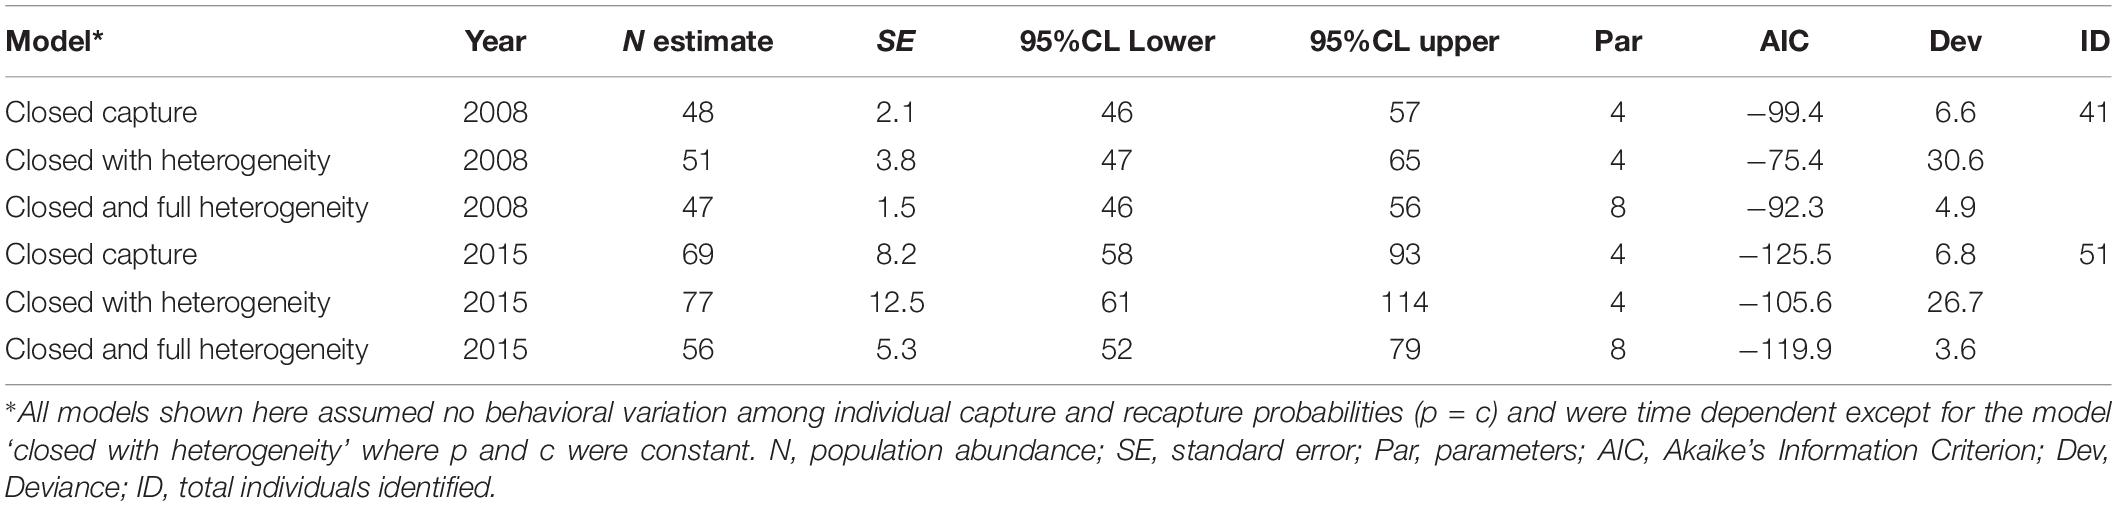
Table 4. Closed mark recapture abundance estimation models 2008 and 2015 based on Otis et al., 1978.
Irrawaddy Dolphin Site Fidelity
Irrawaddy dolphins exhibited a relatively high site fidelity to Balikpapan Bay. We observed a relatively high overlap of the same individuals between at least two survey periods within survey year 2008, as high as 57% of a total of 44 identified dolphins in 2008 (Table 4). The overlap of the same individuals within two or more survey periods for 2015 was somewhat lower in 2015 (35%). Of the total number of 85 identified individuals when combining survey years 2008, 2011, and 2015, 53% of all identified individuals were recorded in at least two survey years. The re-sighting rate of individuals between survey years 2008 and 2011 was 45%, whereas between years 2011 and 2015 the rate was slightly lower at 42%. The re-sighting rate of individuals observed both in 2008 and 2015, representing the largest period interval, was 28% of the total number of identified individuals in these years.
Other Marine Mammal Species Occurrence in Balikpapan Bay
We encountered three other marine mammals in the Balikpapan Bay study area, i.e., Indo-Pacific finless porpoise, the Indo-Pacific bottlenose dolphin as well as the dugong (Dugong dugon) (Figure 5). The number of encounters were low (Table 5). Both cetacean species were mainly encountered outside the Bay, whereas dugongs were encountered consistently in the inner upper Bay (segment B North). Finless porpoise had the highest mean group sighting rate per km transect for combined survey years, although both species were sighted three to four times less frequently than Irrawaddy dolphins. Bottlenose dolphins’ mean individual encounter rates per km transect were three times higher than that for finless porpoises, however, when compared with the Irrawaddy dolphins’ encounter rate, bottlenose dolphins were two times less frequently encountered. Dugongs were least often detected during line-transect surveys.
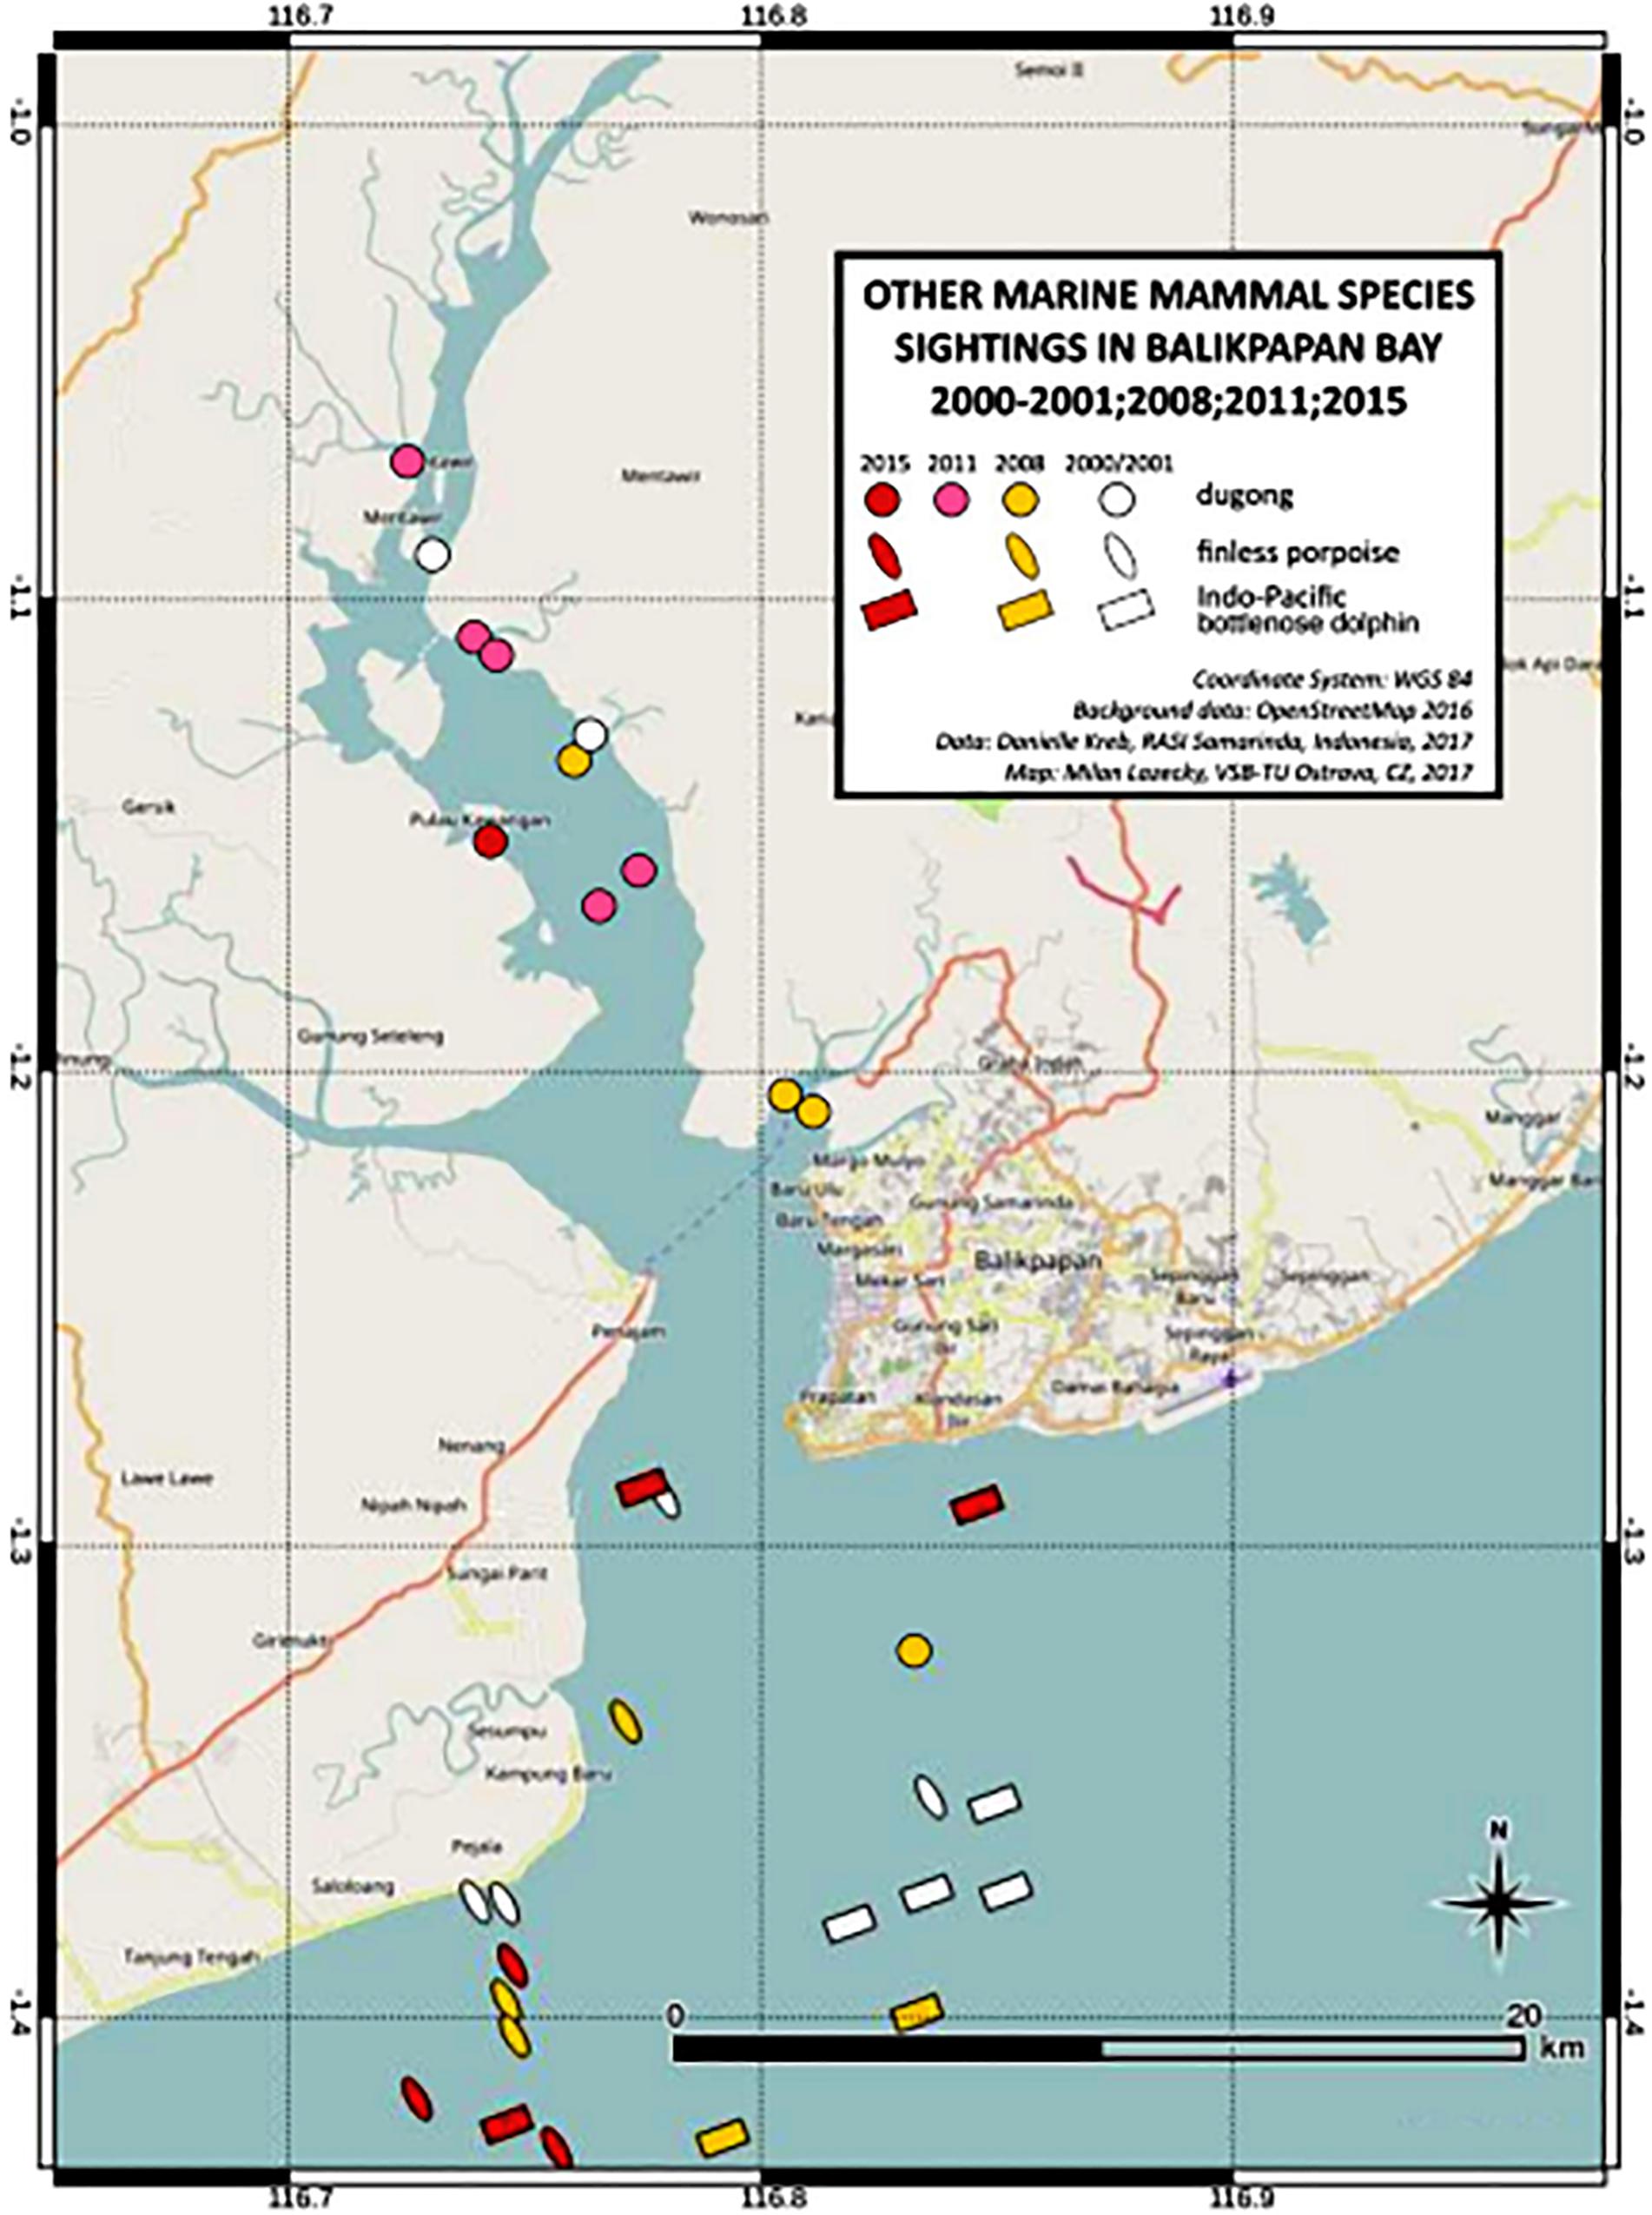
Figure 5. Distribution of other marine mammal species in Balikpapan Bay.
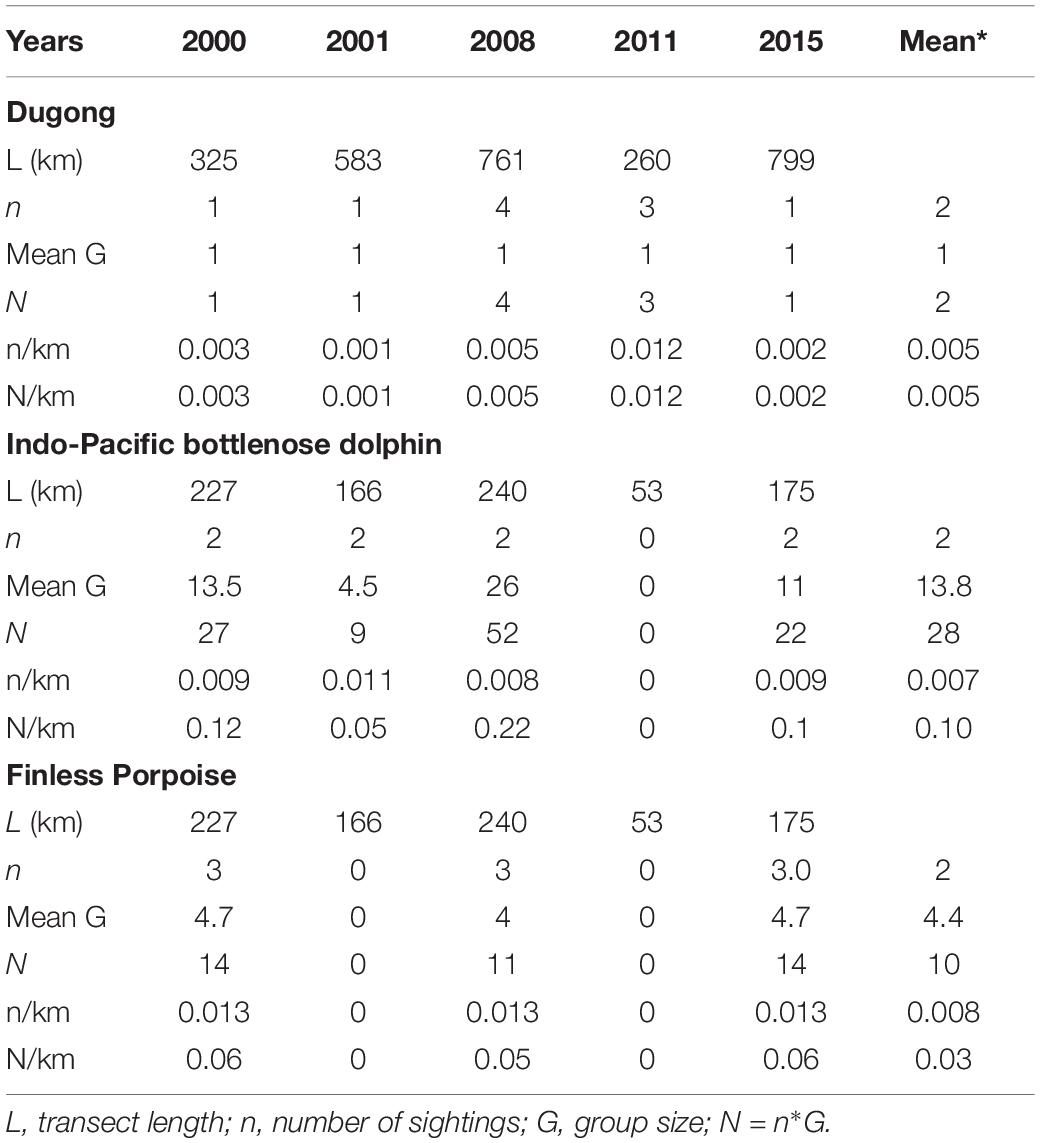
Table 5. Sighting and individual encounter rates of other cetaceans in the outer Bay (A) and sirenians in segments inside the Bay (B South, B North and C).
Marine Mammal Stranding Cases in Balikpapan Bay
Between 2008 and 2018 there were a total of 29 marine mammal stranding cases involving 27 single strandings and two mother and calf strandings (total 31 individuals). Four individuals stranded alive and were refloated. The live strandings comprised an Indo-Pacific Bottlenose dolphin, a pygmy killer whale (Feresa attenuata), a mother-calf dugong pair and a mother-calf Indo-Pacific bottlenose dolphin pair. Both calves died and the mothers survived. Most number of strandings were finless porpoise (n = 9), Irrawaddy dolphins (n = 8; 0.67 dolphins/year), and Indo-Pacific bottlenose dolphins (n = 5) (Figure 6) and the highest number of overall strandings occurred between 2015 and 2018 (Figure 7). In 22 out of the 29 cases, cause of death was not determined due to the advanced status of decomposition (Figure 8). Four strandings were attributed to gillnet entanglement; Irrawaddy dolphins (n = 3) and finless porpoise (n = 1). In 2011, an emaciated Irrawaddy dolphin stranded and on necropsy a baby diaper was found in its stomach, which was preventing the ingestion of food items. Two Irrawaddy dolphins also stranded a day after the large-scale oil spill and fire occurred in the Bay with one of the dolphins exhibiting oil film on blackened skin. Of the Irrawaddy dolphins that were reported entangled in gillnets, one was a dead calf (1.04 m) that was released by the fisherman that found it. The same calf was then observed dead four days later by the first author but was being tended to by five adult dolphins that even appeared to defend the carcass against a crocodile. On the fifth day the group had abandoned the carcass, which was in an advanced state of decomposition.
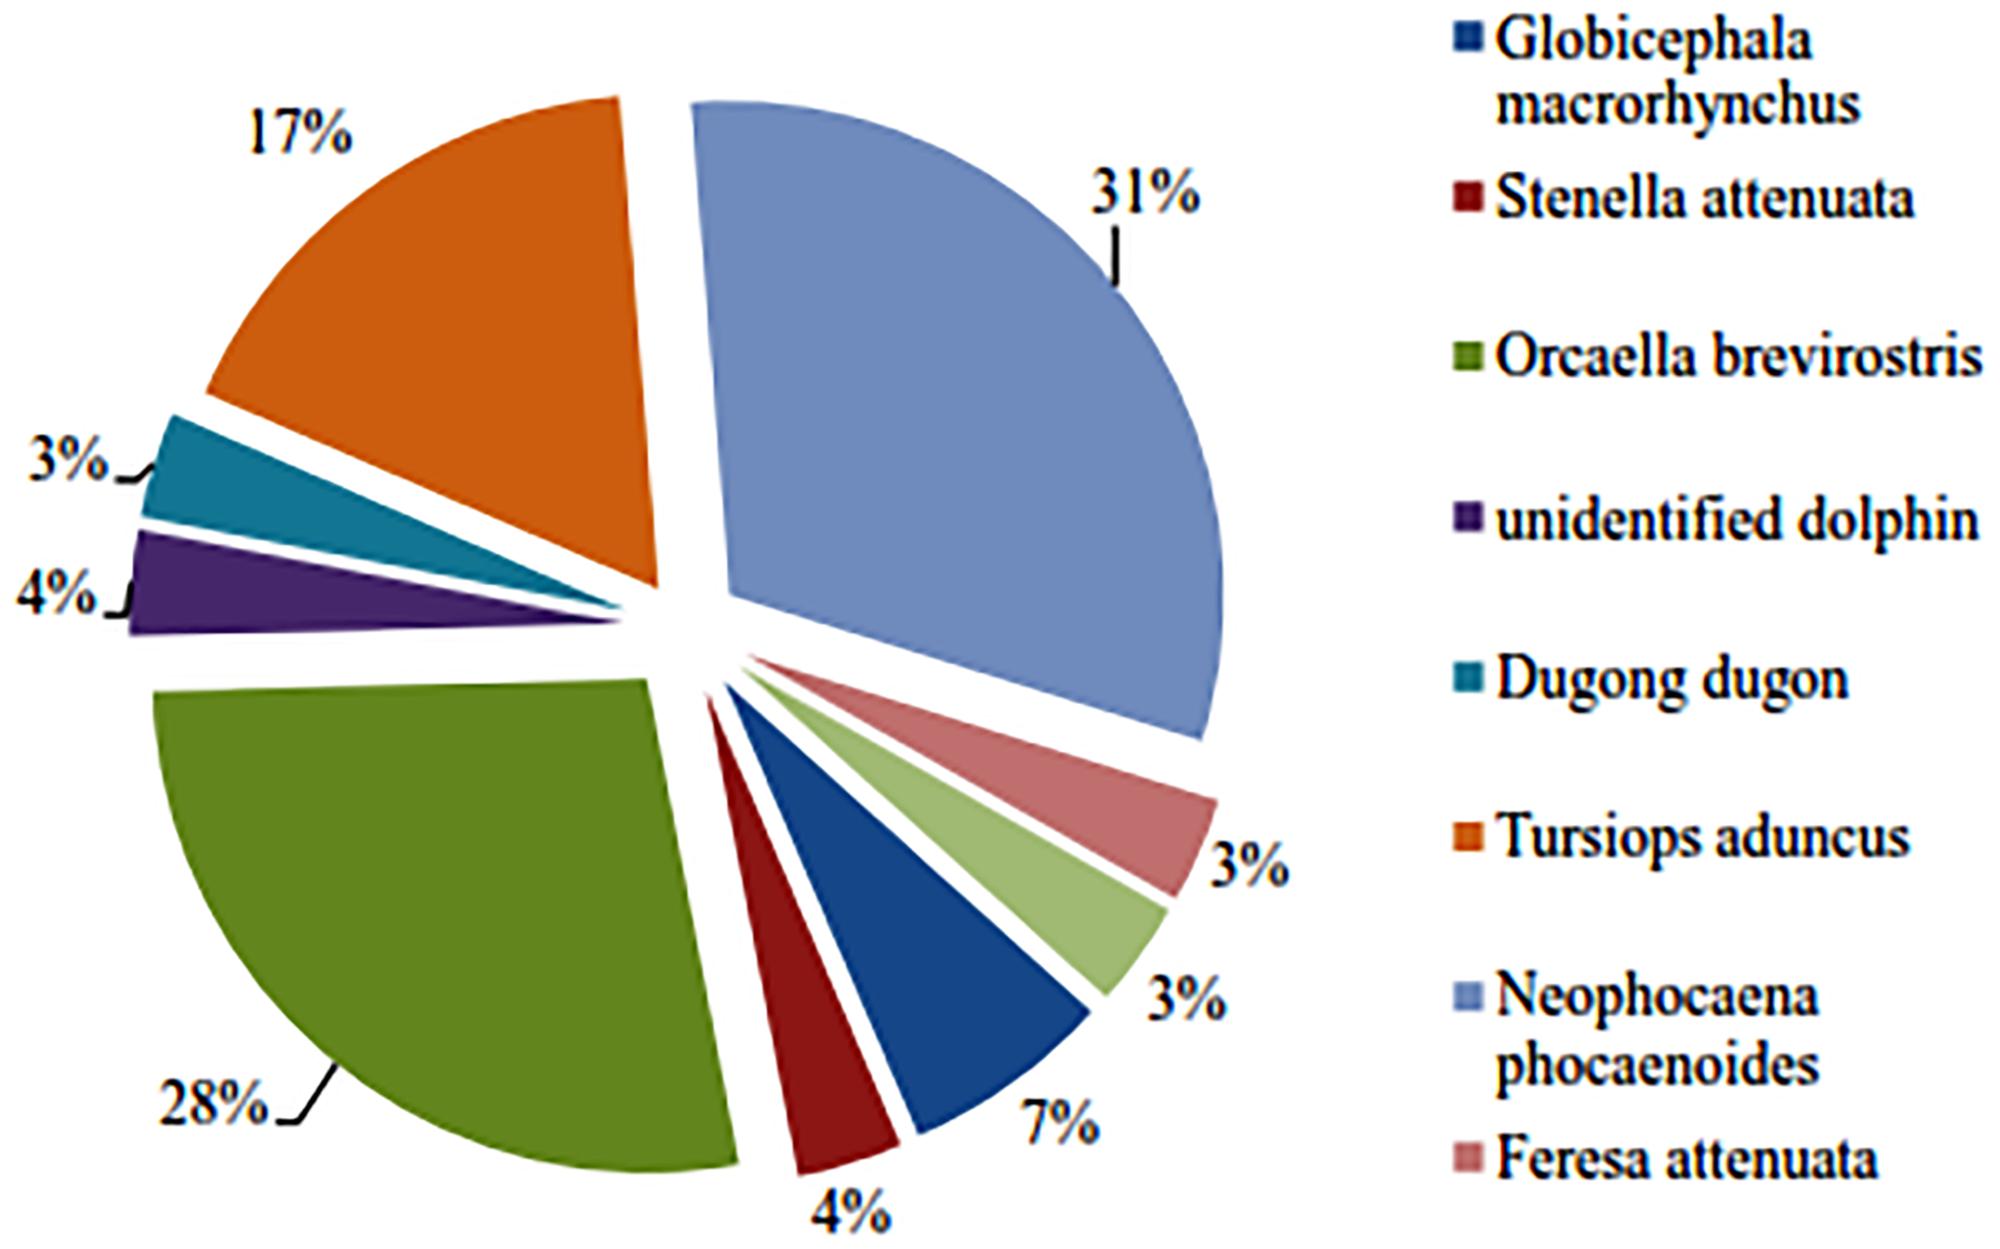
Figure 6. Marine mammal species stranded in Balikpapan Bay 2008–2019 (n = 29).
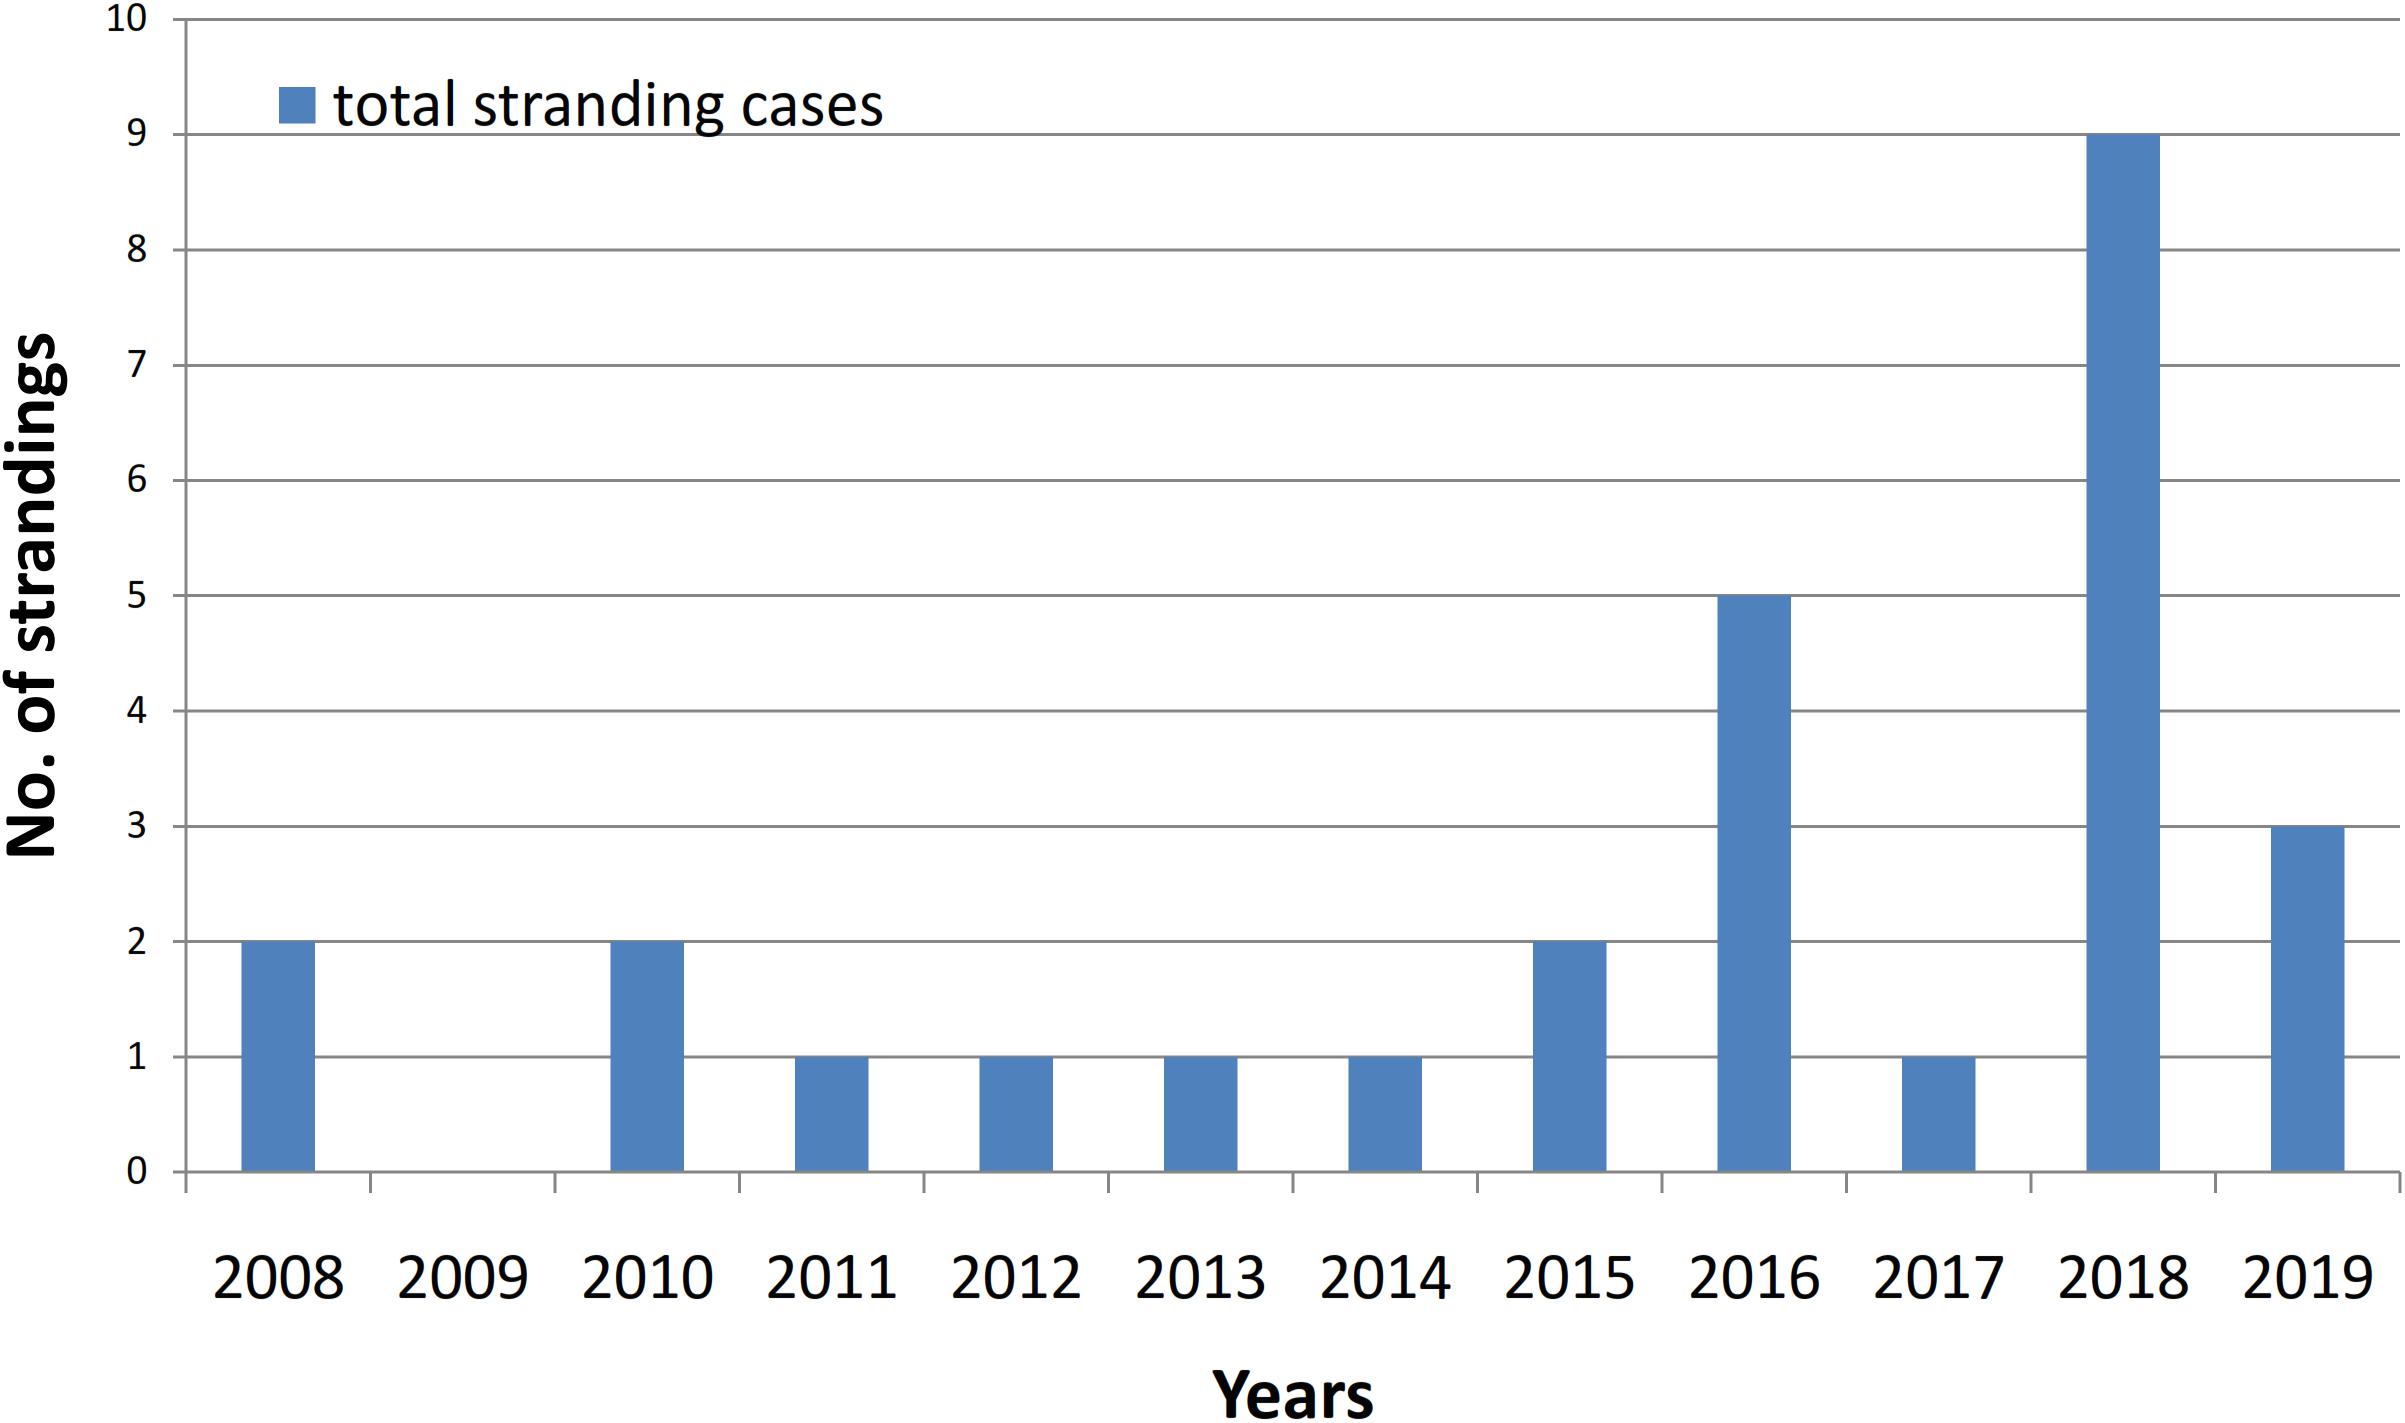
Figure 7. Total number of stranding cases in Balikpapan Area, 2008–2019 (n = 29).
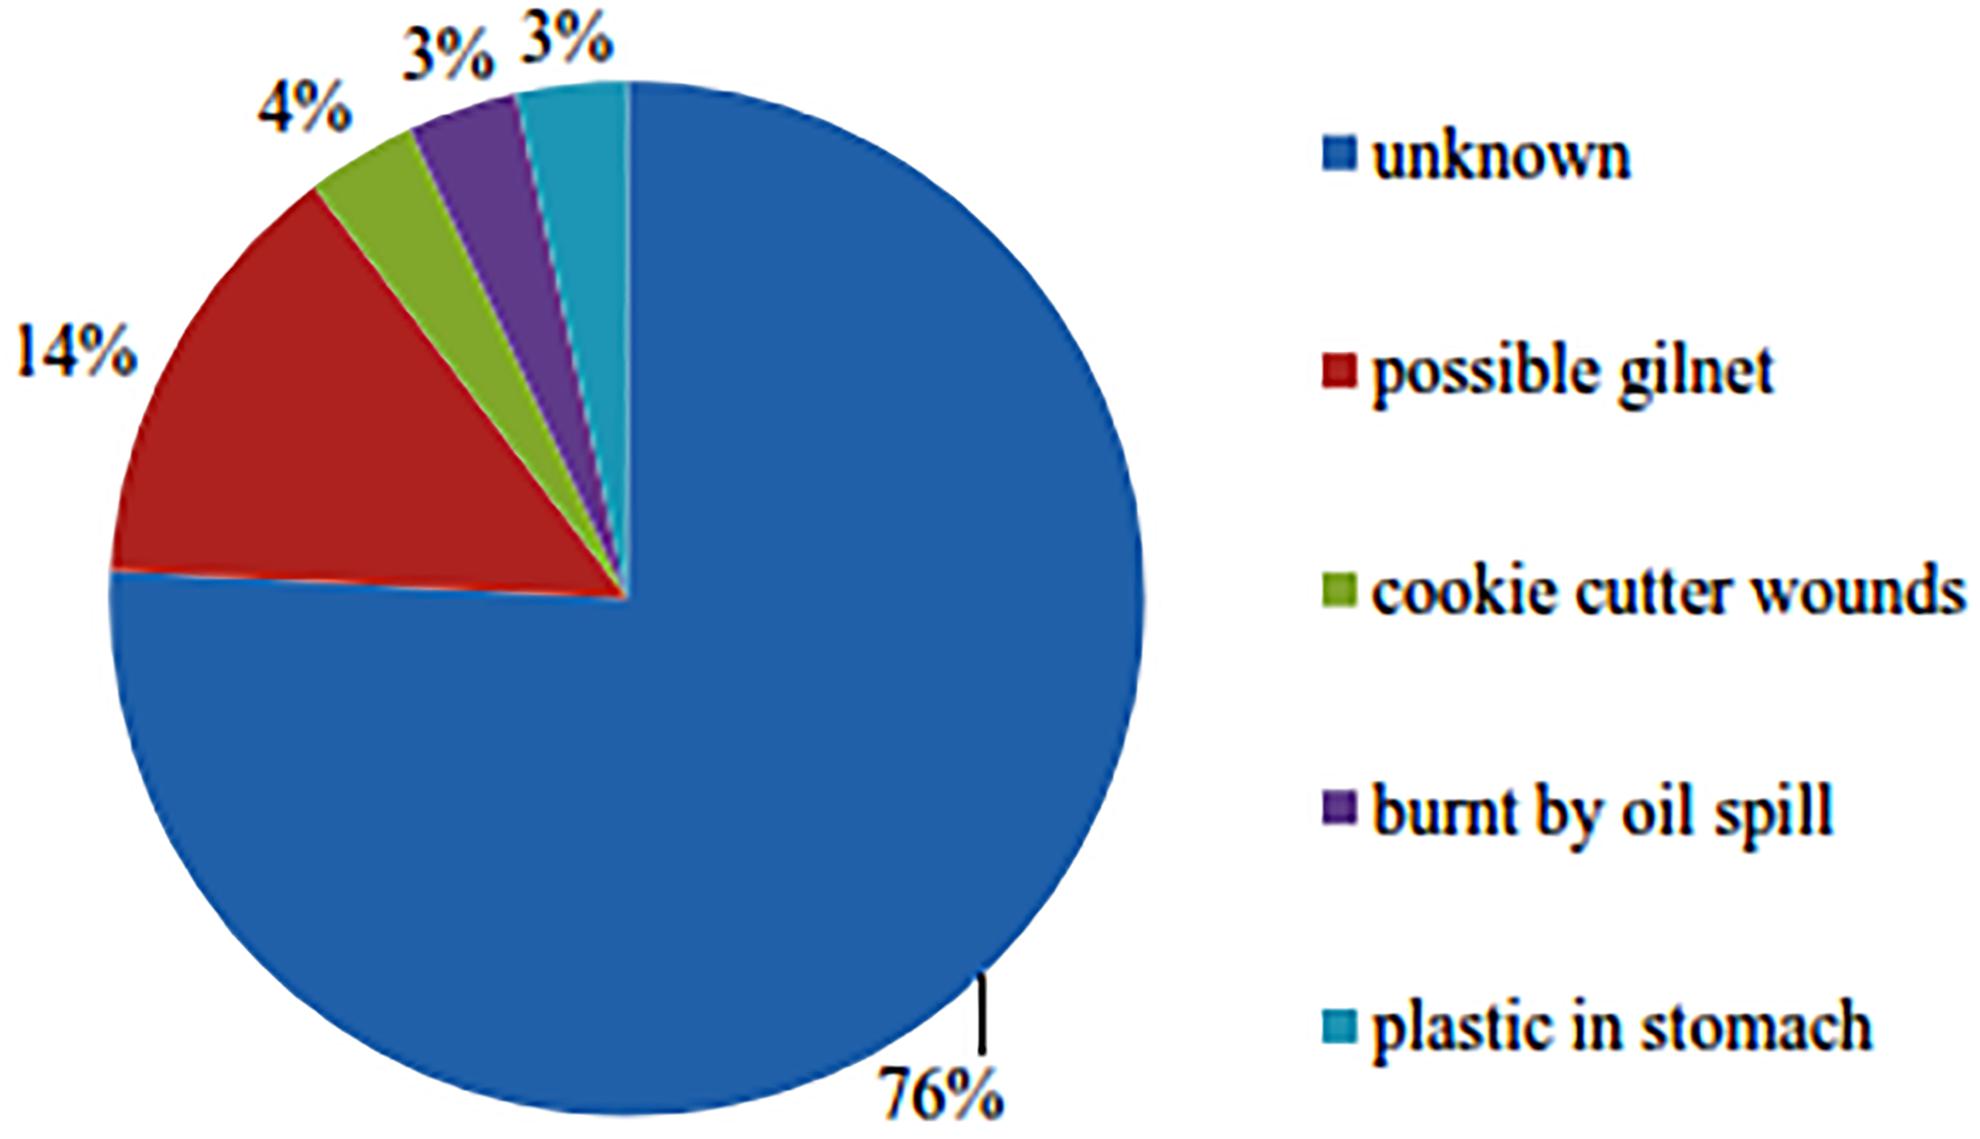
Figure 8. Probable causes of mortality of stranding cases in Balikpapan Bay.
Using the minimum and best population estimates from distance sampling for 2015 (Nmin = 27 and Nbest = 45, respectively) Potential Biological Removal (PBR) ranges from 0.05 [Recovery factor (FR = 0.1) for Nmin to 0.09 (FR = 0.1) for Nbest]. When using estimates from mark-recapture analyses (Nmin = 55 and Nbest = 73), PBR ranges from 0.11 (FR = 0.1) for Nmin and 0.15 (FR = 0.1) for Nbest. The mean number of 0.67 Irrawaddy dolphins that died yearly (of which at least 6 out of 7 with known human-related cause) is higher than the calculated PBR for Nmin and Nbest for both density sampling and mark-recapture estimates. Using a recovery rate of 0.5, mean annual mortality is also higher than respective PBR values of 0.27 and 0.45 for Nmin and Nbest for recovery rates of 0.5 from density sampling and Nmin for mark-recapture estimate (PBR = 0.55). However mean annual mortality is lower than the PBR value obtained from Nbest from population mark-recapture estimate (PBR = 0.73) for a recovery rate of 0.5.
Fisheries and Marine Mammal Condition According to Fishermen
In 2015, interviews were conducted with experienced fishermen (n = 22) from three villages. All fishermen stated that there had been a decrease in several commercial fish species over the last 15 years (Table 6). The fishermen stated that these declines followed an increase in industrial activities, i.e., harbor construction and ship traffic (47%), unsustainable fisheries by other fishermen (40%), pollution and sedimentation (13%). All fishermen were of the opinion that the government did not adequately patrol the area or and enforce the law. Fishing gear perceived by fishermen as a threat included trawls, Danish seines, trammel nets and lift nets. All fishermen were able to indicate sea grass locations along the inner shores of the Bay on a map but all noted that seagrass areas used to be much more widespread. Irrawaddy dolphins were sighted daily by all fishermen in the upper Bay areas (B North and C, Figure 1) in all seasons, whereas 10 years ago, Irrawaddy dolphins were more widely spread throughout the Bay, including the outer Bay. Interviews also revealed that two dugongs had been killed in 2005, one by the propeller of a speed boat and another in a fishing trap. According to all fishermen, dugongs were increasingly rare and available seagrass areas had rapidly shrunk during the study period (2000–2015).
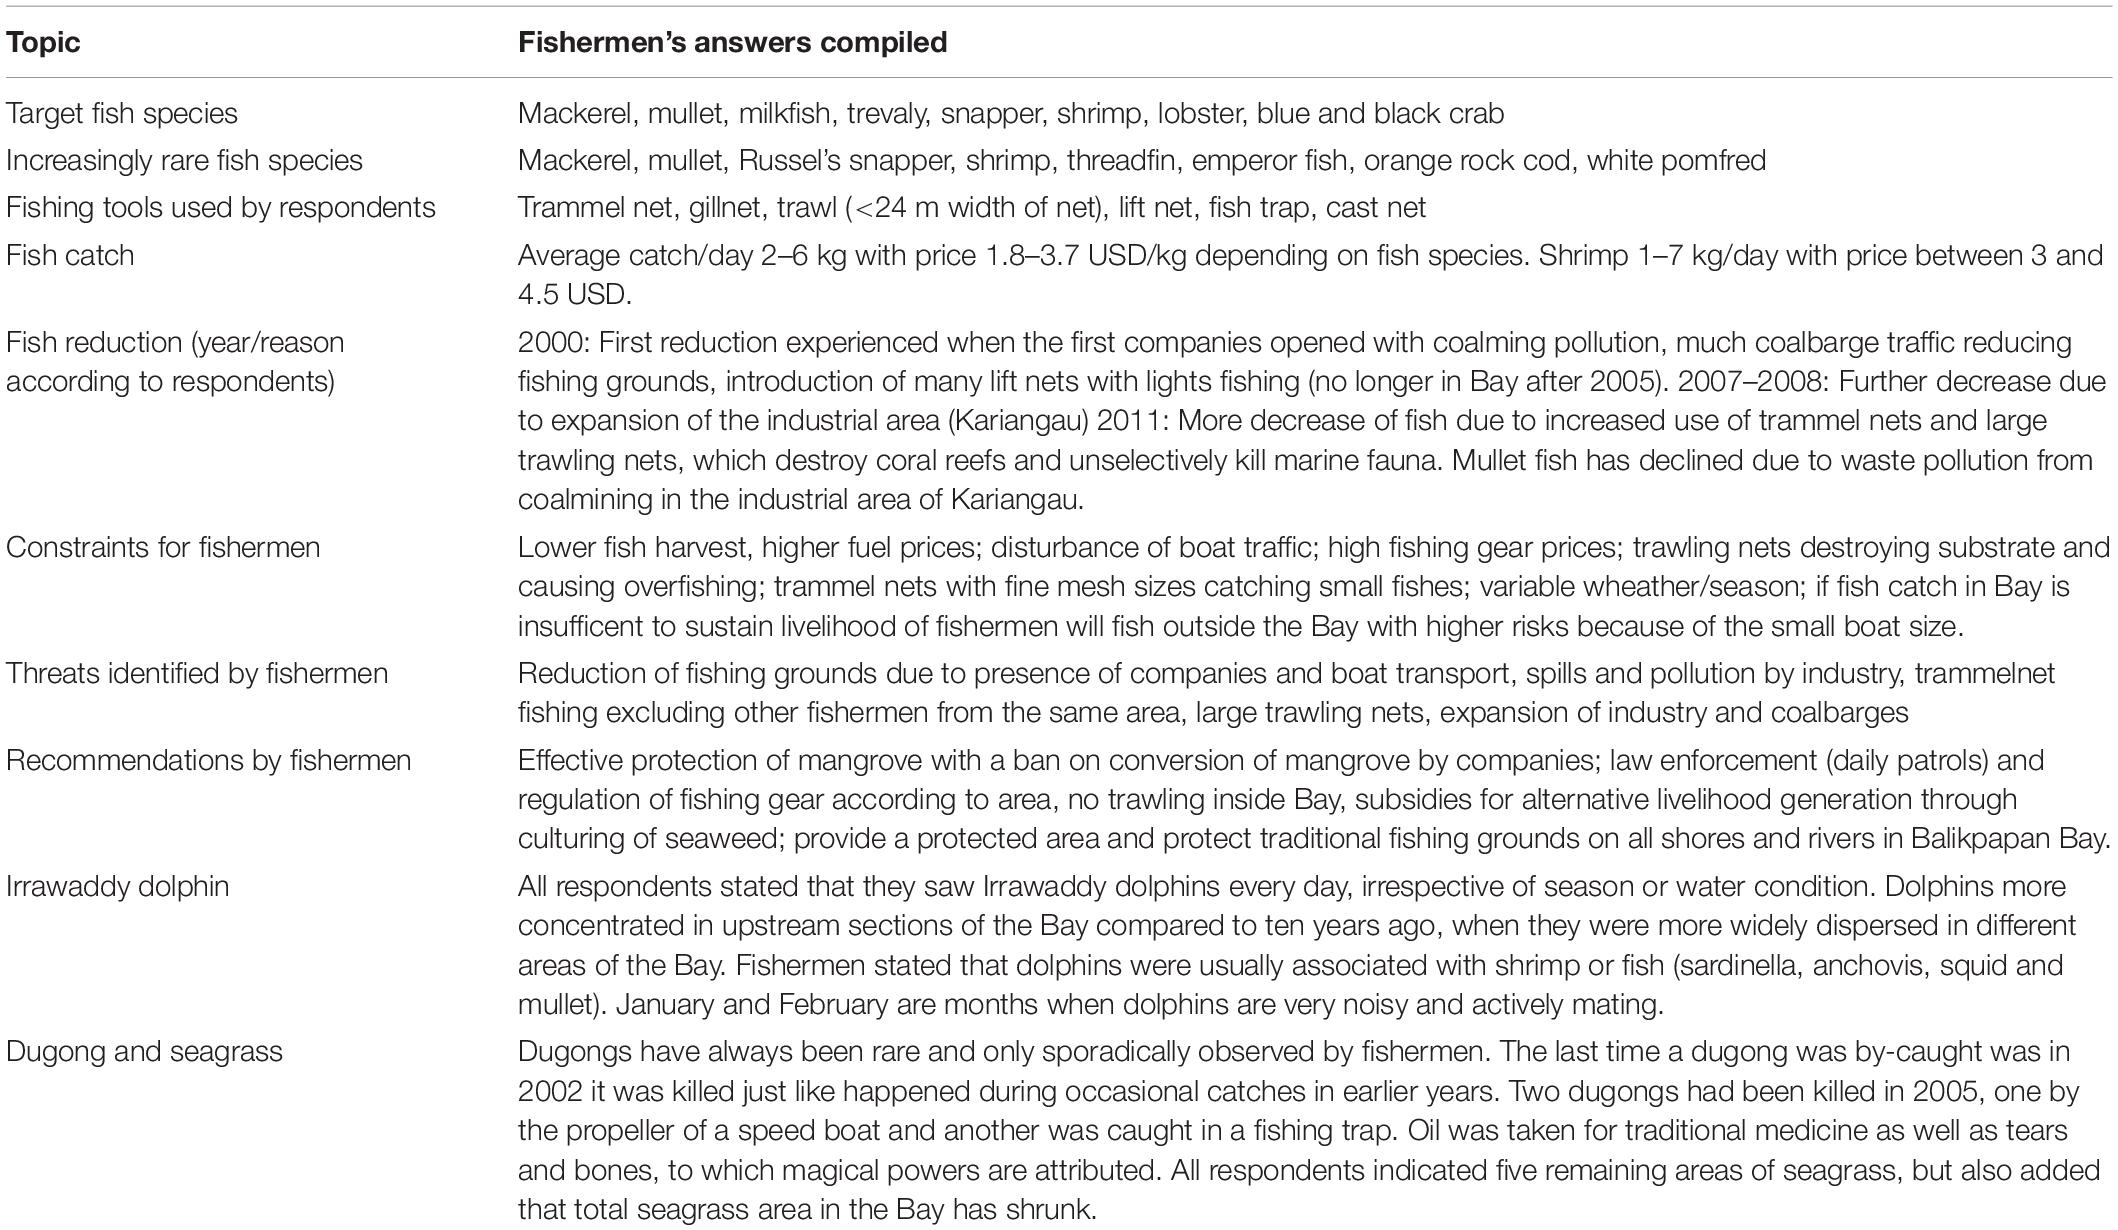
Table 6. Fisheries and marine mammal conditions in Balikpapan Bay according to senior fishermen (n = 22).
Industrial Habitat Usage and Coastal Development
Between 1995 and 2015, there was significant loss of mangrove habitat (∼789 ha), particularly on the eastern shores of the Bay (segment B North; Supplementary Figure S1) due to industrial expansion along the Bay shores.
An increase in large-sized shipping traffic (i.e., tankers, coal barges) in the lower Bay segment was observed. From data collected during boat surveys, the mean number of vessels observed per day (stationary and moving) increased from 5 ships (2000–2001) to 20 and 30 ships for years 2008 and 2015, respectively.
In 2015, bridge construction at Pulau Balang, connecting the eastern and western Bay shores near the Tempadung River mouth, was observed and there were no apparent mitigation for marine mammals in place (Figure 1). The area represents sensitive habitat for both Irrawaddy dolphin and dugong, which have been observed there in all years (Figures 2, 6).
During earlier piling activities for jetty construction in the same area of Pulau Balang in 2010, a marine mammal mitigation program was implemented. During 29 piling days, dolphins were observed within 0–1.7 km radius distance to the barge on 26 days, which was 28% of the total observation time (c. 8.00 am – 17.00 pm). During active piling no dolphins were observed within 500 m range, but were observed in close proximity to the piling area prior to piling commencing. Piling was always postponed until the area was clear of dolphins. The time that dolphins spent within the visible radius (up to 1.7 km), when piling was ongoing, totaled 14% of the total time spent by dolphins in the area, whereas dolphins spent 86% of their time in the area when piling was not active. When piling was ongoing the average distance of the dolphins to the piling barge increased significantly (952 m) in comparison to the average distance when piling had ceased (773 m) (Two-tailed t-test = 2.83; p = 0.005; df = 164). In addition, when piling was ongoing, the dolphins spent more time (57%) beyond 1km when compared to time spent (43%) in near piling zone (500–1000 m). When piling had ceased, dolphins spent more time within the 500–1000 m (61%), while they spent only 16% of time beyond 1 km. Finally, no dolphins entered the 500 m distance range when piling was ongoing but when piling ceased, dolphins spent 23% of dolphin of their time in this area There was no significant difference between the proportion of time dolphins were engaged in different behaviors during active and non-active piling periods. Fast swim was the most frequent behavior during active piling (500–1000 m) and non-active piling activity (0–1000 m), 42 and 43% respectively. Other observed behaviors in the near piling and distant zones were slow swim (33 and 32%), playing (19 and 13%) and feeding and milling combined (5 and 11%). Dolphins spent an equal amount of time in the area at low tide (1331 min) and high tide (1322 min).
Pollution and Cutaneous Nodules
An oil spill of 5,000 tons of oil inside Balikpapan Bay (segment B South) on 1 April 2018 affected a massive area of c. 20,000 ha, including 60 km of coastline and ∼300 ha of mangroves inside the Bay. Oil concentrations two weeks after the spill exceeded the nationally set maximum limits of 1 mg/l, in 4 out of 9 sampling locations and were higher in bottom sediment than in the water column in three locations indicating dispersants had been used. These locations included the Kariangau seagrass bed area (B South, Figure 1) with a value of 1.34 mg/l for its bottom sediment sample (4.3 m depth). While the value of oil and fat on the surface is much less (0.11 mg/l) than the bottom and middle depth (0.66 mg/l), the gradient indicates that the oil in this area has sunk and polluted the bottom whereas its presence in the middle depth of the water column was still significant. Gradients where also more oil concentrates were detected at the bottom and middle depth than the surface were observed for three other locations in segment B North although they did not exceed the quality standard. Higher oil levels were measured at bottom and middle depths than at the surface in three other locations in segment B North, although they did not exceed the quality standard. Locations where oil was still more dominant on the surface than at middle or bottom depths exceeded the quality standard in the upper Bay segment C. The value of oil and fat in two upper Bay locations of surface water were 1.64 mg/l and 1.033 mg/l, whereas in a downstream location (segment B South), a value of 1.16 mg/l was measured for surface water.
At two out of three locations where Irrawaddy dolphins were observed during the post oil-spill, and one location where Indo-Pacific bottlenose dolphins were observed oil concentration on the surface exceeded the national standard.
Cutaneous nodules were observed in all three study years and on 16 of the 85 identified individuals. Nodules were considered sparse and small or medium in size in all instances. In 2008, only 5% of the 44 identified individuals and, in 2011, only 4% of the 51 identified individuals exhibited nodules. The percentage of individuals with nodules in 2015 was 5–6 times higher, i.e., 25% of the 51 identified dolphins. Of the two individuals with nodules in 2008, one individual was re-sighted in 2015, which also had nodules. Two individuals with nodules in 2011, were not re-sighted. In 2015, 10 individuals with nodules were sighted in earlier years but no nodules were observed then in these individuals.
Discussion
Population Abundance, Site Fidelity and Mortality
Line-transect sampling techniques require various assumptions to be met (Buckland et al., 1993). One of the most important assumptions is that animal density in the area being surveyed is representative of the entire habitat, however, this is rarely true so surveys must be designed in such a way that that all portions of the study area have an equal probability of being surveyed. This is achieved by randomly, but systematically, placing replicate transect lines (at least 10–20) throughout the survey area so that adequate variance of encounter rate and a reasonable number of degrees of freedom can be achieved for constructing confidence intervals. In restricted coastal habitats it is extremely challenging to design such an ideal survey as there are many gradients, both physical, e.g., bathymetry, and environmental, e.g., tidal, that potentially create density gradients within the dolphin population itself. This complex study area used a combination of zigzag (sawtooth) transects in the more open areas, combined with sub-stratification to minimize time traveling off effort, and systematic parallel transect layout in the longer, narrow channels to achieve equal coverage probability (Thomas et al., 2007). It is also important that a sufficient number of sightings are made so that a representative detection function can be derived and to achieve reliable precision. As a rule of thumb, for reliable estimation of the detection function, the minimum sample size should be 60–80 sightings which was achieved for Irrawaddy dolphins, but for no other species. So, we feel we have achieved both a good survey design and sufficient sightings to make reliable estimates of the population. Another assumption is that animals do not move prior to detection, but, of course, animals do move. If they move after detection and after the required measurements are recorded, this is not a problem. If the dolphins move randomly prior to detection, then this too poses no significant problem to population parameter estimation, however, if they move in response to the survey vessel, then there may be a problem. If dolphins avoid the survey vessel, this causes a negative bias in abundance estimation and if they are attracted to the vessel, this causes a positive bias. We saw no evidence in the dolphins behavior that indicated they were either avoiding or were attracted to the survey vessel. This is not a species that normally bow or wake rides. The detection function showed no dip (indicative of avoidance) of heaping (indicative of attraction) at the transect line so we assume that this assumption has been met (Figures 4A–C). Another assumption is that all dolphins are detected on the transect line itself [commonly referred to as g(0) = 1]. This is almost never the case as there are two sources of bias; (1) dolphins spend a considerable amount of time underwater and are not always available to be observed (availability bias) and (2) the observers miss sighting the dolphin even though it has surfaced (perception bias). We believe that perception bias was minimized in our study as the survey team were very experienced, rotated positions to avoid fatigue, were well trained in survey protocols and the survey vessel traveled at an appropriate speed and had excellent forward visibility from the viewing area. In addition, Irrawaddy dolphins in Balikpapan Bay do not have long dive times (Kreb and Rahadi, 2004). We did not attempt to quantify the chance of observing a dolphin on the transect line therefore, we acknowledge that the stated density and abundance estimates are minimum estimates. The fourth assumption of line transect sampling is that all measurements are accurate. We achieved this by regularly training distance estimation so that distance to the dolphin was accurately estimated. For angle measurement, we used the compass in the binoculars and were strict in ensuring that the measured angle was not “rounded up.” Again, good training in survey protocols and using an experienced observer team minimized measurement biases (Scheidat and Porter, 2019). We are aware that biases in group sizes may exist as from experience in an another Irrawaddy dolphin study site, the first author had a tendency to underestimate group size when the group is large (<10) in earlier study years (<2005), which improved in time with a narrower the gap between visual estimates and photo-identified individuals per sighting. In order to reduce this potential bias, we applied a truncation factor of 10% for years 2000–2001 and a truncation factor of 5% for years 2008 and 2015.
Mark-recapture analyses also requires several assumptions to be met, both with regards to the population status and the types of marks used. For open population models, it is assumed that all animals have an equal probability of being captured in each sampling occasion. There is often heterogeneity in individual capture probability (either through probability of being encountered, being photographed or being recognized), however, that open populations cannot accommodate, and therefore closed populations are often more appropriate. Closed population models assume that the population is closed to birth, death, permanent immigration and/or emigration. It is also assumed that temporary immigration/emigration does not occur. We know there was birth/death during the course of our study and acknowledge that this will have caused a slight over estimation in our abundance estimation. We think it unlikely that there was permanent immigration/emigration as the population is restricted to a specific habitat and is far removed to any other known population of Irrawaddy dolphin and, for the same reason, do not anticipate any biases from temporary immigration/emigration. With regards to data from marked dolphins, it is assumed that (1) identifying marks are unique, (2) marks cannot be lost or change and, (3) all marks are correctly recognized on recapture and recorded and reported. We describe our practice of using long lasting, clear and multiple identifiers (such as notches, deformities and unusual fin shapes) for each individual dolphin thus minimizing the risk of having “twins” (calling two different dolphins the same name) and of losing track of marks between sampling occasions We use only excellent quality images and all identifications were verified independently by at least two persons and the final match always determined by the first author who is the most experienced field researcher for this population.
Both the uncorrected and corrected mark recapture population abundance estimates from 2008 and 2015 were within the confidence limits of the distance sampling abundance estimates, noting that some of the estimates derived from distance sampling are minimum estimates and that some of the mark and recapture estimates may be biased upwards. This may account for the discrepancies in the two estimates obtained for 2015. As there were only 3 survey year-periods over a period of 15 years, it was not possible to perform a regression analysis to look for trends in abundance or densities from distance sampling techniques, however, an indication of a declining population trend between the beginning and the end of the study period is that the mean variances of density estimates within each survey year period are significantly lower than the mean variances of the estimates among years (two-tailed t-test; P = 0.04; df = 2). However, estimates for 2008 and 2015 still lie within the confidence limits of estimates for 2000–2001. Mark-recapture results do appear to indicate an increase rather than a decline in population size, however, the discovery curve had not reached asymptote so we are not confident that we had captured all individuals in the survey periods. For both distance sampling and mark-recapture, with the limited number of year estimates and corresponding confidence limits it is not possible to detect a regression trend due to lack of statistical power. Taylor et al. (2007) pointed out that the ability to detect precipitous declines in abundance (50% over 15 years) for dolphins in U.S. waters is considered low, so it is expected that less steep declines are even more difficult to detect. Nevertheless, both mark recapture and distance sampling abundance estimates for Irrawaddy dolphins in Balikpapan are low and indicate that the population is vulnerable to activities that erode their habitats integrity or are extremely susceptible to environmental catastrophes.
Densities of the Balikpapan Bay study site for years 2008 and 2015 of 0.38 and 0.32 dolphins/km2, respectively, in most cases ranked lower when compared with other sites in South(east)Asia. In Minton et al. (2013) reported unstratified density estimates of 0.44 dolphins/km2, that are comparable to the 2000–2001 estimates in Balikpapan Bay (0.47 dolphin/km2). Densities observed in the Malampaya Sound, Philippines varied between rates 0.50 in pre-monsoon area and highest rate of 0.60 individuals/km2 in post monsoon period with in between rates for monsoon period (Smith et al., 2004). Densities of a coastal population in Thailand along a nearly 50 km long coast line and 12 km survey area perpendicular to the shore were 0.98 individuals/km2 (Hines et al., 2015), which is almost three times higher than the Balikpapan Bay population. Only in the nearshore waters of Bay of Bengal, Bangladesh similarly low densities (0.32 individuals/km2) were observed than in Balikpapan Bay (Smith et al., 2008). Future, comparative studies among these study sites on the environmental stresses and available fish resources may allow us to better understand the drivers of the different densities observed for Asian Irrawaddy coastal populations.
Irrawaddy dolphins exhibited a relatively high site fidelity to Balikpapan Bay. We concluded this from the high incidence of recapture, more than half of the total identified Irrawaddy dolphins in Balikpapan Bay, in at least two from three survey year periods (2008, 2011, and 2015).
Threats to Irrawaddy Dolphins and Other Marine Mammals
Unsustainable Mortality
The mean annual mortality rates of 0.67 Irrawaddy dolphins/year is unsustainable based on the lower potential biological removal (PBR) values for both minimum and best population sizes estimated from distance sampling and mark-recapture analysis with recovery factors (FR) of 0.1 and 0.5, except for mark-recapture best population sizes using a FR of 0.5. Recovery rates of 0.1 are considered best suitable for endangered species (Wade, 1998).
Changes in Distribution and Underwater Noise
There was a clear change in distribution during the survey period indicated by the survey data (Table 2 and Figure 3) and supported by the interview data (Table 5). Irrawaddy dolphins sighted during surveys between 2008 and 2015 were no longer observed in the outer Bay segment. Dolphins were more often observed in the upstream parts of the Bay B North and C compared to downstream segment B South in the later part of the study. This is quite a different pattern to that observed in 2000–2002, when dolphinsregularly occured in the more downstream sections of the Bay and near coastal waters and no significant difference in encounter rates between B South and B North were observed. This change in dolphin occurrence in outer and lower Bay segments between 2000–2001 and 2008–2015 was concomitant with an observed 4–6 fold increase in large-sized vessel traffic in the lower Bay area. The resulting increase in underwater noise may have contributed to the reduced use of this area by Irrawaddy dolphins who are known, like many other species dolphins, to be very sensitive to underwater noise and tend to avoid loud noise as it mask foraging and socializing activities (Richardson et al., 1995; Kreb and Rahadi, 2004; Tyack, 2008). For example, harbor porpoises (Phocoenaphocoena) were observed to leave their habitat in reponse to pulsed sounds even at very low received levels, well below 120 dB (Bain and Williams, 2006) and belugas (Delphinapterus leucas) were displaced from near coastal foraging areas that were subject to noise over 130 dB (Miller et al., 2005). Although there are no audiograms for Irrawaddy dolphins they have comparable ear morphology to bottlenose dolphins that have been shown to be sensitive to single digit kHz frequencies (1–12.8 kHz) (Ketten, 1991), Irrawaddy dolphins in Balikpapan Bay vocalize within this range so therefore are likely impacted (Kreb, 2004). Kuit et al. (2019) reported that Irrawaddy dolphins in Matang, Malaysia, displayed a relatively homogeneous distribution in the study area but were not observed to swim in rivers with heavy boat traffic. Veirs and Wood (2016) who studied different types of ship noise in critical southern resident killer whale (Orca orcinus) habitat, in Canada and the United States, stated that that median received levels of ship noise were elevated above median background levels not only at low frequencies (20–30 dB from 100 to 1,000 Hz), but also at high frequencies (5–13 dB from 10,000 to 40,000 Hz). They further stated that such ship noise has the potential to mask odontocete signals and interfere with communication (vocalizations) but also foraging and navigation (echolocation click), especially in coastal environments where shipping lanes are close enough to the shoreline (<10 km) that high frequency sound is not fully absorbed.
Individual encounter rates were highest in segment C compared to other segments during all survey years except for 2015 when sightings and individuals encountered per km transect in segment C significantly decreased in 2015 compared to all previous years. A possible explanation may be the (unmitigated) piling activity that had been underway since 2014 at the border in between segments B North and C. The underwater noise generated by the piling activity may have displaced the dolphins’ from the area and prevented their daily travel to the upper Bay segment. In 2010, piling activities would only start when dolphins were outside 500 m, whereas in 2015, no mitigation protocol was in place. Although it remains uncertain if piling was the main factor that altered the dolphins habitat use, it does seem likely as the area is narrow and is a bottleneck through which the dolphins have to pass to go from one part of the Bay to another. It is possible that if piling is ongoing in this sensitive area, with no allowance for dolphins to pass through, dolphins would be prevented from entering the area. In 2010, piling and construction work did result in a significant increase in the distance between the piling area and the dolphins. According to the Joint Nature Conservation Committee (JNCC, 2010), the installation of driven piles in the marine environment without mitigation is likely to produce noise levels capable of causing injury and disturbance to marine mammals. David (2006) also concluded that pile driver-generated noise has the potential to affect dolphin populations adversely as it is detectable up to 40 km from the source. At 9 kHz, this noise is capable of masking strong vocalizations within 10–15 km and weak vocalizations up to approximately 40 km. In enclosed habitats such as Balikpapan Bay, the dolphins cannot evade underwater noise that has the potential to impact the entire area.
There are serious concerns for the recent plans to move Indonesia’s capital city to the area north of the Bay (segment C), in terms of increased shipping traffic and harbor construction in the upper Bay segments (B North and C) that represent primary dolphin habitat. The lack of prevailing regulations to include marine mammal mitigation processes as a requirement during piling, and other, activities and the further planned expansion of the Kariangau industrial area in segment B North, represents further serious causes of concern.
Impacts of Coastal Development
According to Prayoga et al. (2019), the total mangrove area in Balikpapan Bay based on satellite images in 1995 was 17.620 ha, while in 2006 only 16.706 ha remained, a loss of 914 ha. From 2013 onwards mangrove cover gained slightly until 2015 and remained stable until 2018 at c. 16.831 ha. In addition, according to the strategic development of Balikpapan City environs 2012 and 2032, more mangrove may be lost to further expansion of industry in the upper Bay area (B North). Additionally, plans to make a new capital city for Indonesia North of the Bay, may lead to further mangrove loss for infrastructure purposes in segments (B North and C). Data from Working Group for Erosion and Sedimenatation (2002) revealed that the total amount of sediment of the four rivers into the Bay was 1,103,395 ton/year. No recent data on sedimentation rate is available.
The mangroves loss due to industrial expansion may cause further sedimentation with negative impacts on dolphin prey resources and local fisheries. The high sedimentation rate in the Bay in 2002 resulted from the conversion of many mangroves for shrimp farming. These farms were abandoned mostly after 2008 due to a combination of various factors, including decreasing water quality, increasing maintenance costs, shrimp diseases, and increased attention and surveillance by the conservation community. The low clarity measured in all sampling years 2012–2015 may be caused by increased sedimentation from erosion along the shores because there are several shores of which the original mangrove vegetation has been completely removed and filled with barren soil in the process of coastal reclamation (Supplementary Figure S1). Elevated levels of sediment may be harmful to fish (i.e., acutely lethal, or elicit sub-lethal responses that could compromise their well-being and jeopardize survival), and in addition, negatively impact on their habitat (DFO, 2000) including sea grass that supports fisheries production (Richard et al., 2018) and represents important dugong grazing habitat.
Pollution
Water quality data collected by the Center for Controlling Ecoregional Development of Kalimantan (PPEK, 2015) in Balikpapan from 12 sampling stations (2012–2015) indicated that in 2015 there has been a very high concentration of phenol inside the Bay, over 200 times exceding the standard level. Phenol levels exceeded slightly in 2013 and 2014 as well for some stations, but not to the extent as in 2015. Additionally, in 2015 copper was exceeding slightly the limit while cadmium and lead exceeded limits between 3 and 6 times between 2012 and 2014. Furthermore, clartity in all years was much less than the standard level. Data from the rivermouths in 2016 indicated high ammoniacal nitrogen, nitrate as nitrogen and low dissolved oxygen levels (Hardansyah et al., 2016).
The high concentration of phenol detected inside the Bay in 2015 may indicate a spill of fuel from boats or dumping of industrial oil waste. Phenol is a chemical compound, which has poisonous characteristics, is corrosive towards skin (causing irritation) and may cause health problems in (marine) mammals and death in certain marine organisms, which are sensitive to high concentrations (Bruce et al., 1987). The presence of high heavy metal concentrations of lead found between 2012 and 2014 could be derived from herbicides or fungicides from used in large-scale plantations (palm oil along the shores and acacia in upper watersheds) or from anti-fouling paint for ships, which is also considered a potential source of metal accumulation in cultured fish, and which have been associated to lethal or sub-lethal effects and the immediate immune defense mechanism of the exposed fish (Nikolaou et al., 2014). Lead accumulation in the body system of any organism may cause damage to intestines, liver and kidneys and even death (Wani et al., 2015). High concentration of cadmium could be derived from soil erosion process, decomposition of bottom rock-substrate, or as industrial waste product discarded into the Bay (Ashraf et al., 2014). At low concentrations it is toxic to all life, including plants, fish, birds, mammals (including humans), and microorganisms and causes cancer, birth defects and genetic mutations (Eisler, 1985; Jia et al., 2010). Because of the diurnal tidal pattern in Balikpapan Bay and its geophysical shape with deeper areas inside the Bay these (an)organic chemical substances may stay for longer periods in the Bay and its ecosystem and may indeed have already impacted on marine organisms. However, no analysis has been done in Balikpapan Bay to investigate if marine organisms have accumulated heavy metals in their body system.
An indication that the habitat of the Irrawaddy dolphins in Balikpapan Bay has degraded in time maybe deduced from the fact that an increasing number of individuals (5–6 times more) had cutaneous nodules in 2015 compared to earlier years 2008 and 2011. In addition, nodules were observed to persist for at least one individual of the two individuals with nodules in 2008 that was resighted in 2015. Another indication of the increasing trend of this threat is that for ten individuals with nodules in 2015, which were also sighted in earlier years, no nodules were observed then in these individuals. Further studies are recommended to see if these nodules that are detected or were absent in particular individuals may appear, increase or disappear over the years. According to Van Bressem et al. (2014), these nodules may occur in populations of dolphins, which are sensitive to industrial activities and the pollution from large-scale monoculture plantations, CPO and oil amongst others. The prevalence of nodules in Irrawaddy dolphins in Balikpapan Bay for years 2008 and 2011 were in between the prevalence percentages within the Malaysian Bintulu-Similajau (2.2%) and Kucing (6.5%) Irrawaddy dolphin populations. On the other hand, the prevalence of nodules for 2015 (25%) in the Balikpapan Bay population was nearly twice as high as those recorded in Chilka Lake (13.9%) that represented the highest percentage among the other Irrawaddy dolphin populations studied.
Finally, the high number of stranding cases in 2016 and 2018 may be related to the extreme high phenol levels found at 12 different sampling locations in the Bay in 2015 and a large-scale oil spill that occurred in April 2018, which may have affected animals’ health. However, no tissue samples have been analyzed due to the advanced decomposition state and due to bureaucratic reasons. Although the impacts of oil spills have been documented for a range of marine animal species including zooplankton, shellfish, fish, sea birds, evidence of impacts on non-furred individual marine mammals is limited (Heubeck et al., 2003; Barron et al., 2005; Jiang et al., 2010). Nevertheless, the inhalation of concentrated petroleum vapors can cause the inflammation of and damage to the mucus membranes of airways, lung congestion or even pneumonia and may also cause neurological disorders and liver damage (Neff, 1988). Therefore, the health of the dolphins that were observed at locations where the oil concentrations on the surface exceeded the national quality standard, may have been affected.
Unsustainable Fisheries
Interviews with 22 senior fishermen in Balikpapan Bay indicated that 40% of the fishermen attributed fish declines as a result of unsustainable fisheries by other fishermen. In Balikpapan Bay and near coast, at least seven different fishing gears can be distinguished all of which more or less traditional. Trawling, trammel net, and lift nets were perceived as a threat by fishermen as it causes overfishing. Although trawls and seine nets are illegal in Indonesia (No. 2/PERMEN-KP/2015), some illegal trawling still occurs. All fishermen respondents indicated the lack of law enforcement to stop illegal fishing. Gillnets and lift nets are considered unsustainable because of their fine mesh sizes, which also catch small fishes that may cause a decrease in regeneration of some fish species. The legal mesh size for gillnets (including trammel nets) in Indonesia is ≥1.5 inch while for lift nets using boats a mesh size of only ≥1.5 mm is allowed and 1.5 inch for stationary lift nets. Overfishing, in particular by purse and beach seiners, but also by bottom trawlers and trammel boats has led to a severe decline of short-beaked common dolphins in the Mediterranean Sea and these dolphins are considered at a high risk of disappearance (Bearzi et al., 2008). Overfishing may also increase net predation by dolphins and thereby increasing the risk of entanglement (Snape et al., 2018). Moreover, 82% of odontocete species have been recorded as by-catch since 1990 of which 75% have been caught in gillnets (Reeves et al., 2013). Finally, 13 species of toothed whale are also struggling to cope with dwindling food supplies as a result of over-fishing (Culik, 2011).
Low Local Awareness
The occasionally reported by-catch and killing of dugongs necessitates the need to raise awareness about their protected and rare status. Residents along the entire shore- and coastline do not have a good waste collection and disposal system in place and disposal of garbage on the shores or in the Bay is still very common practice. The death of an Irrawaddy dolphin with diapers inside it stomach in 2011 is just one local example of the danger of plastic waste to cetaceans and other marine life of which seabirds and turtles have been well documented (Wilcox et al., 2018; Phillips and Waluda, 2020). Baulch and Perry (2014) reported that ingestion of debris has been documented in 48 (56% of) cetacean species, with rates of ingestion as high as 31% in some populations. In Balikpapan Bay, three known cases of dead dolphins that had stranded were set afloat again without reporting to authorities so the carcasses could not be retrieved nor cause of death established. Initial steps to increase awareness in Balikpapan Bay were done in 2009 by giving presentations on marine mammals and their habitat at both elementary and high schools as well as distributing posters with marine mammals that occur in East Kalimantan and their protected status to fishermen. In order to increase the sense of belonging, children from villages along the Bay’s shores during an additional awareness campaign assigned their names to each of the dolphins, since the dolphins could be individually identified. In the Mahakam River, habitat to a critically endangered population of Irrawaddy dolphins, an individual awareness raising approach was conducted in 2018 by a local NGO (affiliated with the first author) with floating rafts-households managed to alter trashing behavior. Ninety-six percent of 455 households interviewed and educated were willing to stop thrashing into the river after they were given an alternative to deal with their thrash. Two years later, 97 % of a sample of interview respondents (n = 86) did not resume thrashing in the river. An individual household-based solution approach thus seems promising for application elsewhere including in Balikpapan Bay.
Recommendations for Conservation Management
The results of this study indicate the low population size and the relatively high level of residency of this population. Their increasing dependence on smaller available portions of the Bay that are relatively undisturbed and their unsustainable mortality rate urges the necessity of conservation management. As a first step, the results of this study were shared with the provincial fisheries department in report form and GIS data and were integrated in East Kalimantan’s coastal spatial planning for 2020–2040 (RZWP3K). However, under the categories of the various habitat usages only migration routes for marine mammals are included. Although migration corridors may be suitable for some larger whale species, this concept does not adequately meet the habitat requirements of more or less resident near shore cetacean species, which use a habitat range to roam, feed, breed and socialize. Furthermore, based on the occurrence of one endangered (Irrawaddy dolphin) and two vulnerable species (Dugong and Indo-Pacific finless porpoise) in the Balikpapan Bay area, the area was acknowledged as an Important Marine Mammal Area (IMMA) by the IUCN Marine Mammal Protected Area Task Force. In the light of the importance of the inner Bay for Irrawaddy dolphins and dugongs, and of a predicted expansion of shipping and industrial activities in the inner parts of the Bay due to the plans to build Indonesia’s new capital city in the area North of the Bay, timely action is required for better conservation, monitoring and management measures. We therefore recommend the following actions:
(1) The government should implement a multiple usage zonation planning to define functional areas for fisheries, mangrove protection, tourism/recreation, wildlife and environmentally sustainably economic zones. We also recommend that both the inner parts (B-North and C segments) may obtain a protection status for marine mammals allowing only artisanal fishing activities while excluding large ship traffic in these segments and avoiding building new ports here. In terms of ecotourism, these upstream segments of the Bay offer a high potential for a responsible and controlled form of dolphin watching using instructed and responsible boats drivers and other wildlife sightseeing in the rivers of easily observable animals such as proboscis monkeys, long-tailed macaques and various birds including eagles, hornbills, storks and several species of egrets.
(2) We recommend that local NGOs and universities should more often perform outreach and education campaigns at schools in the villages and city of Balikpapan on implementation of Reduce, Recycle and Reuse practices of plastics. It is also recommended that a local school curriculum will be developed related to environmental issues in the Bay, its wildlife and mangrove value.
(3) A better collaboration among government agencies in charge of protected species under the Ministry of Environment and Forestry and the Ministry of Fisheries, the local first responder network, and labs/universities is recommended to make sure that necropsies, sample collection and analyses may be done without much bureaucracy of the permit authorization process. Two stranding workshops were already convened in Balikpapan 2013 and 2016 with local authorities, NGOs, student organizations and village representatives how to safely rescue dolphins during strandings and how to collect samples and make a documentation if the dolphins stranded dead. It is recommended that stranding trainings are repeated in the southwest part of the Bay for fast action response.
(4) We recommend to continue a broad-spectrum study of marine mammals in Balikpapan Bay and nearby coastal areas to understand long-term, local distribution patterns, trends in abundance and genetics. This may be done by establishing a collaboration network of local universities from different faculties and disciplines, environmental NGOs and government agencies. Training in cetacean monitoring and raising local capacity of future researchers will be an important component. Further photo-identification studies planned on Irrawaddy dolphins in the nearest Adang Bay, c. 120 km South from Balikpapan and dolphins from the Mahakam delta, c.120 km North of Balikpapan, may shed more light on whether there is some seasonal migration or whether the Balikpapan Bay population represent a truly isolated population. Coastal surveys conducted in 2000–2001 indicated that there was a lack of sighting records of Irrawaddy dolphins between the Mahakam delta and Balikpapan Bay indicating more discrete poulations (Kreb and Budiono, 2005). Finally, by-catch studies to identify the extent of this problem may also help to reduce by-catch related mortality.
(5) Water quality monitoring should also be continued by the environmental government agency every year in several seasons. The detected presence of phenol and heavy metals traces inside the Bay should get serious attention from the government because they can be easily absorbed and bio-accumulated by organisms and inside the foodchain. To reduce the presence of heavy metals besides investigating and halting the cause, remediation of mangrove soil in the exposed area should be conducted.
(6) Patrol and enforcement should be more frequent to prevent illegal trawling and seine fishing activity while the fisheries service should socialize with fishers to not leave gillnets unattended. Workshops on safe release methods of dolphins that have been entangled alive in gillnets are recommended to be implemented by the fisheries service and NGOs.
(7) For the entire Bay we recommend that the government halts any further conversion of mangrove while barren soil along the shores in some sections should be replanted with vegetation to avoid sedimentation, which is negatively impacting on fish resources and seagrass beds, thus on marine mammals and fisher livelihoods.
(8) Regulations at provincial or national level are needed to make sure marine mammal observers are a requirement and standard operational procedure for industries, which conduct activities (i.e., seismic survey, percussive piling) that are causing underwater noise, and which may cause harm to marine mammals in the area.
Data Availability Statement
The datasets generated for this study are available on request to the corresponding author.
Ethics Statement
Ethical review and approval was not required nationally for the animal study. However, the research involved non-invasive boat-based observation studies of wild roaming dolphins using methods that were based on the Amsterdam Subjects Protocol Standards. In addition, the methods and research proposal at several stages of the long-term study (15 years) was reviewed and obtained approval from the Indonesian Institute of Sciences, The Laboratory of Hydro-oceanography of the Fisheries Faculty of Mulawarman University and the local NGO Yayasan Konservasi RASI. Ethical review and approval was not required for the study on human participants in accordance with the local legislation and institutional requirements. However, the verbal consent procedure and questions were all in line with local cultural customs. The methods and research proposal at several stages of the long-term study (15 years) was reviewed and obtained approval from the Indonesian Institute of Sciences, The Laboratory of Hydro-oceanography of the Fisheries Faculty of Mulawarman University and the local NGO Yayasan Konservasi RASI.
Author Contributions
DK conceived the fieldwork design. DK, SL, and IS collected the data. DK, AR, and IS conducted the photo-identification analyses, while DK performed and LP reviewed the abundance and mark-recapture analyses. ML produced the GIS maps. DK prepared the initial draft while SL and LP equally contributed critically to the final content of the manuscript. All the authors gave final approval for publication.
Funding
The project was funded during the multiple years study by the Coastal Resources Management Program/Proyek Pesisir, Ocean Park Conservation Foundation (2000–2001), The Whale and Dolphin Conservation Society (2008), East Kalimantan Provincial Fisheries (2011), The Faculty of Agrobiology, Food and Natural Resources, Czech University of Life Sciences Prague (2015), BPSPL Pontianak (2018). GIS mapping was supported by the IT4Innovations National Supercomputing Center-LM2015070, Czechia.
Conflict of Interest
The authors declare that the research was conducted in the absence of any commercial or financial relationships that could be construed as a potential conflict of interest.
Acknowledgments
Field surveys were conducted by Abdi, Ahang, Alexa Maheswari, Amar, Andi, Awaludin Sopri, Bestifitraini, Budiono, DK, Firman Abadi, IS, Joe Samuel Arnesto Simamora, Karen Damayanti, Maulana Malik, Nur Leli, Syachraini, Pim van Schendel, Rhaudatul Jannah Kreb, Rudi, SL, Yakhsyallah, and Ika Widya. We are grateful for the support of all field observers and thank our boat drivers Pak Ronding, Pak Baroci, and Pak Darman. We also thank Pak Darman and family for their warm hospitality in Gersik. Final thanks to the Center for Controlling Ecoregional Development of Kalimantan (PPEK), Hamsuri, Hery Seputro, Ivan Yusfi Noor, and Karnila Willard for water quality reports and maps. The research was conducted as part of a Ph.D. study (Faculty of Science, University of Amsterdam) of the DK (2000–2002) under Indonesian Institute of Sciences (LIPI) permit, while from 2008 onwards research was executed on behalf of Yayaysan Konservasi RASI. Fieldwork was complying with Indonesian laws and permit authorization.
Supplementary Material
The Supplementary Material for this article can be found online at: https://www.frontiersin.org/articles/10.3389/fmars.2020.533197/full#supplementary-material
FIGURE S1 | Satellite images showing the mangrove conversion on the right shores of the bay for expansion of Kariangau industrial areas over the years (left-2001; right-2015).
TABLE S1 | Questioner with fishermen in Balikpapan Bay (translation from bahasa Indonesia).
References
Ashraf, A., Maah, M. J., and Yusoff, I. (2014). “Soil Contamination, Risk Assessment and Remediation,” in Environmental Risk Assessment of Soil Contaminatio. ed. M. C. H. Hernandez-Soriano (London, UK: IntechOpen)
Bain, D. E., and Williams, R. (2006). Long-range effects of airgun noise on marine mammals: responses as a function of received sound level and distance. Switzerland: IWC.
Barron, M. G., Carls, M. G., Short, J. W., Rice, S. D., Heintz, R. A., Rau, M., et al. (2005). Assessment of the Phototoxicity of Weathered Alaska North Slope Crude Oil to Juvenile Pink Salmon. Chemosphere 60, 105–110. doi: 10.1016/j.chemosphere.2004.12.006
Baulch, S., and Perry, C. (2014). Evaluating the impacts of marine debris on cetaceans. Mar. Pollut. Bull. 80, 210–221. doi: 10.1016/j.marpolbul.2013.12.050
Bearzi, G., Agazzi, S., Gonzalvo, J., Costa, M., Bonizzoni, S., Politi, E., et al. (2008). Overfishing and the disappearance of short-beaked common dolphins from western Greece. Endanger. Species Res. 5, 1–12. doi: 10.3354/esr00103
Beasley, I., Robertson, K. M., and Arnold, P. (2005). Description of a new dolphin, the Australian snubfin dolphin Orcaella heinsohni sp N. (Cetacea, Delphinidae). Mar. Mamm. Sci. 21, 365–400. doi: 10.1111/j.1748-7692.2005.tb01239.x
Bruce, R. M., Santodonato, J., and Neal, M. W. (1987). Summary review of the health effects associated with phenol. Toxicol. Ind. Health 3, 535–568. doi: 10.1177/074823378700300407
Buckland, S., Anderson, D., Burnham, K., and Laake, J. (1993). Distance Sampling: Estimating Abundance of Biological Populations. Biometrics 50, 891–892. doi: 10.2307/2532812
Chapman, J. M., Proulx, C. L., Veilleux, M. A. N., Levert, C., Bliss, S., Andre, M. E., et al. (2014). Clear as mud: a metaanalysis on the effects of sedimentation on freshwater fish and the effectiveness of sediment-control measures. Water Res. 56, 190–202. doi: 10.1016/j.watres.2014.02.047
Clements, G. R., Lynam, A. J., Gaveau, D., Yap, W. L., Lhota, S., Goosim, M., et al. (2014). Where and how are roads endangering mammals in Southeast Asia’s forests? PLoS One 9:e115376. doi: 10.1371/journal.pone.0115376
Cooch, E., and White, G. (2008). Program MARK: A gentle introduction. Colorado: Colorado State University.
Culik, B. M. (2011). Odontocetes - The toothed whales. CMS Technical Series 24. Germany: UNEP/CMS Secretariat.
David, J. A. (2006). Likely sensitivity of bottlenose dolphins to pile-driving noise. Water Environ. J. 20, 48–54. doi: 10.1111/j.1747-6593.2005.00023
Dawson, S., Wade, P., Slooten, E., and Barlow, J. (2008). Design and field methods for sighting surveys of cetaceans in coastal and riverine habitats. Mammal Rev. 38, 19–49. doi: 10.1111/j.1365-2907.2008.00119.x
DFO (2000). Effects of sediment on fish and their habitat. DFO Pacific Region Habitat Status Report 2000/01. Australia: DFO.
Dick, D. M., and Hines, E. M. (2011). Development and implementation of distance sampling techniques to determine bottlenose dolphin (Tursiops truncatus) abundance at Turneffe Atoll. Belize. Mar. Mammal Sci. 27, 606–621. doi: 10.1111/j.1748-7692.2010.00435.x
Eisler, R. (1985). Cadmium Hazards To Fish, Wildlife, And Invertebrates: A Synoptic Review. Contaminant Hazard Reviews Report No. 2Biological Report 85 (1.2). Washington, D.C: U.S. Fish and Wildlife Service.
Hance, J. (2010). Bridge development in Kalimantan threatens rainforest, mangroves, and coralreef. MongaBay.com / A Place Out of Time: Tropical Rainforests and the Perils They Face. Available online at: https://news.mongaBay.com/2010/01/bridge-development-in-kalimantan- threatens- rainforest-mangroves-and-coral-reef (accessed January 3, 2010).
Hardansyah, R., Priyanto, A., Prasetiaty, A., Hutapea, M. C. L., Duhita, B., and Irfaddien, R. (2016). Carrying capacity of ecosystem services to sustain recreation and ecotourism in Teluk Balikpapan. Final Report issued by the Center for Controlling Ecoregional Development of Kalimantan. Ministry of Environment and Forestry. [Original report in Indonesian language: Daya Dukung Jasa Ekosistem Budaya Rekreasi dan Ekowisata Teluk Balikpapan. Laporan Akhir. Pusat Pengendalian Pembangungan Ecoregional Kalimantan (PPPEK). Kementerian Lingkungan Hidup dan Kehutanan, 2016]. Available online at: https://bit.ly/34yLHve
Heubeck, M., Camphuysen, K. C. J., Bao, R., Humple, D., Rey, A. S., Cadiou, B., et al. (2003). Assessing the Impact of Major Oil Spills on Seabird Populations. Mar. Poll. Bull. 46, 900–902. doi: 10.1016/s0025-326x(03)00098-5
Hines, E. M., Strindberg, S., Junchumpoo, C., Ponnampalam, L. S., Ilangakoon, A. D., Jackson-Ricketts, J., et al. (2015). Line-transect estimates of Irrawaddy dolphin abundance along the eastern Gulf Coast of Thailand. Front. Mar. Sci. 2:63. doi: 10.3389/fmars.2015.00063
IWC (2017). Annex M. Report of the sub-committee on small cetaceans. J. Cetacean Res. Manag. 18, 340–386.
Jefferson, T. A., Hung, S. K., and Würsig, B. (2009). Protecting small cetaceans from coastal development: Impact assessment and mitigation experience in Hong Kong. Mar. Policy 33, 305–311. doi: 10.1016/j.marpol.2008.07.011
T. A. Jefferson and B. D. Smith (eds.). (2002). Facultative Freshwater Cetaceans of Asia: Their Ecology and Conservation. The Raffles Bulletin, Supplement 10.
Jia, X., Zhang, H., and Liu, X. (2010). Low levels of cadmium exposure induce DNA damage and oxidative stress in the liver of Oujiang colored common carp Cyprinus carpio var. color. Fish Physiol. Biochem. 37, 97-103.
Jiang, Z., Huang, Y., Xu, X., Liao, Y., Shou, L., Liu, J., et al. (2010). Advance in the Toxic Effects of Petroleum Water Accommodated Fraction on Marine Plankton. Acta Ecologica Sinica 30, 8–15. doi: 10.1016/j.chnaes.2009.12.002
Jolly, G. M. (1965). Explicit estimates from capture-recapture data with both death and immigration—stochastic model. Biometrika 52, 225–247. doi: 10.2307/2333826
JNCC (2010). Handbook for Phase 1 Habitat Survey — A Technique for Environmental Audit. Peterborough: JNCC.
Ketten, D. R. (1991). “The marine mammal ear: specializations for aquatic audition and echolocation,” in The Biology of Hearing, eds D. Webster, R. Fay, and A. Popper (Berlin: Springer Verlag), 717–750.
Khalifa, M. A., Kamal, M. M., Adiwilaga, E. M., and Sunuddin, A. (2014). Preliminary Study on the Distribution of Irrawaddy Dolphin, Orcaella brevirostris, in Banten Bay. Open J. Mar. Sci. 4, 338–343. doi: 10.4236/ojms.2014.44030
Kjelland, M. E., Woodley, C. M., Swannack, T. M., and Smith, D. L. (2015). A review of the potential effects of suspended sediment on fishes: potential dredging-related physiological, behavioral, and transgenerational implications. Environ. Syst. Decis. 35, 334–350. doi: 10.1007/s10669-015-9557-2
Kreb, D. (2004). Facultative river dophins: Conservation and social ecology of freshwater and coastal Irrawaddy dolphins in Indonesia. Ph.D. thesis The Netherlands: University of Amsterdam.
Kreb, D. (2005). Abundance of freshwater Irrawaddy dolphins in the Mahakam in East Kalimantan, Indonesia, based on mark-recapture analysis of photo-identified individuals. J. Cetacean Res. Manag. 6, 269–277.
Kreb, D., and Budiono. (2005). Cetacean Diversity and Habitat Preferences in Tropical Waters of East Kalimantan. Indonesia. Raffles Bull. Zoology 53, 149–155.
Kreb, D., Mustika, P. L., Kahn, B., Yanuar, A., and Acebes, J. M. (2015). “SEAMAM III Report-Indonesia 36-49,” in Report of the Third Southeast Asian Marine Mammal Symposium (SEAMAM III). 2015. UNEP / CMS Secretariat, Bonn, Germany. 643 pages. CMS Technical Series No. 32. eds E. Hines, L. S. Ponnampalam, F. I. J. Hisne, T. S. Whitty, J. Jackson-Ricketts, and S. H. Kuit (Germany: UNEP / CMS Secretariat).
Kreb, D., and Rahadi, K. D. (2004). Living under an aquatic freeway: effects of boats on Irrawaddy dolphins (Orcaella brevirostris) in a coastal and riverine environment in Indonesia. Aqua. Mammals 30, 363–375. doi: 10.1578/am.30.3.2004.363
Kuit, S. H., Ponnampalam, L. S., Ng, J. E., Chong, V. C., and Then, A. Y. (2019). Distribution and habitat characteristics of three sympatric species in the coastal water of Matang, Perak, Peninsular Malaysia. Aquatic Conserv: Mar. Freshw. Ecosyst. 29, 1681–1696. doi: 10.1002/aqc.3121
Miller, G. W., Moulton, V. D., Davis, R. A., Holst, M., Millman, P., MacGillivray, A., et al. (2005). “Monitoring seismic effects on marine mammals—southeastern Beaufort Sea,” in Offshore oil and gas development effects monitoring/approaches and technologies eds S.L. Armsworthy, P.J. Cranford, and K. Lee (Columbus: Battelle Press).
Minton, G., Peter, C., Poh, A. N. Z., Ngelan, J., Braulik, G., and Tuen, A. A. (2013). Population estimates and distribution of Irrawaddy dolphins (Orcaella brevirostris) and Indo-Pacific Finless Porpoises (Neophocaena phocaenoides) in The Kuching Bay. Sarawak. Raffles Bull. Zoology 61, 877–888.
Neff, J. M. (1988). “Composition and Fate of Petroleum and Spill-treating Agents in the Marine Environment,” in Synthesis of Effect of Oil on Marine Mammals, eds J. R. Geraci and D. J. St. Aubin (Canada: Minerals Management Service).
Nikolaou, M., Neofitou, N., Skordas, K., Castritsi-Catharios, I., and Tziantziou, L. (2014). Fish farming and anti-fouling paints: a potential source of Cu and Zn in farmed fish. Aquac. Environ. Interact. 5, 163–171. doi: 10.3354/aei00101
Otis, D. L., Burnham, K. P., White, G. C., and Anderson, D. R. (1978). Statistical inference from capture data on closed animal populations. Wildlife Monographs. 62, 3-135.
Phillips, R. A., and Waluda, C. M. (2020). Albatrosses and petrels at South Georgia as sentinels of marine debris input from vessels in the southwest Atlantic Ocean. Envir. Internat. 136:105443 doi: 10.1016/j.envint.2019.105443
Pine, M. K., Wang, K., and Wang, D. (2017). Fine-scale habitat use in Indo-Pacific humpback dolphins, Sousa chinensis, may be more influenced by fish rather than vessels in the Pearl River Estuary, China. Marine Mammal Science 33, 291–312. doi: 10.1111/mms.12366
PPEK (2015). Report for Seawater Quality Monitoring. Issued by the Center for Controlling Ecoregional Development of Kalimantan. Ministry of Environment and Forestry. [Original report in Indonesian language: Laporan Pemantauan Kualitas Air Laut. Wilayah perairan Balikpapan, Kotabaru, dan Mempawah. Pusat Pengendalian Pembangungan Ecoregional Kalimantan (PPPEK). Kementerian Lingkungan Hidup dan Kehutanan]. Available online at: https://bit.ly/34yLHve (accessed Augest 26, 2020).
Prayoga, A. P., Rahman, O. A., Purba, C. B., and Nanggara, S. G. (2019). Status and strategy to protect mangrove ecosystems in Indonesia. Case study: Mangrove ecosystem in Balikpapan Bay East Kalimantan. [Original report in Indonesian language: Status dan strategi penyelamatan ekosistem mangrove Indonesia. Studi Kasus: Ekosistem Mangrove di Teluk Balikpapan Kalimantan Timur]. Bogor: Forest Watch Indonesia.
Reeves, R. R., McClellan, K., and Werner, T. B. (2013). Marine mammal by-catch in gillnet and other entangling net fisheries, 1990 to 2011. Endangered Spec. Res. 20, 71–97. doi: 10.3354/esr00481
Reeves, R. R., Smith, B. D., Crespo, E. A., and di Sciara, G. (2003). Dolphins, whales and bporpoises: 2002-2010 conservation action plan for the world’s cetaceans. IUCN/SCC Cetacean Specialist Group. Cambridge, UK: IUCN.
Richard, K. F., Unsworth, Nordlund, L. M., and Cullen-Unsworth, L. C. (2018). Seagrass meadows support global fisheries production. Conservat. Lett. 2018:e12566. doi: 10.1111/conl.12566
Richardson, W. J., Greene, C. R. Jr., Malme, C. I., and Thomson, D. H. (1995). Marine mammals and noise. San Diego, CA: Academic Press.
Rudolph, P., Smeenk, C., and Leatherwood, S. (1997). Preliminary checklist of cetacea in the Indonesian Archipelago and adjacent waters. Zoologische Verhandelingen 312. Leiden: Nationaal naturhistorisch Museum.
Seber, G. A. F. (1965). A note on the multiple recapture census. Biometrika, 52, 249–259. doi: 10.2307/2333827
Scheidat, M., and Porter, L. (2019). “Chapter 2: Monitoring marine mammals,” in Wildlife and Wind Farms, Conflicts and Solutions, Vol. 4, Offshore: Monitoring and Mitigation, ed. M. R. Perrow (Pelagic Publishing Ltd).
Shane, S. H. (1990). “Behavior and ecology of the bottlenose dolphin at Sanibel Island, Florida,” in The bottlenose dolphin, eds S. Leatherwood and R. R. Reeves (San Diego: Academic Press).
Smith, B. D., Beasley, I., Buccat, M., Calderon, V., Evina, R., De Valle, J. L., et al. (2004). Status, ecology and conservation of Irrawaddy dolphins (Orcaella brevirostris) in Malampaya Sound. Palawan Philippines. J. Cetacean Res. Manage. 6, 41–52.
Smith, B. D., Benazir, A., Mowgli, R. M., and Strindberg, S. (2008). Species occurrence and distributional ecology of nearshore cetaceans in the Bay of Bengal, Bangladesh, with abundance estimates for Irrawaddy dolphins Orcaella brevirostris and finless porpoises Neophocaena phocaenoides. J. Cetacean Res. Manage. 10, 45–58.
Snape, R. T. E., Broderick, A. C., Çiçek, B. A., Fuller, W. J., Tregenza, N., Witt, M. J., et al. (2018). Conflict between Dolphins and a Data-Scarce Fishery of the European Union. Hum Ecol 46, 423–433. doi: 10.1007/s10745-018-9989-7
Stacey, P. J., and Arnold, P. W. (1999). Orcaella brevirostris. Mammal. Spec. 616, 1–8. doi: 10.2307/3504387
Taylor, B. L. (1993). “Best” abundance estimates and best management: why they are not the same. New York, NY: Springer.
Taylor, B. L., Martinez, M., Gerrodette, T., and Barlow, J. (2007). Lessons from monitoring trends in abundance of marine mammals. Mar. Mammal Sci. 23, 157–175. doi: 10.1111/j.1748-7692.2006.00092.x
Taylor, B. L., Wade, P. R., DeMaster, D. P., and Barlow, J. (2000). Incorporating uncertainty into management models for marine mammals. Conservat. Biol. 14, 1243–1252. doi: 10.1046/j.1523-1739.2000.99409.x
Thomas, L., Buckland, S. T., Rexstad, E. A., Laake, J. L., Strindberg, S., Hedley, S. L., et al. (2010). Distance software: design and analysis of distance sampling surveys for estimating population size. J. Appl. Ecol. 47, 5–14. doi: 10.1111/j.1365-2664.2009.01737.x
Thomas, L., Williams, R., and Sandilands, D. (2007). Designing line transect surveys for complex survey regions. J Cetacean Res. Manag. 9, 1–13.
Tyack, P. L. (2008). Convergence of calls as animals form social bonds, active compensation for noisy communication channels, and the evolution of vocal learning in mammals. J. Comp. Psychol. 122, 319–331. doi: 10.1037/a0013087
Van Bressem, M. F., Minton, G., and Sutaria, D. Kelkar, N., Peter, C., and Zulkarnaen, M. (2014). Cutaneous nodules in Irrawaddy dolphins: an emerging disease in vulnerable populations. Dis. Aquat. Org. 107, 181–189. doi: 10.3354/dao02689
Veirs, S., Veirs, V., and Wood, J. D. (2016). Ship noise extends to frequencies used for echolocation by endangered killer whales. Peer J. 4:e1657. doi: 10.7717/peerj.1657
Wade, P. (1998). Calculating limits to the allowable human-caused mortality of cetaceans and pinnipeds. Mar. Mammal Sci. 14, 1–37. doi: 10.1111/j.1748-7692.1998.tb00688.x
Wani, A. L., Ara, A., and Usmani, J. A. (2015). Lead toxicity: a review. Interdiscip. Toxicol 8, 55-64. doi: 10.1515/intox-2015-0009
Wilcock, W. S. D., Stafford, K. M., Andrew, R. K., and Odom, R. I. (2014). Sounds in the ocean at 1–100 Hz. Annu. Rev. Mar. Sci. 6, 117–140. doi: 10.1146/annurev-marine-121211-172423
Wilcox, C., Puckridge, M., Schuyler, Q. A., Townsend, K., and Hardesty, B. D. (2018). A quantitative analysis linking sea turtle mortality and plastic debris ingestion. Sci. Rep. 8:12536. doi: 10.1038/s41598-018-30038-z
Wilson, B., Hammond, P. S., and Thompson, P. M. (1999). Estimating size and assessing trends in a coastal 955 bottlenose dolphin population. Ecol. Appl. 9, 288–300.
Wilson, B., Thompson, P., and Hammond, P. (1993). An examination of the social structure of a resident group of bottlenosed dolphins (Tursiops truncatus) in the Moray Firth, N.E. Scotland. Cambridge: European Cetacean Society.
Working Group for Erosion and Sedimenatation (2002). Analysis of erosion and sedimentation in the Balikpapan Bay watershed, East Kalimantan. Technical Report Proyek Pesisir, Jakarta. Spain: Working Group for Erosion and Sedimenatation
Yanuar, A. (2011). Irrawaddy dolphin Orcaella brevirostris in West Kalimantan: Population and distribution survey in Kubu Raya and Kayong Utara waters (2nd survey). Report for WWF Indonesia. http://awsassets.wwf.or.id/downloads/report_irrawady_dolphin_in_west_kalimantan.pdf (accessed Augest 26, 2020).
Keywords: Irrawaddy dolphin, abundance, distribution, photo-identification, conservation management, oil spill, Balikpapan Bay, Indonesia
Citation: Kreb D, Lhota S, Porter L, Redman A, Susanti I and Lazecky M (2020) Long-Term Population and Distribution Dynamics of an Endangered Irrawaddy Dolphin Population in Balikpapan Bay, Indonesia in Response to Coastal Development. Front. Mar. Sci. 7:533197. doi: 10.3389/fmars.2020.533197
Received: 07 February 2020; Accepted: 17 August 2020;
Published: 29 September 2020.
Edited by:
Ellen Hines, San Francisco State University, United StatesReviewed by:
Guido J. Parra, Flinders University, AustraliaLouisa Shobhini Ponnampalam, MareCet Research Organization, Malaysia
Copyright © 2020 Kreb, Lhota, Porter, Redman, Susanti and Lazecky. This is an open-access article distributed under the terms of the Creative Commons Attribution License (CC BY). The use, distribution or reproduction in other forums is permitted, provided the original author(s) and the copyright owner(s) are credited and that the original publication in this journal is cited, in accordance with accepted academic practice. No use, distribution or reproduction is permitted which does not comply with these terms.
*Correspondence: Danielle Kreb, yk.rasi@gmail.com; danielle.kreb1@gmail.com