Next Article in Journal
Disparities in Geographical Access to Hospitals in Portugal
Previous Article in Journal
Evaluating the Performance of Three Popular Web Mapping Libraries: A Case Study Using Argentina’s Life Quality Index
 
 
Erratum published on 1 March 2021, see ISPRS Int. J. Geo-Inf. 2021, 10(3), 120.
Article

Monitoring Wildfires in the Northeastern Peruvian Amazon Using Landsat-8 and Sentinel-2 Imagery in the GEE Platform

by
Elgar Barboza Castillo
1,*,
Efrain Y. Turpo Cayo
2,
Cláudia Maria de Almeida
3,
Rolando Salas López
1,
Nilton B. Rojas Briceño
1,
Jhonsy Omar Silva López
1,
Miguel Ángel Barrena Gurbillón
1,
Manuel Oliva
1 and
Raul Espinoza-Villar
2
1
Instituto de Investigación para el Desarrollo Sustentable de Ceja de Selva (INDES-CES), Universidad Nacional Toribio Rodríguez de Mendoza de Amazonas (UNTRM), Chachapoyas 01001, Peru
2
Programa de Doctorado en Recursos Hídricos (PDRH), Universidad Nacional Agraria La Molina, Ave. La Molina, S.N., Lima 15012, Peru
3
Instituto Nacional de Pesquisas Espaciais (INPE), Divisão de Sensoriamento Remoto (DSR), São José dos Campos-SP 12227-010, Brazil
*
Author to whom correspondence should be addressed.
ISPRS Int. J. Geo-Inf. 2020, 9(10), 564; https://doi.org/10.3390/ijgi9100564
Submission received: 26 August 2020 / Revised: 27 September 2020 / Accepted: 28 September 2020 / Published: 29 September 2020

Abstract

:
During the latest decades, the Amazon has experienced a great loss of vegetation cover, in many cases as a direct consequence of wildfires, which became a problem at local, national, and global scales, leading to economic, social, and environmental impacts. Hence, this study is committed to developing a routine for monitoring fires in the vegetation cover relying on recent multitemporal data (2017–2019) of Landsat-8 and Sentinel-2 imagery using the cloud-based Google Earth Engine (GEE) platform. In order to assess the burnt areas (BA), spectral indices were employed, such as the Normalized Burn Ratio (NBR), Normalized Burn Ratio 2 (NBR2), and Mid-Infrared Burn Index (MIRBI). All these indices were applied for BA assessment according to appropriate thresholds. Additionally, to reduce confusion between burnt areas and other land cover classes, further indices were used, like those considering the temporal differences between pre and post-fire conditions: differential Mid-Infrared Burn Index (dMIRBI), differential Normalized Burn Ratio (dNBR), differential Normalized Burn Ratio 2 (dNBR2), and differential Near-Infrared (dNIR). The calculated BA by Sentinel-2 was larger during the three-year investigation span (16.55, 78.50, and 67.19 km2) and of greater detail (detected small areas) than the BA extracted by Landsat-8 (16.39, 6.24, and 32.93 km2). The routine for monitoring wildfires presented in this work is based on a sequence of decision rules. This enables the detection and monitoring of burnt vegetation cover and has been originally applied to an experiment in the northeastern Peruvian Amazon. The results obtained by the two satellites imagery are compared in terms of accuracy metrics and level of detail (size of BA patches). The accuracy for Landsat-8 and Sentinel-2 in 2017, 2018, and 2019 varied from 82.7–91.4% to 94.5–98.5%, respectively.

1. Introduction

Wildfires have been a common phenomenon throughout time and are caused by ignition sources, either human or natural, and their interaction with climate factors that foster combustion and propagation [1,2]. Fires in vegetation cover generate negative impacts in most of the global biomes, like grasslands/savannahs (tropical and subtropical), forests (Mediterranean, temperate, boreal, and Amazonian), and agricultural fields [3,4]. Such fires may likewise negatively affect biodiversity, forest structure, and resilience to climate change [5,6]. The susceptibility to fires and their spatiotemporal distribution in the Amazon Forest are associated with extreme droughts caused by abnormal increases in sea surface temperature, like El Niño Southern Oscillation (ENSO), as well as the intensification of land use [7,8]. According to [9], land use intensification is broadly defined as activities undertaken with the intention of enhancing the productivity or profitability per unit area of rural land use, including the strengthening of particular land uses as well as changes between land uses. Remote sensing emerges as a feasible alternative for monitoring fires in the Amazon Forest, with its large extension of 5.5 million km2. Satellite images offer a synoptic view, systematic coverage, besides a speed-up and cost-effective acquisition [4].
In the early 2000s, the first global burnt areas (BA) data were released based on the National Oceanic and Atmospheric Administration Advanced Very High Resolution Radiometer (NOAA–AVHRR) imagery with a spatial resolution of 1000 m [10,11]. In recent years, however, several accessible and easily manageable BA products at a global scale were rendered available [12]. Among them, data from the low resolution sensors Medium Resolution Imaging Spectrometer (MERIS, 300 m) and Moderate Resolution Imaging Spectroradiometer (MODIS, 250–500 m) are worthy of notice [12]. Medium resolution and open access data [3,12] from Landsat-8 Operational Land Imager (OLI, 30 m) and Sentinel-2 Multi Spectral Instrument (MSI, 10 m) have been as well available for the detection of BA [13]. All these data can be processed in the cloud-based Google Earth Engine (GEE) platform, which allows the analysis and visualization of massive geospatial data at a large scale [14].
It is mandatory to obtain consistent compiled wildfires data over a large period of time in order to support studies for the detection of historical wildfires [4,15,16], their spatial pattern, and the evaluation of their social and environmental impacts [17,18]. These data are also useful to identify if the wildfires’ occurrence and impacts are related to drivers like climate change, relief, land cover and land use change, environmental policies and management [19,20]. Among the studies on burnt areas in the literature, the work of Chuvieco and Congalton [21] is to be cited, in which the authors carried out visual interpretation of Landsat Thematic Mapper (TM) images to map wildfires’ boundaries, which were then validated with the aid of a supervised maximum likelihood classification. Further studies also employed visual analysis of satellite imagery to delineate zones affected by fires [22,23]. More recently, visual analysis and parametric methods have given place to refined spectral indices and machine learning approaches [24,25,26,27,28,29,30].
Remotely sensed data processing is an essential requirement for generating sound spatial information, with scientific quality and appropriateness for monitoring wildfires in the medium and long-run at local, regional, and global scales. The greater availability of medium spatial resolution sensors enabled the development of several algorithms for extracting BA at local and regional levels [31,32,33]. In parallel to this, the spectral analysis of satellite imagery nowadays tends to use manifold spectral indices, which employ the visible range of the Electromagnetic Spectrum (VIS), as well as the Near-Infrared (NIR), the Short-Wave Infrared 1 (SWIR1), and the Short-Wave Infrared 2 (SWIR2) ranges to assess burnt areas and/or burn severity of wildfires [12,34,35]. Among those indices, we ought to mention the Normalized Burn Ratio (NBR) [36] and its difference in relation to the value obtained prior to the wildfire event (dNBR), which allows the evaluation of the BA extent and severity [37]. Other indices like the Mid-Infrared Burn Index (MIRBI) [38], the Normalized Burn Ratio 2 (NBR2) [39], and the Normalized Difference Vegetation Index (NDVI) [40] are able to provide fine scale and reliable annual BA estimates [12,34].
In this study, we focus on the Amazonas department, an administrative division that contains part of the Peruvian Amazon in northeastern Peru, where the wildfires occur very often during the dry season (from July to November) [41]. The greater part of these fires are caused by human beings [42], and, to a lesser extent, by natural ignition sources and their interaction with climate factors that favor combustion and propagation. Their extension and frequency are directly related to the temperature, humidity, wind, the type and characteristics of vegetation, relief, among other factors [2]. The locals use the fires to clean up the terrain and prepare the soil for planting [43]. Considering what was previously mentioned, the goal of this research is to develop a decision rules-based routine for monitoring wildfires employing Landsat-8 and Sentinel-2 imagery and using the cloud-based GEE platform. A comparison between the BA products derived from these two satellite imagery collections is also envisaged.

2. Materials and Methods
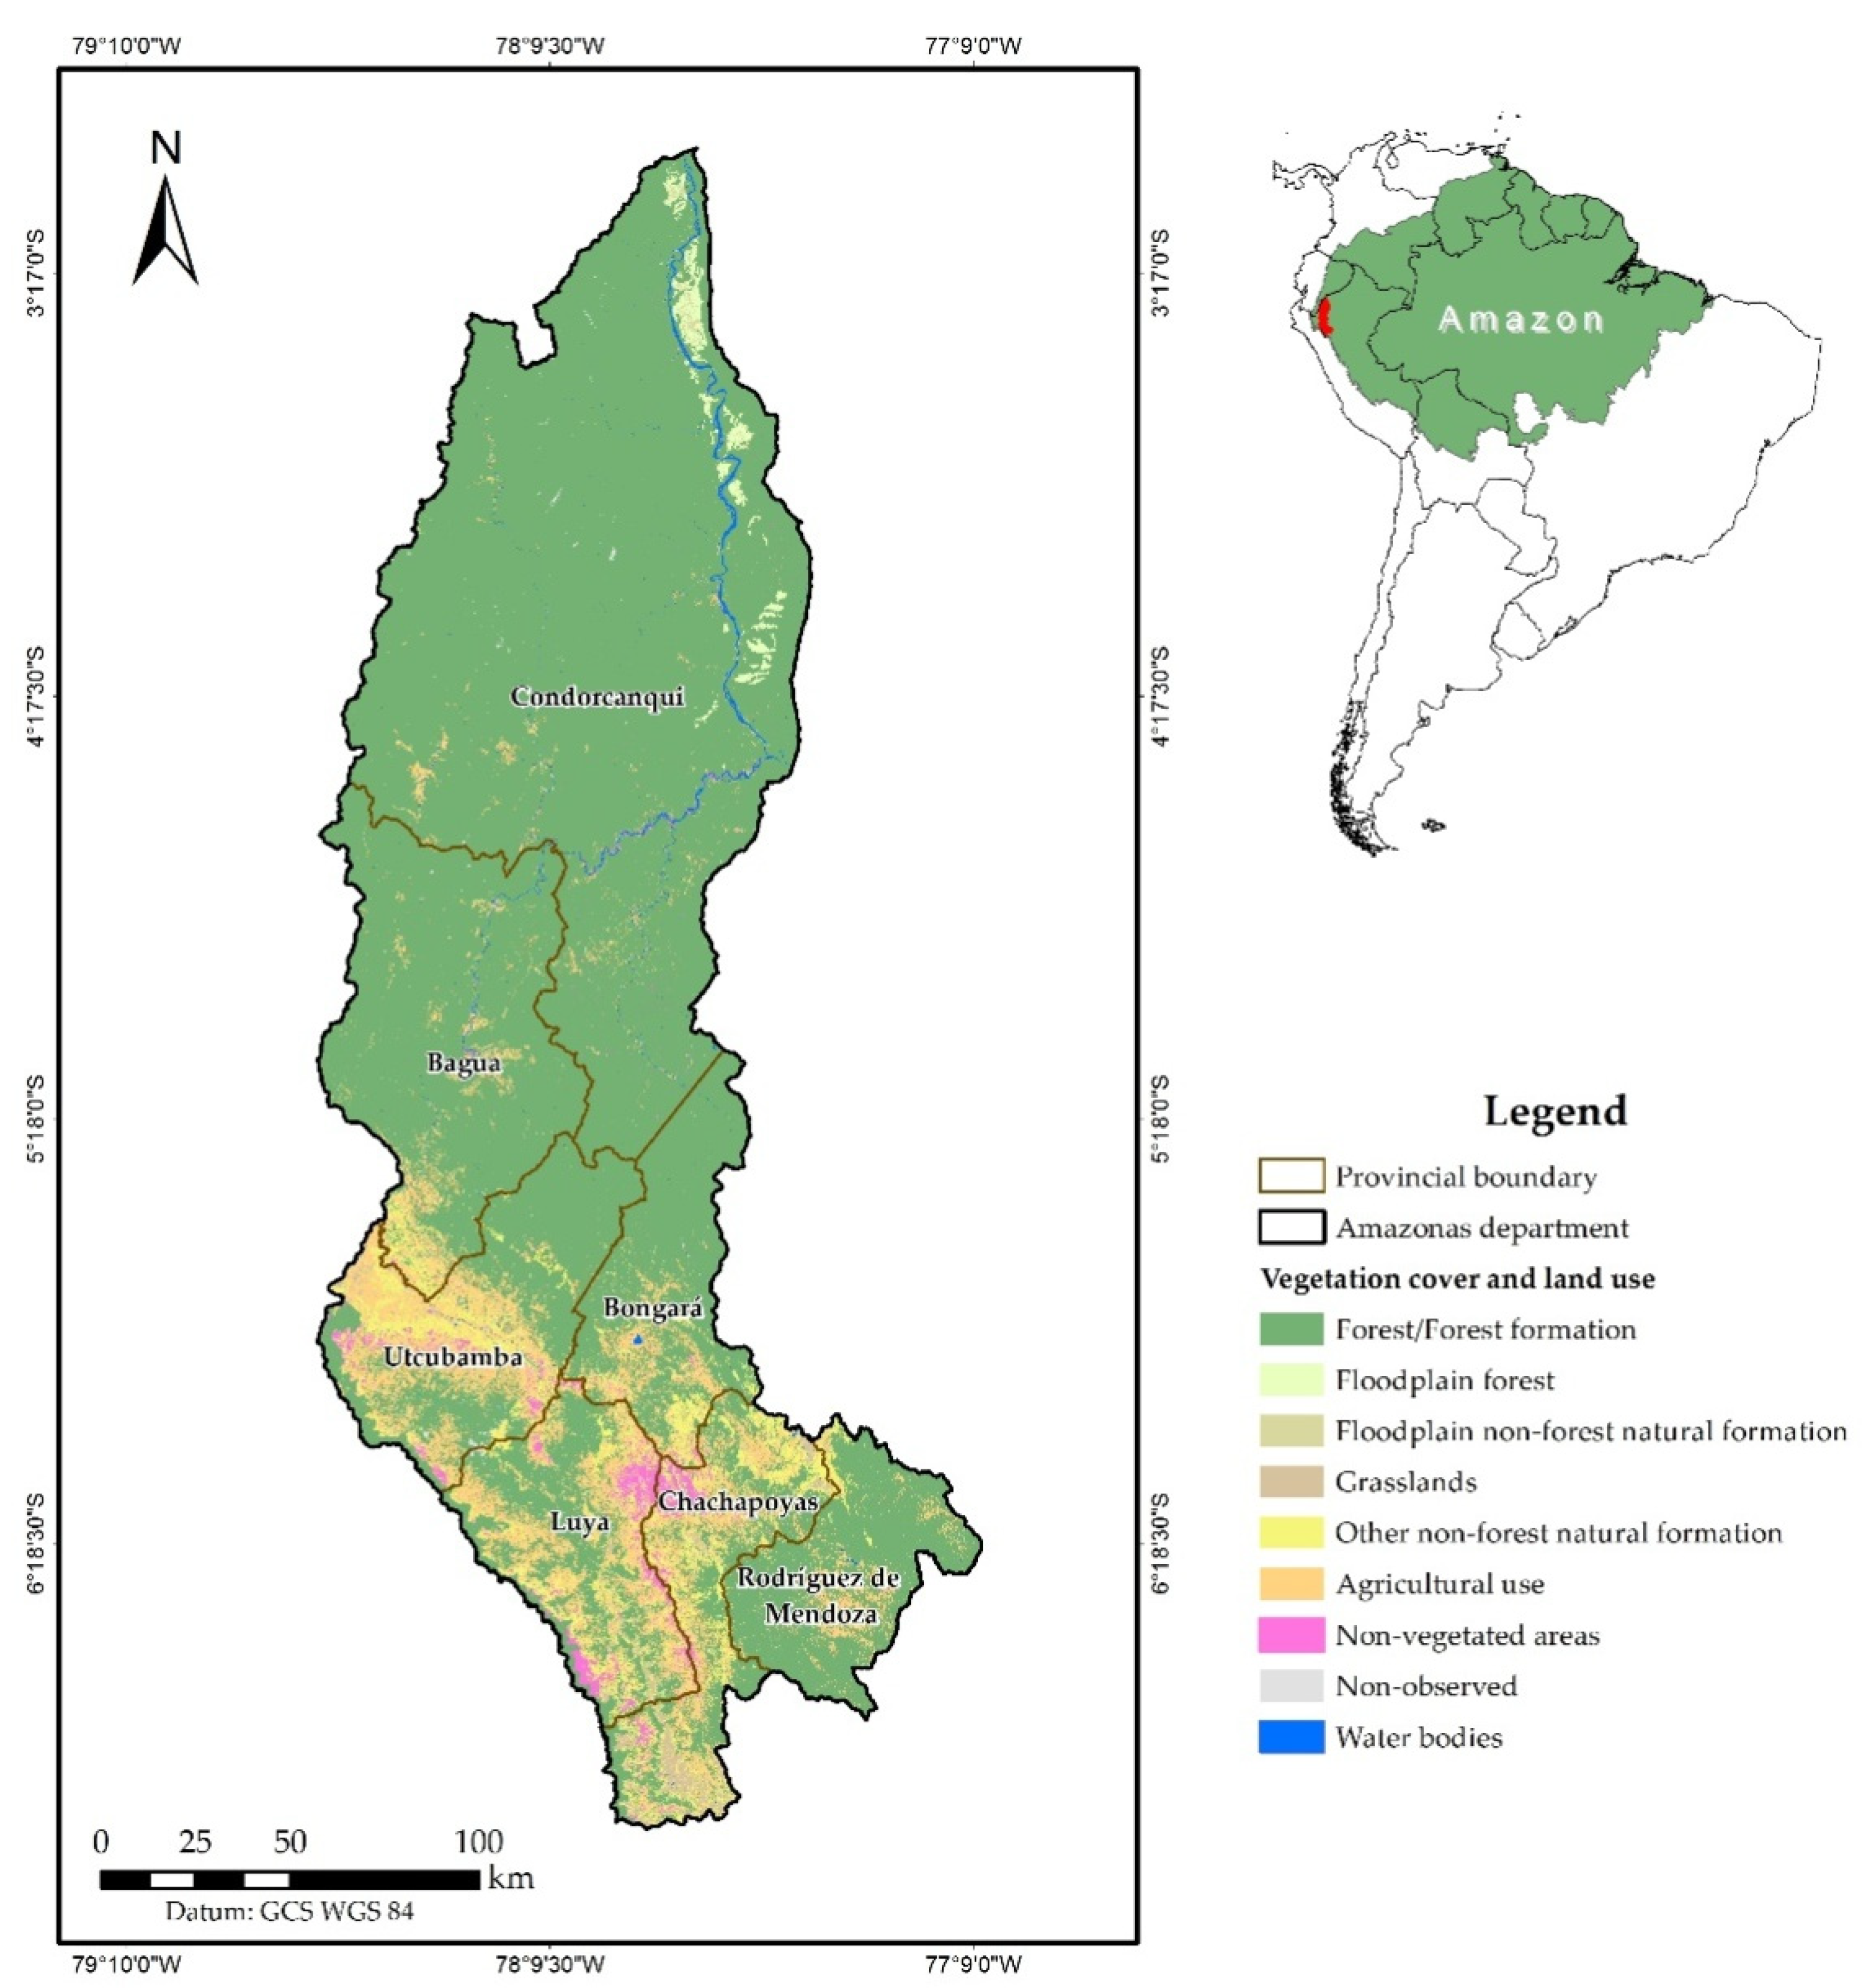
2.1. Study Area

The Amazonas department is part of the Peruvian Amazon and extends over a surface of 39,306.47 km2 (Figure 1, 3°0′–7°2′ S and 77°0′–78°42′ W), with elevations that range from 120 m.a.m.s.l. in the north to 4900 m.a.m.s.l. (meters above mean sea level) in the south. It comprises seven provinces (Bagua, Bongará, Chachapoyas, Condorcanqui, Luya, Rodríguez de Mendoza, and Utcubamba), with a total population of 379,384 inhabitants and a density of 9.6 inh./km2 [44]. This administrative division is composed of the interandean sector, which occupies 27.0% of its surface, and the Amazon Forest sector, which corresponds to the remaining 73.0% of the area. The Amazonas department contains a great diversity of natural resources, with complex and fragile ecosystems (Andean, lowland forest, highland forest, and tropical dry forest) [45], mostly covered by unexplored tropical forests [46]. The climate changes according to the geographic conditions, although the “warm and wet” climate prevails in Condorcanqui and in part of Rodríguez de Mendoza. There are other dissimilar climates scattered throughout the region, like the “warm and dry” climate in Bagua and Utcubamba provinces, and the “mildly wet and temperately warm” climate in Chachapoyas and Luya. The temperature rises up to 40 °C in the lowland forests (in the north) and the minimum temperature reaches 2 °C in the Andean Mountains (in the south) [45,47]. The land cover and land use in this region are predominantly represented by forests (forest formation and floodplain forest), followed by agriculture, natural formation (floodplain non-forest natural formation and grasslands), and non-vegetated areas [48].
The most outstanding economic activities in this region are agriculture (cropping and cattle raising) and the industrial activity, which respectively account for 51.2% and 14.5% of the regional Gross Domestic Product (GDP) [45]. These activities lead to deforestation, overgrazing, migratory agriculture, soil contamination and erosion, wildfires, and illegal logging and mining. It has been identified that 27.4% (11,533.93 km2) of this department’s surface is degraded [41,49]. During the period from 2002 to 2017, there were 130 forest fires [50]. This is a consequence of migratory agriculture and the opening of new accesses and land routes, such as connection axes for departmental and national economic development actions that affect a great variety of flora and fauna species [41,42]. Furthermore, the vegetation cover map of this region reported that only in 2018, 7453 ha of rain forests were lost [51]. Since the Amazonas department contains the greatest share of wildfires events in the Peruvian Amazon (Figure 2), it has been selected as our study area.
The Terra MODIS C6 product, belonging to the Fire Information for Resource Management System (FIRMS), registered 3539 wildfires in the Amazon from 2001 to 2019. The months of August (42), September (35), October (29), and November (30) presented the greatest monthly averages. In their turn, the years with the largest number of wildfires were 2005 (482), 2010 (270), and 2016 (343), respectively [52]. The surface of burn scars in the Amazonas department totalized 189.87 km2 [53]. Usually, these fires are caused by human action through agricultural practices, while in some other cases, they are also triggered by ignition sources, both of them with dramatic effects on the Amazon ecosystems [41,42]. In this context, it is extremely important to detect burnt areas so as to assess their spatiotemporal pattern as well as to conceive and implement prevention actions.

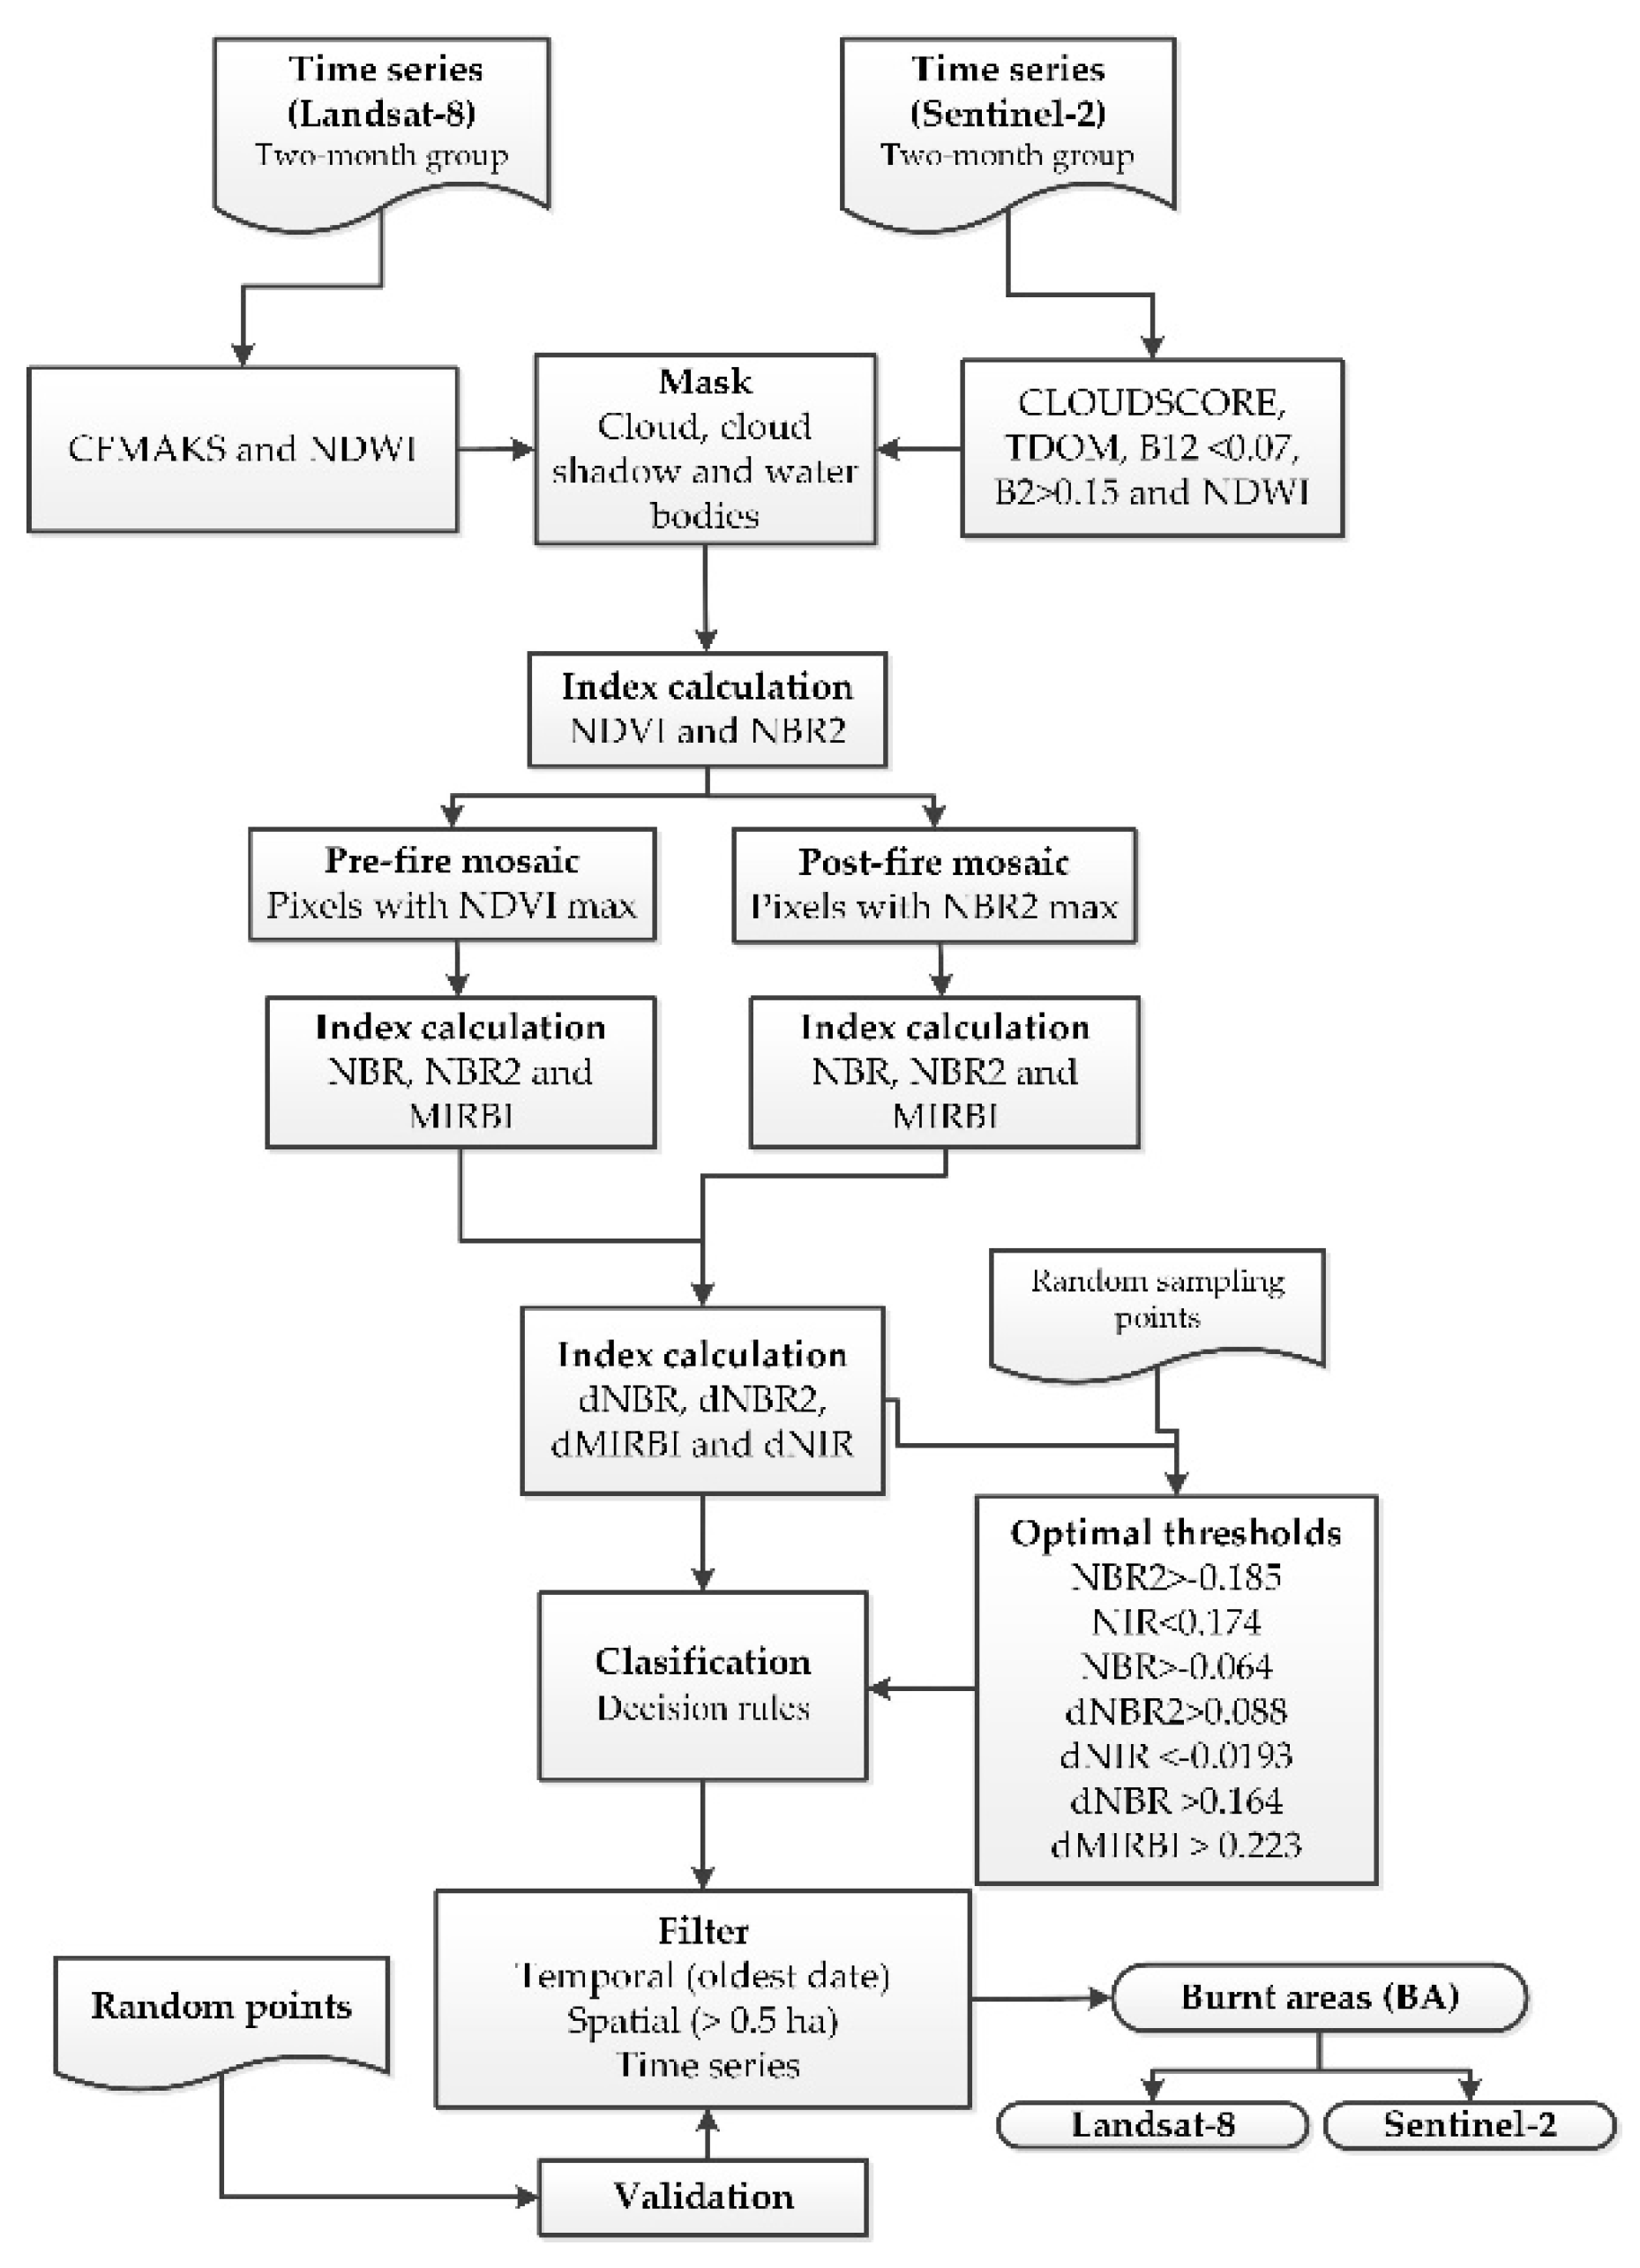
2.2. Data Processing

The adopted methodology is presented in Figure 3, which includes Landsat-8 and Sentinel-2 multispectral data acquisition; masking of clouds, cloud shadow, and water bodies; calculation of spectral indices; classification; spatiotemporal filtering; mapping of BA; and statistical validation.

2.3. Google Earth Engine (GEE)

This platform operates in the logic of “Big Data” and contains not only Landsat-8 and Sentinel-2 data, but further remotely sensed raster data possessing an order of magnitude of petabytes and rendered publicly available by agencies like the National Aeronautics and Space Administration (NASA), the European Space Agency (ESA), and others [14]. GEE also enables access to digital images processing and machine learning algorithms as well as to libraries of Application Programming Interfaces (API) (such as JavaScript, Python, and R) and scripting interfaces, in which users can develop their own codes and process data online. Thus, GEE allows the manipulation, analysis, and visualization of geospatial data without the need to access supercomputers [54].

2.4. Satellite Multispectral Data and Fire Products

There are several products that enable to detect BA. In this study, we employed medium spatial resolution satellite data available in the GEE platform, like the collection of Surface Reflectance (SR) multispectral images of Landsat-8 OLI/TIRS Tier 1 (ID: LANDSAT/LC08/C01/T1_SR) and the Top-Of-Atmosphere (TOA) images in the case of Sentinel-2/MIS level-1C (ID: COPERNICUS/S2) [55]. The data acquisition and processing comprised the time span from 2017 to 2019, in view of data availability (Table 1 and Table 2). Each imagery collection was individually classified. For Landsat-8, we worked with the original spatial resolution of 30 m, while for Sentinel-2, we adopted a standard spatial resolution of 15 m, obtained by means of resampling using the nearest neighbor interpolation technique.

2.5. Masking of Clouds, Cloud Shadow, and Water Bodies

Masking was an important processing step due to the fact that the study area presents clouds during most of the year. This process allowed the masking of clouds, cloud shadow, and water bodies. The algorithm C Function of Mask (CFMASK) was applied to Landsat-8 images, so as to detect clouds and cloud shadow [56]. In the case of the Sentinel-2 images, the algorithm Google CloudScore was applied to mask clouds, and the algorithm Temporal Dark Outlier Mask (TDOM) to mask cloud shadow, with the aid of the Quality Assessment band (QA60) [57]. For the sake of masking pixels presenting noise derived from cloud shadow, a threshold was applied to band B12, where B12 < 0.07 was considered cloud shadow [12]. Considering the often presence of cirrus clouds, a threshold was also applied to band B2 (B2 > 0.15) [58]. Lastly, the Normalized Difference Water Index (NDWI) was applied to detect and mask water bodies [59].

2.6. Mosaic of Pre and Post-Fire Images

This process initially grouped (mosaiced) the time series data by every two months, which was meant not only to build a mosaic with a minimum amount of clouds, but also to reduce the input data dimensionality. In the sequence, pre-selected filters were applied for excluding pixels with clouds, cloud shadow, and water bodies from the Landsat-8 and Sentinel-2 multitemporal data. For the creation of pre and post-fire mosaics, the NBR and NDVI were applied. The elaboration of the pre-fire mosaic consisted in selecting the pixels with maximum values of the NDVI along the time series, while for the post-fire mosaic, the pixels with maximum values of the NBR were selected.

2.7. Spectral Indices for Burnt Areas (BA) Mapping

Four indices commonly used to extract BA were selected (Table 3) [12,34,60]. The following spectral bands were used: Visible Red (Red), Near Infrared (NIR), Short-Wave Infrared 1 (SWIR1), and Short-Wave Infrared 2 (SWIR2).
The NDVI is one of the most known and widely used vegetation indices, which takes into account the amount of absorbed visible red light by the green vegetation. In a general way, the NDVI is sensitive to the content of chlorophyll and other pigments responsible for absorbing solar radiation in the red range of the electromagnetic spectrum, while the Enhanced Vegetation Index (EVI) is more sensitive to the variation in the canopy structure, including the Leaf Area Index (LAI), the plant physiognomy, and the canopy volume [62,63]. The EVI and the Soil Adjusted Vegetation Index (SAVI) make use of atmospheric correction and soil parameters that would lead to a greater uncertainty in the calculation of thresholds to identify burnt areas. The fire-induced damage caused to the vegetation results in a substantial decrease in the NDVI [34,64], and hence, we have selected the NDVI for BA detection.
The time series analyses revealed that the NBR2 has shown to be efficient in discriminating burnt from unburnt areas [12,38]. In this way, the pixels with maximum values of the NDVI and NBR2 were selected for differentiating pre-fire from post-fire areas (BA), respectively.
Based on the generated information, it was then necessary to set appropriate thresholds for the pre and post-fire differential spectral indices, namely dMIRBI [65], dNBR [66], dNBR2, and dNIR [65]. This procedure was executed considering 444 sampled points by means of visual analysis with the aim of defining the BA thresholds [12] (Figure 4). The application of these differential spectral indices to the images led to the classification of “burnt” and “unburnt” areas (Figure 5) according to the defined thresholds [67], which then framed the decision rules-based routine in the GEE platform [68].

2.8. Images Filtering

A temporal filter based on the NBR was applied for the purpose of eliminating inconsistencies (or changes in BA) and also to correct errors due to cloud plumes, absence of information, or duplicity of fire dates. To this end, the oldest date in the results was considered for classification. Such temporal filter was applied to the time series of each year and consisted of defining rules of permanence for the NBR values. Regarding the Landsat-8 data, an area was assigned as BA if it presented at least one positive value of the dNBR along the whole time series (due to the limited images availability). For each of the Sentinel-2 annual data, at least two positive values of the dNBR in the whole time series were required to ascribe an area as BA (Figure 6). A spatial filter with a minimum mapping unit of 0.5 ha [69] was also applied. Isolated and border pixels were eliminated by means of neighborhood filters, aiming at improving the data spatial consistency. Areas with rice cultivation were also excluded (on sites with slope < 5°), particularly in the Utcubamba river valley.

2.9. Statistical Validation of BA

Error matrices were elaborated based on the BA classification and reference data (n sampled observations), which enabled the evaluation of the results’ accuracies for each analyzed year [70]. The comparison between the BA product and the reference data was based on the proportion of each pixel classified as burnt or unburnt in the Landsat-8 and Sentinel-2 images. Thus, we calculated the user’s accuracy (UA), which corresponds to commission errors (from the user’s perspective), and the producer’s accuracy (PA), associated with omission errors (from the perspective of the map producer) [71,72]. Furthermore, we calculated the overall accuracy, which indicates the quality of the classification result in terms of quantity; F-Score (F1), which provides relations between data’s positive labels and those given by a classifier [73]; the Quantity component (Qt), which reveals the absolute differences in quantity for each category (burnt and unburnt areas) in both observed and classified data; the Exchange component (Et), which assesses the share of changes from burnt to unburnt areas and vice versa with the same proportions in the reference and classified data, without modifying the final quantities [74].

2.10. Identification of BA Patterns

With the aim of creating a continuous surface able to represent the wildfires intensity at the Amazonas department level, Kernel Density Estimation (KDE) was used [75]. The KDE [76,77]. Next, the density map was reclassified according to the Jenks natural breaks classification method [78] in five classes related to different levels of BA density: very low, low, moderate, high, and very high [28,41,50]. Finally, the quality of the spatial agreement was evaluated using Yule’s Q coefficient [79].

3. Results

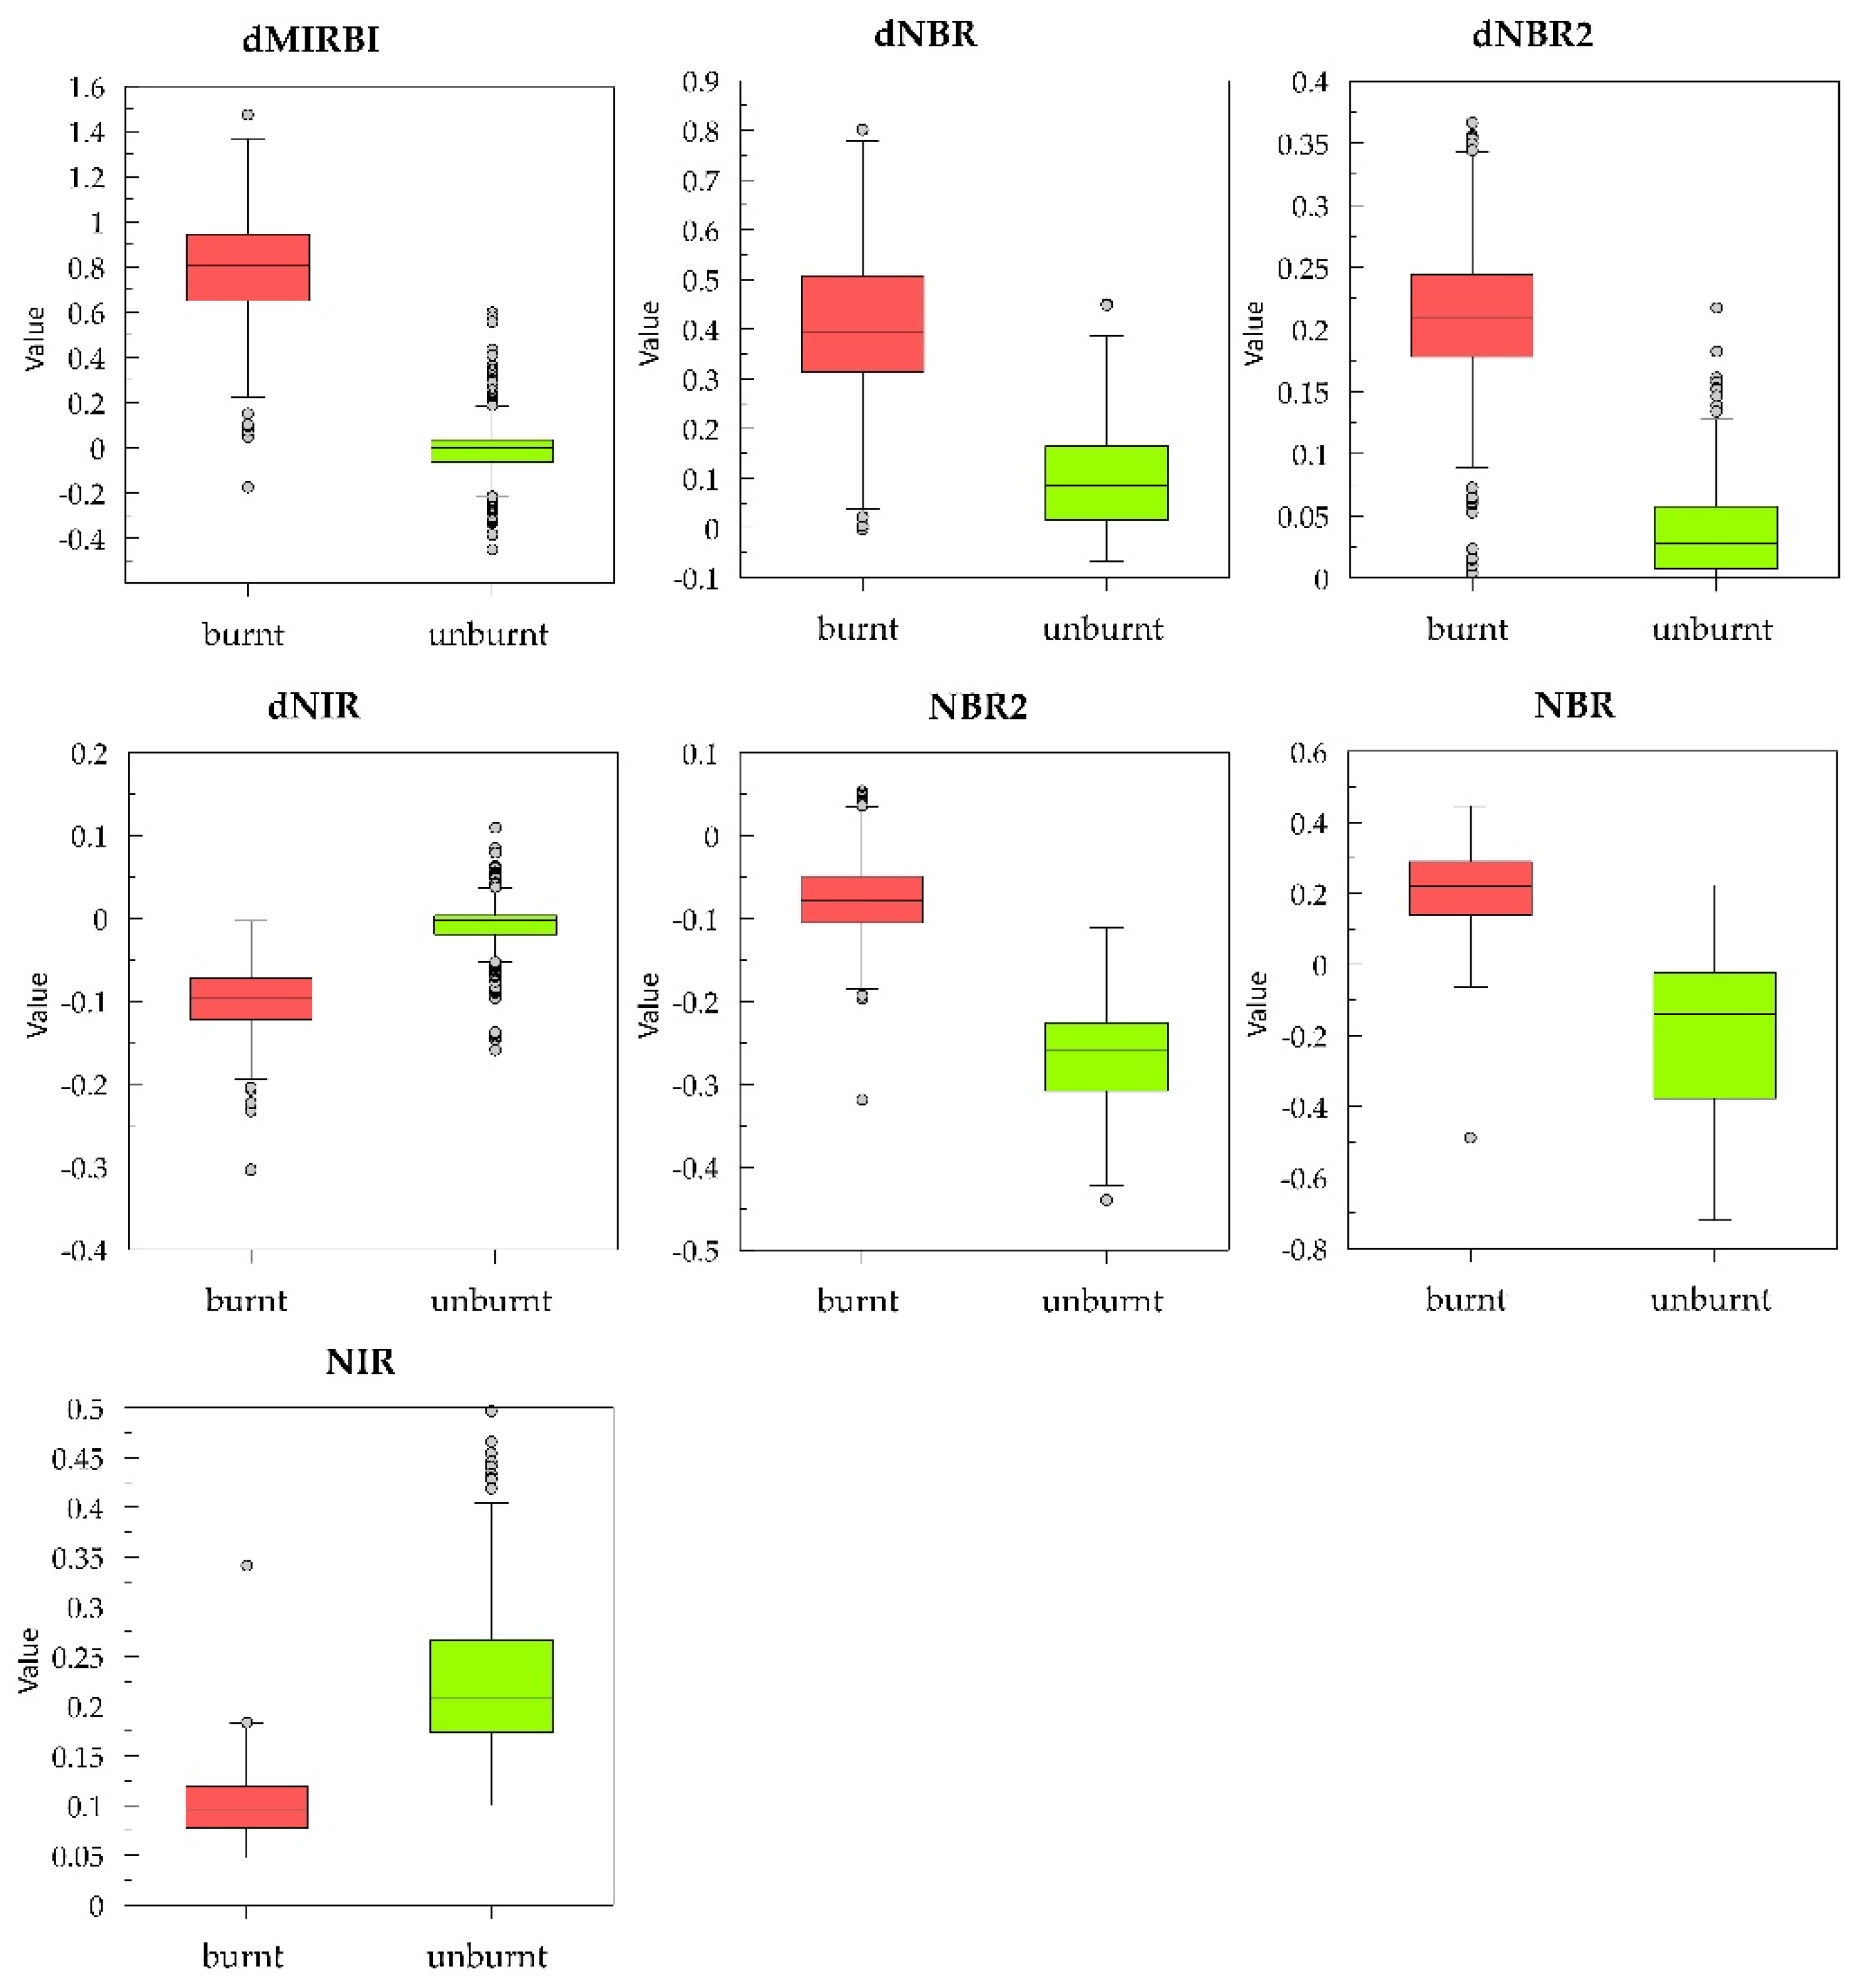
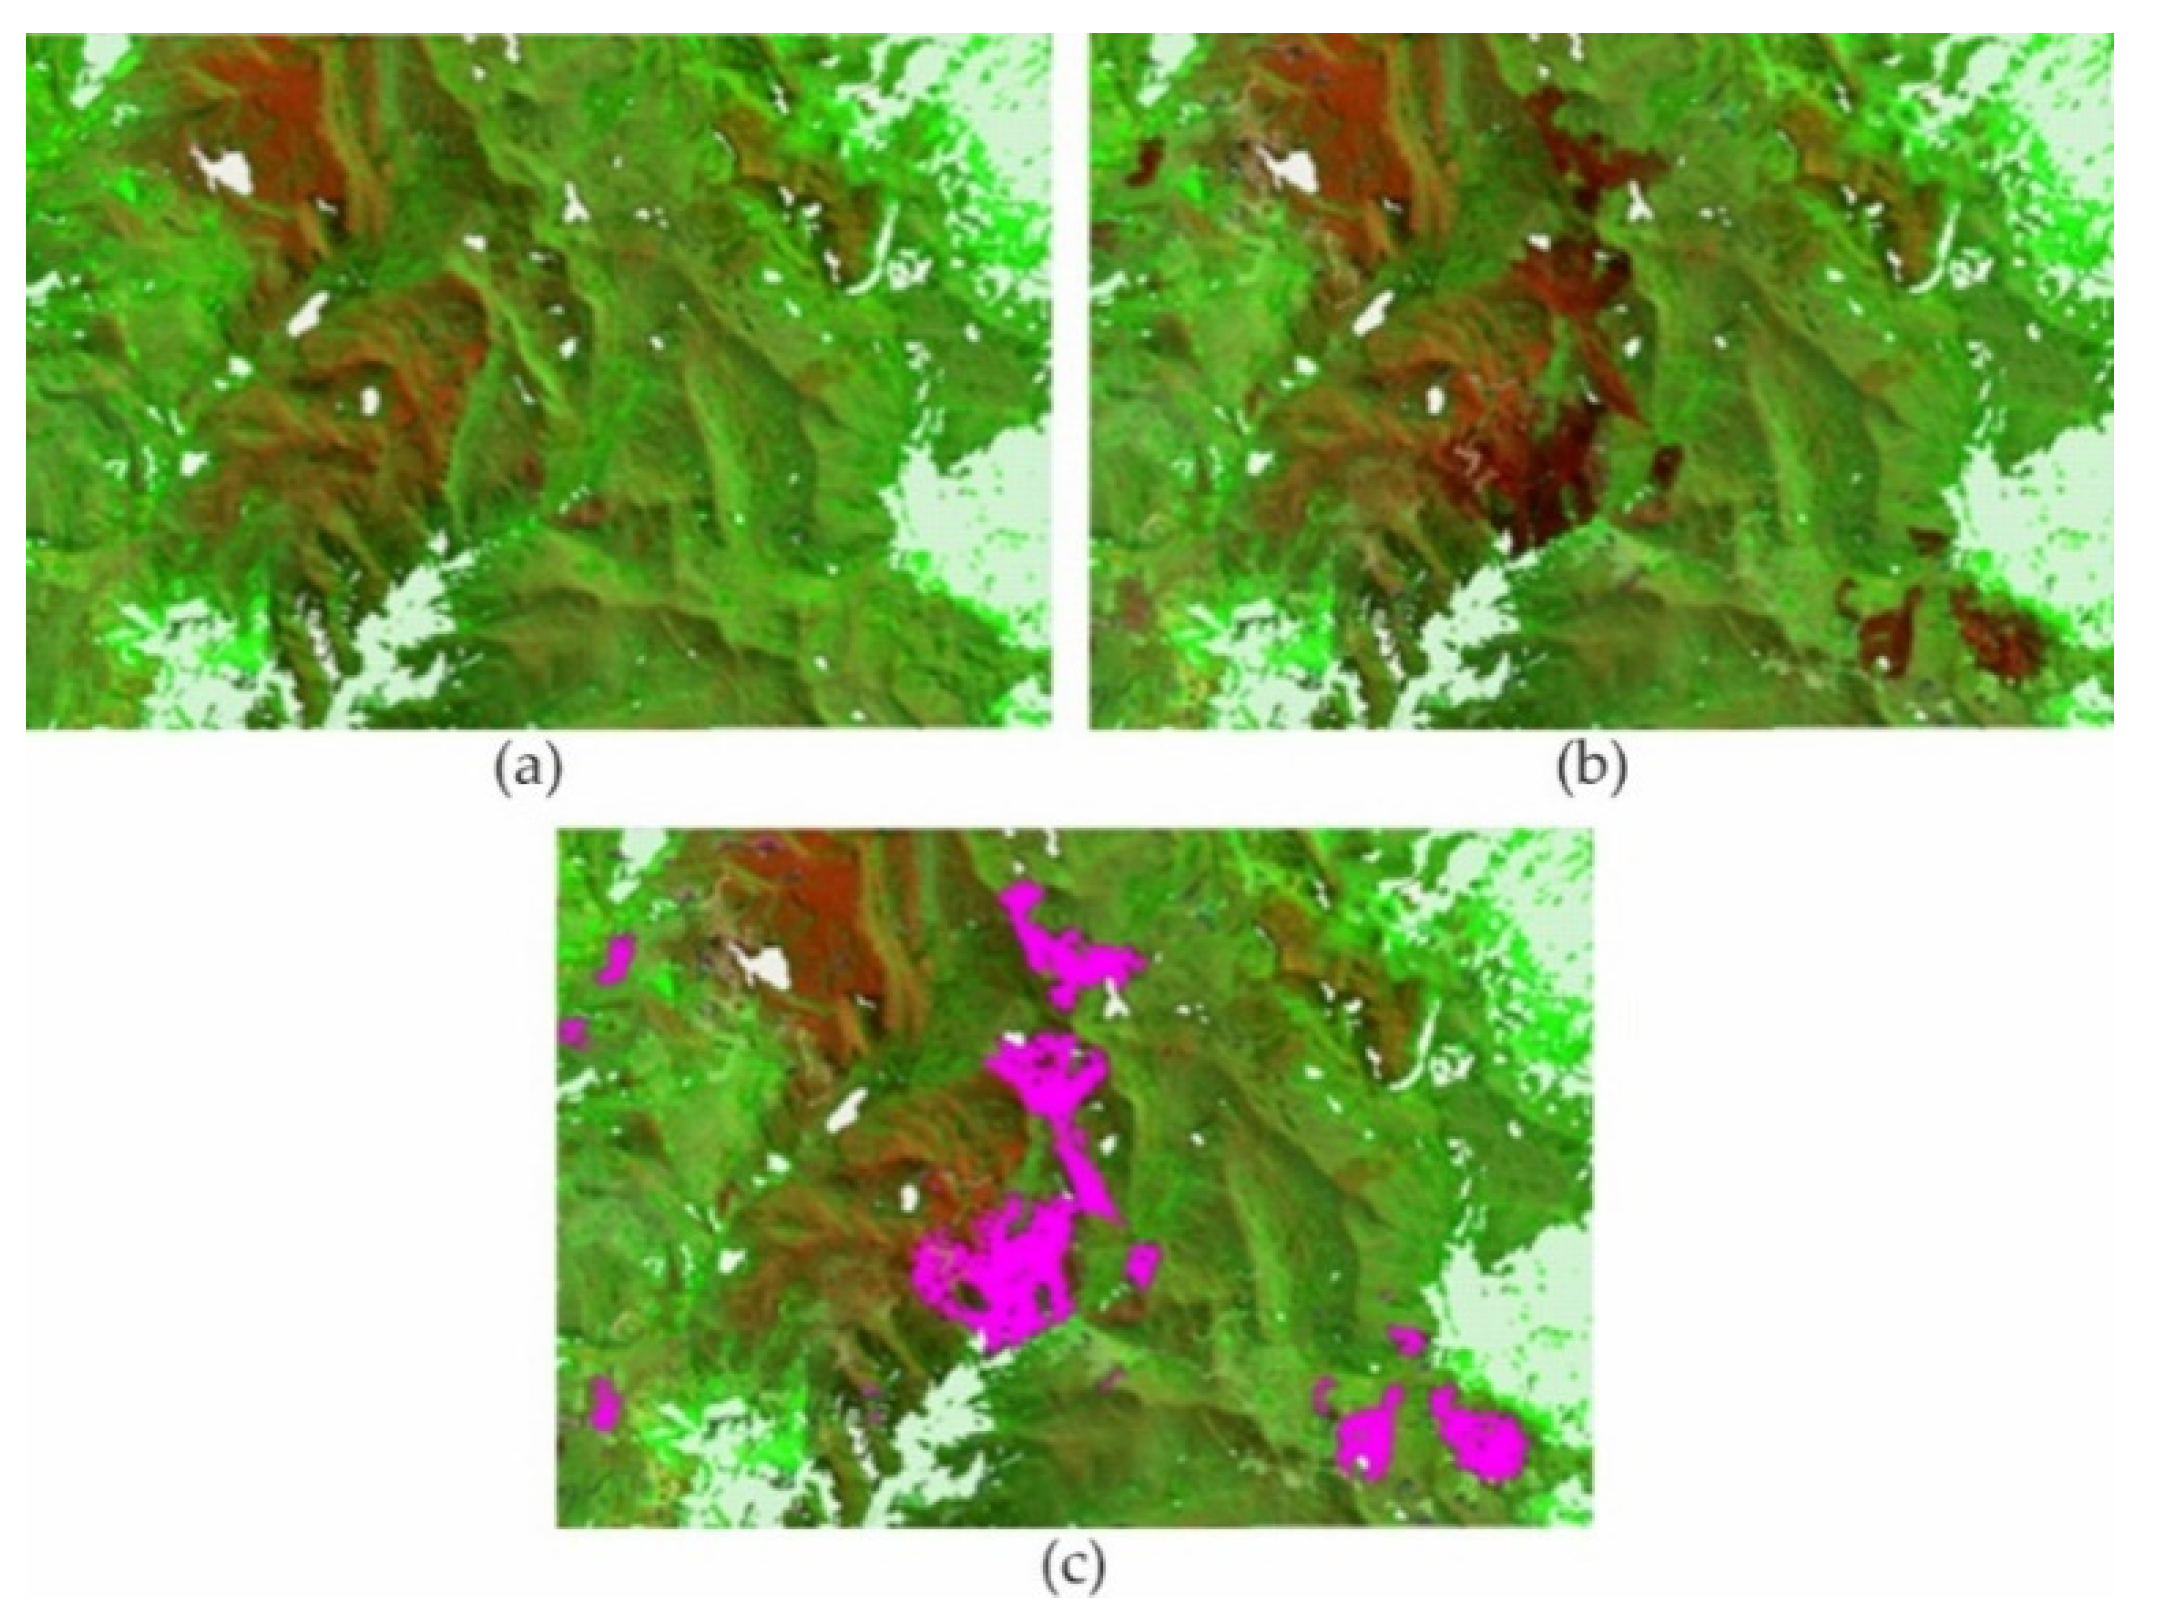
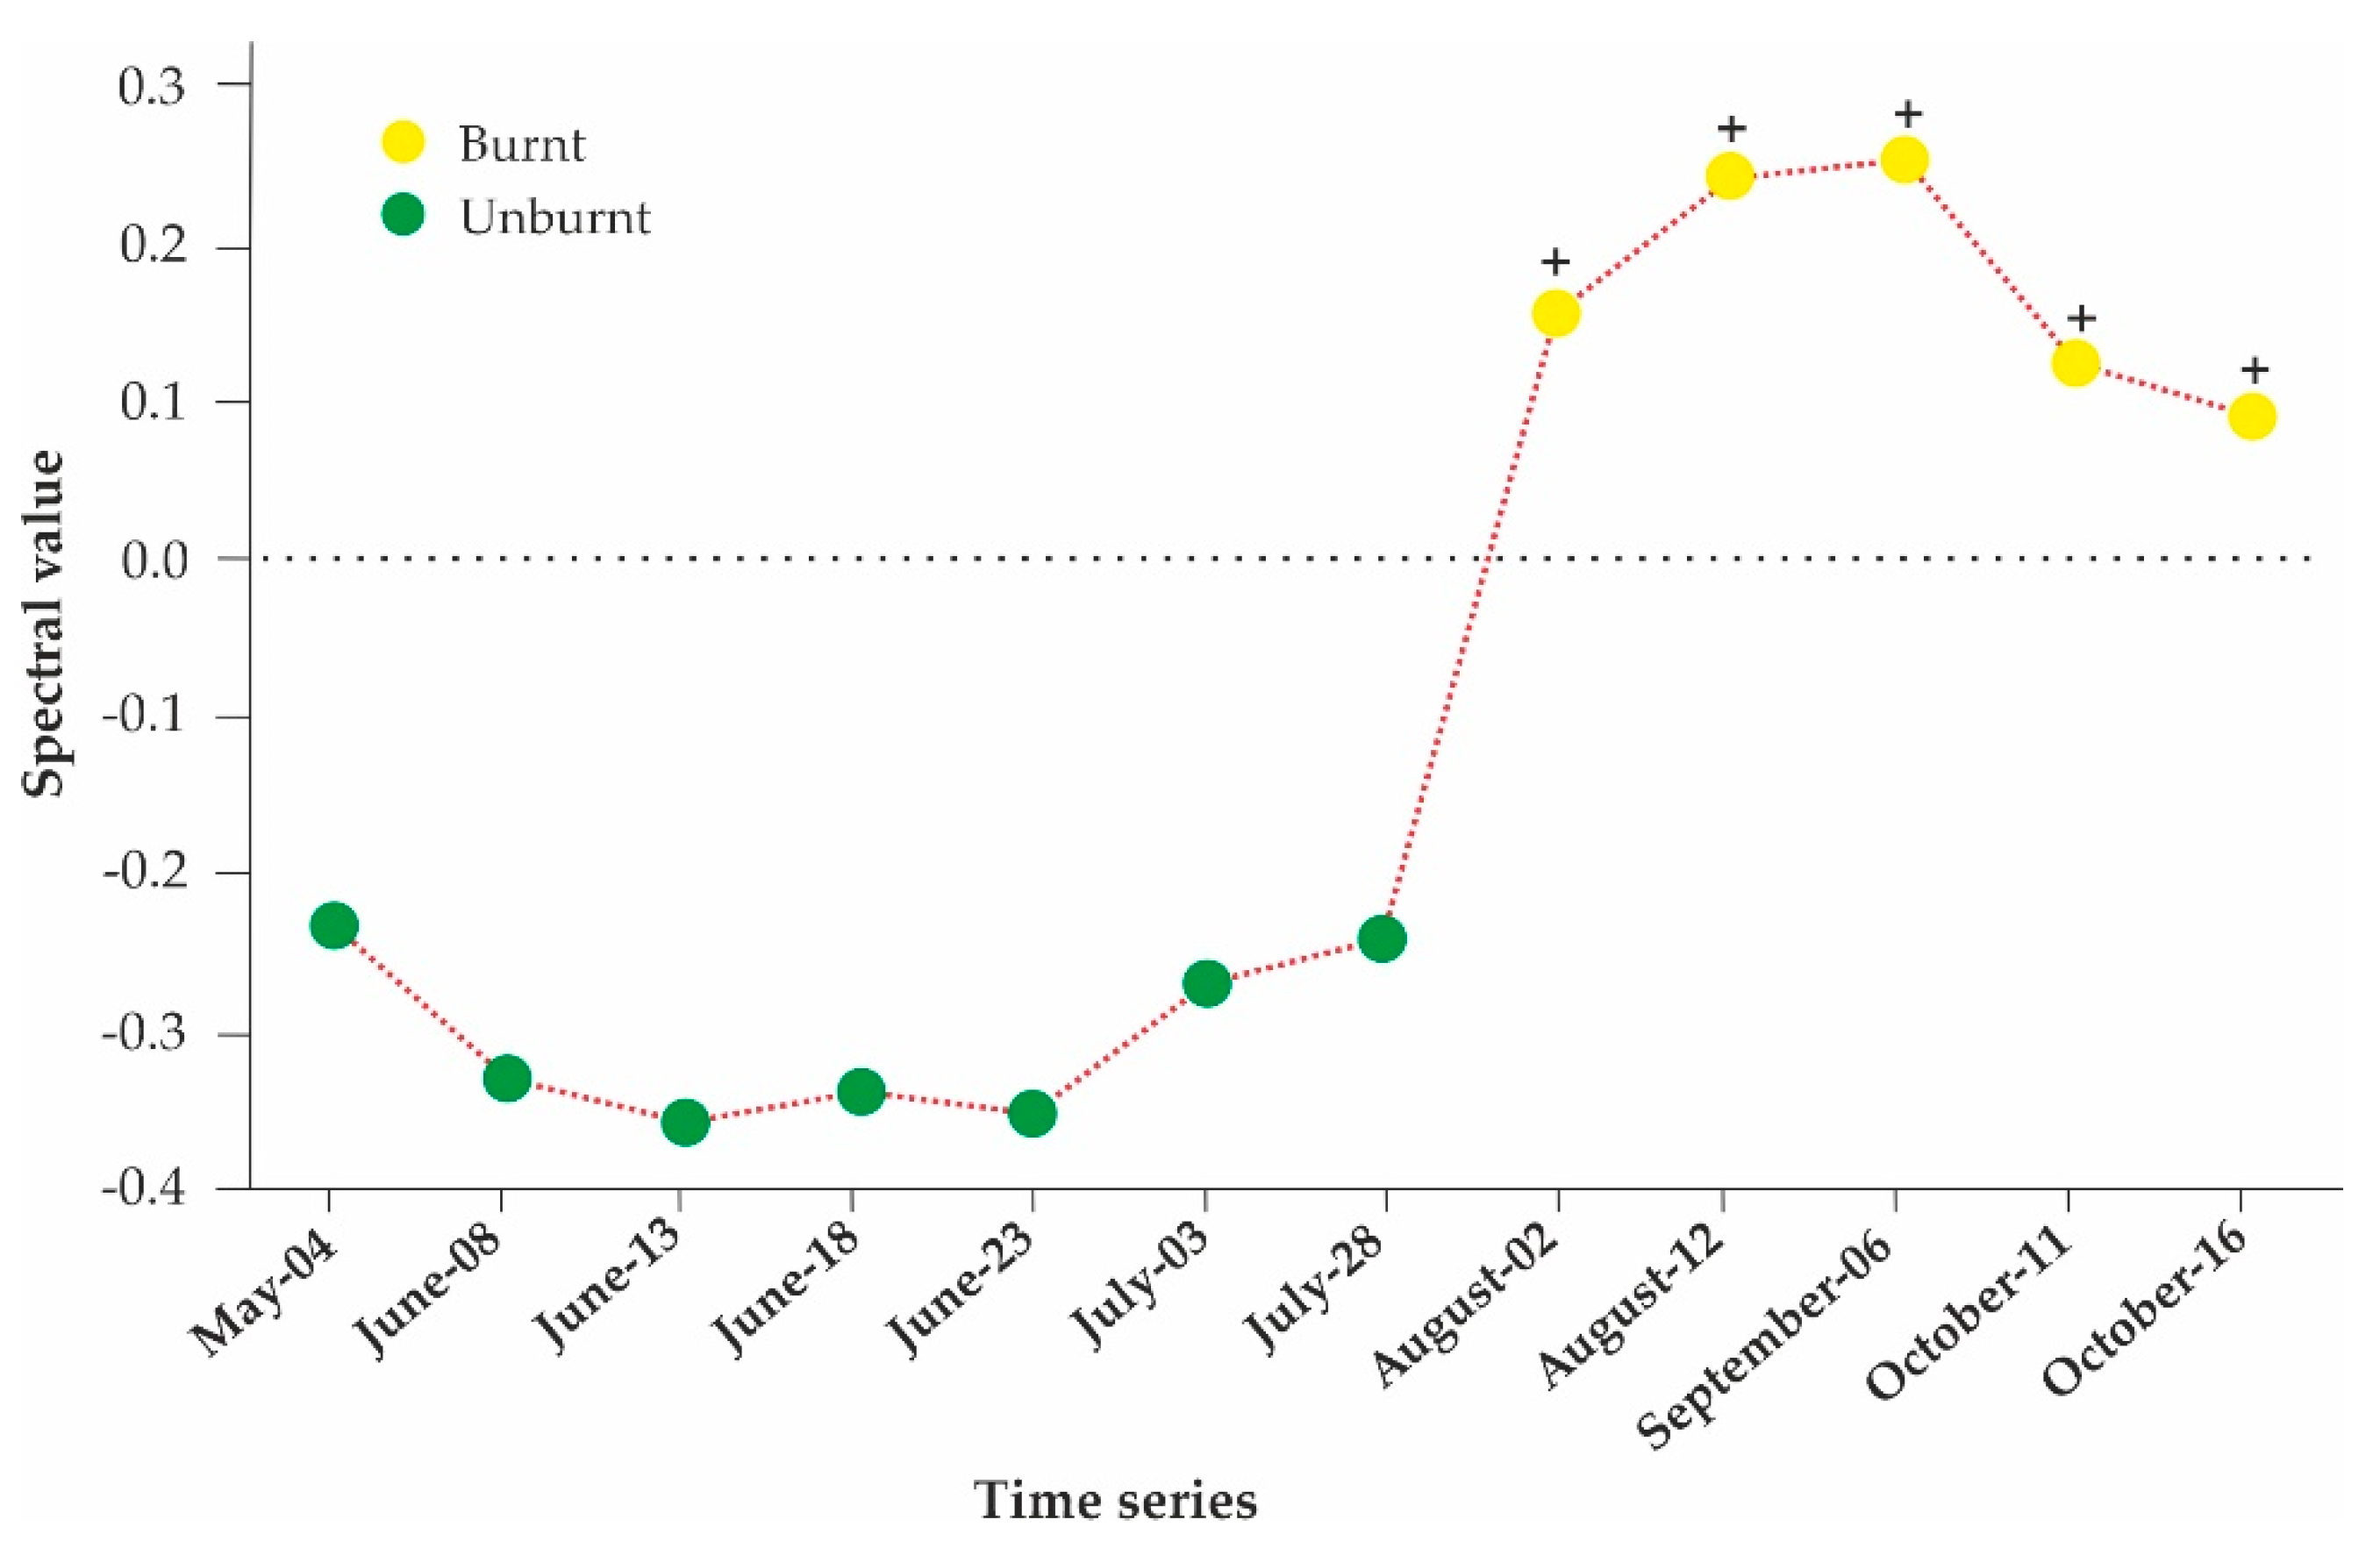
3.1. Validation of the Achieved Results for Assessing BA

The BA statistical validation was achieved based on the visual interpretation of 456 test sites, so as to allow for a comparative evaluation of the UA, PA, accuracy, F1, Qt, and Et between the Landsat-8 and Sentinel-2 products. The accuracy obtained by Landsat-8 in the years 2017, 2018, and 2019 (Table 4) lay between 82.7% and 91.4%, and the UA ranged from 66.7% to 98.7%. The PA varied from 74.8% to 98.5% and F1 indices reached values from 79.4% to 90.8%, respectively. Sentinel-2 presented otherwise better values, with an accuracy between 94.5% and 98.5%, UA varying from 92.1% to 99.1%, PA ranging from 92.5% to 99.1%, and F1 attaining values oscillating between 94.4% and 98.5%, respectively (Table 4). The Qt values for Landsat-8 oscillated from 84 to 92 and for Sentinel-2, from 43 to 57 during the analyzed period. In its turn, the Et values for Landsat-8 varied from 8 to 16, while for Sentinel-2, these values lay between 43 and 57.

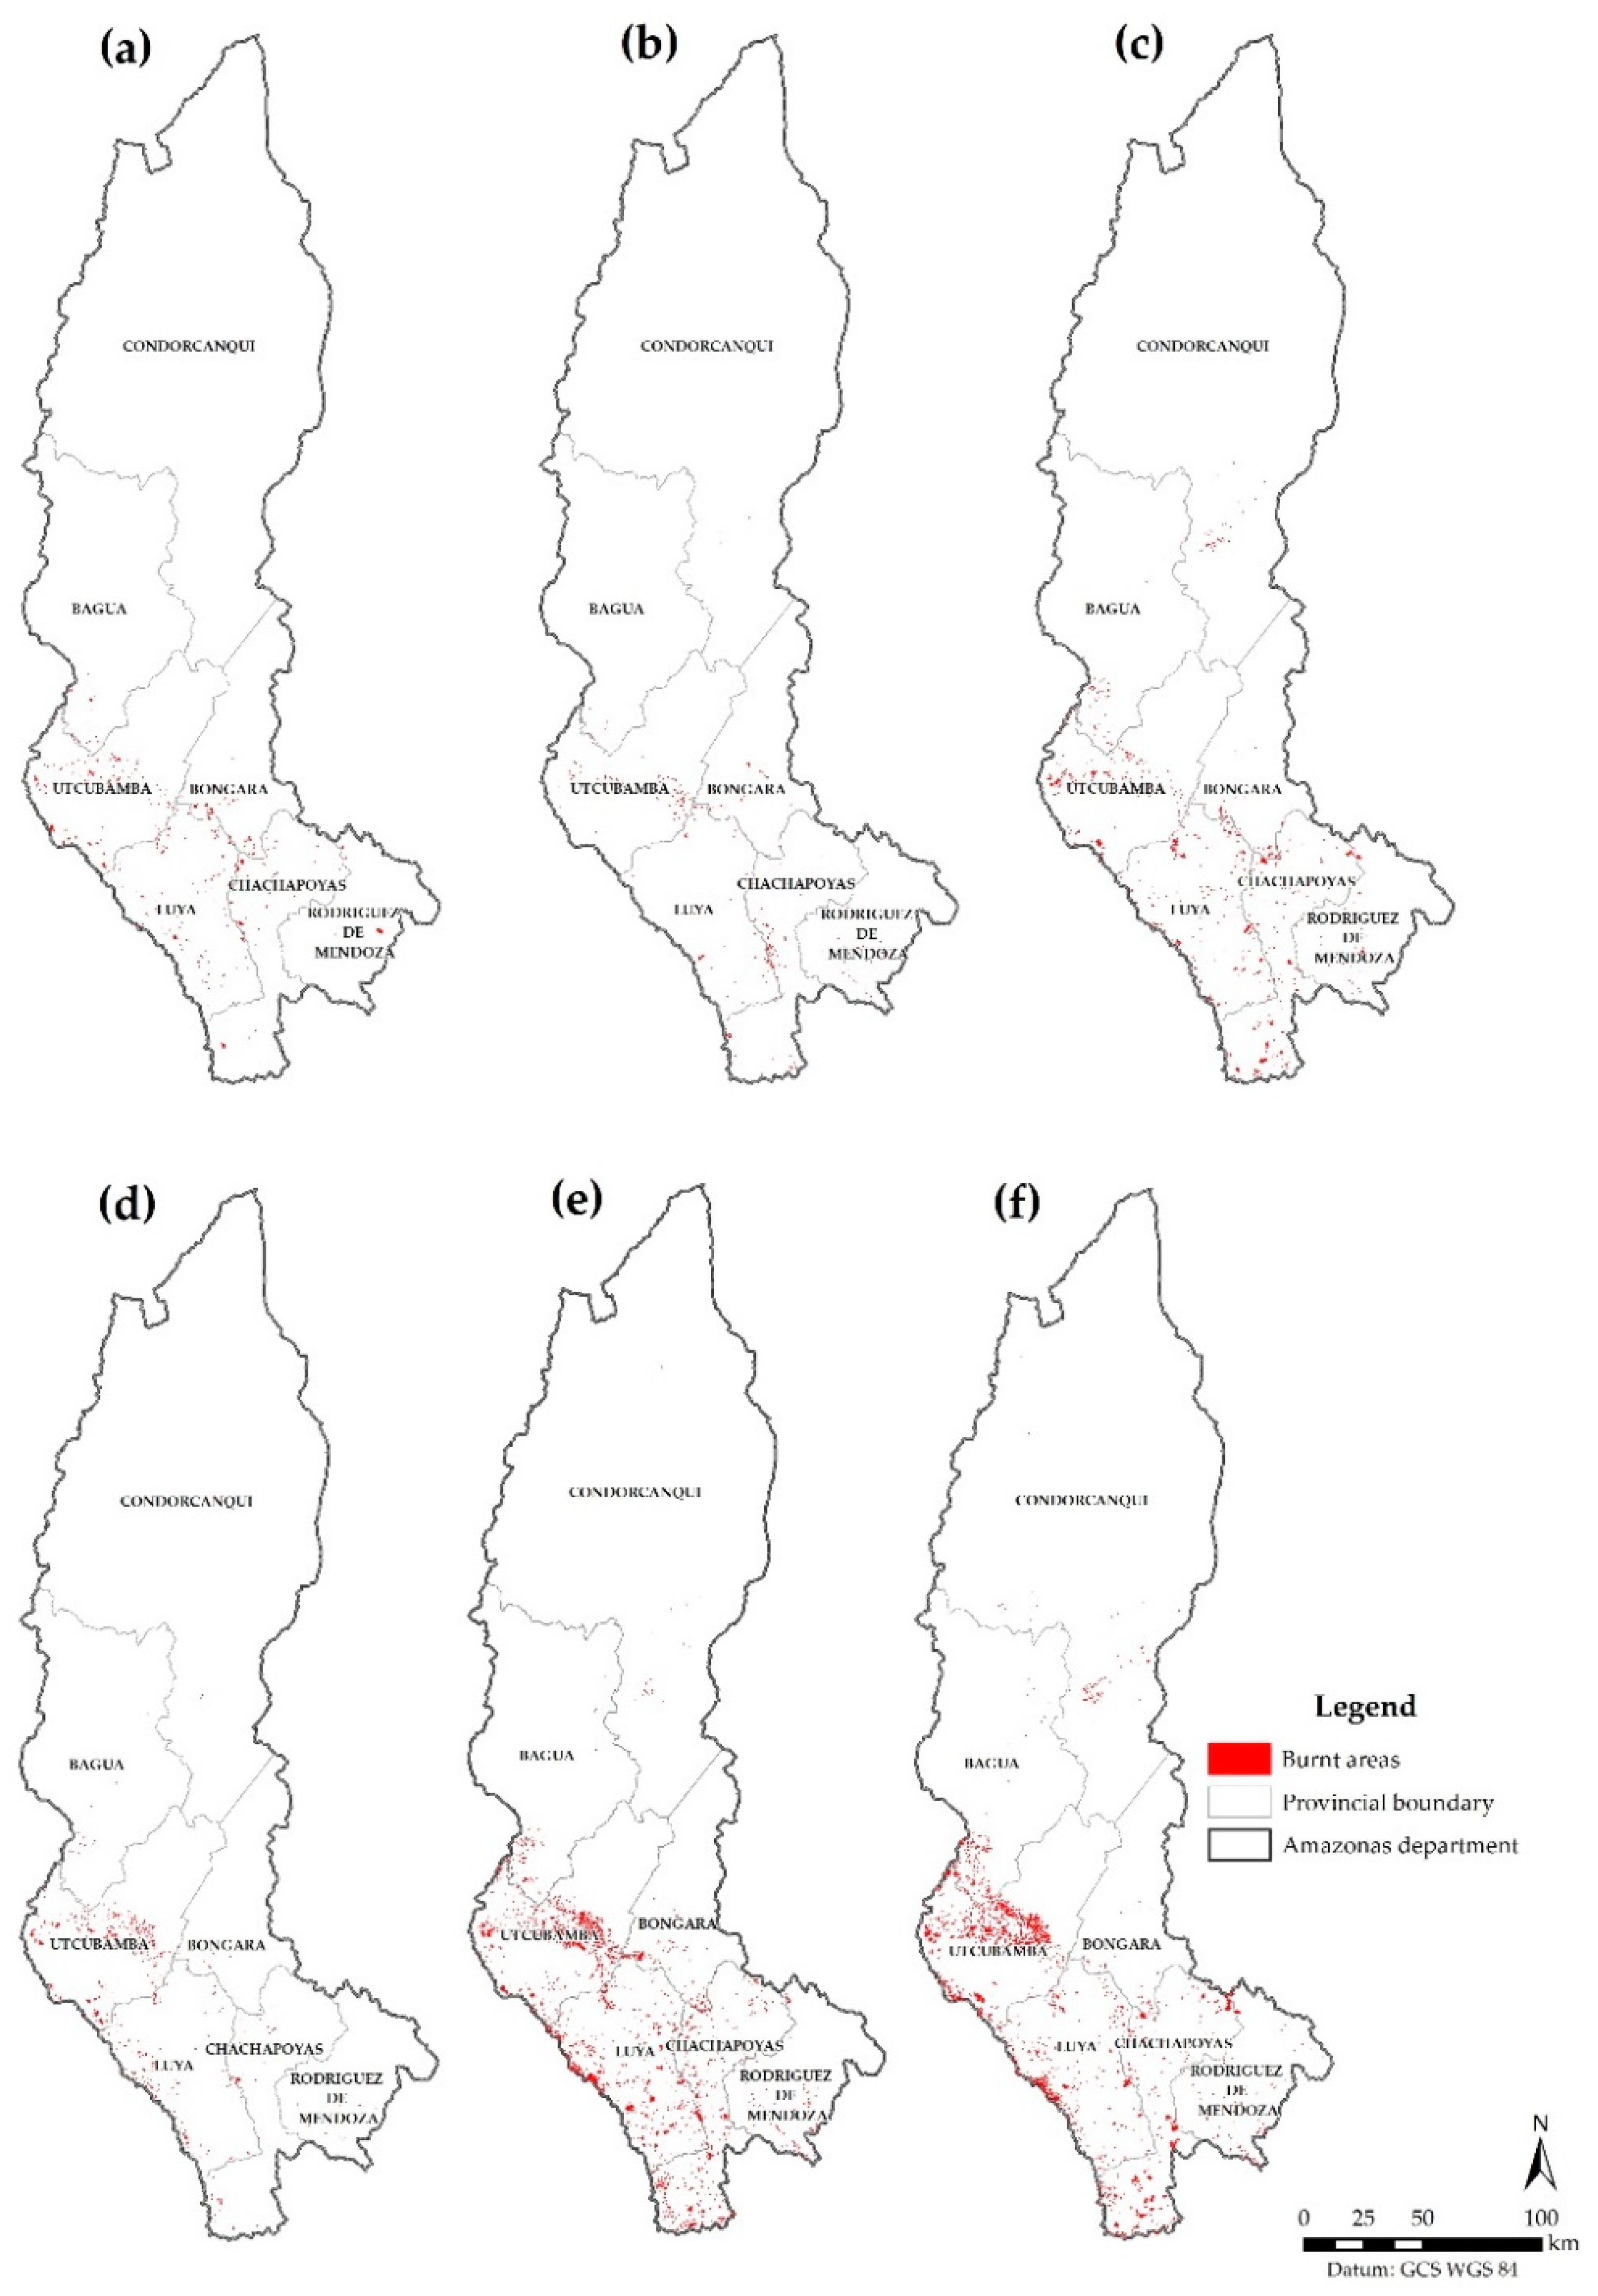
3.2. BA in the Amazonas Department

Wildfires in the Amazonas department showed to be of reduced extent in 2017 and 2018 as compared with 2019. An annual comparison of BA per product is presented in Table 5. In 2017, Landsat-8 registered an area of 16.39 km2, 0.96% smaller than the Sentinel-2 product, which assessed 16.5 km2 of surface. In 2018, Landsat-8 recorded an extension of BA of 6.24 km2, while the Sentinel-2 product reported an area of 78.50 km2 (1158.48% greater than Landsat-8). Finally, in 2019 the BA extension was of 32.93 and 67.19 km2 (the latter one being 104.05% greater), as registered by Landsat-8 and Sentinel-2, respectively.
Figure 7 shows the occurrence of wildfires in the analyzed years. It can be inferred that the wildfires frequency increases between June and December and this behavior tends to repeat throughout the years.

3.3. Spatial Agreement of BA

A spatial comparison of BA patches derived from the Landsat-8 and Sentinel-2 products per analyzed year is shown in Figure 8. The centroids of the BA polygons show a similar spatial distribution pattern in both satellite products, although Sentinel-2 has comparatively produced a greater number and larger patches of wildfires burn scars with respect to those generated by Landsat-8 during the evaluated years, in the face of its higher spatial (15 m) and temporal (5 days) resolutions.

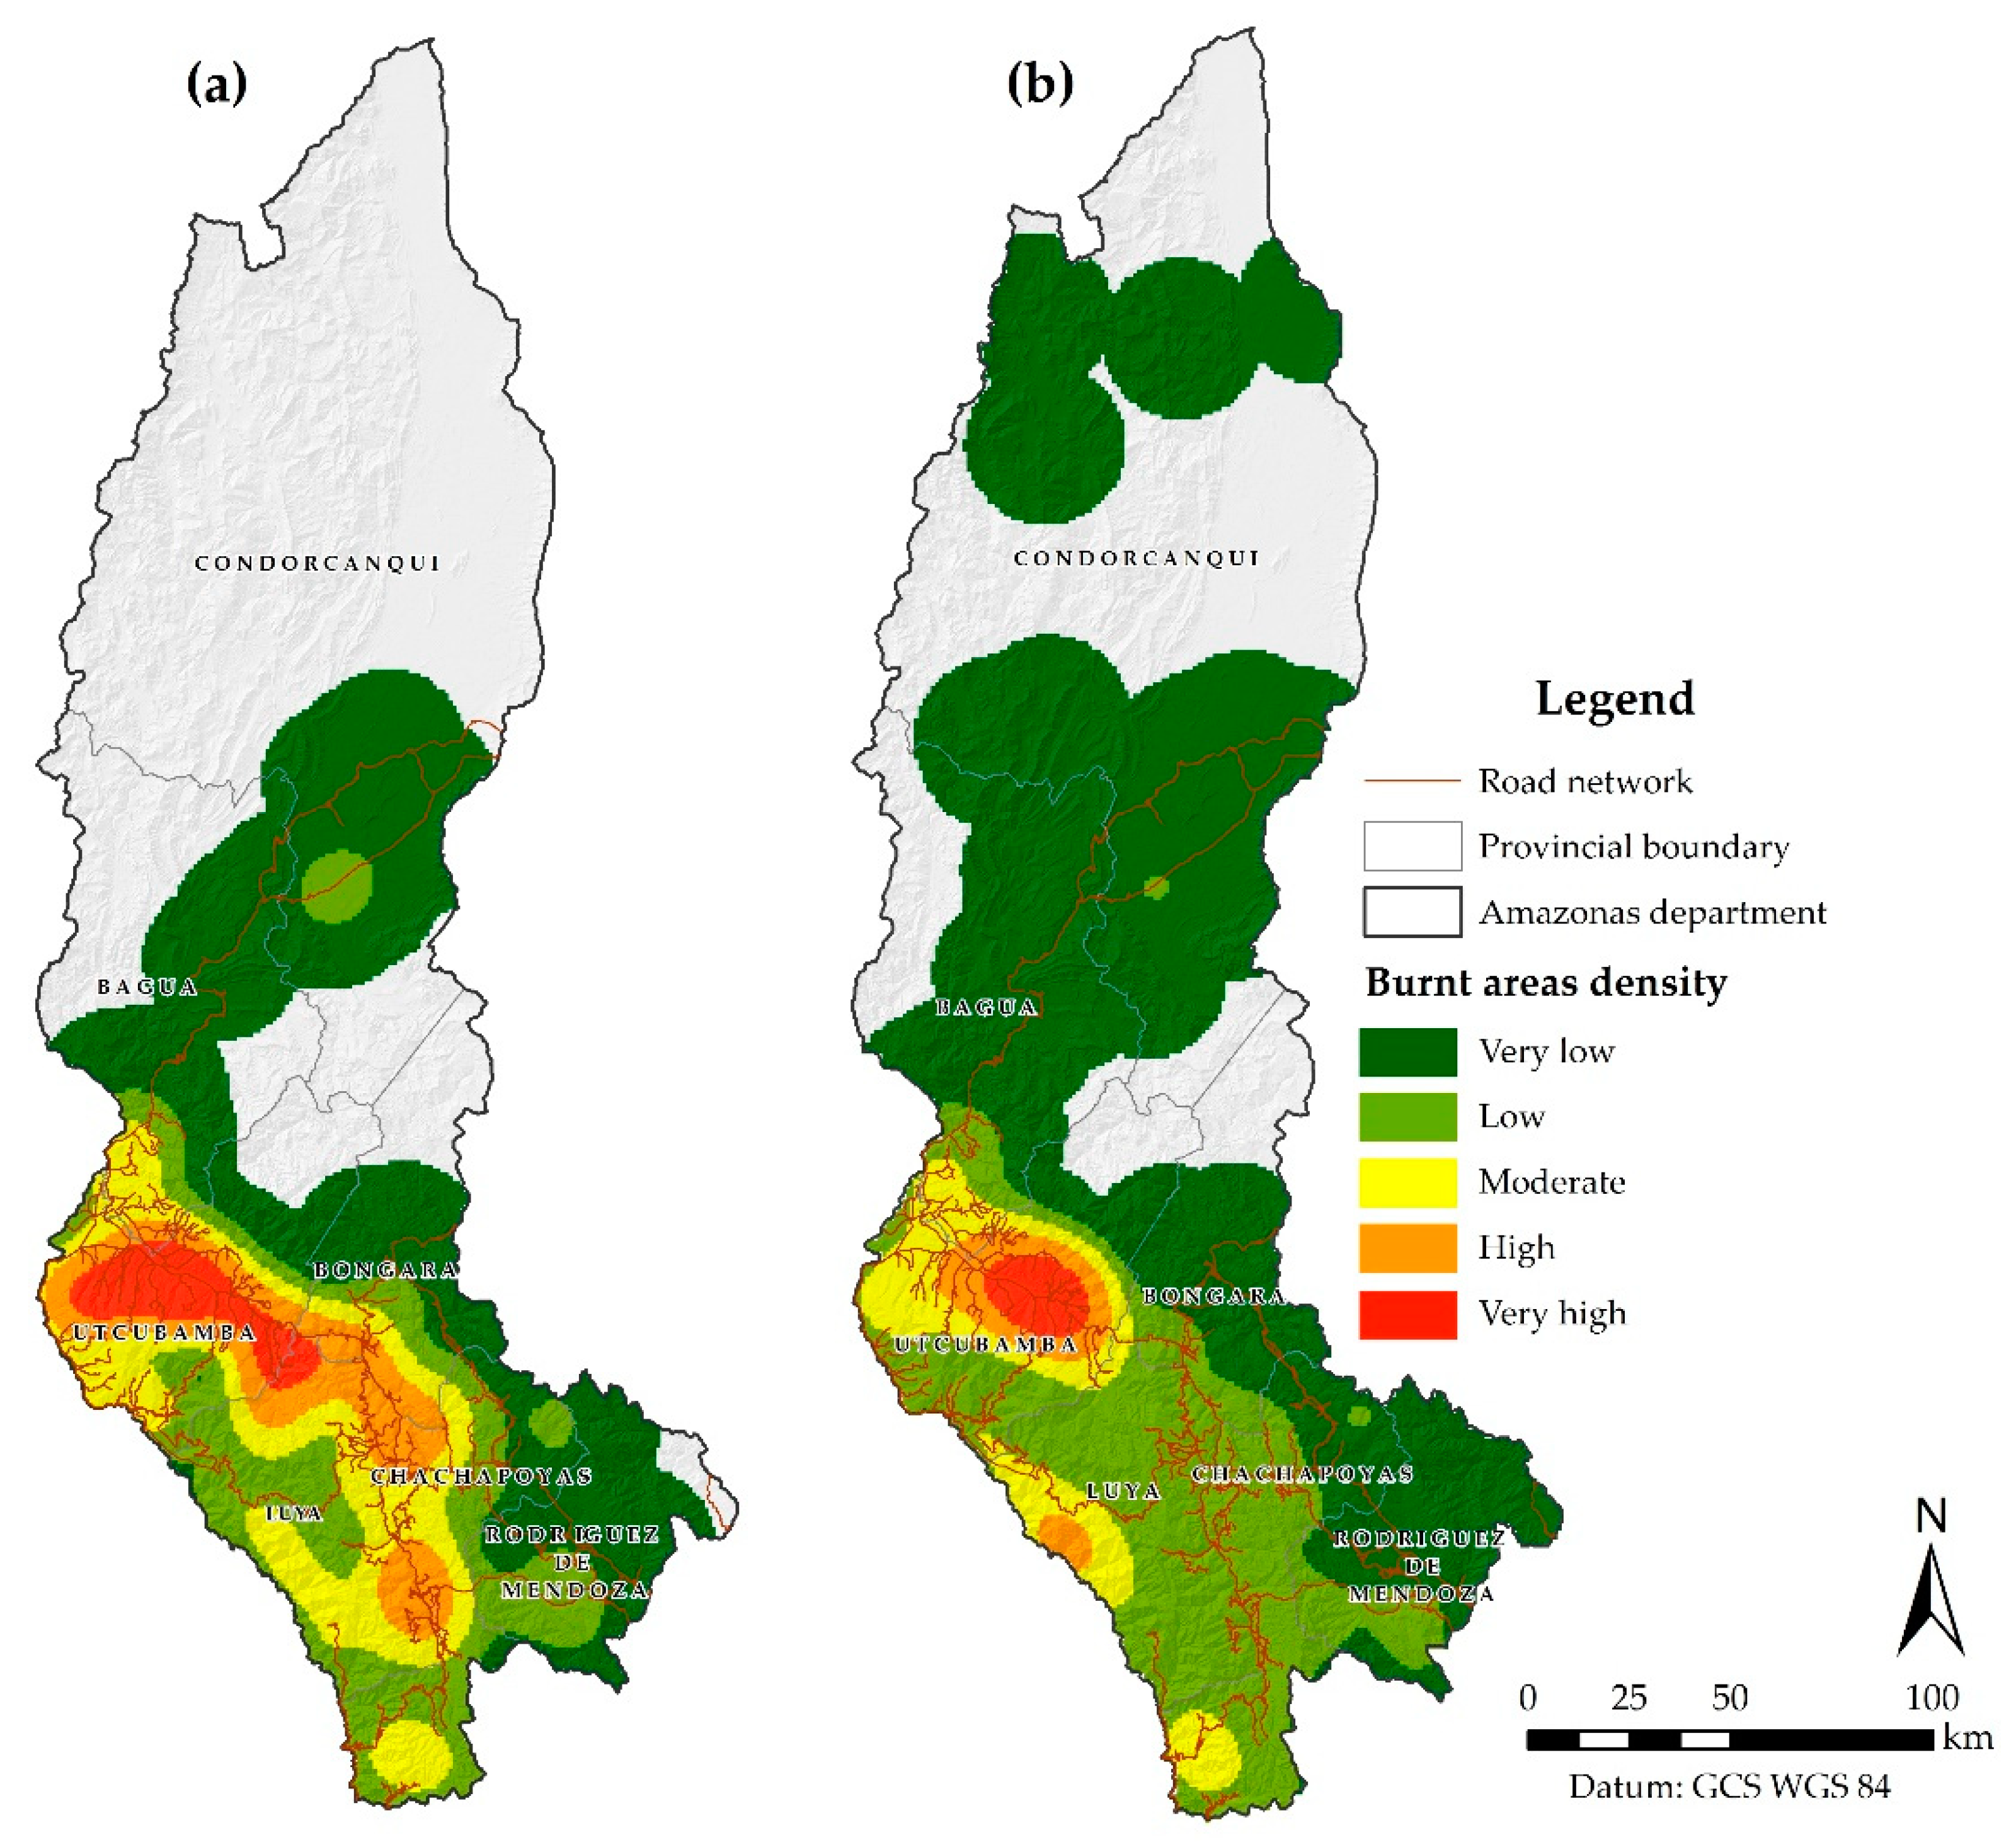
3.4. Patterns of BA Density

The maps elaborated based on the KDE method considering the three-year time detection of BA using the Landsat-8 and Sentinel-2 products (Figure 9) show “very high”, “high”, and “moderate” wildfires densities in the southwest of the Amazonas department, amid Utcubamba, Luya, Chachapoyas, and Bongará provinces. This indicates that environmental policies and actions should pay greater attention to such vulnerable areas. On the other hand, the provinces Rodríguez de Mendoza, Bagua, and Condorcanqui register “low” and “very low” densities within their territories (Figure 9).
It was observed that wildfires take place near human settlements (populated areas) and the road network. Approximately 20% of fires are located within a distance to settlements and roads from 0 to 600 m, 20% between 600 and 1200 m, and the remaining 60% of these events occur beyond 1200 m of distance (Supplementary Materials Figure S1). The wildfires in the study area mostly started on sites with slopes greater than 8° (nearly 90% of all events) and only 10% of them occur on sites with slopes between 0° and 8° (Figure S2 and Table S8). With respect to the settlements’ proximity, the majority of fires (90%) start within distances superior to 1600 m (Figure S3 and Table S8).
The spatial agreement between BA resulting from Landsat-8 and Sentinel-2 is shown in Table 6. In 2017, the agreeing BA and unburnt areas (UA) between these two products had a surface of 3.51 and 39,277.04 km2, respectively, with an omission error of 0.21 and an extension coefficient of 1.00. In 2018, the agreeing BA had a size of 2.35 km2 and an agreeing UA of 39,224.09 km2, presenting an omission error of 0.38 and an extension coefficient of 1.00. In 2019, there was an increase in the BA spatial agreement with regard to previous years (totaling an area of 18.88 km2) and the agreeing UA was limited to 39,225.23 km2, with an omission error of 0.57 and an extension coefficient of 1.00. The Q coefficient, in its turn, presented values of 1.00, 0.99, and 1.00 for the years 2017, 2018, and 2019, respectively.

4. Discussion

In the present study, a comparative performance evaluation of BA products derived from Landsat-8 and Sentinel-2 medium spatial resolution imagery was accomplished. These products were generated for the northeastern Peruvian Amazon by means of an open access decision rules-based routine implemented in the GEE cloud computing platform (Table S1). The accuracy of such products were assessed using error matrices and accuracy indices relying on a common reference dataset, created according to a stratified random sampling design [71,81]. The overall accuracy ranged from 82.7% to 98.5%, which indicates a satisfactory performance of the proposed routine for identifying burnt and unburnt areas. The Sentinel-2 products present greater OA (94.5–98.5%) than Landsat-8 (82.7–91.4%). This can be explained by the fact that the Peruvian Amazon has a wet climate and cloud-free Landsat-8 images are rare (16 days of temporal resolution) [82], while Sentinel-2 presents a better temporal (5 days) and spatial (10–20 m) resolution, with greater availability of images, which tends to improve the detection of BA [67].
The comparison between the Landsat-8 and Sentinel-2 products proved to be of value for a sound detection of BA in the Peruvian Amazon. The literature generally reports that Sentinel-2 offers higher accuracies [12,83], while some authors consider that Landsat-8 is superior to Sentinel-2 when compared with MCD64A1 products [60,84]. According to such authors, Landsat-8 owns better spectral bands than Sentinel-2. Other works integrate both Landsat-8 and Sentinel-2 products to improve BA estimates [85,86,87]. In this study, however, the comparison with further products, such as the series of “MODIS Combined Data” (MCD45, MCD64) and the “Fire Climate Change Initiative” (FIRE CCI), has not been made in the face of their unfeasible application in the Amazon region [4], due to large differences in spatial resolution [60]. Some studies have used the product MCD64A1 (coarse resolution) to detect wildfires at a global scale [88,89,90,91,92,93], but it is unable to detect small and spatially fragmented BA, with which the Landsat-8 and Sentinel-2 products can easily cope [60,94]. On the other hand, several techniques and methodologies have been proposed for mapping BA. One of the most often used procedures regards the bitemporal images that combine algebraic operations [4], such as the calculation of spectral indices (NDVI, NBR, NBR2, and MIRBI), and the pre and post-fire temporal differences between them (dMIRBI, dNBR, dNBR2, and dNIR), which improve the detection of changes in the vegetation cover, and hence, the identification of BA.
The wildfires in the study area generally take place from June to December (Figure 7). Manríquez-Zapata [42] reports that fires in the vegetation cover occur in the third and fourth quarters of the year (July to December). This temporal behavior is associated with the change from the wet to the dry season [95], and with meteorological factors (high temperatures, low rainfall rates, and low relative air humidity) and climate change, which together create favorable conditions for wildfires occurrence and drastically impact the local ecosystem’s processes [41,50,96]. All these considerations demonstrate the importance of assessing and taking into account both human and environmental driving factors of wildfires for proper landscape planning and management [76].
The maps of wildfires densities allow the visualization of priority areas to support decision making and resources allocation processes, with the aim to reduce the risk of wildfires and to mitigate their environmental, social, and economic impacts. Moreover, they are useful inputs for landscape planning and management at local, regional, and global scales [76]. Alternately, unraveling the ignition sources of wildfires is also an important task, considering that they are greatly dependent on the relief, natural combustion components (vegetation, soil moisture), and meteorological characteristics [97]. The density of and the distance to roads favor the appearance of susceptible zones to accidental fires, i.e., those unintentionally caused by people, since they enable human activities and displacement [97,98]. The human presence is a major factor that influences the occurrence of wildfires, particularly near populated areas [99]. Unemployment tax and hard living conditions are important socioeconomic variables that lead to the overexploitation of natural resources, which can imminently cause accidental fires [97,98]. Such fires can also be a direct consequence of inappropriate cultural practices of the locals. The terrain slope, in its turn, favors the vertical continuity of vegetation, and hence, the emergence of hillside winds that ease the propagation of wildfires [100,101].
In the Peruvian Amazon, this type of investigation at a national scale is of strategic importance, in face of the fact that the wildfires occur as a direct consequence of agricultural activities (cropping and cattle raising) undertaken in small rural properties (<0.05 km2) [102]. In this sense, this study contributed with a decision rules-based routine for detecting and monitoring vegetation cover areas (including forests, bushlands, grassy shrublands, and pastures) affected by wildfires by means of remote sensing techniques that allowed the quantification of BA in the Amazonas department. The generated information can be used by authorities and decision makers in the design of policies and strategies targeted to prevent, control, and/or mitigate the risk of wildfires. The proposed routine can be further applied to the whole Peruvian Amazon, provided that minor adjustments to the methodology are duly made. Finally, we ought to remind that if one intends to assess the historical series of BA in the last four decades (1984–2020) with free satellite imagery, the data from Landsat-5, 7, and 8 can be used. If one otherwise wishes to identify more recent BA and with a greater level of detail, the data from Sentinel-2, launched in June 2015, are appropriate.
Among the limitations of this study, the first one to be cited is the limited availability of cloud-free Landsat-8 and Sentinel-2 images, due to the presence of clouds throughout the year in the study area. This is the reason why we applied the CFMASK algorithm to the Landsat-8 images and CloudScore and the TDOM to Sentinel-2 images. A possible alternative to overcome the reduced availability of images would be the combination of the two collections. Another solution would be the use of the Sentinel-1 mission radar, which is equipped with a Synthetic Aperture Radar (SAR) that collects data regardless of the weather conditions [103,104,105] and improves the detection of vegetation change in the presence of high cloud cover. Additionally, a further alternative for cloud and cloud shadow detection and masking in Sentinel-2 images would be the use of machine learning [106] and deep learning approaches [107]. The second limitation regards the methodological challenges for discriminating wildfires from fires in rice crops adopted as a rice straw management practice. This differentiation requires great expertise from the interpreter conducting the supervised learning. In the case of collaborative mapping in well-known areas, such discrimination is still possible, but it is seriously limited in the classification of unknown areas.

5. Conclusions

This study evaluated the potential of a decision rules-based routine relying on Landsat-8 and Sentinel-2 medium spatial resolution imagery to estimate BA in the northeastern Peruvian Amazon. These estimates were executed through training and supervised classification in the cloud-based GEE platform. The results obtained by the two satellites’ imagery were compared in terms of accuracy metrics and level of detail (size of BA patches). This is an unprecedented initiative, given that similar products have been reported for the Peruvian Amazon, especially the Amazonas department, but none of them have used Sentinel-2 data. This study relied on different procedures and products for mapping BA, making use of spectral indices extracted from pre and post-fire images (dMIRBI, dNBR, dNBR2, and dNIR).
The BA resulting from Sentinel-2 were comparatively larger in extension (km2) and presented higher accuracies than the ones derived from Landsat-8. The spectral indices MIRBI, NBR, and NBR2 and the NIR band produced the best results for identifying burnt areas in the Peruvian Amazon. The applied methodology showed promising results for mapping BA, revealing its feasibility to further support the assessment of BA environmental impacts at regional, national, and global levels as well as to subsidize measures for wildfires risk management.

Supplementary Materials

The following are available online at https://www.mdpi.com/2220-9964/9/10/564/s1, Figure S1: Maps of wildfires burn scars proximity to the road network; (a) BA resulting from Landsat-8; (b) BA resulting from Sentinel-2. Figure S2: Maps of wildfires burn scars superimposed on slope ranges; (a) BA resulting from Landsat-8; (b) BA resulting from Sentinel-2. Figure S3. Maps of wildfires burn scars proximity to populated areas; (a) BA resulting from Landsat-8; (b) BA resulting from Sentinel-2. Table S1. Scripts developed for the classification of burnt areas (BA) in the Amazonas department. Table S2. Statistical validation of burnt areas for the Landsat-8 product in 2017. Table S3. Statistical validation of burnt areas for the Landsat-8 product in 2018. Table S4. Statistical validation of burnt areas for the Landsat-8 product in 2019. Table S5. Statistical validation of burnt areas for the Sentinel-2 product in 2017. Table S6. Statistical validation of burnt areas for the Sentinel-2 product in 2018. Table S7. Statistical validation of burnt areas for the Sentinel-2 product in 2019. Table S8. Analyses of the burnt areas’ spatial distribution with respect to slope and proximity to roads and populated areas for the Landsat-8 and Sentinel-2 products.

Author Contributions

Conceptualization, Elgar Barboza Castillo, Efrain Y. Turpo Cayo, Cláudia Maria de Almeida, Rolando Salas López and Nilton B. Rojas Briceño; Data curation, Elgar Barboza Castillo, Efrain Y. Turpo Cayo, Cláudia Maria de Almeida and Nilton B. Rojas Briceño; Formal analysis, Elgar Barboza Castillo, Efrain Y. Turpo Cayo and Cláudia Maria de Almeida; Funding acquisition, Rolando Salas López, Miguel Ángel Barrena Gurbillón and Manuel Oliva; Investigation, Elgar Barboza Castillo, Efrain Y. Turpo Cayo, Cláudia Maria de Almeida, Rolando Salas López, Nilton B. Rojas Briceño, Jhonsy Omar Silva López, Miguel Ángel Barrena Gurbillón, Manuel Oliva and Raul Espinoza-Villar; Methodology, Elgar Barboza Castillo, Efrain Y. Turpo Cayo, Cláudia Maria de Almeida, Rolando Salas López, Nilton B. Rojas Briceño, Jhonsy Omar Silva López and Raul Espinoza-Villar; Project administration, Rolando Salas López and Manuel Oliva; Resources, Manuel Oliva; Software, Elgar Barboza Castillo and Efrain Y. Turpo Cayo; Supervision, Cláudia Maria de Almeida, Rolando Salas López, Miguel Ángel Barrena Gurbillón, Manuel Oliva and Raul Espinoza-Villar; Validation, Cláudia Maria de Almeida, Nilton B. Rojas Briceño, Jhonsy Omar Silva López and Raul Espinoza-Villar; Visualization, Cláudia Maria de Almeida, Miguel Ángel Barrena Gurbillón, Manuel Oliva and Raul Espinoza-Villar; Writing—original draft, Elgar Barboza Castillo and Efrain Y. Turpo Cayo; Writing—review and editing, Elgar Barboza Castillo, Efrain Y. Turpo Cayo, Cláudia Maria de Almeida, Rolando Salas López, Nilton B. Rojas Briceño, Jhonsy Omar Silva López, Miguel Ángel Barrena Gurbillón, Manuel Oliva and Raul Espinoza-Villar. All authors have read and agreed to the published version of the manuscript.

Funding

This work was carried out with the support of the Public Investment Project GEOMATICA (SNIP No. 312235), executed by the Research Institute for Sustainable Development in Highland Forests (INDES-CES) of the National University Toribio Rodríguez de Mendoza de Amazonas (UNTRM). We also would like to thank the support of the National Council for Scientific and Technological Development through Grant Number: CNPq 303523/2018-2.

Acknowledgments

The authors acknowledge the valuable contributions of a group of colleagues. Armando Rodriguez Montellano, Rodney Camargo Arce from the Fundación Amigos de la Naturaleza (FAN) and Jesús A. Anaya from the Universidad de Medellín, for their contributions to the development of the methodology and script for the detection of burned areas through the analysis of time series. We would also like to thank the Instituto de Investigación para el Desarrollo Sustentable de Ceja de Selva (INDES-CES) of the Universidad Nacional Toribio Rodríguez de Mendoza de Amazonas (UNTRM). Finally, the authors express their gratitude for the thorough work of the two anonymous reviewers, who greatly improved the quality of this manuscript.

Conflicts of Interest

The authors declare no conflict of interest.

References

  1. Estrela Navarro, M.J.; Pastor Guzmán, F.; Valiente Pardo, J.A.; Alloza, J.A. Integración de una cartografía de vientos en situaciones meteorológicas de riesgo de incendios forestales en la Comunidad Valenciana mediante un SIG. GeoFocus 2005, 5, 94–114. [Google Scholar]
  2. Garrido, J.; Vilar, L.; Echevarría, P.; Martinez-Vega, J.; Martín, M.P. ¿Pueden las interfaces de usos del suelo explicar la ocurrencia de incendios forestales a escala provincial? Los casos de Zamora y Madrid. GeoFocus 2018, 71–95. [Google Scholar] [CrossRef]
  3. Bastarrika, A.; Alvarado, M.; Artano, K.; Martinez, M.P.; Mesanza, A.; Torre, L.; Ramo, R.; Chuvieco, E. BAMS: A tool for supervised burned area mapping using Landsat data. Remote Sens. 2014, 6, 12360–12380. [Google Scholar] [CrossRef] [Green Version]
  4. Santana, N.C.; Júnior, O.A.D.C.; Gomes, R.A.T.; Guimarães, R.F. Burned-area detection in Amazonian environments using standardized time series per pixel in MODIS data. Remote Sens. 2018, 10, 1904. [Google Scholar] [CrossRef] [Green Version]
  5. Gilroy, J.J.; Woodcock, P.; Edwards, F.A.; Wheeler, C.; Baptiste, B.L.G.; Medina Uribe, C.A.; Haugaasen, T.; Edwards, D.P. Cheap carbon and biodiversity co-benefits from forest regeneration in a hotspot of endemism. Nat. Clim. Chang. 2014, 4, 503–507. [Google Scholar] [CrossRef]
  6. Lewis, S.L.; Edwards, D.P.; Galbraith, D. Increasing human dominance of tropical forests. Science 2015, 349, 827–832. [Google Scholar] [CrossRef]
  7. Alencar, A.A.C.; Solórzano, L.A.; Nepstad, D.C. Modeling forest understory fires in an eastern amazonian landscape. Ecol. Appl. 2004, 14, 139–149. [Google Scholar] [CrossRef] [Green Version]
  8. Gutiérrez-Velez, V.H.; Uriarte, M.; Defries, R.; Pinedo-Vasquez, M.; Fernandes, K.; Ceccato, P.; Baethgen, W.; Padoch, C. Land cover change interacts with drought severity to change fire regimes in Western Amazonia. Ecol. Appl. 2014, 24, 1323–1340. [Google Scholar] [CrossRef]
  9. Martin, A.; Coolsaet, B.; Corbera, E.; Dawson, N.; Fisher, J.; Franks, P.; Mertz, O.; Pascual, U.; Rasmussen, L.V.; Ryan, C. Land use intensification: The promise of sustainability and the reality of trade-offs. Ecosyst. Serv. Poverty Alleviation Trade-Offs Gov. 2018, 94–110, ffhalshs-01788070. [Google Scholar]
  10. Pereira, J.M.C.; Sá, A.C.L.; Sousa, A.M.O.; Silva, J.M.N.; Santos, T.N.; Carreiras, J.M.B. Spectral characterisation and discrimination of burnt areas. Remote Sens. Large Wildfires 1999, 123–138. [Google Scholar] [CrossRef]
  11. Barbosa, P.M.; Stroppiana, D.; Grégoire, J.M.; Pereira, J.M.C. An assessment of vegetation fire in Africa (1981–1991): Burned areas, burned biomass, and atmospheric emissions. Glob. Biogeochem. Cycles 1999, 13, 933–950. [Google Scholar] [CrossRef]
  12. Roteta, E.; Bastarrika, A.; Padilla, M.; Storm, T.; Chuvieco, E. Development of a Sentinel-2 burned area algorithm: Generation of a small fire database for sub-Saharan Africa. Remote Sens. Environ. 2019, 222, 1–17. [Google Scholar] [CrossRef]
  13. Wulder, M.A.; Masek, J.G.; Cohen, W.B.; Loveland, T.R.; Woodcock, C.E. Opening the archive: How free data has enabled the science and monitoring promise of Landsat. Remote Sens. Environ. 2012, 122, 2–10. [Google Scholar] [CrossRef]
  14. Gorelick, N.; Hancher, M.; Dixon, M.; Ilyushchenko, S.; Thau, D.; Moore, R. Google Earth Engine: Planetary-scale geospatial analysis for everyone. Remote Sens. Environ. 2017, 202, 18–27. [Google Scholar] [CrossRef]
  15. Chuvieco, E.; Mouillot, F.; van der Werf, G.R.; San Miguel, J.; Tanasse, M.; Koutsias, N.; García, M.; Yebra, M.; Padilla, M.; Gitas, I.; et al. Historical background and current developments for mapping burned area from satellite Earth observation. Remote Sens. Environ. 2019, 225, 45–64. [Google Scholar] [CrossRef]
  16. Dennison, P.E.; Brewer, S.C.; Arnold, J.D.; Moritz, M.A. Large wildfire trends in the western United States, States, 1984–2011. Geophys. Prospect. 2014, 6413–6419. [Google Scholar] [CrossRef]
  17. Abatzoglou, J.T.; Williams, A.P. Impact of anthropogenic climate change on wildfire across western US forests. Proc. Natl. Acad. Sci. USA 2016, 113, 11770–11775. [Google Scholar] [CrossRef] [Green Version]
  18. Sakr, G.E.; Elhajj, I.H.; Mitri, G. Efficient forest fire occurrence prediction for developing countries using two weather parameters. Eng. Appl. Artif. Intell. 2011, 24, 888–894. [Google Scholar] [CrossRef]
  19. Hawbaker, T.J.; Vanderhoof, M.K.; Beal, Y.J.; Takacs, J.D.; Schmidt, G.L.; Falgout, J.T.; Williams, B.; Fairaux, N.M.; Caldwell, M.K.; Picotte, J.J.; et al. Mapping burned areas using dense time-series of Landsat data. Remote Sens. Environ. 2017, 198, 504–522. [Google Scholar] [CrossRef]
  20. Chen, J.C.; Chen, C.T. Discourse on Taiwanese Forest Fires. In Wildfire Hazards, Risks, and Disasters; Elsevier Inc.: Amsterdam, The Netherlands, 2015; pp. 145–166. ISBN 9780124096011. [Google Scholar]
  21. Chuvieco, E.; Congalton, R.G. Mapping and inventory of forest fires from digital processing of tm data Mapping and Inventory of Forest Fires from Digital Processing of TM Data. Geocarto Int. 2008, 3, 41–53. [Google Scholar] [CrossRef]
  22. Bourgeau-Chavez, L.L.; Kasischke, E.S.; Brunzell, S.; Mudd, J.P.; Tukman, M. Mapping fire scars in global boreal forests using imaging radar data. Int. J. Remote Sens. 2002, 23, 4211–4234. [Google Scholar] [CrossRef]
  23. Verdú, F.; Salas, J. Cartografía de áreas quemadas mediante análisis visual de imágenes de satélite en la España peninsular para el periodo 1991–2005. GeoFocus 2010, 10, 54–81. [Google Scholar]
  24. Al Janabi, S.; Al Shourbaji, I.; Salman, M.A. Assessing the suitability of soft computing approaches for forest fires prediction. Appl. Comput. Inform. 2018, 14, 214–224. [Google Scholar] [CrossRef]
  25. Artés, T.; Cortés, A.; Margalef, T. Large forest fire spread prediction: Data and computational science. Procedia Comput. Sci. 2016, 80, 909–918. [Google Scholar] [CrossRef] [Green Version]
  26. Feng, X.; Fu, T.M.; Cao, H.; Tian, H.; Fan, Q.; Chen, X. Neural network predictions of pollutant emissions from open burning of crop residues: Application to air quality forecasts in southern China. Atmos. Environ. 2019, 204, 22–31. [Google Scholar] [CrossRef]
  27. Muñoz, C.; Acevedo, P.; Salvo, S.; Fagalde, G.; Vargas, F. Detección de incendios forestales utilizando imágenes NOAA/16-LAC en la Región de la Araucanía, Chile. Bosque 2007, 28, 119–128. [Google Scholar] [CrossRef] [Green Version]
  28. Ngoc-Thach, N.; Bao-Toan Ngo, D.; Xuan-Canh, P.; Hong-Thi, N.; Hang Thi, B.; Nhat-Duc, H.; Dieu, T.B. Spatial pattern assessment of tropical forest fire danger at Thuan Chau area (Vietnam) using GIS-based advanced machine learning algorithms: A comparative study. Ecol. Inform. 2018, 46, 74–85. [Google Scholar] [CrossRef]
  29. Collins, L.; Griffioen, P.; Newell, G.; Mellor, A. The utility of Random Forests for wildfire severity mapping. Remote Sens. Environ. 2018, 216, 374–384. [Google Scholar] [CrossRef]
  30. Hislop, S.; Haywood, A.; Jones, S.; Soto-Berelov, M.; Skidmore, A.; Nguyen, T.H. A satellite data driven approach to monitoring and reporting fire disturbance and recovery across boreal and temperate forests. Int. J. Appl. Earth Obs. Geoinf. 2020, 87, 102034. [Google Scholar] [CrossRef]
  31. Bastarrika, A.; Chuvieco, E.; Martín, M.P. Mapping burned areas from Landsat TM/ETM+ data with a two-phase algorithm: Balancing omission and commission errors. Remote Sens. Environ. 2011, 115, 1003–1012. [Google Scholar] [CrossRef]
  32. Goodwin, N.R.; Collett, L.J. Development of an automated method for mapping fire history captured in Landsat TM and ETM+ time series across Queensland, Australia. Remote Sens. Environ. 2014, 148, 206–221. [Google Scholar] [CrossRef]
  33. Stroppiana, D.; Azar, R.; Calò, F.; Pepe, A.; Imperatore, P.; Boschetti, M.; Silva, J.M.N.; Brivio, P.A.; Lanari, R. Integration of Optical and SAR Data for Burned Area Mapping in Mediterranean Regions. Remote Sens. 2015, 7, 1320–1345. [Google Scholar] [CrossRef] [Green Version]
  34. Fornacca, D.; Ren, G.; Xiao, W. Evaluating the best spectral indices for the detection of burn scars at several post-fire dates in a Mountainous Region of Northwest Yunnan, China. Remote Sens. 2018, 10, 1196. [Google Scholar] [CrossRef] [Green Version]
  35. Guillem-Cogollos, R.; Vinué-Visús, D.; Caselles-Miralles, V.; Espinós-Morató, H. Estudio crítico de los índices de severidad y la superficie afectada por el incendio de Sierra de Luna (Zaragoza). Revista de Teledeteccion 2017, 49, 63–77. [Google Scholar] [CrossRef] [Green Version]
  36. Key, C.H.; Benson, N. The Normalized Burn Ratio (NBR): A Landsat TM Radiometric Measure of Burn Severity; United States Geological Survey, Northern Rocky Mountain Science Center: Bozeman, MT, USA, 2003. Available online: https://www.frames.gov/catalog/5860 (accessed on 27 May 2020).
  37. Teobaldo, D.; de Mello Baptista, G.M. Quantificação da severidade das queimadas e da perda de sequestro florestal de carbono em unidades de conservação do Distrito Federal. Rev. Bras. Geogr. Física 2016, 9, 250–264. [Google Scholar] [CrossRef]
  38. Trigg, S.; Flasse, S. An evaluation of di V erent bi-spectral spaces for discriminating burned. Int. J. Remote Sens. 2001, 22, 2641–2647. [Google Scholar] [CrossRef]
  39. López García, M.J.; Caselles, V. Mapping burns and natural reforestation using thematic mapper data. Geocarto Int. 1991, 6, 31–37. [Google Scholar] [CrossRef]
  40. Rouse, J.W.; Haas, R.H.; Schell, J.A. Monitoring the Vernal Advancement and Retrogradation (Greenwave Effect) of Natural Vegetation; Final Report; NASA/GSFC: Greenbelt, MD, USA, 1974. Available online: https://ntrs.nasa.gov/citations/19740022555 (accessed on 10 May 2020).
  41. SERFOR. Plan de Prevención y Reducción de Riesgos de Incendios Forestales; SERFOR: Lima, Peru, 2018; Available online: http://siar.minam.gob.pe/puno/sites/default/files/archivos/public/docs/plan-de-prevencion-y-reduccion-de-riesgos-de-incendios-forestales.pdf (accessed on 10 April 2020).
  42. Manríquez Zapata, H.M. Especies forestales afectadas en incendios ocurridos en Amazonas: Un análisis de la información fiscal de los casos de Chachapoyas y Luya. Arnaldoa 2019, 26, 965–976. [Google Scholar] [CrossRef]
  43. Vilar, L.; Gómez, I.; Martínez-vega, J.; Echavarría, P.; Ria, D. Multitemporal modelling of socio-economic wildfire drivers in Central Spain between the 1980s and the 2000s: Comparing generalized linear models to machine learning algorithms. PLoS ONE 2016, 11, 1–17. [Google Scholar] [CrossRef] [Green Version]
  44. INEI. Censos Nacionales de Población y Vivienda. 2017. Available online: http://censos2017.inei.gob.pe/redatam/ (accessed on 11 June 2020).
  45. GRA; IIAP. Zonificación Ecológica y Económica (ZEE) del Departamento de Amazonas; GRA and IIAP: Iquitos, Peru, 2010. [Google Scholar]
  46. Rojas, N.B.; Barboza, E.; Torres, O.A.G.; Oliva, M.; Leiva, D.; Barrena, M.Á.; Corroto, F.; Salas, R.; Rascón, J. Morphometric prioritization, fluvial classification, and hydrogeomorphological quality in high Andean livestock micro-watersheds in northern Peru. ISPRS Int. J. Geo-Inf. 2020, 9, 305. [Google Scholar] [CrossRef]
  47. Vargas, J. Clima, informe temático. Proyecto Zonificación Ecológica y Económica del departamento de Amazonas, Instituto de Investigaciones de la Amazonía Peruana (IIAP) & Programa de Investigaciones en Cambio Climático, Desarrollo Territorial y Ambiente (PROTERRA); Gobierno Regional de Amazonas e Instituto de Investigaciones de la Amazonía Peruana: Chachapoyas, Peru, 2010; Volume 1, pp. 1–27. Available online: https://docplayer.es/57855699-Zonificacion-ecologica-y-economica-del.html (accessed on 25 May 2020).
  48. MapBiomas. Documento Base Teórico de Algoritmos (ATBD): RAISG—MapBiomas Amazonía—Colección 1. 2019. Available online: http://mapbiomas.org (accessed on 5 June 2020).
  49. MINAM. Estudio para la Identificación de Áreas Degradadas y Propuesta de Monitoreo; MINAM: Lima, Peru, 2017. [Google Scholar]
  50. CENEPRED. Caracterización del peligro por incendios forestales; CENEPRED: Lima, Peru, 2018. [Google Scholar]
  51. MINAM. GEOBOSQUES: Bosque y Pérdida de Bosque. Available online: http://geobosques.minam.gob.pe/geobosque/view/perdida.php (accessed on 15 April 2019).
  52. FIRMS. Fire Information for Resource Management Systems. 2020. Available online: https://firms.modaps.eosdis.nasa.gov/map/#d:2020-09-17..2020-09-18;@0.6,-0.3,3z (accessed on 19 September 2020).
  53. SERFOR. Incendios Forestales. 2020. Available online: https://geo.serfor.gob.pe/monitoreosatelitalforestal/incendios.html (accessed on 19 September 2020).
  54. Tamiminia, H.; Salehi, B.; Mahdianpari, M.; Quackenbush, L.; Adeli, S.; Brisco, B. Google Earth Engine for geo-big data applications: A meta-analysis and systematic review. ISPRS J. Photogramm. Remote Sens. 2020, 164, 152–170. [Google Scholar] [CrossRef]
  55. Arekhi, M.; Goksel, C.; Sanli, F.B.; Senel, G. Comparative evaluation of the spectral and spatial consistency of Sentinel-2 and Landsat-8 OLI data for Igneada longos forest. ISPRS Int. J. Geo-Inf. 2019, 8, 56. [Google Scholar] [CrossRef] [Green Version]
  56. Foga, S.; Scaramuzza, P.L.; Guo, S.; Zhu, Z.; Dilley, R.D.; Beckmann, T.; Schmidt, G.L.; Dwyer, J.L.; Joseph Hughes, M.; Laue, B. Cloud detection algorithm comparison and validation for operational Landsat data products. Remote Sens. Environ. 2017, 194, 379–390. [Google Scholar] [CrossRef] [Green Version]
  57. Samsammurphy Cloud Masking with Sentinel 2. 2017. Available online: https://github.com/samsammurphy/cloud-masking-sentinel2/blob/master/cloud-masking-sentinel2.ipynb (accessed on 23 April 2020).
  58. Hollstein, A.; Segl, K.; Guanter, L.; Brell, M.; Enesco, M. Ready-to-use methods for the detection of clouds, cirrus, snow, shadow, water and clear sky pixels in Sentinel-2 MSI images. Remote Sens. 2016, 8, 666. [Google Scholar] [CrossRef] [Green Version]
  59. McFeeters, S.K. The use of the Normalized Difference Water Index (NDWI) in the delineation of open water features. Int. J. Remote Sens. 1996, 17, 1425–1432. [Google Scholar] [CrossRef]
  60. Bar, S.; Parida, B.R.; Chandra Pandey, A. Landsat-8 and Sentinel-2 based Forest fire burn area mapping using machine learning algorithms on GEE cloud platform over Uttarakhand, Western Himalaya. Remote Sens. Appl. Soc. Environ. 2020, 100324. [Google Scholar] [CrossRef]
  61. Rouse, J.W.; Hass, R.H.; Schell, J.A.; Deering, D.W. Monitoring vegetation systems in the great plains with ERTS. In Proceedings of the Third Earth Resources Technology Satellite-1 Symposium, Washington, DC, USA, 10–14 December 1973; Volume 1, pp. 309–317. [Google Scholar]
  62. Gao, X.; Huete, A.R.; Ni, W.; Miura, T. Optical-biophysical relationships of vegetation spectra without background contamination. Remote Sens. Environ. 2000, 74, 609–620. [Google Scholar] [CrossRef]
  63. Huete, A.R. A Soil-Adjusted Vegetation Index (SAVI). Remote Sens. Environ. 1988, 25, 295–309. [Google Scholar] [CrossRef]
  64. Schepers, L.; Haest, B.; Veraverbeke, S.; Spanhove, T.; Vanden Borre, J.; Goossens, R. Burned area detection and burn severity assessment of a heathland fire in belgium using airborne imaging spectroscopy (APEX). Remote Sens. 2014, 6, 1803–1826. [Google Scholar] [CrossRef] [Green Version]
  65. McCarley, T.R.; Kolden, C.A.; Vaillant, N.M.; Hudak, A.T.; Smith, A.M.S.; Wing, B.M.; Kellogg, B.S.; Kreitler, J. Multi-temporal LiDAR and Landsat quantification of fire-induced changes to forest structure. Remote Sens. Environ. 2017, 191, 419–432. [Google Scholar] [CrossRef] [Green Version]
  66. Key, C.; Benson, N. Landscape Assessment: Sampling and Analysis Methods; USDA For. Serv. Gen. Technol. Rep. RMRS-GTR-164-CD; USDA Forest Service: Washington, DC, USA, 2006; pp. 1–55. Available online: https://www.fs.usda.gov/treesearch/pubs/24066 (accessed on 23 June 2020).
  67. Anaya, J.A.; Sione, W.F.; Rodríguez-Montellano, A.M. Identificación de áreas quemadas mediante el análisis de series de tiempo en el ámbito de computación en la nube. Rev. Teledetección. 2018, 51, 61–73. [Google Scholar] [CrossRef]
  68. Turpo Cayo, E.Y.; Raul Arnaldo, E.V.; Ríos Cáceres, S.; Moreno Flores, C.N. Mapeo multitemporal de cuerpos de agua y área urbanas en los andes del Perú usando imágenes Landsat en la plataforma Google Earth Engine, periodo 1984–2018. An. do XIX Simpósio Bras. Sensoriamento Remoto. 2018, 3569–3572. Available online: http://marte2.sid.inpe.br/rep/sid.inpe.br/marte2/2019/09.02.18.08?metadatarepository=sid.inpe.br/marte2/2019/09.02.18.08.26&ibiurl.backgroundlanguage=pt&ibiurl.requiredsite=marte2.sid.inpe.br+802&requiredmirror=dpi.inpe.br/marte2/2013/05.17.15.03.08&searchsite=urlib.net:80&searchmirror=dpi.inpe.br/banon/2004/02.16.09.30.00&choice=briefTitleAuthorMisc (accessed on 16 April 2020).
  69. MINAM. Protocolo: Evaluacion de la Exactitud Tematica del Mapa de Deforestación; MINAM: Lima, Peru, 2014. [Google Scholar]
  70. Chuvieco, E. Fundamentals of Satellite Remote Sensing an Environmental Approach, 2nd ed.; CRC Press: Boca Raton, FL, USA, 2016; ISBN 9781498728072. [Google Scholar]
  71. Padilla, M.; Stehman, S.V.; Chuvieco, E. Validation of the 2008 MODIS-MCD45 global burned area product using strati fi ed random sampling. Remote Sens. Environ. 2014, 144, 187–196. [Google Scholar] [CrossRef]
  72. Pontius, R.G.; Millones, M. Death to Kappa: Birth of quantity disagreement and allocation disagreement for accuracy assessment. Int. J. Remote Sens. 2011, 32, 4407–4429. [Google Scholar] [CrossRef]
  73. Sokolova, M.; Lapalme, G. A systematic analysis of performance measures for classification tasks. Inf. Process. Manag. 2009, 45, 427–437. [Google Scholar] [CrossRef]
  74. Pontius, R.G.; Santacruz, A. Quantity, exchange, and shift components of difference in a square contingency table. Int. J. Remote Sens. 2014, 35, 7543–7554. [Google Scholar] [CrossRef]
  75. Brigand, R.; Weller, O. Kernel density estimation and transition maps of Moldavian Neolithic and Eneolithic settlement. Data BR 2018, 17, 452–458. [Google Scholar] [CrossRef]
  76. Monjarás-Vega, N.A.; Briones-Herrera, C.I.; Vega-Nieva, D.J.; Calleros-Flores, E.; Corral-Rivas, J.J.; López-Serrano, P.M.; Pompa-García, M.; Rodríguez-Trejo, D.A.; Carrillo-Parra, A.; González-Cabán, A.; et al. Predicting forest fire kernel density at multiple scales with geographically weighted regression in Mexico. Sci. Total Environ. 2020, 718, 137313. [Google Scholar] [CrossRef]
  77. Rojas, N.B.; Barboza, E.; Maicelo, J.L.; Oliva, S.M.; Salas, R. Deforestación en la Amazonía peruana: Índices de cambios de cobertura y uso del suelo basado en SIG. Boletín la Asoc. Geógrafos Españoles 2019, 1–34. [Google Scholar] [CrossRef]
  78. Jenks, G.F. The data model concept in statistical mapping. Int. Yearb. Cartogr. 1967, 7, 186–190. [Google Scholar]
  79. Yule, G.U. On the Methods of Measuring Association Between Two Attributes. J. R. Stat. Soc. 1912, 75, 579. [Google Scholar] [CrossRef] [Green Version]
  80. de Barros, A. Análise Quantitativa Espacial. Conceitos e Fundamentos; Appris: Salvador, Brazil, 2018; ISBN 9788547314026. [Google Scholar]
  81. Congalton, R.G.; Green, K. Assessing the Accuracy of Remotely Sensed Data: Principles and Practices, 2nd ed.; CRC/Taylor & Francis: Boca Raton, FL, USA, 2009; ISBN 978-1-4200-5512-2. [Google Scholar]
  82. Chaves, P.P.; Zuquim, G.; Ruokolainen, K.; Van doninck, J.; Kalliola, R.; Rivero, E.G.; Tuomisto, H. Mapping floristic patterns of trees in Peruvian Amazonia using remote sensing and machine learning. Remote Sens. 2020, 12, 1523. [Google Scholar] [CrossRef]
  83. Mallinis, G.; Mitsopoulos, I.; Chrysafi, I. Evaluating and comparing Sentinel 2A and landsat-8 operational land imager (OLI) spectral indices for estimating fire severity in a mediterranean pine ecosystem of Greece. GIScience Remote Sens. 2018, 55, 1–18. [Google Scholar] [CrossRef]
  84. Long, T.; Zhang, Z.; He, G.; Jiao, W.; Tang, C.; Wu, B.; Zhang, X.; Wang, G.; Yin, R. 30m resolution global annual burned area mapping based on Landsat images and Google Earth Engine. Remote Sens. 2019, 11, 489. [Google Scholar] [CrossRef] [Green Version]
  85. Roy, D.P.; Huang, H.; Boschetti, L.; Giglio, L.; Yan, L.; Zhang, H.H.; Li, Z. Landsat-8 and Sentinel-2 burned area mapping—A combined sensor multi-temporal change detection approach. Remote Sens. Environ. 2019, 231, 111254. [Google Scholar] [CrossRef]
  86. García-Llamas, P.; Suárez-Seoane, S.; Fernández-Guisuraga, J.M.; Fernández-García, V.; Fernández-Manso, A.; Quintano, C.; Taboada, A.; Marcos, E.; Calvo, L. Evaluation and comparison of Landsat 8, Sentinel-2 and Deimos-1 remote sensing indices for assessing burn severity in Mediterranean fire-prone ecosystems. Int. J. Appl. Earth Obs. Geoinf. 2019, 80, 137–144. [Google Scholar] [CrossRef]
  87. Syifa, M.; Panahi, M.; Lee, C.W. Mapping of post-wildfire burned area using a hybrid algorithm and satellite data: The case of the camp fire wildfire in California, USA. Remote Sens. 2020, 12, 623. [Google Scholar] [CrossRef] [Green Version]
  88. Portillo-Quintero, C.; Sanchez-Azofeifa, A.; Marcos do Espirito-Santo, M. Monitoring deforestation with MODIS Active Fires in Neotropical dry forests: An analysis of local-scale assessments in Mexico, Brazil and Bolivia. J. Arid Environ. 2013, 97, 150–159. [Google Scholar] [CrossRef]
  89. Giglio, L.; Schroeder, W.; Justice, C.O. The collection 6 MODIS active fire detection algorithm and fire products. Remote Sens. Environ. 2016, 178, 31–41. [Google Scholar] [CrossRef] [Green Version]
  90. Giglio, L.; Schroeder, W. A global feasibility assessment of the bi-spectral fire temperature and area retrieval using MODIS data. Remote Sens. Environ. 2014, 152, 166–173. [Google Scholar] [CrossRef] [Green Version]
  91. Lizundia-Loiola, J.; Pettinari, M.L.; Chuvieco, E. Temporal Anomalies in Burned Area Trends: Satellite Estimations of the Amazonian 2019 Fire Crisis. Remote Sens. 2020, 12, 151. [Google Scholar] [CrossRef] [Green Version]
  92. Boschetti, L.; Roy, D.P.; Giglio, L.; Huang, H.; Zubkova, M.; Humber, M.L. Global validation of the collection 6 MODIS burned area product. Remote Sens. Environ. 2019, 235, 111490. [Google Scholar] [CrossRef]
  93. Belenguer-Plomer, M.A.; Tanase, M.A.; Fernandez-Carrillo, A.; Chuvieco, E. Burned area detection and mapping using Sentinel-1 backscatter coefficient and thermal anomalies. Remote Sens. Environ. 2019, 233, 111345. [Google Scholar] [CrossRef]
  94. Hawbaker, T.J.; Vanderhoof, M.K.; Schmidt, G.L.; Beal, Y.J.; Picotte, J.J.; Takacs, J.D.; Falgout, J.T.; Dwyer, J.L. The Landsat Burned Area algorithm and products for the conterminous United States. Remote Sens. Environ. 2020, 244, 111801. [Google Scholar] [CrossRef]
  95. Rascón, J.; Angeles, W.G.; Oliva, M. Determinación de las épocas lluviosas y secas en la ciudad de Chachapoyas para el periodo de 2014–2018. REVISTA DE CLIMATOLOGÍA 2020, 20, 15–28. [Google Scholar]
  96. Inglis, N.C.; Vukomanovic, J. Visualizing when, where, and how fires happen in U.S. Parks and protected areas. ISPRS Int. J. Geo-Inf. 2020, 9, 333. [Google Scholar] [CrossRef]
  97. Bui, D.T.; Le, K.T.T.; Nguyen, V.C.; Le, H.D.; Revhaug, I. Tropical forest fire susceptibility mapping at the Cat Ba National Park area, Hai Phong City, Vietnam, using GIS-based Kernel logistic regression. Remote Sens. 2016, 8, 347. [Google Scholar] [CrossRef] [Green Version]
  98. Oliveira, S.; Oehler, F.; San-Miguel-Ayanz, J.; Camia, A.; Pereira, J.M.C. Modeling spatial patterns of fire occurrence in Mediterranean Europe using Multiple Regression and Random Forest. For. Ecol. Manag. 2012, 275, 117–129. [Google Scholar] [CrossRef]
  99. Jaiswal, R.K.; Mukherjee, S.; Raju, K.D.; Saxena, R. Forest fire risk zone mapping from satellite imagery and GIS. Int. J. Appl. Earth Obs. Geoinf. 2002, 4, 1–10. [Google Scholar] [CrossRef]
  100. Su, Z.; Hu, H.; Tigabu, M.; Wang, G.; Zeng, A.; Guo, F. Geographically weighted negative Binomial regression model predicts wildfire occurrence in the Great Xing’an Mountains better than negative Binomial Model. Forests 2019, 10, 377. [Google Scholar] [CrossRef] [Green Version]
  101. Cruz, M.G.; Alexander, M.E. Modelling the rate of fire spread and uncertainty associated with the onset and propagation of crown fires in conifer forest stands. Int. J. Wildl. Fire 2017, 26, 413–426. [Google Scholar] [CrossRef]
  102. Maletta, H.E. La pequeña agricultura familiar en el Perú: Una tipología microrregionalizada; FAO: Lima, Peru, 2017; Available online: http://www.fao.org/3/a-i6759s.pdf (accessed on 24 April 2020).
  103. Truckenbrodt, J.; Freemantle, T.; Williams, C.; Jones, T.; Small, D.; Dubois, C.; Thiel, C.; Rossi, C.; Syriou, A.; Giuliani, G. Towards Sentinel-1 SAR analysis-ready data: A best practices assessment on preparing backscatter data for the cube. Data 2019, 4, 93. [Google Scholar] [CrossRef] [Green Version]
  104. ESA. Sentinel-1. Available online: https://sentinel.esa.int/web/sentinel/missions/sentinel-1 (accessed on 13 September 2020).
  105. Verhegghen, A.; Eva, H.; Ceccherini, G.; Achard, F.; Gond, V.; Gourlet-Fleury, S.; Cerutti, P.O. The potential of Sentinel satellites for burnt area mapping and monitoring in the Congo Basin forests. Remote Sens. 2016, 8, 986. [Google Scholar] [CrossRef] [Green Version]
  106. Cilli, R.; Monaco, A.; Amoroso, N.; Tateo, A.; Tangaro, S.; Bellotti, R. Machine learning for cloud detection of globally distributed Sentinel-2 images. Remote Sens. 2020, 12, 2355. [Google Scholar] [CrossRef]
  107. Nazarova, T.; Martin, P.; Giuliani, G. Monitoring vegetation change in the presence of high cloud cover with Sentinel-2 in a lowland tropical forest region in Brazil. Remote Sens. 2020, 12, 1829. [Google Scholar] [CrossRef]
Figure 1. Land cover and land use in the Amazonas department, Peru. Source: Mapbiomas [48].
Ijgi 09 00564 g001
Figure 2. Wildfires occurred in Luya province, in the Amazonas department: (a) Left side of the road towards the villages of La Unión—San Jerónimo (July 2019); (b) Fortress Kuélap (August 2019).
Ijgi 09 00564 g002
Figure 3. Methodological flowchart for the development of a decision rules-based routine designed for monitoring wildfires in the northeastern Peruvian Amazon, employing Landsat-8 and Sentinel-2 imagery and using the cloud-based Google Earth Engine platform.
Ijgi 09 00564 g003
Figure 4. Boxplots of the classes “burnt” and “unburnt” for the multitemporal differences related to MIRBI, NBR, NBR2, NIR, and post-fire values of NBR, NBR2, and NIR.
Ijgi 09 00564 g004
Figure 5. Burnt areas mapping with Sentinel-2, August 2019; (a) Pre-fire mosaic; (b) Post-fire mosaic; (c) Detected burnt areas (in pink color).
Ijgi 09 00564 g005
Figure 6. Example of a time series to identify BA in the study area. (+) Rule for the Landsat-8 time series, which requests a fire occurrence at least in one month to assign an area as BA. (++) Rule for the Sentinel-2 time series, which requests fire occurrences at least in two months to consider an area as BA.
Ijgi 09 00564 g006
Figure 7. Monthly distribution of BA resulting from the Landsat-8 and Sentinel-2 products. (a) BA in 2017. (b) BA in 2018. (c) BA in 2019.
Ijgi 09 00564 g007
Figure 8. BA of the vegetation cover in the study area derived from the following products: (a) Landsat-8 in 2017; (b) Landsat-8 in 2018; (c) Landsat-8 in 2019; (d) Sentinel-2 in 2017; (e) Sentinel-2 in 2018; (f) Sentinel-2 in 2019.
Ijgi 09 00564 g008
Figure 9. Maps of wildfires densities in the Amazonas department as a function of burnt areas (BA) clustering; (a) Density of BA resulting from Landsat-8; (b) Density of BA resulting from Sentinel-2.
Ijgi 09 00564 g009
Table 1. Spatial and spectral general characteristics and number of images per year for the Landsat-8 and Sentinel-2 collections.
CollectionSpectral BandsTemporal ResolutionSpatial ResolutionNr. of Images * (Cloud Cover < 50%)
201720182019
LANDSAT/LC08/C01/T1_SR9 bands16 days30 m283933
COPERNICUS/S213 bands5 days10, 20, and 60 m156487426
* Total number of mosaic images for the study area.
Table 2. Spatial and spectral resolutions of Landsat-8/OLI and Sentinel-2/MSI.
Landsat-8/OLI (μm)BandResolution (m)Sentinel–2/MSI (μm)BandResolution (m)
Band 2 (0.45–0.51)Blue30Band 2 (0.46–0.52)Blue10
Band 3 (0.53–0.59)Green30Band 3 (0.54–0.58)Green10
Band 4 (0.64–0.67) *Red30Band 4 (0.65–0.68) *Red10
Band 5 (0.85–0.88) *NIR30Band 5 (0.7–0.71)Red-edge-120
Band 6 (1.57–1.65) *SWIR-130Band 6 (0.73–0.75)Red-edge-220
Band 7 (2.11–2.29) *SWIR-230Band 7 (0.76–0.78)Red-edge-320
Band 8 (0.50– 0.68)Panchromatic15Band 8 (0.78–0.90) *NIR10
Band 8A (0.85–0.87)NIR plateau20
Band 11 (1.56–1.65) *SWIR-120
Band 12 (2.10–2.28) *SWIR-220
* Bands used in the classification of burnt areas.
Table 3. Spectral indices used for estimating BA.
NameAbbreviationFormulaSource
Normalized Difference Vegetation IndexNDVI N D V I = ( N I R R e d N I R + R e d ) [61]
Normalized Burn RatioNBR N B R = ( N I R S W I R 2 N I R + S W I R 2 ) [36]
Normalized Burn Ratio 2NBR2 N B R 2 = ( S W I R 1 S W I R 2 S W I R 1 + S W I R 2 ) [39]
Mid-InfraRed Burn IndexMIRBI M I R B I = ( 10.0 S W I R 2 ) ( 9.8   S W I R 1 ) + 2 [38]
Table 4. Accuracy indices for the burnt and unburnt areas classification executed in Landsat-8 and Sentinel-2 multitemporal images.
YearSatellitePA (%)UA (%)AccuracyF-Score (F1)Qt (Quantity Component)Et (Exchange Component)
BurntUnburntBurntUnburnt(%)(%)
2017Landsat-8 98.586.284.298.791.490.88515
Sentinel-2 98.695.395.298.796.996.95743
2018Landsat 8 98.174.866.798.782.779.4928
Sentinel-2 96.892.592.196.994.594.44456
2019Landsat-8 97.88379.898.28987.98416
Sentinel-2 97.899.199.197.898.598.54357
Table 5. Burnt areas (ha) according to the evaluated year resulting from the Landsat-8 and Sentinel-2 products in the Amazonas department (Peru).
SatelliteBurnt Areas (km2)
201720182019
Landsat-816.396.2432.93
Sentinel-216.5578.5067.19
Table 6. Spatial agreement of BA resulting from Landsat-8 and Sentinel-2 in 2017, 2018, and 2019.
Burnt AreaSentinel-2Spatial Comparison
BurntUnburntTotal (km2)OmissionExtension
2017
Landsat-8Burnt3.5112.8816.390.21 *1.00 **
Unburnt13.0439,277.0439,290.08
Total (km2)16.5539,289.9239,306.47Q Coefficient1
2018
Landsat-8Burnt2.353.896.240.38 *1.00 **
Unburnt76.1539,224.0939,300.24
Total (km2)78.5039,227.9839,306.47Q Coefficient0.99
2019
Landsat-8Burnt18.8814.0532.930.57 *1.00 **
Unburnt48.3139,225.2339,273.54
Total (km2)67.1939,239.2839,306.47Q Coefficient1.00
* Omission = 1 − (Burnt Landsat-8 and Unburnt Sentinel-2/total Burnt). Source: de Barros [80]. ** Extension= 1 − (Unburnt Landsat-8 and burnt Sentinel-2/total Unburnt). Source: de Barros [80].

