Disparities in Geographical Access to Hospitals in Portugal


1
CEGOT, Centre of Studies in Geography and Spatial Planning, University of Coimbra; 3000-043 Coimbra, Portugal
2
Interdisciplinary Centre of Social Sciences (CICS.NOVA), NOVA School of Social Sciences and Humanities (NOVA FCSH), Universidade NOVA de Lisboa; 1069-061 Lisbon, Portugal
3
Department of Geography and Tourism–Humanities Faculty–University of Coimbra; 3000-043 Coimbra, Portugal
*
Author to whom correspondence should be addressed.
ISPRS Int. J. Geo-Inf. 2020, 9(10), 567; https://doi.org/10.3390/ijgi9100567
Submission received: 28 August 2020
/
Revised: 26 September 2020
/
Accepted: 28 September 2020
/
Published: 29 September 2020
(This article belongs to the Special Issue GIS in Healthcare)
Abstract
:Geographical accessibility to health care services is widely accepted as relevant to improve population health. However, measuring it is very complex, mainly when applied at administrative levels that go beyond the small-area level. This is the case in Portugal, where the municipality is the administrative level that is most appropriate for implementing policies to improve the access to those services. The aim of this paper is to assess whether inequalities in terms of access to a hospital in Portugal have improved over the last 20 years. A population-weighted driving time was applied using the census tract population, the roads network, the reference hospitals’ catchment area and the municipality boundaries. The results show that municipalities are 25 min away from the hospital—3 min less than in 1991—and that there is an association with premature mortality, elderly population and population density. However, disparities between municipalities are still huge. Municipalities with higher rates of older populations, isolated communities or those located closer to the border with Spain face harder challenges and require greater attention from local administration. Since municipalities now have responsibilities for health, it is important they implement interventions at the local level to tackle disparities impacting access to healthcare.
1. Introduction
Internationally, access to healthcare is one of the primary goals of every country’s government [1,2,3,4,5]. Providing access to quality and essential healthcare services and reducing inequalities within countries are, in fact, two of the United Nations’ Sustainable Development Goals, set out by world leaders to promote the eradication of poverty and advance economic, social and environmental development on a global scale by 2030 [6]. Moreover, the improvement in accessibility is considered a main driver for smart, sustainable and inclusive growth proposed by the Europe 2020 Strategy and the Territorial Agenda 2020 [7]. Achieving those goals is fundamental to achieving equity in access to healthcare because large inequalities can exacerbate disparities in health outcomes and quality of life [3].
Despite this, there is no consensus on how to define access, mainly due to its multidimensional nature and the vast array of accessibility measures that can be applied [8,9,10]. The following concepts were adopted for this paper. Penchansky and Thomas [11] define access as a concept representing a degree of fit between patients and the health system; Gulzar [12] considers access as the ability of a population to use health services, whether that ability be affected by access barriers or facilitators. According to Joseph and Philips [13], access can be realized or potential. The first approach focuses on utilization patterns. The latter considers potential barriers to utilization and measures access as potential utilization.
There is also no agreement regarding the dimensions to define access. Penchansky and Thomas’ [11] dimensions are accessibility, availability, accommodation, affordability and acceptability. Availability and accessibility are the two spatial dimensions that together measure the patient’s geographical accessibility [3,9,14]. Geurs and Wee [15] stated the four major components of accessibility: (1) land-use, which reflects the location of supply and demand as well as the interactions between them; (2) transportation, which considers the way an individual covers the distance between the origin and the destination; (3) temporal, which focus on the availability of opportunities to move through the day and the time available; (4) individual, regarding the individual characteristics that influence a person’s access. This paper will focus on the two spatial dimensions from Penchansky and Thomas’ approach and the two first components referred by Geurs and Wee. In this way, the study will consider the relationship between three factors, their spatial distribution and their characteristics: (a) how far people live from healthcare services and are willing to travel, (b) how well transport provides links to the healthcare services, and (c) how long it takes to travel to such services [16,17,18,19,20,21,22].
Finally, accessibility measurements are under growing scrutiny. Geurs and Wee [15] categorized accessibility measures based on three perspectives: (1) infrastructure-based accessibility measures, used to analyze the performance of the transport infrastructure; (2) activity-based accessibility measures, used to analyze the range of opportunities with respect to their distribution in space and the travel barriers between users and services; (3) utility-based accessibility measures, used to analyze the benefits individuals derive from using the transport system [22]. Guagliardo [14] classifies them into four categories: (1) provider-to-population ratios that are computed within bordered areas; (2) distance to nearest provider, measured from a patient’s residence or from a population centre; (3) average distance to a set of providers that corresponds to a combined measure of accessibility and availability since travel impedance to all providers are summed and averaged; (4) gravitational models of provider influence that represent the potential interaction between any population point and all service points within a reasonable distance.
Geographical accessibility is generally accepted as an important component in evaluating a population’s overall access to healthcare and is a basic aim to meet the population’s health needs [23,24,25]. Identifying where the truly underserved populations are located is an essential first step toward meaningful and effective government intervention programs that can narrow gaps in accessing healthcare and promote overall population health [3]. Thus, it is widely recognized as an important spatial barrier to healthcare services [11,26] and, therefore, a significant source of spatial inequality [27] and a major health determinant to be tackled [28]. Its study is essential for evaluating population exposure to local environments [29,30]. According to the literature, geographical constraints on access to services contribute to lower health care utilization, decreased uptake of preventive services and lower survival rates, which may contribute to poorer health outcomes, particularly for those with lower incomes [31,32,33,34,35,36,37]. It is also associated with poor utilization of specialization units, such as maternity hospitals, pediatric centers and cancer management institutes, often located in larger cities and not accessible or visible for people living in socio-economically deprived areas, rural communities and remote places [38,39,40,41]. This is also of significant concern to ageing societies where geographical access is critical [21,42] and seniors are experiencing more challenges accessing care [43,44]. Thus, a community that needs to travel large distances from their residence to healthcare facilities experiences greater difficulty in gaining access [45]. Users become prone to missing the opportunity to detect illnesses at an early stage, starting treatment at different stages of chronic disease, receiving adequate pharmacological prescriptions and dosages or participating in screening programs [46]. As a consequence, several studies found an association between geographical accessibility to healthcare and the type of treatment and medical intervention [47], the utilization of surgical services [48], cardiac rehabilitation treatment [49] or maternity hospitals [50], hepatitis C detection [51], survival from a cardiac disease [52,53,54], stage of several cancers at diagnosis [55,56], and access to cancer treatment [57]. Ecological mortality studies have also revealed that a longer distance to travel to healthcare is significantly associated with higher mortality from heart attack [43], asthma [58], perinatal death [59,60], prostate and lung cancers [61] and trauma accidents [62,63]. Therefore, those communities that have poor transportation infrastructures and a lack of public transportation options, also often suffer from increased disadvantage and poorer health status, meaning that they require even greater levels of access than those living in well served areas [64].
Identifying health disparities—in the form of vulnerable territories with poorer geographical access to health services that can be shaped by policies [65]—can be a key input for local authorities during the design and implementation of policies [66,67]. Research highlighted that measuring geographical accessibility enables: (1) to quantify differences in access [35,68]; (2) to identify gaps in service provision [69,70,71]; (3) to model optimal facility location [72,73]; (4) to identify inequalities in service provision [74,75]; (5) to promote evidence-based health policies [76,77,78,79]. Hence, measuring geographical accessibility can be an essential element to support rationing decisions that affect both the process of urban area development and spatial planning of health resources, and reinforce the need for interventions that promote and improve the population health of a community [2,8,9,42,75,80,81,82,83,84,85,86,87]. However, geographical accessibility is often misunderstood and inadequately measured on many studies and local plans [15].
According to the European Commission, Portugal is among the EU countries facing substantial inequalities in the supply of healthcare services between regions and across urban and rural areas [88]. The OECD also points out the uneven geographical distribution of facilities as one of the biggest barriers to accessing healthcare [89]. According to the scientific literature, poor geographical access is affecting the utilization of health services in Portugal and some health outcomes. Santana [90] was the first author to identify an association between distance and use of Emergency Rooms. Recently, Vaz et al. [91] identified that a 10% increase in distance to Emergency facilities results in a 10 to 20% decrease in utilization, especially for low-severity demand. Costa et al. [92] identified a 2% higher risk of dying from an amenable cause of death due to health care services for those living in municipalities where it takes more than 30 min to reach the closest hospital. Therefore, researchers state that it is essential to undertake a comprehensive assessment of geographical inequalities in access, and to ensure that interventions to improve healthcare access are put in practice [93].
Until recently, health policies were only produced by Portugal’s central government, so most plans focused on the national level and provided evidence at this level. Nonetheless, legislation from 2018 gave the municipalities the power to plan primary care units, and manage some human resources, services and infrastructure. Moreover, they are now responsible for producing a local health plan and implementing a health strategy to promote community and healthy living and active ageing [94]. Therefore, it is important to have access to clear evidence on inequalities regarding access to healthcare. According to Mizen and colleagues [19], geographical accessibility to healthcare services needs to be accurately assessed and effectively communicated to decision makers so that successful policy and infrastructure planning can be implemented.
Operationalizing and computing a measurement able to quantify geographical accessibility is challenging since it depends on a set of four parameters: definition of residential areas, a method of aggregation, a measure of accessibility and a type of distance [5]. The choice and combination of these parameters is likely to generate different results or lead to significant errors in measurement [5,17,95,96,97,98,99].
The first parameter relies on the definition of residential area. Selecting the appropriate spatial unit of analysis is critical for quantifying geographical accessibility [100]. Aggregation errors arise when, for the purpose of distance calculations, a single point is used to represent a larger spatial unit, which, in turn, represents an aggregation of spatially distributed individuals, leading to a lack of precision and estimation errors [83,101]. This may create the problem of ecological fallacy, since the larger the spatial unit, the higher the error will be [19,98,99]. The census tract unit is often selected due to the low number of people, and the availability of detailed socioeconomic, demographic and housing data, as well as their relative homogeneity [95].
The second focuses on the aggregation method applied. It is important to apply an aggregation method so as to limit errors in the measurement of potential spatial access of larger areas, such as parishes and municipalities [100]. Due to the differences between residential areas, it is inappropriate to ignore who is living there since it introduces ecological fallacy [19]. Therefore, it is important to weigh spatial access based on their number and distribution in the territory [66]. Studies generally choose to consider the number of inhabitants in each residential area [29,66].
The third parameter considers the way geographic accessibility between the residential area and the public service is measured. According to the literature, the five most commonly used measures are: (1) the distance/time to the service [102]; (2) the number of services within n meters or minutes [101]; (3) the mean distance/time to the n closest services [30]; (4) the gravity model [103,104]; (5) the two-step floating catchment area methods and those derived from them [18,20,21,24,85,103,105,106,107,108]. Among these, the last two are relatively popular methods for measuring spatial equity [18,82,109]. Still, the most often used method is clearly the distance/time to the closest service, which allows for evaluating geographical access to the healthcare services [27,100].
Finally, the fourth parameter deals with the type of distance, defined as the degree to which two places on the same surface are connected [15]. There are several types of distance that can be implemented [19]. Crow-fly with straight line distance is used in many studies for determining healthcare services catchment areas or for estimating rates of population served [8,18,101]. Public authorities generally use it as a decision tool [74] despite some doubts as to its reliability [101,110,111]. Additionally, very popular among researchers, network-based distance is measured under a network made of lines and nodes computing the length of the shortest path along the transport network, representing the real network system taken by the population to move between locations [8]. Therefore, it is more accurate and realistic [19,82] than the previous option, mainly in regions where roads exhibit high degrees of sinuosity and topographical barriers [5,100,101].
Besides those four parameters mentioned in the literature, a fifth one must be considered in accessibility studies aiming to support decision-making: the outcome of the measurement. The unit can be different according to those parameters, influencing the way results are interpreted. According to previous studies, displaying results in units of analysis that are meaningful to decision-making will increase the likelihood that such results will be embedded in policy [15,77,112,113]. Most studies on geographical accessibility present measurements of distances in kilometers [29,66], time in minutes [114] or scores represented in quintiles [105,106]. Distance metrics offer awareness of geographical access regardless of the transportation mode being used. Still, it does not consider the speed or physical barriers, such as intersections that influence the time to reach healthcare. Time measurement considers both, does not require previous assumptions and it is easily communicated to decision-makers. However, it considers that all the healthcare services are equal. Scores allow for overcoming the aforementioned negative aspects, although they cannot be easily interpreted and require comparison to be understood.
Following the best approaches for each parameter, the population-weighted driving time indicator is considered an adequate choice for measuring geographical accessibility because it allows for overcoming the unrealistic equal access assumption and potential edge effects of the container-based approach, and also uses an intuitive form of a distance-base measure [29], avoiding the modifiable unit area problem [115]. This indicator accounts for the average time between population in a residential area (e.g., census tract) and the healthcare service by considering the shortest distance between them and the share of population within a larger area (e.g., municipality) [66]. This flexibility makes it applicable to individual persons or households, as well as for a geographic area [29]. Previous studies have applied this method to assess access to hospitals [66,111], alcohol sales [29], parks [116] and supermarkets [30]. It was applied to studies at local [30] and national levels [29,66,111,116].
The aim of this paper is to draw on population-weighted driving time to better assess whether there are disparities in geographical access to the reference hospital in Portugal, how it has changed in the past 20 years (1991–2011) and what influenced that change.
Due to the recent decentralization of power from the health sector to the local administration, this is an important policy issue. For this reason, the geographical accessibility of Portuguese municipalities was investigated with the aim of developing policy recommendations regarding which interventions can be implemented to reduce the impact on health disparities.
2. Materials and Methods
2.1. Geographical Scales
Studying geographical accessibility to healthcare in Portugal requires two geographical levels to be considered: the lowest level with population data and the adequate administrative level able to implement changes.
The census tract is the minimal unit of census geographic hierarchy in Portugal. By using the population at its smallest level, the geographic aggregation error is minimized [117]. In addition, census tract-based spatial access metrics provide the flexibility to aggregate the metrics to any higher geographic level that can be linked to geocoded individual or aggregated health outcomes [29].
Although the small-area level is adequate to capture the right level of areal differentiation [77,118], the municipality administrative level is the most appropriate to present a geographical accessibility measurement for Portugal. Four important points justify this choice: (1) it is considered the geographical level that better fits ecological studies in Portugal, based on national registries, such as mortality [99,119,120,121]; (2) hospitals had a catchment population area based on municipalities (except for main urban areas where delimitation is based on parishes) until 2015 [122]; (3) it is the lowest meaningful administrative level with an elected government with capacity to implement policies and interventions that may impact population health [23,123]; (4) recently, municipalities became responsible for a set of tasks and decisions that were previously taken centrally by the Health Ministry, as well as for the production of a local health plan.
2.2. Method: The Population-Weighted Driving Time Indicator
Population-weighted driving time was the indicator selected to measure the potential geographical accessibility from municipalities to the hospital’s catchment area in Portugal in three periods (1991, 2001 and 2011).
This metric is a matter of calculating the accessibility measures on the level of the census tracts and then computing the average time weighted by the population within the municipality.
The process to compute this indicator is straightforward, comprising three steps: (1) computing the travelling time using a private car from the centroid of each small-area level (census tract) to the reference hospital; (2) weighting the time needed for the population living in each small area; (3) aggregating the travel time in order to identify the weighted average travel time of a municipality. These steps can be translated into a formula. By taking a small-area i from municipality j:
where is the population living in the small area and is the time (in minutes) needed to reach the hospital. The outcome is measured in minutes, revealing the time that the population from a municipality would need to reach the hospital through private car utilization. Figure 1 presents the workflow implemented, namely the data and the functions, with ArcGIS 10.5 being used.
2.3. Geographical Data
To build the population-weighted driving time metric, cartographic information was required for (1) the distribution of the population at the small-area level (census tract); (2) the road network, with information about speed limits and general driving conventions (e.g., intersections, traffic lights); (3) the location of the hospital and its catchment area; (4) the boundaries of the municipalities.
The population data by census tract was provided by Statistics Portugal who collect this information through the Census Survey every ten years. The indicator used for this study was the number of permanent residents in the housing unit by census tract in 1991, 2001 and 2011. The quality of the data from the census (population and housing censuses) for 1991, 2001 and 2011 was guaranteed by the international standard that is applied by Statistics Portugal. The 1991 Census initiated the automatic coding of alphabetic expressions; the 2001 census has already made use of the optical questionnaire reading process and the 2011 census introduced the modernization of data collection processes, via the internet response (it was called e-Censuses). The 2011 census followed the regulation of the European Union (regulation EC 763/2008 of the European Parliament and of the European Council, of 9 July 2008; complementary regulations rEG (EC) No. 1201/2009, rEG (EC) No. 1151/2010 and rEG (CE) No. 519/2010). These regulations introduced standards for all Member States, namely the smallest data unit and the census moment. In this investigation, the census tract was used as the smallest data unit. According to Statistics Portugal, the Census data collection corresponds to 97.5% of the Portuguese population in 2011. In 2001, the coverage rates were higher (98.6%) as well as in 1991 (99.6%).
The roads and urban streets data was provided by ESRI Portugal, in the form of vector digital data (Geospatial Data Presentation Form). The data are the TeleAtlas Multinet shapefiles produced by TeleAtlas (now TomTom) as it is widely used in the market, particularly in the navigation sector. This road database not only includes extensive, current and accurate geographical data, but it also includes additional information, such as the legal speed limit, turn-by-turn instructions, street signs, intersections and other transit directions. These data guarantee quality at all levels: attribute accuracy (address attributes pre-standardized based on ESRI Portugal), logical consistency (shapefile), completeness (compared to official Portuguese sources) and positional accuracy (map accuracy standards for 1:100,000-scale maps). According to the company, the positional accuracy of the data is up to one meter. These data were for the year 2011. The 2011 data served as reference to retrospectively build the 2001 and 1991 road network. Due to a lack of data for the previous years, the National Road Plan from 1985, old road maps and historical data from technical reports regarding the opening of highway sections were used to backdate these data from 2011 to 2001 and 1991.
The location of the hospitals and their catchment areas were provided by the Central Administration of the Health System, which manages the public hospitals and defines the catchment population area of each hospital. Since the National Health Service (NHS) was created in 1979, the country has been served by a network of public hospitals with access based on the pre-defined catchment area of each hospital and, until 2015, a strong gate-keeping system [44,122,124]. Hospitals are classified into a three-level administrative hierarchy that reflects differences in scale and scope [125]. Group I comprise local hospitals with a catchment area of 75,000 to 500,000 inhabitants, providing some medical and surgical specialties. Within group I there are some hospitals that are managed by charity trusts. These so-called “social hospitals”, have agreements with the NHS and they provide healthcare to users of the system in the same way as public hospitals. Group II comprises district hospitals that provide the group I specialties in their own catchment area and also provide other specialties to some group I hospitals located nearby. Group III comprises central hospitals that provide all medical and surgical specialties in both the direct and indirect catchment areas from groups I and II hospitals located nearby [126]. Therefore, district and central hospitals “accumulate” specialties according to their level, and human resources and beds are allocated to the hospital and not to the different levels. The group I hospitals were considered for this study because they only provide healthcare to those living in their catchment area.
The boundaries of the municipalities were produced by the Directorate General for the Territory, which is responsible for producing accurate information regarding the administrative boundaries of the administrative levels and providing their official delimitation.
3. Results
Through the census years, there was an increase in the number of census tracts and, simultaneously, a decrease in the average population (Table 1). In 2011 there were more than 200,000 census tracts with an average area of 300 square meters and 43 inhabitants.
The time to reach the reference hospital, measured for each census tract, was aggregated to the municipalities from Continental Portugal in order to identify the population-weighted driving time to the reference hospital.
Since the area of the municipalities is large (average: 230 km2), the first step was to analyze the internal range of values between the closest and the furthest census tract within the municipality to the reference hospital. According to Figure 2, there is still a huge range in travel time. On average, the travel time range is 22 min; 9.1% of the population lives in municipalities with an internal travel time range to the reference hospital longer than 30 min. In 1991, it was slightly higher (23 min) and the share of the population living in municipalities with a travel time longer than 30 min was higher (10.6%).
According to Figure 3, inequalities between the Eastern and Western areas are evident. The population-weighted access pattern follows the population distribution, with the municipalities closer to Atlantic Ocean from North, Centre and the Greater Lisbon Region presenting very good geographic accessibility. Outside this area there are also some pockets with very good accessibility in the regions’ capitals. However, due to the greater distance between hospitals, there are 79 municipalities whose population-weighted driving time is more than 30 min. The municipalities closer to the border with Spain are those with the worst accessibility. This was already visible in 1991 and 2001. In 2011, municipalities were, on average, within a 25-min journey to the hospital, accounting for 92.8% of the population living in municipalities with population-weighted driving time lower than 30 min (9,320,793 inhabitants). In 1991 the average population-weighted driving time to the hospital was 28 min.
Comparing 1991 and 2011, almost all municipalities improved accessibility to the hospital within the period of analysis (Figure 4). On average, population-weighted driving time for 2011 is 3 min lower when compared to 1991, corresponding to an average gain of 10% in population-weighted driving time to the hospital. At present, residents of some municipalities need half the time they needed in 1991 to reach the hospital and, for others, the time decreased by more than 20 min. However, the Gini Coefficient reveals that spatial inequalities are still persistent: in 1991, the Gini Coefficient was 0.335 and in 2011, 0.326.
Due to the chance that the reference hospital might not be the closest one, it was important to apply the same methodology without considering the catchment areas. Figure 5 reveals that, for most municipalities, there is no significative difference between the population-weighted time to the reference hospital when compared to the closest hospital. However, in 1991 there were four municipalities where the population-weighed driving time to the closest hospital was 30 min or more lower than the population weighted driving time to the reference hospital. In 2011 only one municipality remains in this category, located in the center of the Centro Region.
Figure 6 reveals the relevance of three different factors on the verified evolution of geographical accessibility: changes to the hospital reference catchment area, improvement of the road network and demographic changes to population concentration. Most municipalities were influenced by all three factors: 31.8% of the population live in municipalities where the reference hospital changed, the road network improved, and the external and internal changes of the population were considerable. Only 5% of the 2011 population does not live in a municipality affected by at least one factor. These are mostly located in inland Alentejo and the Centro Region. When looking at each factor individually, it is evident that most people live in municipalities where significant changes to demographic distribution occurred (72.2%), followed by populations living in municipalities where a highway was built (62.4%), and 61.7% of the population live in municipalities where the reference hospital was not the same throughout the study period.
According to Table 2, in 1991, 16% of the population was living in municipalities where the population-weighted driving time to the hospital was more than 30 min. In 2011 that rate was 7%; a decrease of more than half. The biggest improvement was for those living in municipalities with a population-weighted driving time between 40 and 50 min. Notice that, in 1991, there were municipalities whose population-weighted driving time to reach the hospital was more than 90 min, a situation that does not presently occur.
Table 3 reveals that there is a statistical association between the population-weighted driving time and some demographic characteristics: municipalities with bad geographical accessibility to the reference hospital have higher share of elderly population, high rates of premature mortality and lower population density.
Figure 7 exhibits that longer travel time is associated with higher share of elderly people. Table 3 reveals that even a one-minute increase in the population-weighted driving time is associated with an increase of 0.3% in the share of the elderly population. This was already visible in 1991 but the association was not so high. Almost all the municipalities with higher rates of elderly population are located outside of the littoral border, between Porto, Lisbon and Algarve, and are mostly those closer to the border with Spain.
Additionally, in Figure 7, it is visible that there is a negative association between population density and time to the reference hospital: the higher the time to reach the reference hospital, the smaller the population density is. As expected, hospitals are mainly located in the most densely populated municipalities and where the share of the elderly population is lower.
The population-weighted driving time to the reference hospital also reveals an association with premature mortality, providing the evidence that areas with a high share of deaths, before the age of 75, might have low levels of geographical accessibility. Results show that a one-minute increase in population-weighted driving time is associated with an increase of 0.14% in premature mortality. In 1991 the association was a fraction lower. The municipalities with higher rates of premature mortality are mostly located closer to the border with Spain and on the central axis that crosses Portugal from North to South.
Most of the municipalities reveal more than one of these demographic characteristics. According to Figure 8, all the municipalities where the population-weighted driving time is higher than 30 min, also have an elderly population which is above the Portuguese average, and/or above average premature mortality. In addition, some municipalities are negatively impacted by their proximity to the border with Spain. Major issues are found in the municipalities closer to the border between the Alentejo and Algarve regions; the central axis that crosses the country North to South in the middle; the Foz Côa Valley; and the municipalities closer to the Spanish border.
4. Discussion
4.1. Geographical Accessibility to the Reference Hospital in Portugal
The aim of this paper was to assess whether there are disparities in access to a hospital in Portugal and how this has changed in the last 20 years (1991–2011). The results show that geographical accessibility to the reference hospital improved over the years. However, disparities are still visible between municipalities, with ageing and border communities remaining vulnerable and requiring more attention.
Geographical access to the reference hospital mostly improved over time in Portugal with an average gain of 10% in population-weighted driving time. The biggest improvement has been for those living in municipalities with population-weighted driving time between 40 and 50 min and higher than 70 min. In 2011, almost half of the population lives in municipalities with a population-weighted driving time to the hospital lower than 10 min (40%) and 93% lives in municipalities with a travel time lower than 30 min, revealing very good geographical access. On average, municipalities present a population-weighted driving time of 25 min in 2011—3 min less than 20 years ago. Still, there are clearly two distinct realities in Portugal: Western Portugal between the two metropolitan areas, with a high level of accessibility, and the remaining country, with low level of accessibility, with the exception for the district capital regions.
Other authors identified the good levels of access to hospital care and also this dichotomy of the Portuguese territory [27,106,127,128,129]. However, the levels of accessibility differ among them due to different methods applied. By considering the year 2011 and the measurement of geographical accessibility to the closest hospital, Perista [93] stated that over 90% of the population is deemed to live within a radius of 15 min travel by road; Polzin and colleagues [106] found that 92% of the Portuguese population has good geographical accessibility; Lopes and colleagues [130] concluded that they are 98% of the population; Sá Marques and colleagues quantified 99% of the population requiring until half an hour to reach the hospital.
Several factors influence the decrease in the population-weighted driving time to the reference hospital and the improvement of geographical accessibility between 1991 and 2011, namely (1) the extension of the road network; (2) changes to the hospital distribution and catchment area; (3) demographic changes in population distribution.
First, the significant expansion of the Portuguese road network contributed to a major decrease in distances between main cities located in the littoral and inland areas [131,132]. Between 1991 and 2011 the dimension of the road network with a speed-limit higher than 100 km/h increased from 1358 km to 5045 km. This threefold increase in the road network was one of the main goals of public policies supported by the European Commission and the Portuguese Government [27]. More than half of the population benefited directly from this improvement with the construction of highways. Nonetheless, there is a concentration of these roads along the littoral, linking the metropolitan areas, and West–East highways, built to facilitate the connection between the littoral and Spain.
Second, the distribution of hospitals in Portugal did not have major changes: two new hospitals were built between 1991 and 2011 in both metropolitan areas and in places where existing hospitals did not have enough capacity to address the population health’ needs. Over time, preference was given to the reconstruction and construction of hospitals on the outskirts of the cities to replace the previous ones [133]. Still, almost 62% of the population lives in municipalities where the reference hospital changed over time. In 1999, hospitals started organizing into hospital centers with two to four small hospitals located in neighborhood municipalities [122,123]. This reorganization aimed to address the geographical disparities [93] and it was able to improve accessibility, especially from those communities on the outskirts of the municipalities that were closer to another hospital. However, in 2011 there were municipalities that were not assigned to the closest hospital and the difference in the population-weighted driving time was significatively high (more than 15 min). These municipalities are closer to small social hospitals that do not have enough human and technological resources to provide healthcare for people outside their catchment area.
Finally, the demographic changes between regions (from inland to littoral) and within municipalities (from rural to urban) is partially responsible for changes in population mobility, affecting almost three quarters of the population. The population living in inland municipalities decreased (some by more than 10%), in opposition to the municipalities along the littoral [134] where most hospitals are concentrated. Additionally, within most municipalities, the population is leaving the rural areas and becoming concentrated in cities and villages—namely young adults. Note that, in 1991, less than a half of the population was living in urban settlements with more than 2000 inhabitants (48%). In 2011, 61% of the population was living in urban settlements [135]. Nonetheless, although population living in urban areas is increasing in Portugal, the share of the population living in rural areas is still high compared to other European Countries, and more than half lives in remote areas [136]. Therefore, Portugal remains a polarized country whose littoral is characterized by high accessibility, urban development and higher population density, in contrast with the municipalities located inland, revealing low-density and increasingly vulnerability to depopulation and ageing. Notice that the population that lives in inland municipalities from the Norte (North) and Centro (Central) Regions face challenges due to the sharp hilly terrain and those from Alentejo and Algarve face issues with the low density of the road network.
4.2. Municipalities Requiring Higher Attention
Geographical access models have enormous potential for informing local decision-makers on how to achieve social equity on hospital accessibility [111]. They offer critical information suitable for planning and service provision as it allows for the identification of areas with lower (or higher) access to healthcare resources, the assessment of spatial and social inequalities in access, and the identification of underserved populations [18,95,111].
Focusing on the results of the population-weighted driving time results, this study highlights the less empowered municipalities facing barriers to access and requiring intervention to improve geographical access to a hospital: municipalities (1) with a population-weighted driving time exceeding 30 min to reach healthcare services; (2) closer the border; (3) with a high rate of older population; (4) with a higher rate of premature mortality.
First, our results stress that 7.2% of the population live in municipalities whose population-weighted driving time is higher than 30 min and more than 50 thousand inhabitants live in municipalities with an average driving time higher than 60 min. Those communities are located in municipalities that are mainly rural, inland and from the Alentejo region where population density is lower and distances between communities are longer as the road network is not so developed.
Second, the municipalities closer to the Spanish border have the worst accessibility, as also stated by other authors [27]. Border regions are often seen as poorly connected, and with reduced accessibility, relative to the central regions [137,138]. The lack of accessible health services is one of the major issues explaining the depopulation process in these areas [128].
Third, access to hospitals is particularly relevant for the elderly population with limited mobility and revenue. However, higher rates of elderly people are found in municipalities with worse access to hospitals; namely those living on the north–south central axis that crosses Portugal. As previously noted, this is due to the demographic changes occurring in Portugal. Younger populations often present higher mobility than older ones, mainly due to the former’s search for employment. The metropolitan areas, as well as the municipalities on the littoral, are those attracting younger people. Thus, some municipalities are simultaneously presenting both a loss of younger people and an ageing population. Previous studies have already identified this phenomenon: regions with the lowest levels of accessibility are often regions with the biggest share of the elderly population [27,66,98]. Moreover, the elderly were already identified as one of the most vulnerable groups accessing health [128,139], especially during the economic crisis [44], and access to healthcare is associated with old-age survival [140]. According to Padeiro [5], in ageing societies, the time and distance to healthcare services require a better match between location policies and demand for services. This issue is even more problematic in Portugal due to the high dependency on cars for daily journeys, combined with the fact that most of the older population no longer holds a driving license (2016; 63,6%). According to Comber and Colleagues [16], non-car ownership is a significant predictor of difficulty in accessing critical infrastructure, such as hospitals, and it is even more significant than geographical distance with respect to utilization.
The lack of accessibility does not only affect the elderly. Premature mortality, an indicator that accounts for deaths before the age of 75, is also a constant concern in some municipalities with a population-weighted driving time higher than 30 min, both on the border with Spain and in the central axis across Portugal. Previous studies already highlighted increasing mortality in Portugal in the context of decreasing health services [128]. This reveals that primary care is not able to bridge the gap in access and that there is an urgent need to increase the number of contacts with healthcare and provide preventable and specialized care. It is known that remote access to healthcare structures constitute a barrier that discourages healthcare consumption [141], so it is important to improve access.
Since it is not possible to build a multi-specialized hospital in every municipality, results reveal where it is important to act and the importance of designing public policies at local level and promoting interventions able to overcome the lack of geographical accessibility to the hospital.
Municipalities with the worst geographical access might promote the organization of services into Local Health Units, namely in the center of the Centro region and in the Alentejo region. Those whose services are already organized in this type of structure might enhance communication between services to promote better access to specialized care. According to our results, seven out the eight Local Health Units available in Portugal are in areas with average to bad geographical accessibility, located closer to the Spanish border. These units integrate local hospitals and related primary care centers into a unique provider entity, based partly on geographical proximity and partly on the balance of specialties and availability of an emergency department [142]. These units can also help to overcome a major barrier to access healthcare in Portugal, by improving the lack of coordination or communication between services [44,93] and improving access for those living far from the hospital and closer to a primary health care center.
Municipalities located near the border with Spain might assist in the establishment of agreements with Spanish healthcare services located near the border. The Euroregions, a transnational co-operation structure between contiguous territories located in different European countries, are intended to help reduce the disadvantages of the border regions, promote their integrated development and improve the living conditions of the population in these areas [143] so they represent an excellent tool for promoting access to health. There are four official Euroregions joining Portuguese and Spanish municipalities. However, only two of them have established health as a priority, although information about the type of partnerships [138,144,145] was unavailable. Besides these, some regions are implementing some initiatives. For instance, the Centro (PT) and Castille and Léon (ES) regions have implemented a cross-border innovation network for the early diagnosis of leukaemia, and the Local Health Unit of Guarda (PT) and the University Hospital of Salamanca (ES) set a protocol that helps the Portuguese unit to request support with surgical interventions and medical examinations or clinical support from human resources in those specialties [146]. Local decision-makers with closer healthcare services on the other side of the border (e.g., hospitals located in Vigo, Badajoz and Huelva), should promote these types of partnerships and seek fundraising for the implementation of projects that can bring added value to both sides of the border.
Finally, municipalities with a high rate of elderly people and/or high rates of premature mortality might also consider telehealth as a viable solution to overcome the distance to the hospital and provide the early detection of some pathologies. According to the literature, when compared to face-to-face consultations, telehealth affords doctors the ability to see a higher volume of patients, a broader geographical reach, a shorter waiting time and a more effective way to reduce avoidable hospitalizations [147]. Still, in order to achieve these benefits, it is important that primary care has adequate technology to support the examinations and communicate the results, and that doctors and other health professionals receive training on how to use those technologies [148]. Municipalities can act on both issues and, thus, provide improved access to healthcare.
The reasons behind poor accessibility are complex and some territories will require more than one solution. Successful implementation will rely on excellent digital communication infrastructure, cooperation between services and adequate information about the new solutions for both health professionals and the general public.
4.3. Relevance of the Population-Weighted Driving Time Indicator
To date, there is no consensus on a standard measure, accurate representation and adequate way to communicate geographical accessibility [16,27,31,105,149], so most authors defend the use of simpler accessibility measures [150]. Still, the population-weighted driving time indicator revealed to be the adequate method to measure geographical accessibility from the Portuguese municipalities to the reference hospital. Considering the five parameters previously discussed, this indicator deploys on the census tract delimitation (the definition of the residential area), the number of inhabitants on the census tract (the aggregation method), the time to the hospital (the measurement of geographical accessibility between demand and supply), the distance based on a network (the type of distance) and the outcome revealed in minutes (the unit of measurement).
Three main reasons explain the relevance of this indicator to measure geographic access to healthcare.
The first one concerns the spatial resolution of the data. Portugal has very different administrative units in terms of area: the North has much smaller administrative units when compared to the administrative units in the South. The geographic variation in the dimension in area of the administrative units poses a problem of bias in the results of calculating accessibility weighted by the population when using the municipality centroid or the parish. For this reason, the centroid of the census tract (thinner spatial unit) was used to calculate the travel time and to use the population value (weight) that this census tract contains. The increase in the spatial resolution of the data increases the quality of the population and the travel time. In fact, this had already been addressed by some authors [117,151] as a problem that influences the quality of spatial data collection. The results achieved with this indicator have greater accuracy and are more useful to policy makers because they better reveal local problems (very fine scale) of accessibility to hospitals.
The second one concerns the scale. Small-area is the most adequate to capture the right level of areal differentiation and to avoid estimation errors [77,95,98,100,115,118]. However, it is less relevant for decision-makers since it does not adequately fit their needs. Displaying results in units of analysis that are significant to decision-makers will increase the likelihood that such results will be embedded in policy [15,77,112]. Therefore, finding the scale that better fits the evaluation and decision is not easy, as well as the balance between accuracy and relevance that might compromise further action. With this method, it is possible to move from a small-area level geographic accessibility indicator to a local one without falling into a statistical bias that may lead to different conclusions and policies [115,152]. Population-weighted accessibility metrics minimizes those errors since they account for the uneven population distribution within a study area and integrate the power and flexibility of the spatial interaction model-based approach [29]. Therefore, these measures fit better in studies where geographical accessibility is included as a dimension of the territory to investigate the association with health outcomes [98]. Thus, the characteristics of this metric make it easily applied to any administrative level and a useful tool for decision-makers, contributing to the design of policies and intervention programs. For example, it can be used to identify the extent to which people living in different locations may “gain or lose” from the applications of those planning policies or programs. This way, it is a decision-making support tool with the capacity to improve evaluation and, at the same time, decision-making at local, regional and national levels.
The last reason is based on the outcome result. The population-weighted driving time results are presented as time, measured in minutes. Since it is a universal measure directly interpretable in absolute units, as such it does not require any comparison with other values to be understandable. Thus, population-weighted driving time significantly enhances understanding of access to healthcare services by providing legible information that raises awareness and promotes evidence-based governance and contributes towards a productive discourse on future directions for healthcare planning.
Hence, the population-weighted driving time approach: (1) is much easier to use; (2) is sensitive to locally low areas of accessibility where populations live; (3) considers the population distribution at small-area level; (4) provides prompt awareness of priority interventions to national and local decision-makers regarding which regions require interventions. Moreover, the population-weighted bottom-up approach provides great flexibility in generating geographical accessibility measures at any geographic level that could be linked with population health outcomes of interest [29]. Therefore, it is valuable for policymakers to optimize current service provision and organization, which may lead to improved efficiency and reduced inequality, and for researchers to gain a better understanding of the mechanisms underlying inequality in care. The relevance of the calculation of potential geographical access to health equipment is fundamental for the pursuit of the policies of service providers, given that there is a constant need to monitor compliance with national guidelines on equity, to ensure full coverage of the provision healthcare services and their operational management and to contribute to the consolidation of future planning policies at the national, regional and local level.
4.4. Limitations and Future Developments of the Indicator
From our knowledge this is the first study in Portugal considering geographical accessibility based on the catchment area of the hospitals. Most studies published to date consider the closest hospital to evaluate geographical accessibility in Portugal [27,105,106,127]. This was due to some instability in the delimitation of the hospital catchment areas and the constant changes in the hierarchical organization. Moreover, it is the first study that provides evidence on the inappropriateness of considering the centroid of the municipality to account for the whole of the population in Portugal, ignoring the spatial distribution of the population inside the municipality, especially in rural areas where census tracts mostly have lower population densities and where land use is largely non-residential.
Nonetheless, the methodology presents some limitations requiring awareness. First, geographical accessibility is modelled as a static concept with no consideration of temporal variations in services and transportation provision across the diurnal cycle and week. Second, the method considers ideal travel conditions for all individuals, without considering issues, such as road congestion and means of transportation. Third, population-weighted driving times only account for spatial aspects of accessibility and do not take into account the fact that healthcare services are different between them and are spatially and temporally linked in chains or even consider the financial, social or economic constraints in the access to the hospital [76,153]. Fourth, the grained scale could be even smaller by considering the building block where the population lives. Finally, this metric is dependent on the census survey since there are no projections of population by census tract, so updating it is only possible every ten years.
Further enhancements can be introduced on future studies to improve the detail obtained by this metric. For example, other studies might consider different data regarding the health services (e.g., integrate the Spanish hospitals closer to the border, evaluate geographical accessibility to the closest hospital, consider the hospital capacity or other types of health services), the transportation mode (e.g., calculate the time by public transportation according to the main transportation mode used by the population or using the average travel speed on the road) and the population (e.g., taking into account the age of the population and its potential use in health services annually and the temporal fluctuations in population or applying a distance decay based on real utilization of the services).
5. Conclusions
This study provides evidence that, although geographical access has improved over the years, municipalities still present considerable differences in terms of the time it takes to reach the reference hospital. The results highlight that inequalities are still visible, especially in municipalities with a high share of older population, a population-weighted time greater than 30 min and border communities that require higher attention.
By reflecting the current status of the geographical accessibility of the Portuguese municipalities, these findings can contribute to the decision-making process, both local and national, in terms of directing the current and future efforts to reduce disparities between municipalities. Notice that municipalities with weak geographical accessibility have been spotted, explained, discussed and suggestions have been put forward for policy-makers.
The value of using this approach has also been demonstrated and contributes to the field of healthcare planning, population health, public health and probably to other human services. Although this study focuses on a European Union’ peripheric country, such as Portugal, the methodology illustrates possibilities for future research to inform local, regional and national healthcare planning and implementation elsewhere. These results exhibit that it is possible to bring the detail of small-area level information to a larger administrative level by producing an indicator that is directly interpretable in absolute units and is, therefore, easily communicable to and readily understood by policy makers and civil society. This advantage is a direct outcome of the spatial resolution and of the aggregation method this research has achieved. Thus, this method is a step forward in terms of measuring and communicating geographical accessibility.
Author Contributions
Cláudia Costa: Conceptualization, Methodology, Investigation, Writing—Original Draft Preparation, Writing—Review and Editing; José António Tenedório: Methodology, Writing—Review and Editing, Supervision; Paula Santana: Writing—Review and Editing, Funding Acquisition, Supervision. All authors have read and agreed to the published version of the manuscript.
Funding
This research was supported by a Research fellow from the Portuguese Science and Technology Foundation (SFRH/BD/132218/2017), the project GeoHealthS—“Geography of Health Status. An application of a Population Health Index in the last 20 Years” (PTDC/CS-GEO/122566/2010), the project GRAMPCITY—Moving towards accessible and inclusive urban environments for our elders (PTDC/GES-TRA/32121/2017), and received support from the Centre of Studies in Geography and Spatial Planning (CEGOT), funded by national funds through the Foundation for Science and Technology (FCT) under the reference UIDB/04084/2020.
Acknowledgments
The researchers would like to thank to ESRI—Portugal, Statistics Portugal and the Central Administration of the Health Ministry for providing access to the data. The researchers would also like to thank Adriana Loureiro, Ricardo Almendra, Ângela Freitas, Iwa Stefanik and Joaquim Patriarca for assistance with the analysis and to Karen Bennett, Scott M. Culp and Linda Naughton for reviewing the manuscript.
Conflicts of Interest
The authors declare no conflict of interest.
References
- Santana, P.; Almendra, R. The health of the Portuguese over the last four decades. Méditerranée 2018. [Google Scholar] [CrossRef]
- Yang, D.-H.H.; Goerge, R.; Mullner, R. Comparing GIS-Based Methods of Measuring Spatial Accessibility to Health Services. J. Med. Syst. 2006, 30, 23–32. [Google Scholar] [CrossRef]
- Gu, X.; Zhang, L.; Tao, S.; Xie, B. Spatial accessibility to healthcare services in metropolitan suburbs: The case of qingpu, Shanghai. Int. J. Environ. Res. Public Health 2019, 16, 225. [Google Scholar] [CrossRef] [Green Version]
- Yenisetty, P.T.; Bahadure, P. Measuring Accessibility to Various ASFs from Public Transit using Spatial Distance Measures in Indian Cities. ISPRS Int. J. Geo-Inf. 2020, 9, 446. [Google Scholar] [CrossRef]
- Padeiro, M. Comparing alternative methods to measuring pedestrian access to community pharmacies. Health Serv. Outcomes Res. Methodol. 2018, 18, 1–16. [Google Scholar] [CrossRef]
- European Commission. Delivering the Sustainable Development Goals at Local and Regional Level; European Commission: Brussels, Belgium, 2018. [Google Scholar]
- Zaucha, J.; Komornicki, T.; Böhme, K.; Światek, D.; Zuber, P. Territorial Keys for Bringing Closer the Territorial Agenda of the EU and Europe 2020. Eur. Plan. Stud. 2014. [Google Scholar] [CrossRef] [Green Version]
- Murad, A. Using GIS for Determining Variations in Health Access in Jeddah City, Saudi Arabia. ISPRS Int. J. Geo-Inf. 2018, 7, 254. [Google Scholar] [CrossRef] [Green Version]
- Khakh, A.K.; Fast, V.; Shahid, R. Spatial accessibility to primary healthcare services by multimodal means of travel: Synthesis and case study in the city of calgary. Int. J. Environ. Res. Public Health 2019, 16, 270. [Google Scholar] [CrossRef] [Green Version]
- El-Geneidy, A.M.; Levinson, D.M. Access to Destinations: Development of Accessibility Measures; Minnesota Department of Transportation Research Services Section: Minneapolis, MN, USA, 2006. [Google Scholar]
- Penchansky, R.; Thomas, J.W. The concept of access: Definition and relationship to consumer satisfaction. Med. Care 1981, 19, 127–140. [Google Scholar] [CrossRef] [PubMed]
- Gulzar, L. Access to health care. J. Nurs. Scholarsh. 1999. [Google Scholar] [CrossRef] [PubMed]
- Joseph, A.E.; Phillips, D.R. Accessibility and Utilization: Geographical Perspectives on Health Care Delivery; Harper & Row: London, UK, 1984; ISBN 0063182769. [Google Scholar]
- Guagliardo, M.F. Spatial accessibility of primary care: Concepts, methods and challenges. Int. J. Health Geogr. 2004, 3, 3. [Google Scholar] [CrossRef] [PubMed] [Green Version]
- Geurs, K.T.; van Wee, B. Accessibility evaluation of land-use and transport strategies: Review and research directions. J. Transp. Geogr. 2004. [Google Scholar] [CrossRef]
- Comber, A.J.; Brunsdon, C.; Radburn, R. A spatial analysis of variations in health access: Linking geography, socio-economic status and access perceptions. Int. J. Health Geogr. 2011, 10. [Google Scholar] [CrossRef] [Green Version]
- Joseph, A.E.; Bantock, P.R. Measuring potential physical accessibility to general practitioners in rural areas: A method and case study. Soc. Sci. Med. 1982, 16, 85–90. [Google Scholar] [CrossRef]
- Ni, J.; Liang, M.; Lin, Y.; Wu, Y.; Wang, C. Multi-Mode Two-Step Floating Catchment Area (2SFCA) Method to Measure the Potential Spatial Accessibility of Healthcare Services. ISPRS Int. J. Geo-Inf. 2019, 8, 236. [Google Scholar] [CrossRef] [Green Version]
- Mizen, A.; Fry, R.; Grinnell, D.; Rodgers, S.E. Quantifying the Error Associated with Alternative GIS-based Techniques to Measure Access to Health Care Services. AIMS Public Health 2015, 2, 746–761. [Google Scholar] [CrossRef] [PubMed]
- Zhou, X.; Yu, Z.; Yuan, L.; Wang, L.; Wu, C. Measuring Accessibility of Healthcare Facilities for Populations with Multiple Transportation Modes Considering Residential Transportation Mode Choice. ISPRS Int. J. Geo-Inf. 2020, 9, 394. [Google Scholar] [CrossRef]
- Lee Deborah, O.M.; Lung Chiu, M.Y.; Cao, K. Geographical accessibility of community health assist system general practitioners for the elderly population in singapore: A case study on the elderly living in housing development board flats. Int. J. Environ. Res. Public Health 2018, 15, 1988. [Google Scholar] [CrossRef] [Green Version]
- Geurs, K.T.; Ritsema van Eck, J. Accessibility Measures: Review and Applications; Rijksinstituut voor Volksgezondheid en Milieu: Utrecht, The Netherlands, 2001; Volume 787, Available online: wwww.rivm.nl/bibliotheek/rapporten/408505006.html (accessed on 6 April 2020).
- Santana, P.; Freitas, A.; Costa, C.; Vaz, A.; Freitas, Â.; Costa, C.; Vaz, A. Εvaluating Population Health: The selection of main Dimensions and Indicators through a participatory approach. Eur. J. Geogr. 2015, 6, 51–63. [Google Scholar]
- McGrail, M.R. Spatial accessibility of primary health care utilising the two step floating catchment area method: An assessment of recent improvements. Int. J. Health Geogr. 2012, 11, 50. [Google Scholar] [CrossRef] [Green Version]
- Santana, P. Acessibilidade e Utilização dos Serviços de Saúde. Ensaio Metodológico em Geografia da Sáúde; CCDR-Centro/ARSCentro: Coimbra, Portugal, 1995. [Google Scholar]
- McLafferty, S.L. GIS and health care. Annu. Rev. Public Health 2003, 24, 25–42. [Google Scholar] [CrossRef] [PubMed]
- Sá Marques, T.; Saraiva, M.; Ribeiro, D.; Amante, A.; Silva, D.; Melo, P. Accessibility to services of general interest in polycentric urban system planning: The case of Portugal. Eur. Plan. Stud. 2020. [Google Scholar] [CrossRef]
- Maheswaran, R.; Pearson, T.; Jordan, H.; Black, D. Socioeconomic deprivation, travel distance, location of service, and uptake of breast cancer screening in North Derbyshire, UK. J. Epidemiol. Community Health 2006, 60, 208. [Google Scholar] [CrossRef] [Green Version]
- Lu, H.; Zhang, X.; Holt, J.B.; Kanny, D.; Croft, J.B. Quantifying spatial accessibility in public health practice and research: An application to on-premise alcohol outlets, United States, 2013. Int. J. Health Geogr. 2018, 17, 23. [Google Scholar] [CrossRef] [Green Version]
- Apparicio, P.; Cloutier, M.S.; Shearmur, R. The case of Montréal’s missing food deserts: Evaluation of accessibility to food supermarkets. Int. J. Health Geogr. 2007. [Google Scholar] [CrossRef] [PubMed] [Green Version]
- Neutens, T. Accessibility, equity and health care: Review and research directions for transport geographers. J. Transp. Geogr. 2015, 43, 14–27. [Google Scholar] [CrossRef]
- Pearce, J.; Witten, K.; Hiscock, R.; Blakely, T. Are socially disadvantaged neighbourhoods deprived of health-related community resources? Int. J. Epidemiol. 2007, 36, 348–355. [Google Scholar] [CrossRef] [Green Version]
- Kelly, C.; Hulme, C.; Farragher, T.; Clarke, G. Are differences in travel time or distance to healthcare for adults in global north countries associated with an impact on health outcomes? A systematic review. BMJ Open 2016, 6. [Google Scholar] [CrossRef]
- Bissonnette, L.; Wilson, K.; Bell, S.; Shah, T.I. Neighbourhoods and potential access to health care: The role of spatial and aspatial factors. Health Place 2012. [Google Scholar] [CrossRef] [Green Version]
- Rosero-Bixby, L. Spatial access to health care in Costa Rica and its equity: A GIS-based study. Soc. Sci. Med. 2004, 58, 1271–1284. [Google Scholar] [CrossRef]
- Wang, F.; McLafferty, S.; Escamilla, V.; Luo, L. Late-stage breast cancer diagnosis and health care access in Illinois. Prof. Geogr. 2008. [Google Scholar] [CrossRef] [PubMed] [Green Version]
- Hsia, R.Y.J.; Shen, Y.C. Rising closures of hospital trauma centers disproportionately Burden vulnerable populations. Health Aff. 2011. [Google Scholar] [CrossRef] [PubMed] [Green Version]
- Fayet, Y.; Coindre, J.M.; Dalban, C.; Gouin, F.; De Pinieux, G.; Farsi, F.; Ducimetière, F.; Chemin-Airiau, C.; Jean-Denis, M.; Chabaud, S.; et al. Geographical accessibility of the referral networks in france. Intermediate results from the IGéAS research program. Int. J. Environ. Res. Public Health 2018, 15, 2204. [Google Scholar] [CrossRef] [PubMed] [Green Version]
- Baird, G.; Flynn, R.; Baxter, G.; Donnelly, M.; Lawrence, J. Travel time and cancer care: An example of the inverse care law? Rural Remote Health 2008. [Google Scholar] [CrossRef]
- Onega, T.; Duell, E.J.; Shi, X.; Wang, D.; Demidenko, E.; Goodman, D. Geographic access to cancer care in the U.S. Cancer 2008. [Google Scholar] [CrossRef]
- Blais, S.; Dejardin, O.; Boutreux, S.; Launoy, G. Social determinants of access to reference care centres for patients with colorectal cancer–A multilevel analysis. Eur. J. Cancer 2006. [Google Scholar] [CrossRef]
- Wu, H.C.; Tseng, M.H. Evaluating disparities in elderly community care resources: Using a geographic accessibility and inequality index. Int. J. Environ. Res. Public Health 2018, 15, 1353. [Google Scholar] [CrossRef] [Green Version]
- Buchmueller, T.C.; Jacobson, M.; Wold, C. How far to the hospital? The effect of hospital closures on access to care. J. Health Econ. 2006. [Google Scholar] [CrossRef]
- Doetsch, J.; Pilot, E.; Santana, P.; Krafft, T. Potential barriers in healthcare access of the elderly population influenced by the economic crisis and the troika agreement: A qualitative case study in Lisbon, Portugal. Int. J. Equity Health 2017, 16, 184. [Google Scholar] [CrossRef]
- Arcury, T.A.; Gesler, W.M.; Preisser, J.S.; Sherman, J.; Spencer, J.; Perin, J. The effects of geography and spatial behavior on health care utilization among the residents of a rural region. Health Serv. Res. 2005, 40, 135–155. [Google Scholar] [CrossRef] [Green Version]
- Syed, S.T.; Gerber, B.S.; Sharp, L.K. Traveling towards disease: Transportation barriers to health care access. J. Community Health 2013, 38, 976–993. [Google Scholar] [CrossRef] [PubMed] [Green Version]
- Pierce, R.P.; Williamson, H.A.; Kruse, R.L. Distance, use of resources, and mortality among rural Missouri residents with acute myocardial infarction. J. Rural Health 1998. [Google Scholar] [CrossRef]
- Friedman, J.M.; Hagander, L.; Hughes, C.D.; Nash, K.A.; Linden, A.F.; Blossom, J.; Meara, J.G. Distance to hospital and utilization of surgical services in Haiti: Do children, delivering mothers, and patients with emergent surgical conditions experience greater geographical barriers to surgical care? Int. J. Health Plan. Manag. 2013. [Google Scholar] [CrossRef] [PubMed]
- Brual, J.; Gravely-Witte, S.; Suskin, N.; Stewart, D.E.; Macpherson, A.; Grace, S.L. Drive time to cardiac rehabilitation: At what point does it affect utilization? Int. J. Health Geogr. 2010, 9, 1–11. [Google Scholar] [CrossRef] [PubMed] [Green Version]
- Målqvist, M.; Sohel, N.; Do, T.T.; Eriksson, L.; Persson, L.Å. Distance decay in delivery care utilisation associated with neonatal mortality. A case referent study in northern Vietnam. BMC Public Health 2010. [Google Scholar] [CrossRef] [Green Version]
- Monnet, E.; Ramée, C.; Minello, A.; Jooste, V.; Carel, D.; Di Martino, V. Socioeconomic context, distance to primary care and detection of hepatitis C: A French population-based study. Soc. Sci. Med. 2008. [Google Scholar] [CrossRef]
- De Souza, V.C.; Strachan, D.P. Relationship between travel time to the nearest hospital and survival from ruptured abdominal aortic aneurysms: Record linkage study. J. Public Health 2005. [Google Scholar] [CrossRef] [Green Version]
- Wei, L.; Lang, C.C.; Sullivan, F.M.; Boyle, P.; Wang, J.; Pringle, S.D.; MacDonald, T.M. Impact on mortality following first acute myocardial infarction of distance between home and hospital: Cohort study. Heart 2008. [Google Scholar] [CrossRef]
- Lyon, R.M.; Cobbe, S.M.; Bradley, J.M.; Grubb, N.R. Surviving out of hospital cardiac arrest at home: A postcode lottery? Emerg. Med. J. 2004, 21, 619–624. [Google Scholar] [CrossRef] [Green Version]
- Jones, A.P.; Haynes, R.; Sauerzapf, V.; Crawford, S.M.; Zhao, H.; Forman, D. Travel times to health care and survival from cancers in Northern England. Eur. J. Cancer 2008, 44, 269–274. [Google Scholar] [CrossRef]
- Campbell, N.C.; Elliott, A.M.; Sharp, L.; Ritchie, L.D.; Cassidy, J.; Little, J. Rural and urban differences in stage at diagnosis of colorectal and lung cancers. Br. J. Cancer 2001. [Google Scholar] [CrossRef] [PubMed] [Green Version]
- Jones, A.P.; Haynes, R.; Sauerzapf, V.; Crawford, S.M.; Zhao, H.; Forman, D. Travel time to hospital and treatment for breast, colon, rectum, lung, ovary and prostate cancer. Eur. J. Cancer 2008, 44, 992–999. [Google Scholar] [CrossRef]
- Jones, A.P.; Bentham, G.; Horwell, C. Health service accessibility and deaths from asthma. Int. J. Epidemiol. 1999. [Google Scholar] [CrossRef] [PubMed]
- Combier, E.; Charreire, H.; Le Vaillant, M.; Michaut, F.; Ferdynus, C.; Amat-Roze, J.M.; Gouyon, J.B.; Quantin, C.; Zeitlin, J. Perinatal health inequalities and accessibility of maternity services in a rural French region: Closing maternity units in Burgundy. Health Place 2013, 24, 225–233. [Google Scholar] [CrossRef] [PubMed]
- Ravelli, A.; Jager, K.; de Groot, M.; Erwich, J.; Rijninks-van Driel, G.; Tromp, M.; Eskes, M.; Abu-Hanna, A.; Mol, B. Travel time from home to hospital and adverse perinatal outcomes in women at term in the Netherlands. BJOG Int. J. Obstet. Gynaecol. 2011, 118, 457–465. [Google Scholar] [CrossRef] [Green Version]
- Campbell, N.C.; Elliott, A.M.; Sharp, L.; Ritchie, L.D.; Cassidy, J.; Little, J. Rural factors and survival from cancer: Analysis of Scottish cancer registrations. Br. J. Cancer 2000. [Google Scholar] [CrossRef] [Green Version]
- McCoy, C.E.; Menchine, M.; Sampson, S.; Anderson, C.; Kahn, C. Emergency medical services out-of-hospital scene and transport times and their association with mortality in trauma patients presenting to an urban level i trauma center. Ann. Emerg. Med. 2013, 61, 167–174. [Google Scholar] [CrossRef]
- Clarke, J.R.; Trooskin, S.Z.; Doshi, P.J.; Greenwald, L.; Mode, C.J. Time to laparotomy for intra-abdominal bleeding from trauma does affect survival for delays up to 90 min. J. Trauma 2002. [Google Scholar] [CrossRef]
- Taylor, A.; Pettit, C. Are Health Services in New South Wales Available Where They are Needed? Using AURIN to Understand the Equity of Service Distribution and Future Demand. Appl. Spat. Anal. Policy 2020. [Google Scholar] [CrossRef]
- Braveman, P. What are Health Disparities and Health Equity? We Need to Be Clear. Public Health Rep. 2014, 129, 5–8. [Google Scholar] [CrossRef] [Green Version]
- Ruiz, V.; Veneri, P. Measuring the Access to Public Services: The Case of Public Hospitals; OECD Working Party on Territorial Indicators: Paris, France, 2012. [Google Scholar]
- Braveman, P. Monitoring Equity in Health: A Policy-Oriented Approach in Low-And Middle-Income Countries (WHO/CHS/HSS/98.1); World Health Organization: Geneva, Switzerland, 1998. [Google Scholar]
- Shen, Y.-C.; Hsia, R.Y. Changes in Emergency Department Access Between 2001 and 2005 Among General and Vulnerable Populations. Am. J. Public Health 2010, 100, 1462–1469. [Google Scholar] [CrossRef] [PubMed]
- Casas, I.; Delmelle, E.; Varela, A. A Space-Time Approach to Diffusion of Health Service Provision Information. Int. Reg. Sci. Rev. 2010, 33, 134–156. [Google Scholar] [CrossRef]
- Alcaraz, K.I.; Kreuter, M.W.; Bryan, R.P. Use of GIS to identify optimal settings for cancer prevention and control in African American communities. Prev. Med. 2009, 49, 54–57. [Google Scholar] [CrossRef] [PubMed] [Green Version]
- Al-Taiar, A.; Clark, A.; Longenecker, J.C.; Whitty, C.J. Physical accessibility and utilization of health services in Yemen. Int. J. Health Geogr. 2010, 9, 38. [Google Scholar] [CrossRef] [PubMed] [Green Version]
- Polo, G.; Acosta, C.M.; Ferreira, F.; Dias, R.A. Location-Allocation and Accessibility Models for Improving the Spatial Planning of Public Health Services. PLoS ONE 2015, 10, e0119190. [Google Scholar] [CrossRef] [Green Version]
- Costa, C. Localização Óptima do Futuro Hospital de Sintra: Aplicação de Modelos de Location-Allocation no Planeamento de Cuidados de Saúde; NOVA Information Management School: Lisboa, Portugal, 2011. [Google Scholar]
- Schuurman, N.; Fiedler, R.S.; Grzybowski, S.C.W.; Grund, D. Defining rational hospital catchments for non-urban areas based on travel-time. Int. J. Health Geogr. 2006, 5, 43. [Google Scholar] [CrossRef] [Green Version]
- Patel, A.B.; Waters, N.M.; Ghali, W.A. Determining geographic areas and populations with timely access to cardiac catheterization facilities for acute myocardial infarction care in Alberta, Canada. Int. J. Health Geogr. 2007, 6, 47. [Google Scholar] [CrossRef] [Green Version]
- Wan, N.; Zhan, F.B.; Zou, B.; Chow, E. A relative spatial access assessment approach for analyzing potential spatial access to colorectal cancer services in Texas. Appl. Geogr. 2012, 32, 291–299. [Google Scholar] [CrossRef]
- Bell, S.; Wilson, K.; Bissonnette, L.; Shah, T. Access to Primary Health Care: Does Neighborhood of Residence Matter? Ann. Assoc. Am. Geogr. 2013, 103, 85–105. [Google Scholar] [CrossRef]
- Ray, N.; Ebener, S. AccessMod 3.0: Computing geographic coverage and accessibility to health care services using anisotropic movement of patients. Int. J. Health Geogr. 2008, 7, 63. [Google Scholar] [CrossRef]
- Braveman, P.; Gottlieb, L. The social determinants of health: It’s time to consider the causes of the causes. Public Health Rep. 2014, 129, 19–31. [Google Scholar] [CrossRef] [PubMed] [Green Version]
- Walsh, S.J.; Page, P.H.; Gesler, W.M. Normative models and healthcare planning: Network-based simulations within a geographic information system environment. Health Serv. Res. 1997, 32, 243. [Google Scholar] [PubMed]
- Cai, E.; Liu, Y.; Jing, Y.; Zhang, L.; Li, J.; Yin, C. Assessing spatial accessibility of public and private residential aged care facilities: A case study in Wuhan, Central China. ISPRS Int. J. Geo-Inf. 2017, 6, 304. [Google Scholar] [CrossRef] [Green Version]
- Hu, S.; Song, W.; Li, C.; Lu, J. The spatial equity of nursing homes in Changchun: A multi-trip modes analysis. ISPRS Int. J. Geo-Inf. 2019, 8, 223. [Google Scholar] [CrossRef] [Green Version]
- Frew, R.; Higgs, G.; Harding, J.; Langford, M. Investigating geospatial data usability from a health geography perspective using sensitivity analysis: The example of potential accessibility to primary healthcare. J. Transp. Health 2017, 6, 128–142. [Google Scholar] [CrossRef]
- Rodrigues, A.; Santana, P.; Santos, R.; Nogueira, H. Optimization of the Urgency-Emergency Network in Mainland Portugal: A methodology for the spatial reorganization of the existing capacity. In Proceedings of the 47th Congress of European Regional Science Association “Local Governance and Sustainable Development”; European Regional Science Association: Paris, France, 2007. [Google Scholar]
- Shah, T.I.; Bell, S.; Wilson, K. Spatial accessibility to health care services: Identifying under-serviced neighbourhoods in Canadian urban areas. PLoS ONE 2016, 11, e0168208. [Google Scholar] [CrossRef]
- Parker, E.B.; Campbell, J.L. Measuring access to primary medical care: Some examples of the use of geographical information systems. Health Place 1998. [Google Scholar] [CrossRef]
- Sasaki, S.; Comber, A.J.; Suzuki, H.; Brunsdon, C. Using genetic algorithms to optimise current and future health planning–the example of ambulance locations. Int. J. Health Geogr. 2010. [Google Scholar] [CrossRef] [Green Version]
- Baeten, R.; Spasova, S.; Vanhercke, B.; Coster, S. Inequalities in Access to Healthcare. A study of National Policies 2018; European Commission: Brussels, Belgium, 2018. [Google Scholar]
- OECD/European Observatory on Health Systems and Policies. Portugal: Country Health Profile 2017, State of Health in the EU; OECD Publishing: Brussels, Belgium, 2017. [Google Scholar]
- Santana, P. Utilização dos cuidados hospitalares: Uma abordagem da geografia da saúde. In As Reformas dos Sistemas de Saúde; Vaz, A., Ramos, F., Pereira, J., Eds.; APES: Lisboa, Portugal, 1996; pp. 182–208. [Google Scholar]
- Vaz, S.; Ramos, P.; Santana, P. Distance effects on the accessibility to emergency departments in Portugal. Saúde e Soc. 2014. [Google Scholar] [CrossRef]
- Costa, C.; Tenedório, J.A.; Santana, P. Amenable mortality and the geographic accessibility to healthcare in Portugal. In Proceedings of the 3rd Congresso Internacional de Saúde do IPLeiria, Leiria, Portugal, 1 July 2016; Volume 16. [Google Scholar]
- Perista, P. ESPN Thematic Report on Inequalities in Access to Healthcare–Portugal; European Commission: Brussels, Belgium, 2018. [Google Scholar]
- Assembleia da República Lei-Quadro da Transferência de Competências para as Autarquias Locais e para as Entidades Intermunicipais. Available online: https://dre.pt/application/conteudo/116068877 (accessed on 10 June 2020).
- Hewko, J.; Smoyer-Tomic, K.E.; Hodgson, M.J. Measuring neighbourhood spatial accessibility to urban amenities: Does aggregation error matter? Environ. Plan. A 2002, 34, 1185–1206. [Google Scholar] [CrossRef]
- Apparicio, P.; Shearmur, R.G.; Brochu, M.; Dussault, G. The measure of distance in a social science policy context: Advantages and costs of using network distances in eight canadians metropolitan areas. J. Geogr. Inf. Decis. Anal. 2003, 7, I05–I31. [Google Scholar]
- Handy, S.L.; Niemeier, D.A. Measuring Accessibility: An Exploration of Issues and Alternatives. Environ. Plan. A Econ. Sp. 1997, 29, 1175–1194. [Google Scholar] [CrossRef]
- Apparicio, P.; Abdelmajid, M.; Riva, M.; Shearmur, R. Comparing alternative approaches to measuring the geographical accessibility of urban health services: Distance types and aggregation-error issues. Int. J. Health Geogr. 2008, 7, 7. [Google Scholar] [CrossRef] [PubMed] [Green Version]
- Roquette, R.; Nunes, B.; Painho, M. The relevance of spatial aggregation level and of applied methods in the analysis of geographical distribution of cancer mortality in mainland Portugal (2009–2013). Popul. Health Metr. 2018, 16, 6. [Google Scholar] [CrossRef]
- Apparicio, P.; Gelb, J.; Dubé, A.S.; Kingham, S.; Gauvin, L.; Robitaille, É. The approaches to measuring the potential spatial access to urban health services revisited: Distance types and aggregation-error issues. Int. J. Health Geogr. 2017. [Google Scholar] [CrossRef]
- Delamater, P.L.; Messina, J.P.; Shortridge, A.M.; Grady, S.C. Measuring geographic access to health care: Raster and network-based methods. Int. J. Health Geogr. 2012, 11, 15. [Google Scholar] [CrossRef] [Green Version]
- Dewulf, B.; Neutens, T.; De Weerdt, Y.; Van De Weghe, N. Accessibility to primary health care in Belgium: An evaluation of policies awarding financial assistance in shortage areas. BMC Fam. Pract. 2013. [Google Scholar] [CrossRef] [Green Version]
- Luo, W.; Wang, F. Measures of spatial accessibility to health care in a GIS environment: Synthesis and a case study in the Chicago region. Environ. Plan. B Plan. Des. 2003, 30, 865–884. [Google Scholar] [CrossRef] [Green Version]
- Boisjoly, G.; El-Geneidy, A. Daily fluctuations in transit and job availability: A comparative assessment of time-sensitive accessibility measures. J. Transp. Geogr. 2016. [Google Scholar] [CrossRef]
- Freiria, S.; Tavares, A.O.; Julião, R.P. The benefits of a link-based assessment of health services accessibility: Unveiling gaps in Central Region of Portugal. Land Use Policy 2019, 87, 104034. [Google Scholar] [CrossRef]
- Polzin, P.; Borges, J.; Coelho, A. An extended kernel density two-step floating catchment area method to analyze access to health care. Environ. Plan. B Plan. Des. 2014. [Google Scholar] [CrossRef]
- Langford, M.; Higgs, G.; Jones, S. Understanding Spatial Variations in Accessibility to Banks Using Variable Floating Catchment Area Techniques. Appl. Spat. Anal. Policy 2020, 1–24. [Google Scholar] [CrossRef]
- Zhu, L.; Zhong, S.; Tu, W.; Zheng, J.; He, S.; Bao, J.; Huang, C. Assessing spatial accessibility to medical resources at the community level in shenzhen, China. Int. J. Environ. Res. Public Health 2019, 16, 242. [Google Scholar] [CrossRef] [PubMed] [Green Version]
- Jamtsho, S.; Corner, R.; Dewan, A. Spatio-temporal analysis of spatial accessibility to primary health care in Bhutan. ISPRS Int. J. Geo-Inf. 2015, 4, 1584–1604. [Google Scholar] [CrossRef]
- Padeiro, M. Geographical accessibility to community pharmacies by the elderly in metropolitan Lisbon. Res. Soc. Adm. Pharm. 2018, 14, 653–662. [Google Scholar] [CrossRef] [PubMed]
- Brabyn, L.; Skelly, C. Modeling population access to New Zealand public hospitals. Int. J. Health Geogr. 2002. [Google Scholar] [CrossRef] [Green Version]
- Schuurman, N.; Bérubé, M.; Crooks, V.A. Measuring potential spatial access to primary health care physicians using a modified gravity model. Can. Geogr./Le Géographe Can. 2010, 54, 29–45. [Google Scholar] [CrossRef]
- Bhat, C.; Handy, S.; Kockelman, K.; Mahmassani, H.; Chen, Q.; Weston, L.L.; Handy, S.; Mahmassani, H.; Weston, L.L. Urban Accessibility Index: Literature Review; The University of Texas at Austin: Austin, TX, USA, 2000. [Google Scholar]
- Tenkanen, H.; Saarsalmi, P.; Järv, O.; Salonen, M.; Toivonen, T. Health research needs more comprehensive accessibility measures: Integrating time and transport modes from open data. Int. J. Health Geogr. 2016, 15, 23. [Google Scholar] [CrossRef] [PubMed] [Green Version]
- Openshaw, S. The Modifiable Areal Unit Problem. Concepts and Techniques in Modern Geography; Geobooks: Norwich, UK, 1984. [Google Scholar]
- Zhang, X.; Lu, H.; Holt, J.B. Modeling spatial accessibility to parks: A national study. Int. J. Health Geogr. 2011, 10, 31. [Google Scholar] [CrossRef] [Green Version]
- Rodrigues, A.M.; Tenedório, J.A. Sensitivity analysis of spatial autocorrelation using distinct geometrical settings: Guidelines for the quantitative geographer. Int. J. Agric. Environ. Inf. Syst. 2016. [Google Scholar] [CrossRef] [Green Version]
- Diez Roux, A.V. Investigating neighborhood and area effects on health. Am. J. Public Health 2001, 91, 1783–1789. [Google Scholar] [CrossRef] [PubMed]
- Almendra, R.; Santana, P.; Vasconcelos, J. Evidence of social deprivation on the spatial patterns of excess winter mortality. Int. J. Public Health 2017, 62, 849–856. [Google Scholar] [CrossRef] [PubMed] [Green Version]
- Santana, P.; Costa, C.; Loureiro, A.; Raposo, J.; Boavida, J.M. The geography of Diabetes Mellitus in Portugal: How context influence the risk of dying. Acta Med. Port. 2014, 27, 309–317. [Google Scholar] [CrossRef] [PubMed]
- Santana, P.; Costa, C.; Cardoso, G.; Loureiro, A.; Ferrão, J. Suicide in Portugal: Spatial determinants in a context of economic crisis. Health Place 2015, 35, 85–94. [Google Scholar] [CrossRef] [Green Version]
- de Almeida Simoes, J.; Augusto, G.F.; Fronteira, I.; Hernandez-Quevedo, C. Portugal: Health System Review. Health Syst. Transit. 2017, 19, 1–184. [Google Scholar]
- Santana, P. A Geografia da Saúde da População. Evolução nos Últimos 20 anos em Portugal Continental; Centro de Estudos de Geografia e Ordenamento do Território (CEGOT)–Universidade de Coimbra, Ed.; Universidade de Coimbra: Coimbra, Portugal, 2015. [Google Scholar]
- Dimitrovová, K.; Perelman, J.; Serrano-Alarcón, M. Effect of a national primary care reform on avoidable hospital admissions (2000–2015): A difference-in-difference analysis. Soc. Sci. Med. 2020, 252, 112908. [Google Scholar] [CrossRef]
- Rego, G.; Nunes, R.; Costa, J. The challenge of corporatisation: The experience of Portuguese public hospitals. Eur. J. Health Econ. 2010, 11, 367–381. [Google Scholar] [CrossRef]
- OECD. OECD Review of Policy Indicators for Portugal. 2015. Available online: https://www.fct.pt/gabestudosestrategia/OCDE/docs/OECD_Policy_Indicators_for_Portugal_report.pdf. (accessed on 10 June 2020).
- Lopes, H.S.; Ribeiro, V.; Remoaldo, P.C. Spatial Accessibility and Social Inclusion: The Impact of Portugal’s Last Health Reform. GeoHealth 2019. [Google Scholar] [CrossRef] [Green Version]
- Vidal, D.G.; Pontes, M.; Barreira, E.; Oliveira, G.M.; Maia, R.L. Differential mortality and inequalities in health services access in Mainland Portugal. Finisterra 2018, 53, 53–70. [Google Scholar] [CrossRef]
- Ferrão, J. Portugal, três geografias em recombinação: Espacialidades, mapas cognitivos e identidades territorais. Lusotopie 2002, 2, 151–158. [Google Scholar]
- Lopes, H.; Remoaldo, P. Acessibilidade espacial aos serviços de saúde em Portugal Continental. In Proceedings of the XV Colóquio Ibérico de Geografia; Associação Portuguesa de Geógrafos: Porto, Portugal, 2016. [Google Scholar]
- European Commission. Directorate General XVI. Thematic Study of Transport: Country Report Portugal; European Commission (EC): Brussels, Belgium, 2000. [Google Scholar]
- Pereira Rosmaninho, G. The Regulation of Road Infrastructure Operators in Portugal; Technical University of Lisbon: Lisbon, Portugal, 2010. [Google Scholar]
- Santana, P. Os ganhos em saúde e no acesso aos serviços de saúde. In 30 anos do Serviço Nacional de Saúde: Um Percurso Comentado; Simões, J., Ed.; Editora Almedina: Coimbra, Portugal, 2010. [Google Scholar]
- Nicolau, R.; David, J.; Caetano, M.; Pereira, J.M.C. Ratio of land consumption rate to population growth rate-analysis of different formulations applied to mainland Portugal. ISPRS Int. J. Geo-Inf. 2019, 8, 10. [Google Scholar] [CrossRef] [Green Version]
- Statistics National Institute. Censos 2011. Available online: https://www.ine.pt/xportal/xmain?xpid=INE&xpgid=ine_publicacoes&PUBLICACOESpub_boui=73212469&PUBLICACOESmodo=2 (accessed on 9 June 2020).
- OECD. OECD Regions and Cities at a Glance 2018; OECD Regions and Cities at a Glance; OECD: Paris, France, 2018. [Google Scholar]
- Condeço-Melhorado, A.; Christidis, P. Road Accessibility in Border Regions: A Joint Approach. Netw. Spat. Econ. 2018. [Google Scholar] [CrossRef]
- Vulevic, A.; Castanho, R.A.; Gómez, J.M.N.; Loures, L.; Cabezas, J.; Fernández-Pozo, L.; Gallardo, J.M.; Naranjo Gómez, J.M.; Loures, L.; Cabezas, J.; et al. Accessibility dynamics and regional cross-border cooperation (cbc) perspectives in the Portuguese-Spanish Borderland. Sustainability 2020, 12, 1978. [Google Scholar] [CrossRef] [Green Version]
- Crisp, L.N.; Berwick, D.; Kickbusch, I.; Antunes, J.L.; Barros, P.P.; Soares, J. Um Futuro para a Saúde–Todos Temos um Papel a Desempenhar; Lisbon. Available online: https://content.gulbenkian.pt/wp-content/uploads/2016/03/30003652/PGIS_BrochuraRelatorioCompletoHealthPortugues.pdf (accessed on 9 June 2020).
- Ribeiro, A.I.; Krainski, E.T.; Carvalho, M.S.; de Pina, M.D.F. The influence of socioeconomic deprivation, access to healthcare and physical environment on old-age survival in Portugal. Geospat. Health 2017, 12, 252–263. [Google Scholar] [CrossRef] [PubMed] [Green Version]
- Andersen, R.M. Revisiting the behavioral model and access to medical care: Does it matter? J. Health Soc. Behav. 1995. [Google Scholar] [CrossRef]
- Pita, P.; Sara, B.; Machado, R.; De, J.; Simões, A. Health Systems in Transition. Available online: http://https://www.euro.who.int/__data/assets/pdf_file/0007/337471/HiT-Portugal.pdf?ua=1 (accessed on 4 July 2020).
- Brand, H.; Hollederer, A.; Wolf, U.; Brand, A. Cross-border health activities in the Euregios: Good practice for better health. Health Policy 2008, 86, 245–254. [Google Scholar] [CrossRef] [PubMed]
- Ferreira, V. Cross-border cooperation in the galicia-northern Portugal euroregion. JANUS. NET 2019, 10, 143–151. [Google Scholar] [CrossRef]
- Durà, A.; Camonita, F.; Berzi, M.; Noferini, A. Euroregions, Excellence and Innovation across EU Borders. A Catalogue of Good Practices.|FUTURIUM|European Commission; Barcelona; Department of Geography: Abu Dhabi, UAE, 2018. [Google Scholar]
- Regions for Health Network. The Healthacross Initiative: How Lower Austria Is Boosting Cross-Border Collaboration in Health; World Health Organization: Copenhagen, Denmark, 2018. [Google Scholar]
- Lillicrap, L.; Hunter, C.; Goldswain, P. Improving geriatric care and reducing hospitalisations in regional and remote areas: The benefits of telehealth. J. Telemed. Telecare 2019. [Google Scholar] [CrossRef] [PubMed]
- Ferreira, D. Papel da Telesaúde em Tempos de Pandemia COVID-19: Para Grandes Males, Grandes Remédios The Role of Telehealth in the COVID-19 Era: Great Ills Require Great Remedies. Med. Interna 2020, 1–5. [Google Scholar] [CrossRef]
- Langford, M.; Fry, R.; Higgs, G. Measuring transit system accessibility using a modified two-step floating catchment technique. Int. J. Geogr. Inf. Sci. 2012. [Google Scholar] [CrossRef]
- Vandenbulcke, G.; Steenberghen, T.; Thomas, I. Mapping accessibility in Belgium: A tool for land-use and transport planning? J. Transp. Geogr. 2009, 17, 39–53. [Google Scholar] [CrossRef]
- Tatem, A.J.; Adamo, S.; Bharti, N.; Burgert, C.R.; Castro, M.; Dorelien, A.; Fink, G.; Linard, C.; John, M.; Montana, L.; et al. Mapping populations at risk: Improving spatial demographic data for infectious disease modeling and metric derivation. Popul. Health Metr. 2012. [Google Scholar] [CrossRef] [PubMed]
- Costa, C.; Santana, P.; Santos, R.; Loureiro, A. Pre-School Facilities and Catchment Area Profiling: A Planning Support Method. In Geospatial Thinking. Lecture Notes in Geoinformation and Cartography; Paínho, M., Santos, M., Pundt, H., Eds.; Springer: Berlin/Heidelberg, Germany, 2010; pp. 97–117. [Google Scholar]
- Neutens, T.; Delafontaine, M.; Scott, D.M.; De Maeyer, P. A GIS-based method to identify spatiotemporal gaps in public service delivery. Appl. Geogr. 2012, 32, 253–264. [Google Scholar] [CrossRef] [Green Version]
Figure 1.
Workflow implemented to build the population-weighted driving time indicator.

Figure 2.
Difference between the maximum and minimum time required by the census tracts within each municipality to reach the hospital in 1991 and 2011.
Figure 2.
Difference between the maximum and minimum time required by the census tracts within each municipality to reach the hospital in 1991 and 2011.

Figure 3.
Population-weighted driving time to the reference hospital in Portugal by municipality in 1991, 2001 and 2011. Note: The population-weighted driving time to the reference hospital, by year and municipality, is available here: saudemunicipio.uc.pt.
Figure 3.
Population-weighted driving time to the reference hospital in Portugal by municipality in 1991, 2001 and 2011. Note: The population-weighted driving time to the reference hospital, by year and municipality, is available here: saudemunicipio.uc.pt.

Figure 4.
Differences in minutes between 1991 and 2011 of the Population-weighted driving time to the reference hospital by municipality.
Figure 4.
Differences in minutes between 1991 and 2011 of the Population-weighted driving time to the reference hospital by municipality.

Figure 5.
Difference in the population weighted driving time by municipality in 1991 and 2011 when considering the reference hospital and the closest hospital.
Figure 5.
Difference in the population weighted driving time by municipality in 1991 and 2011 when considering the reference hospital and the closest hospital.

Figure 6.
Impact of each factor on the change in population-weighted driving time to the reference hospital by municipality between 1991 and 2011: (a) reference hospital (municipality where the reference hospital changed); (b) road network (municipality where a road with a legal speed limit equal or higher to 100 km/h was built); (c) population (municipality where there was a 10% increase/decrease in the share of population living on predominantly urban parishes).

Figure 7.
Share of elderly population (y-axis), population-weighted driving time to the reference hospital (x-axis) and population density (area) by municipality in 1991 and 2011.
Figure 7.
Share of elderly population (y-axis), population-weighted driving time to the reference hospital (x-axis) and population density (area) by municipality in 1991 and 2011.

Figure 8.
Municipalities with geographical accessibility issues regarding the demographic characteristics analyzed, 2011.
Figure 8.
Municipalities with geographical accessibility issues regarding the demographic characteristics analyzed, 2011.


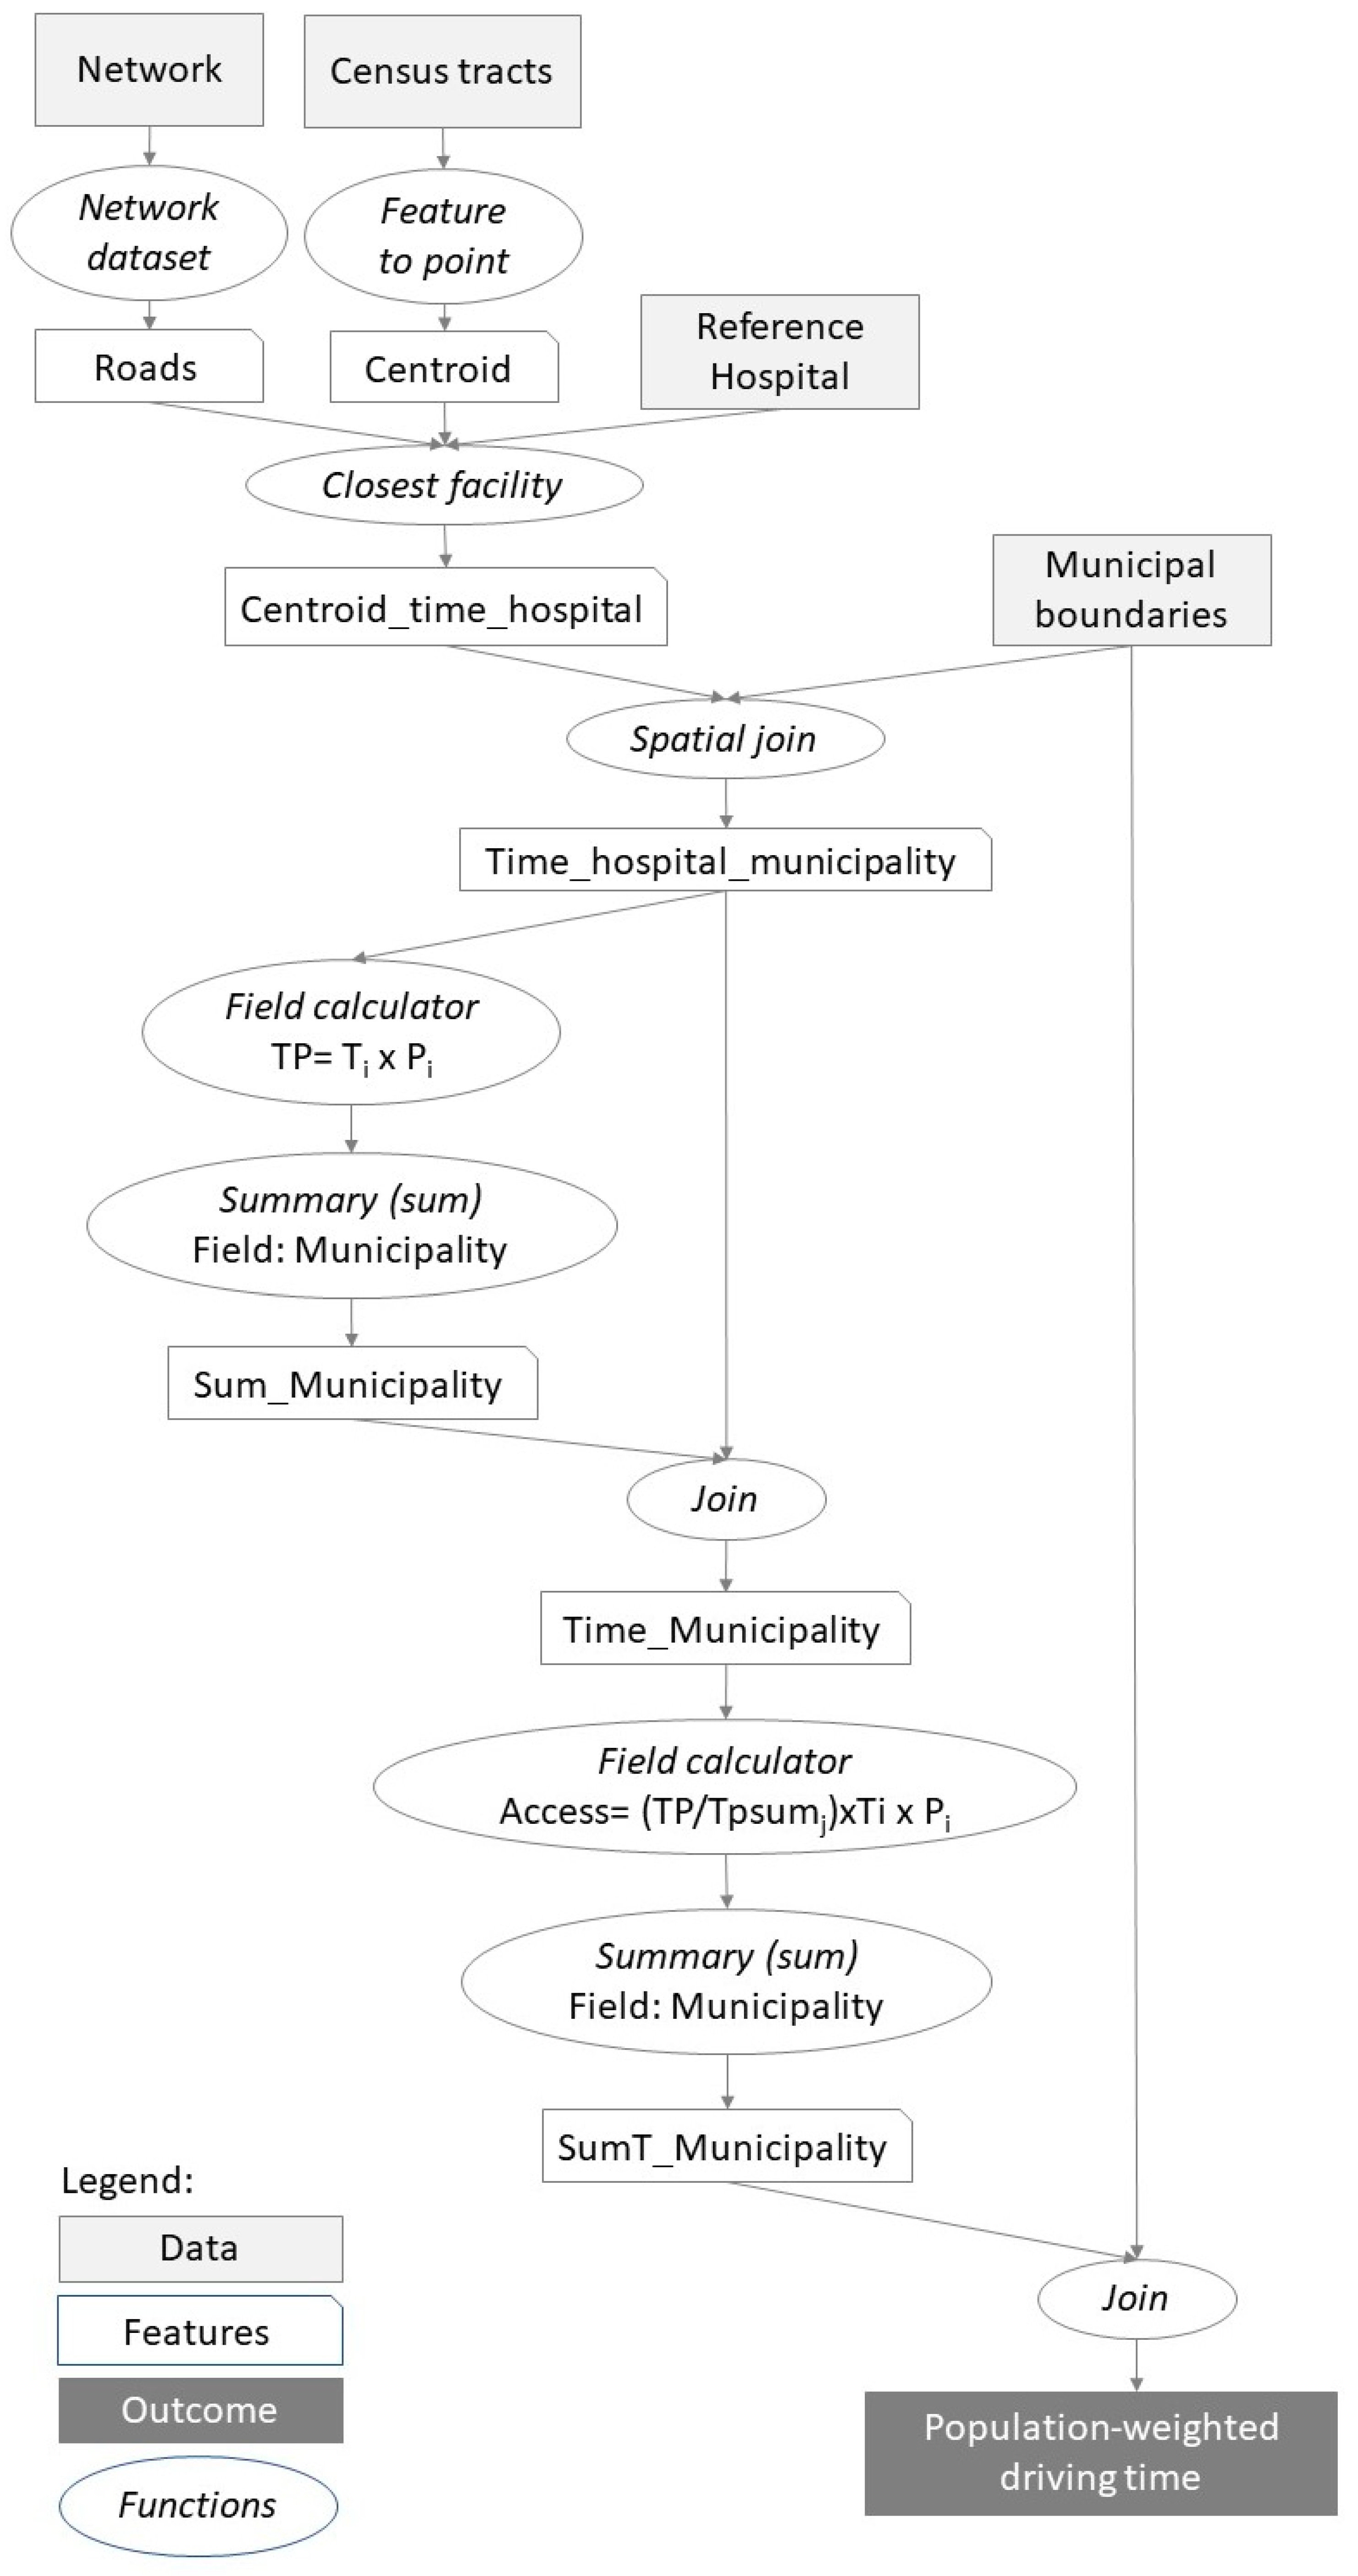
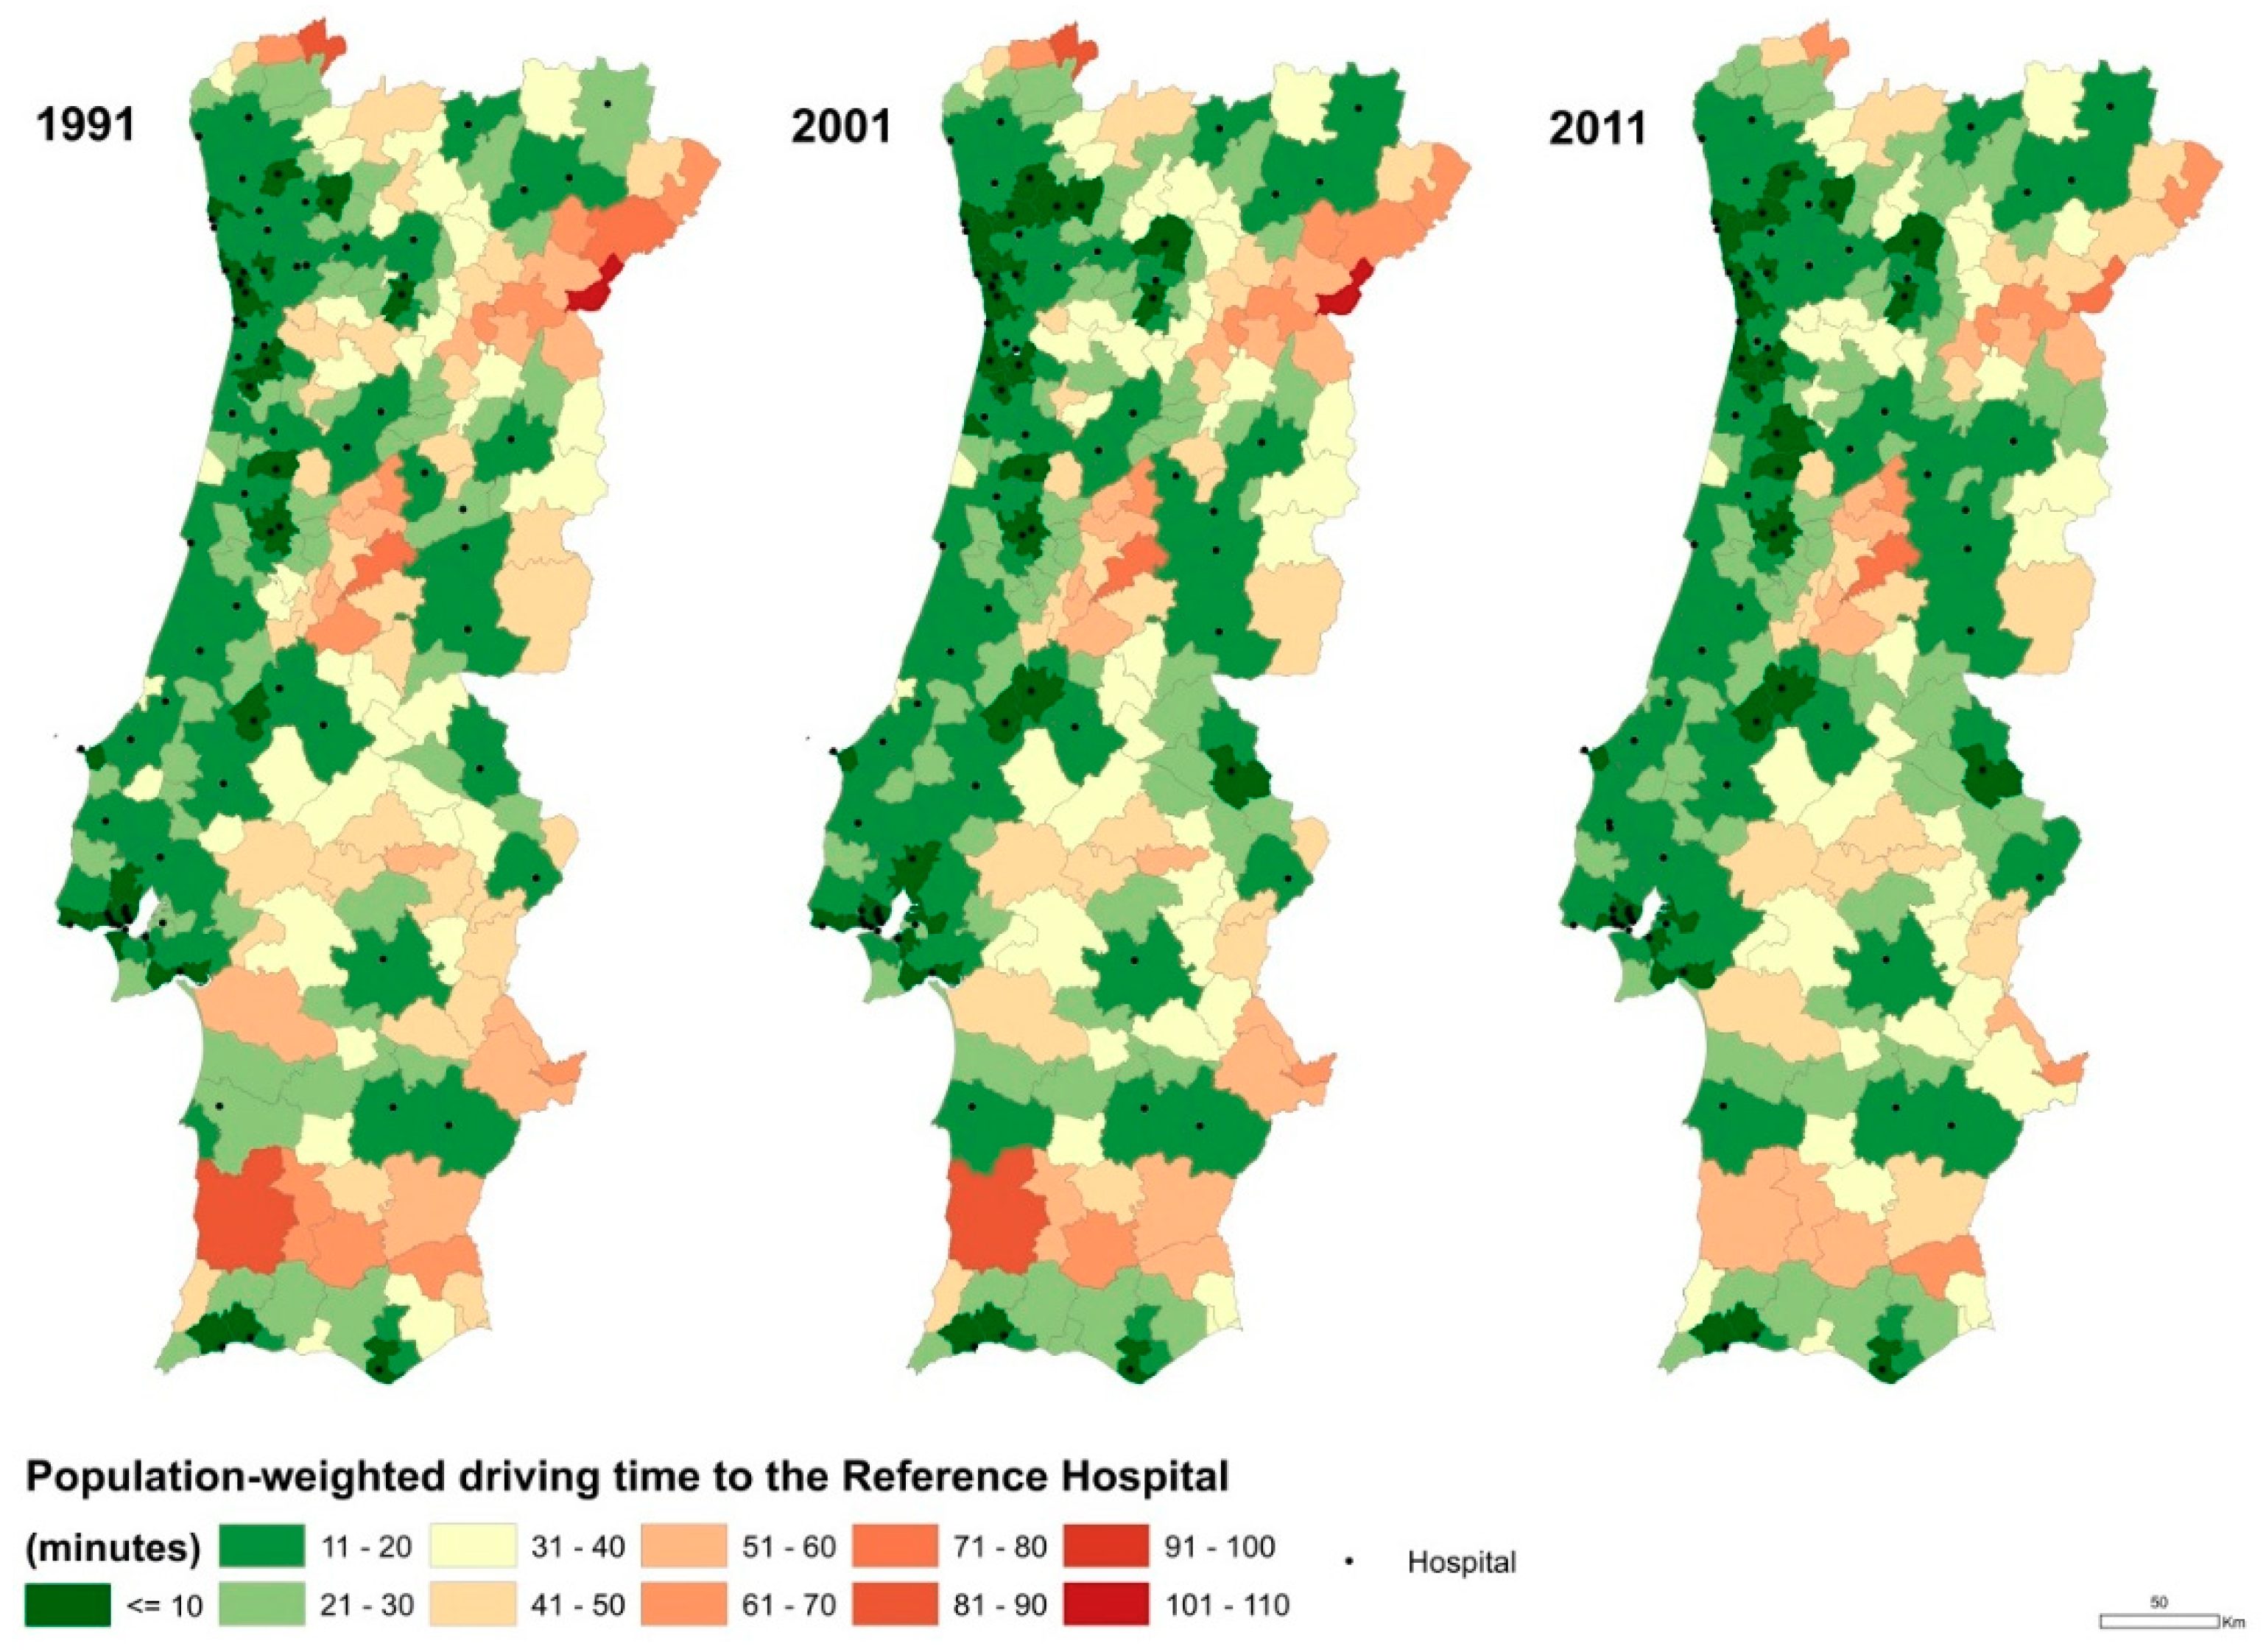
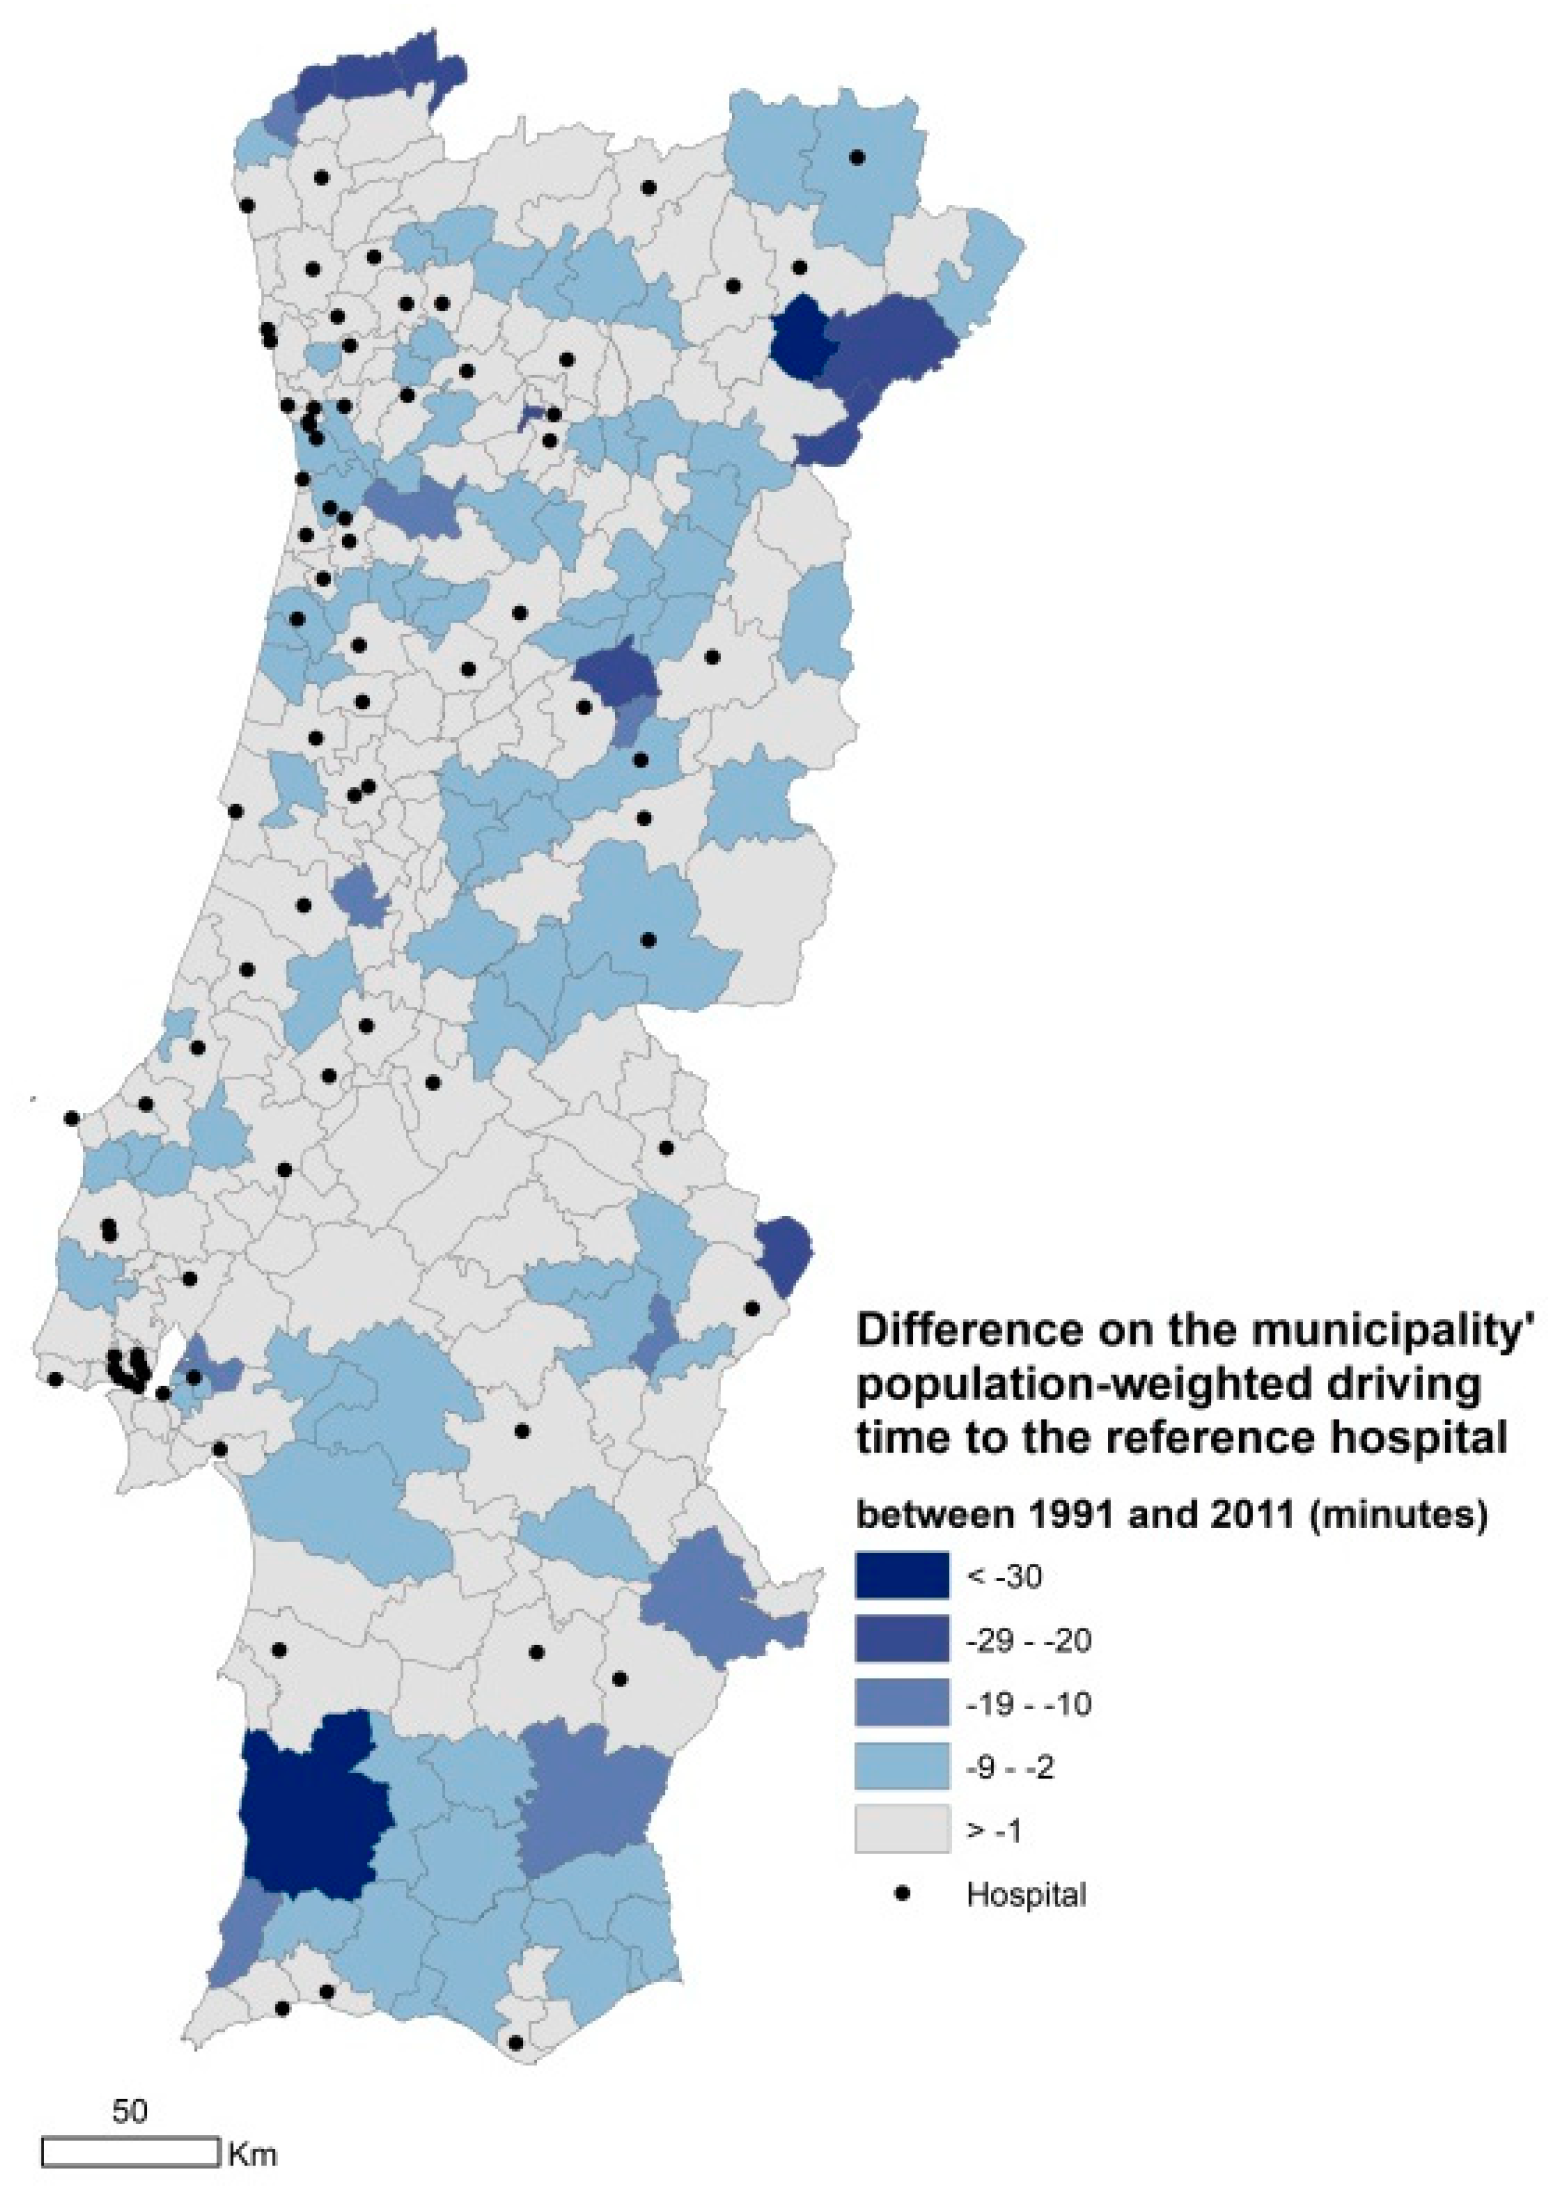
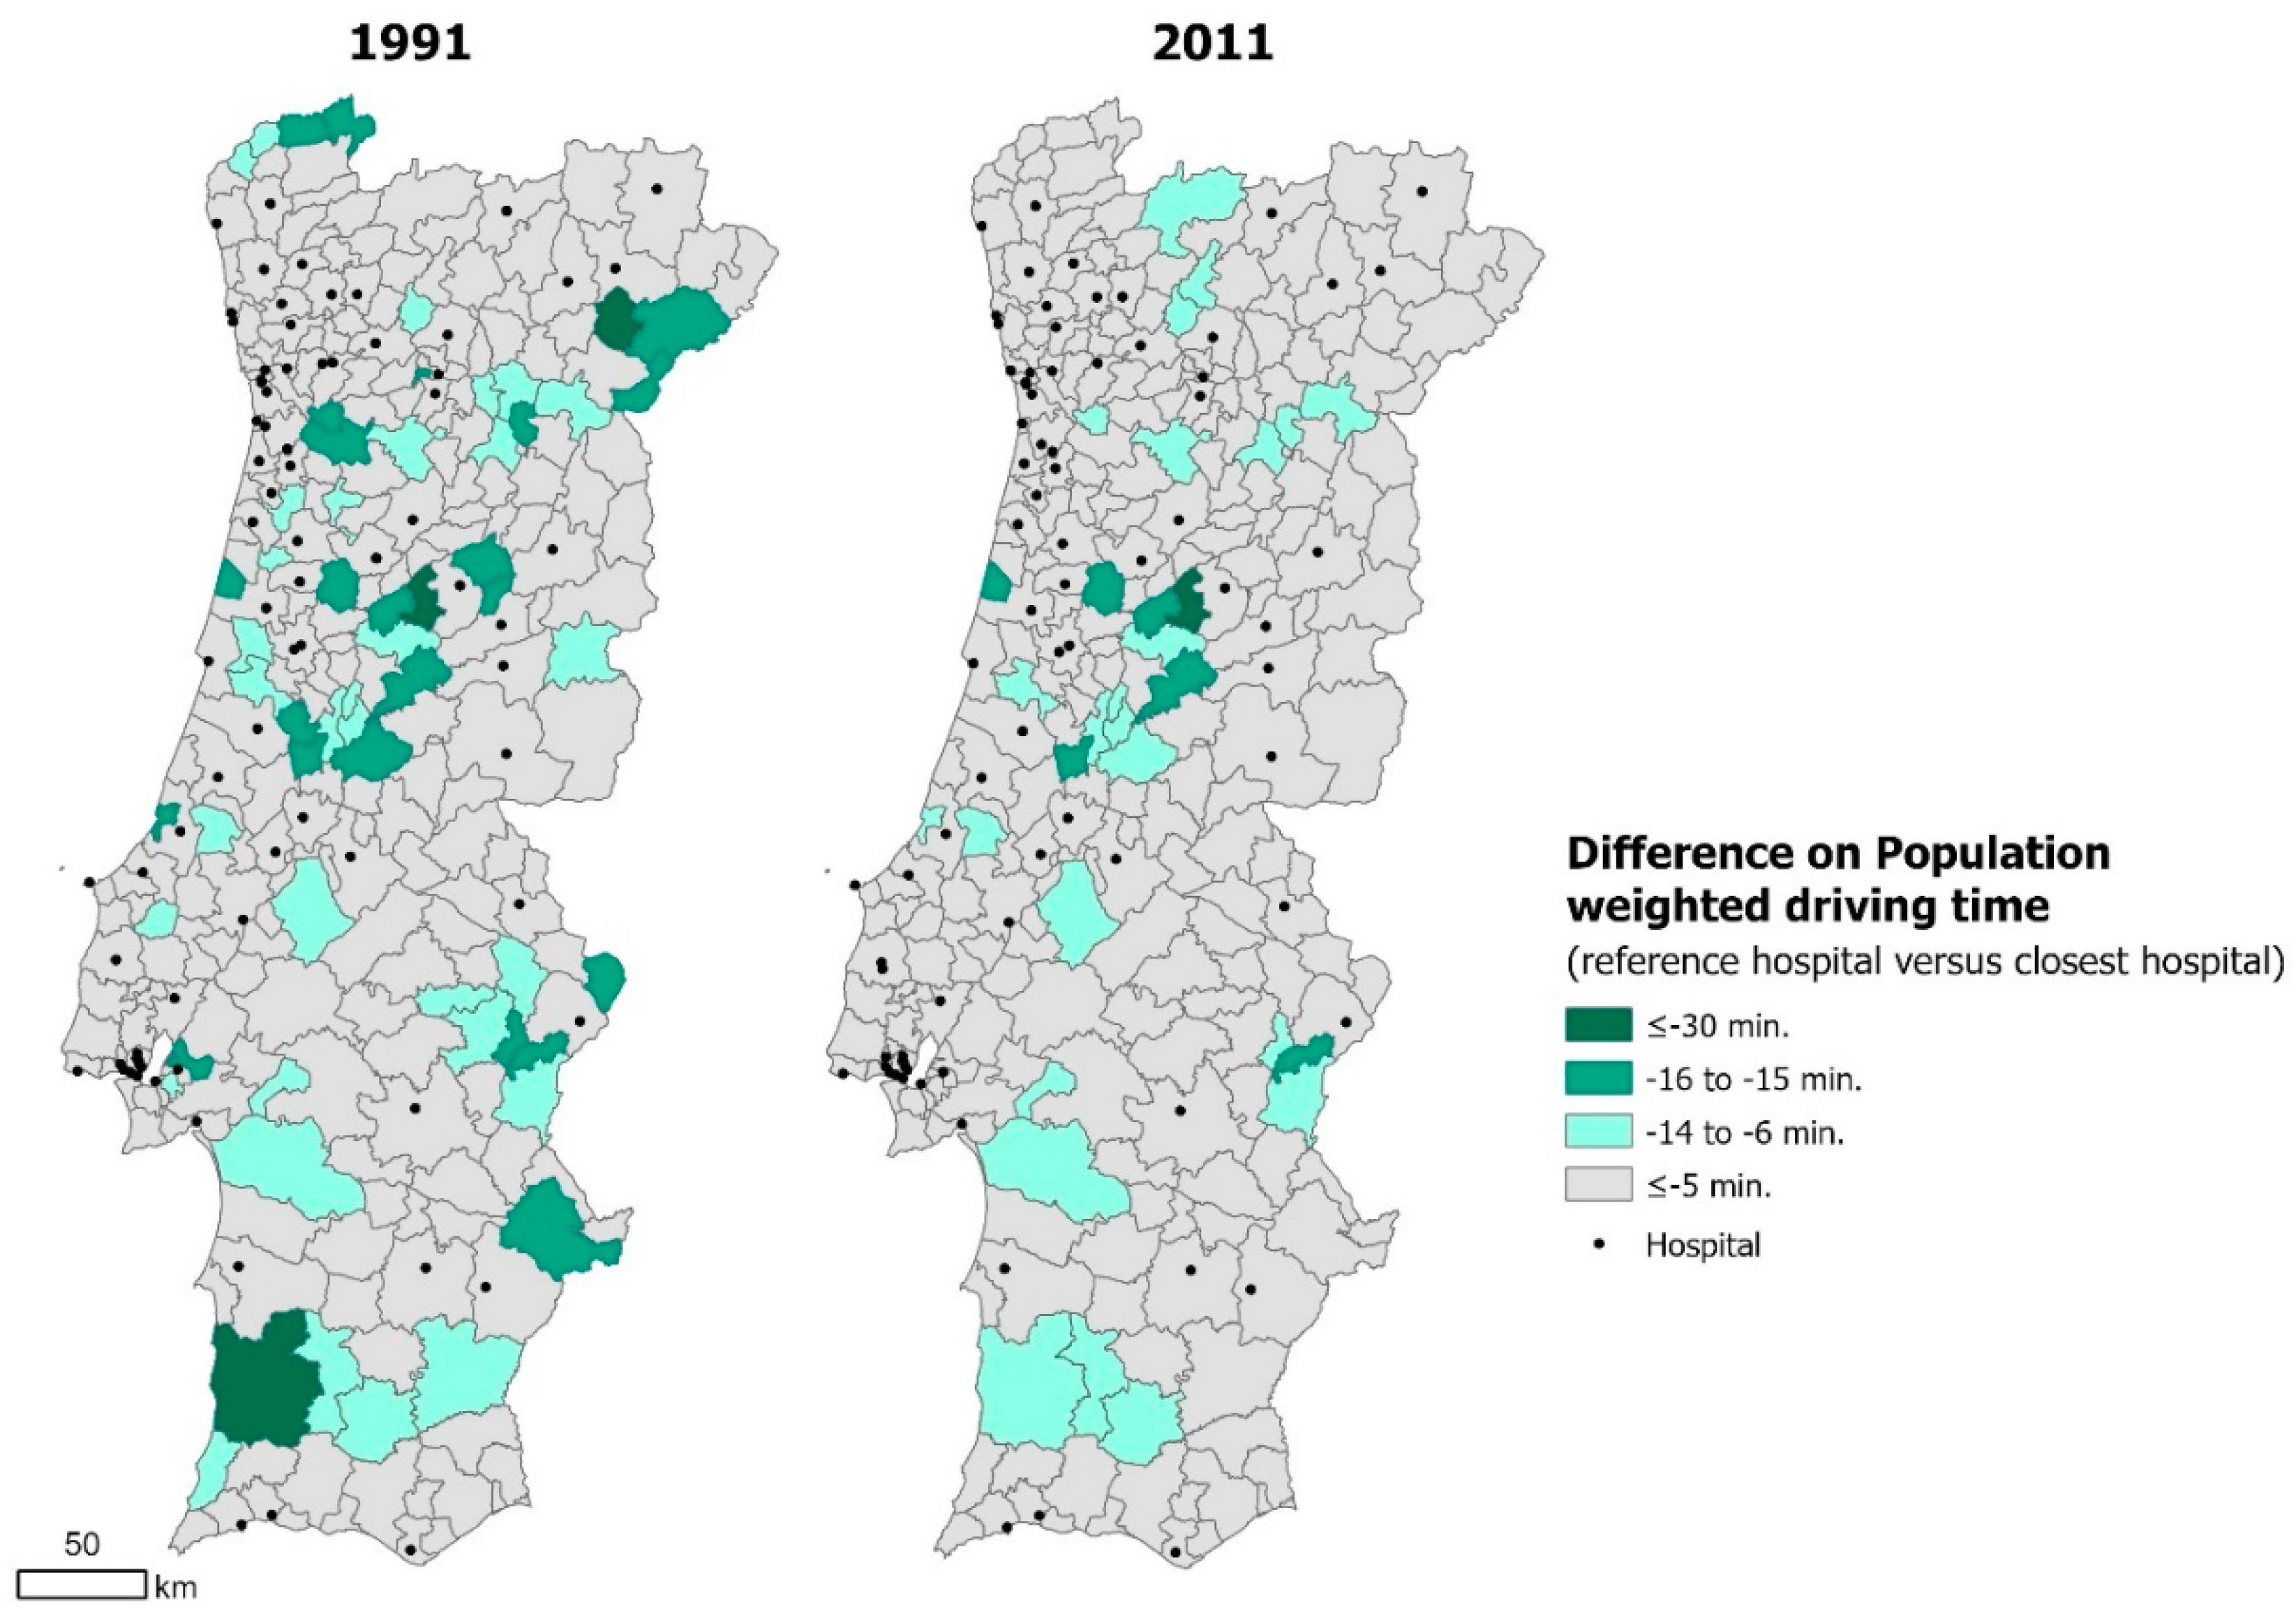
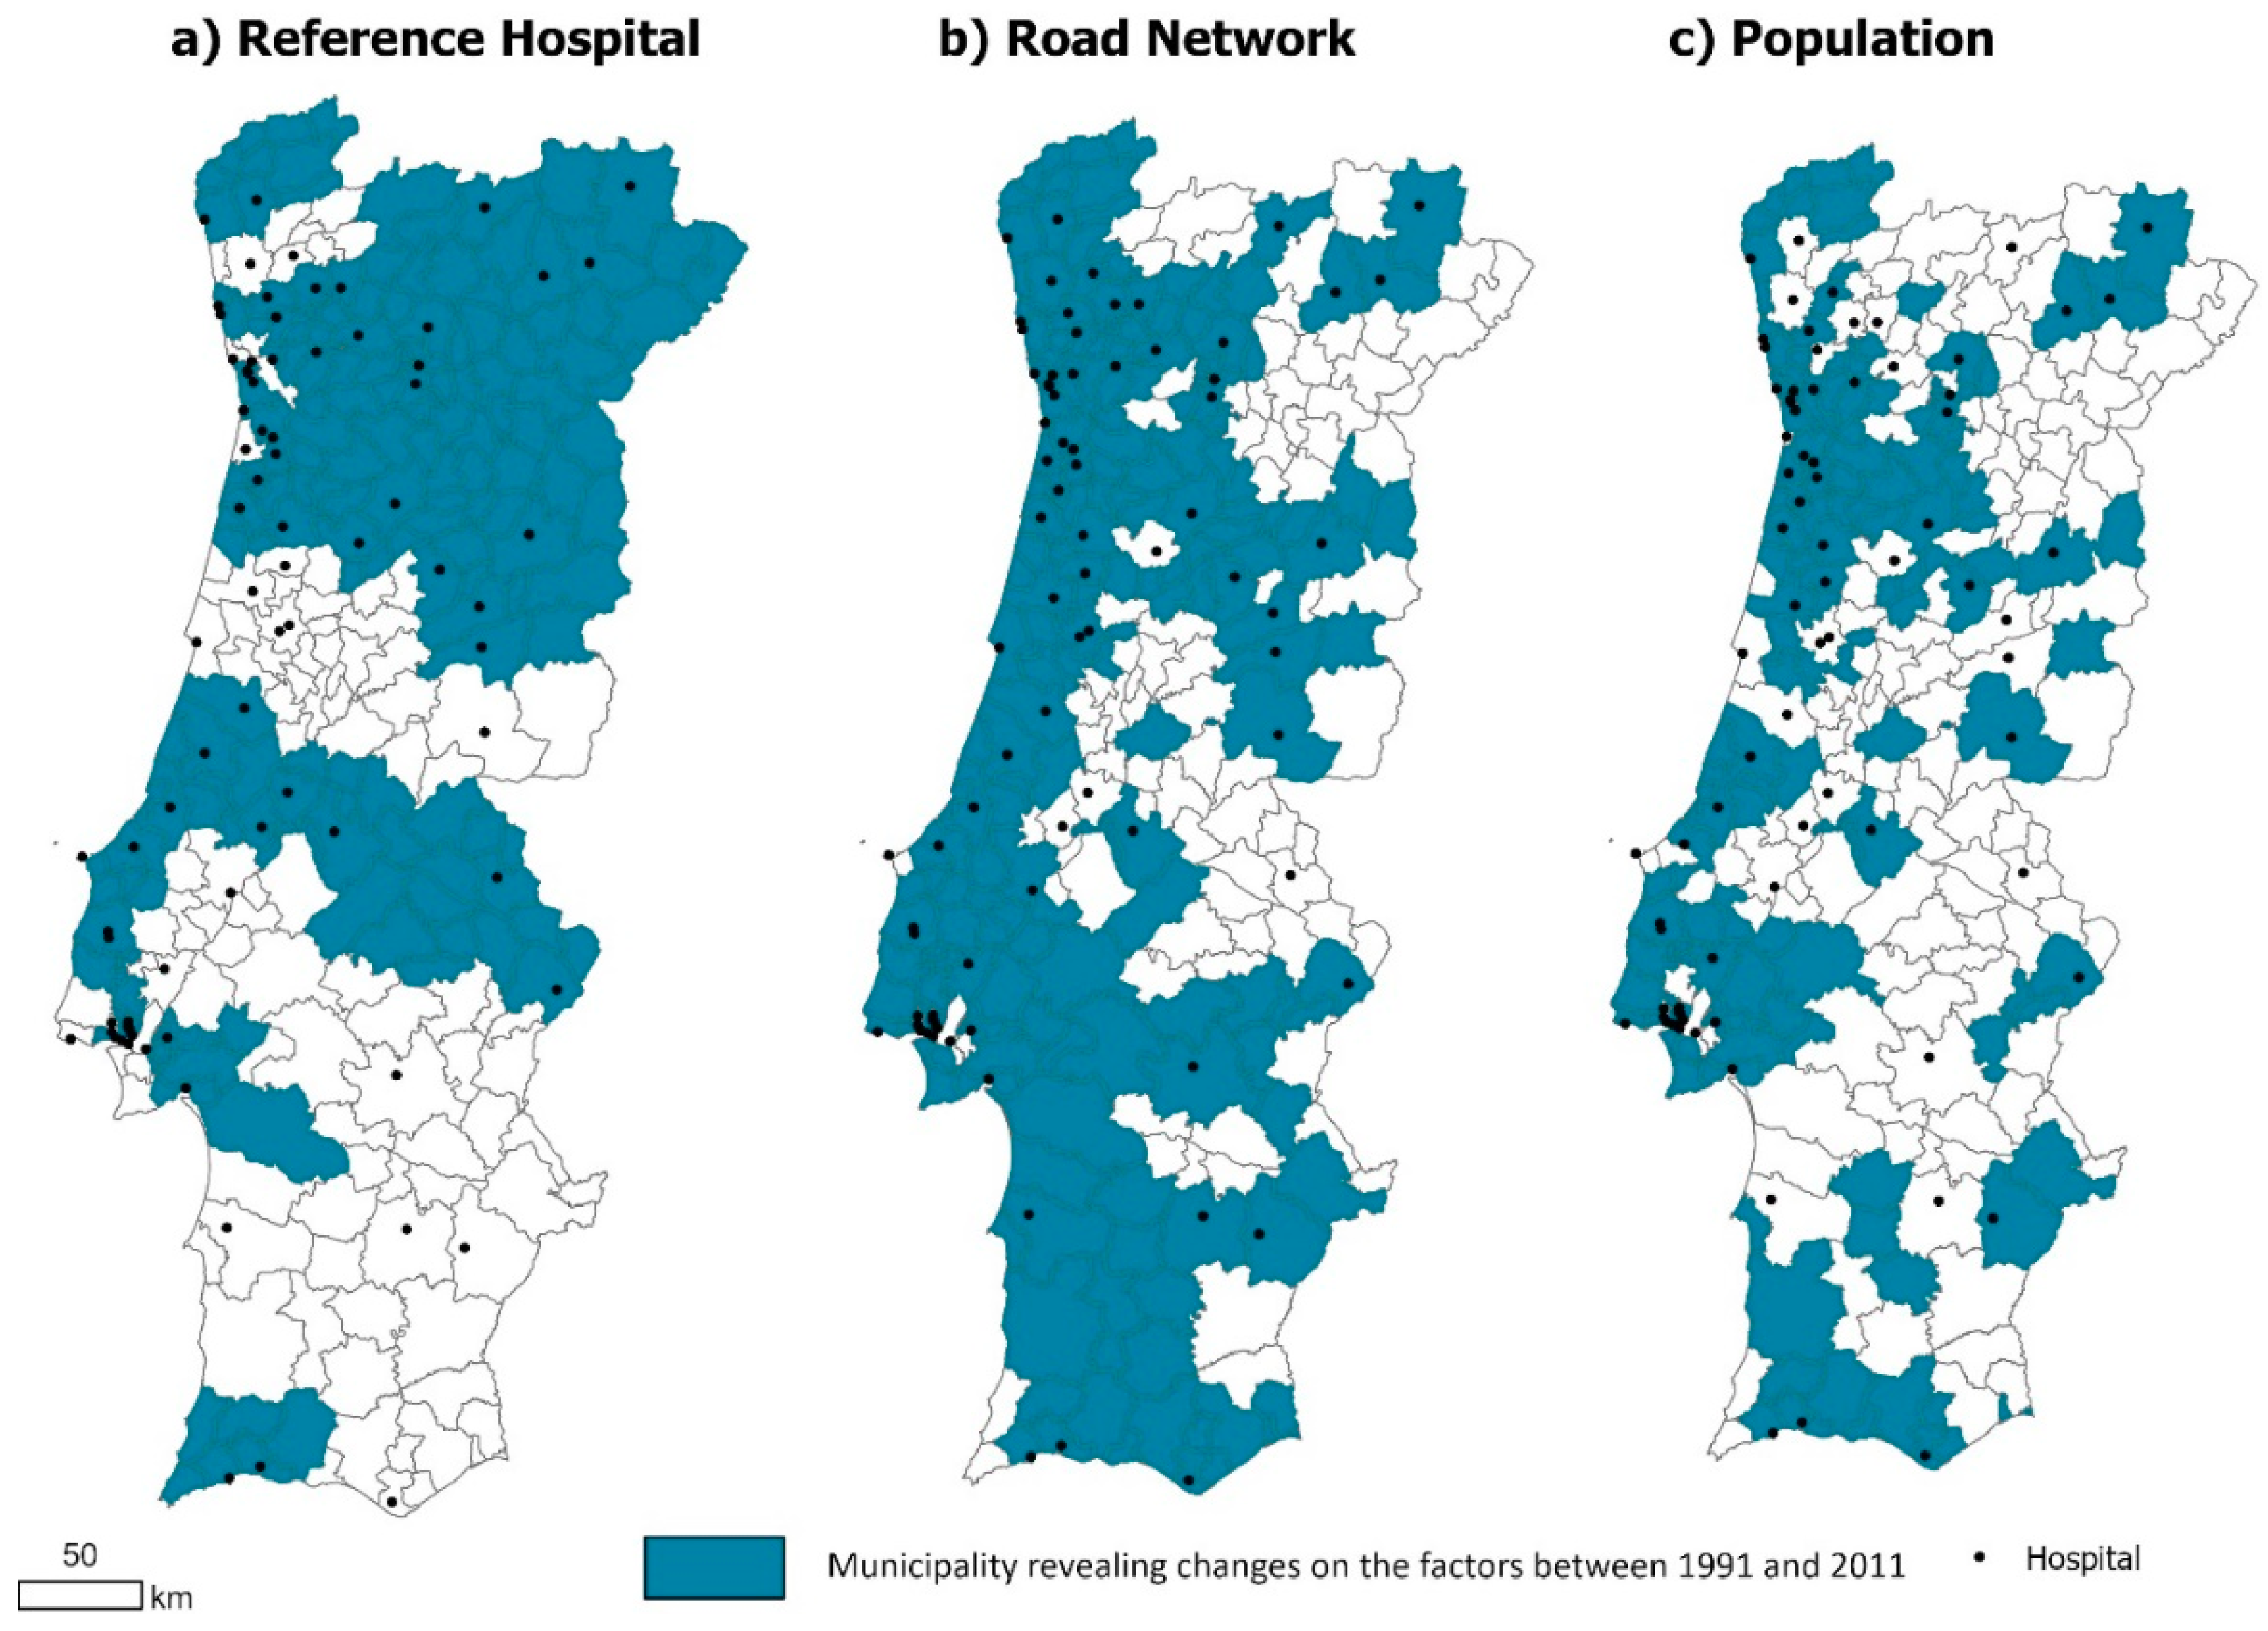
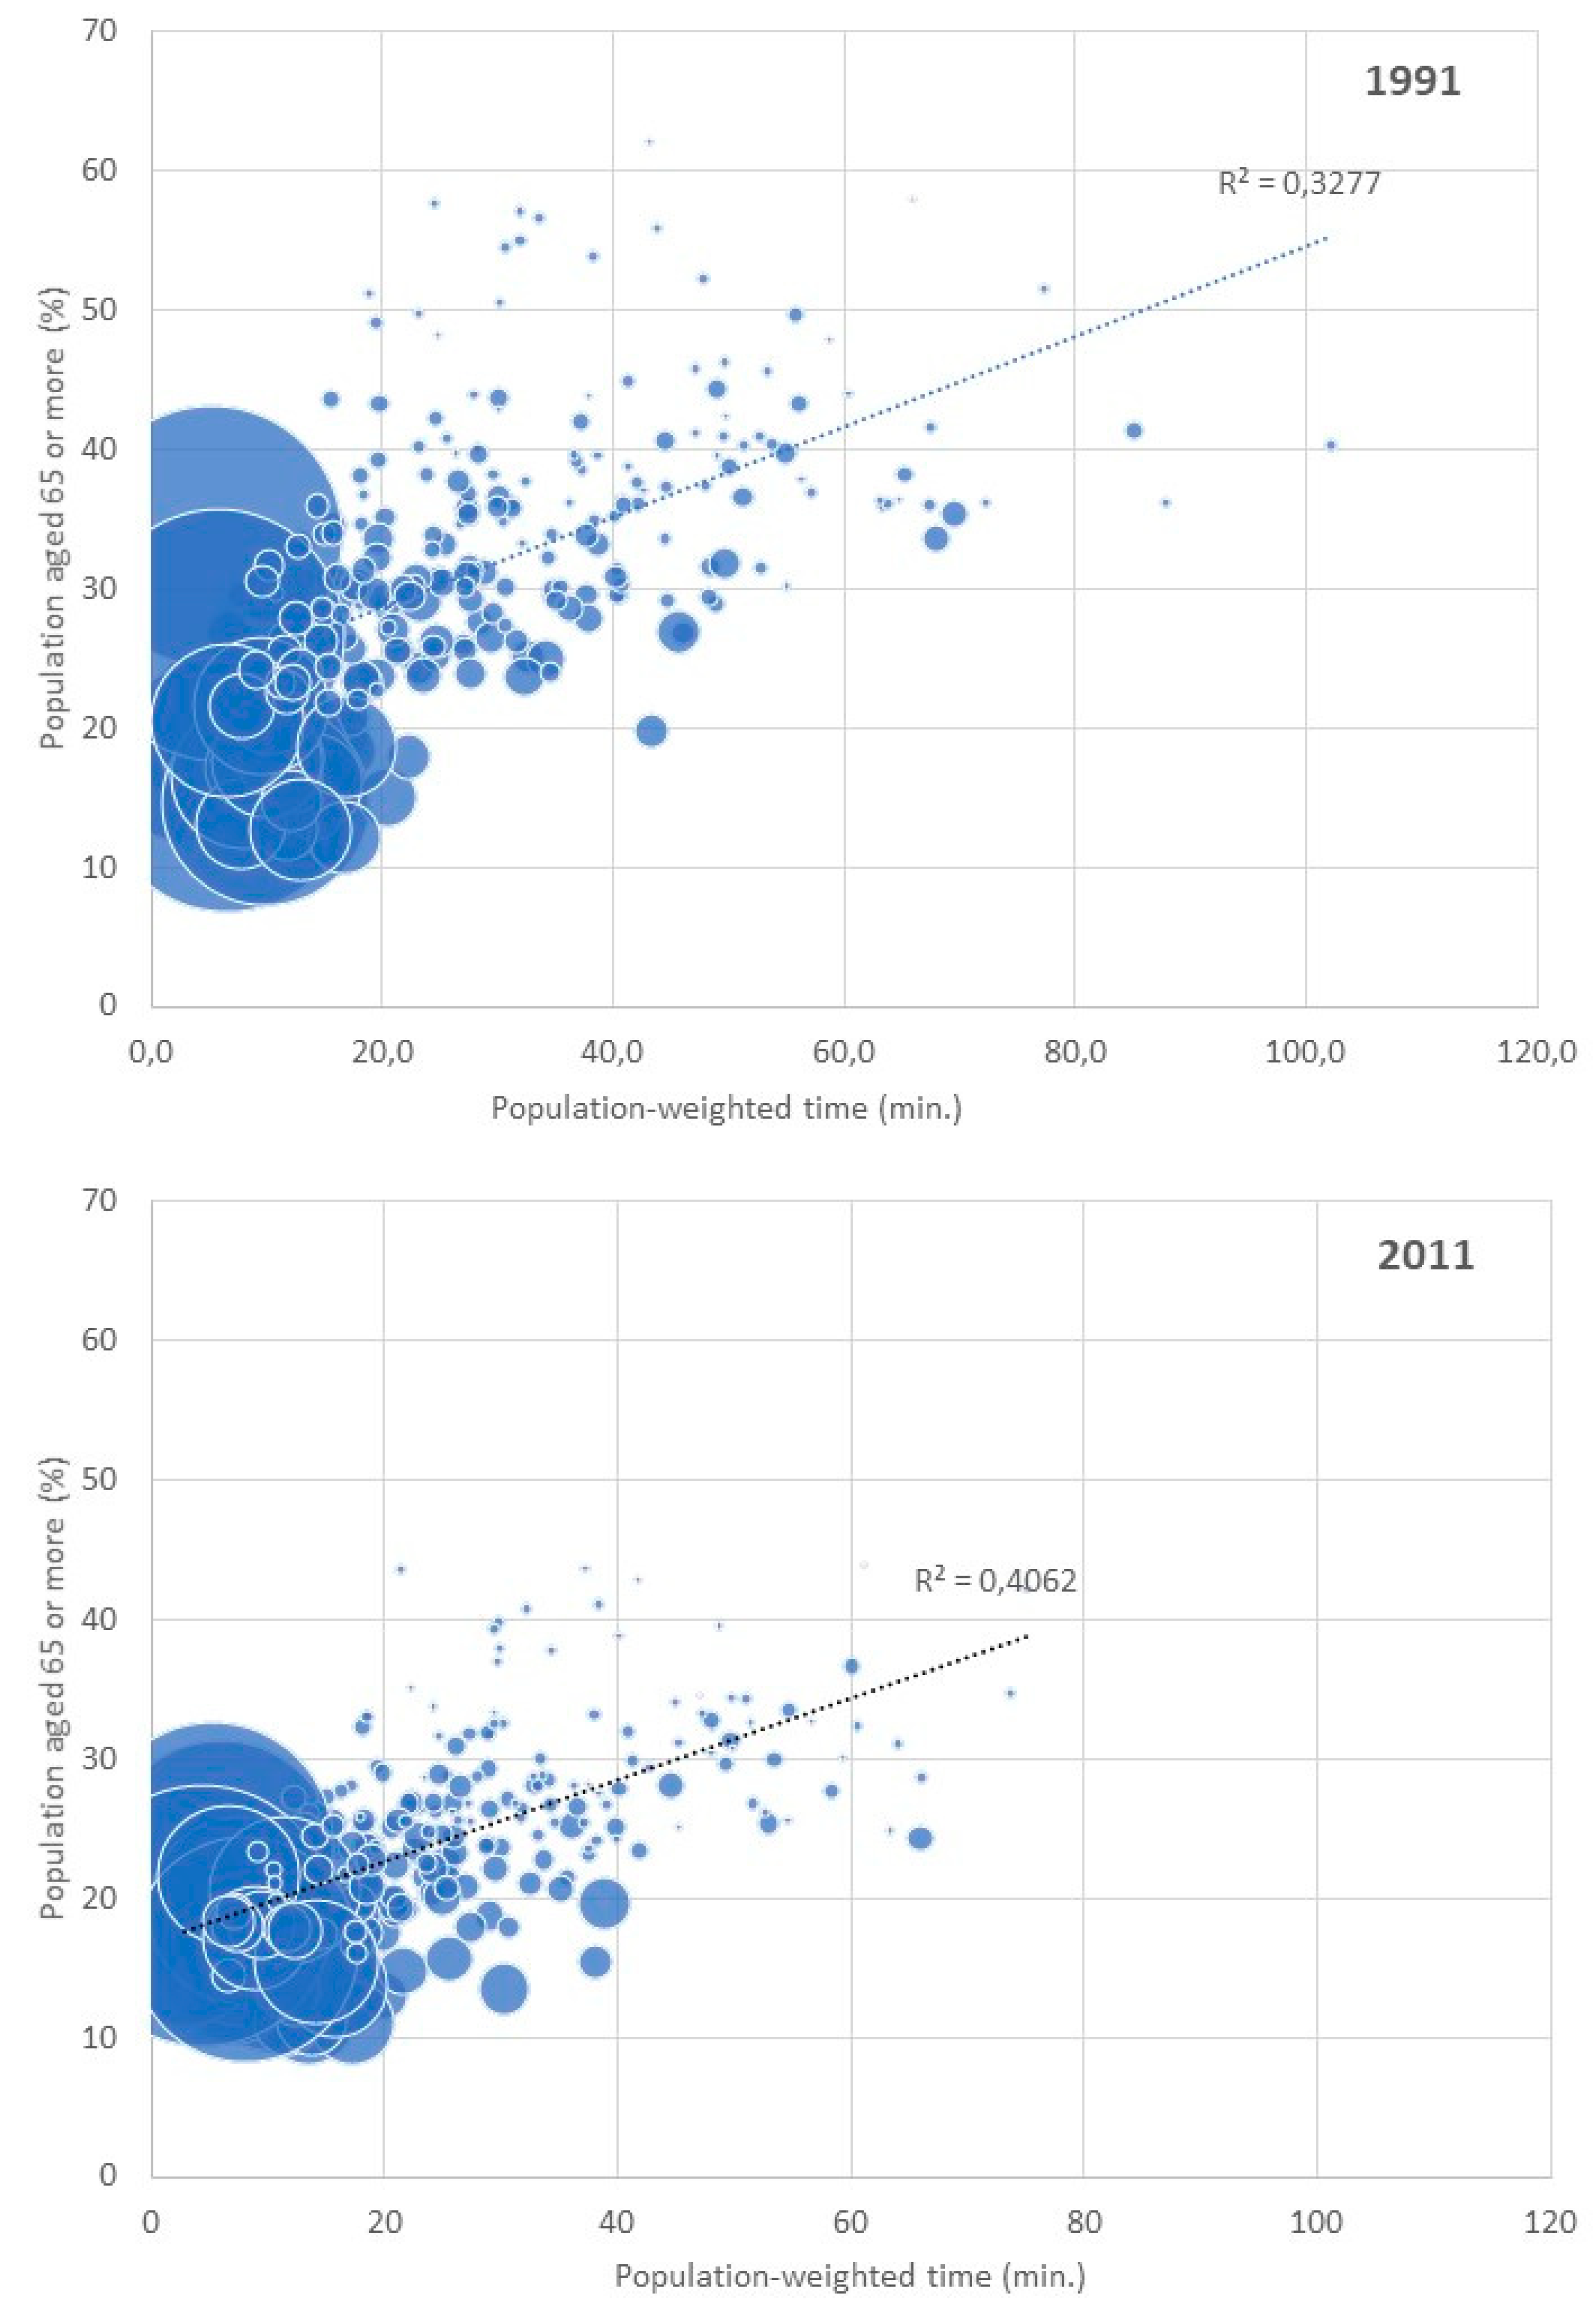
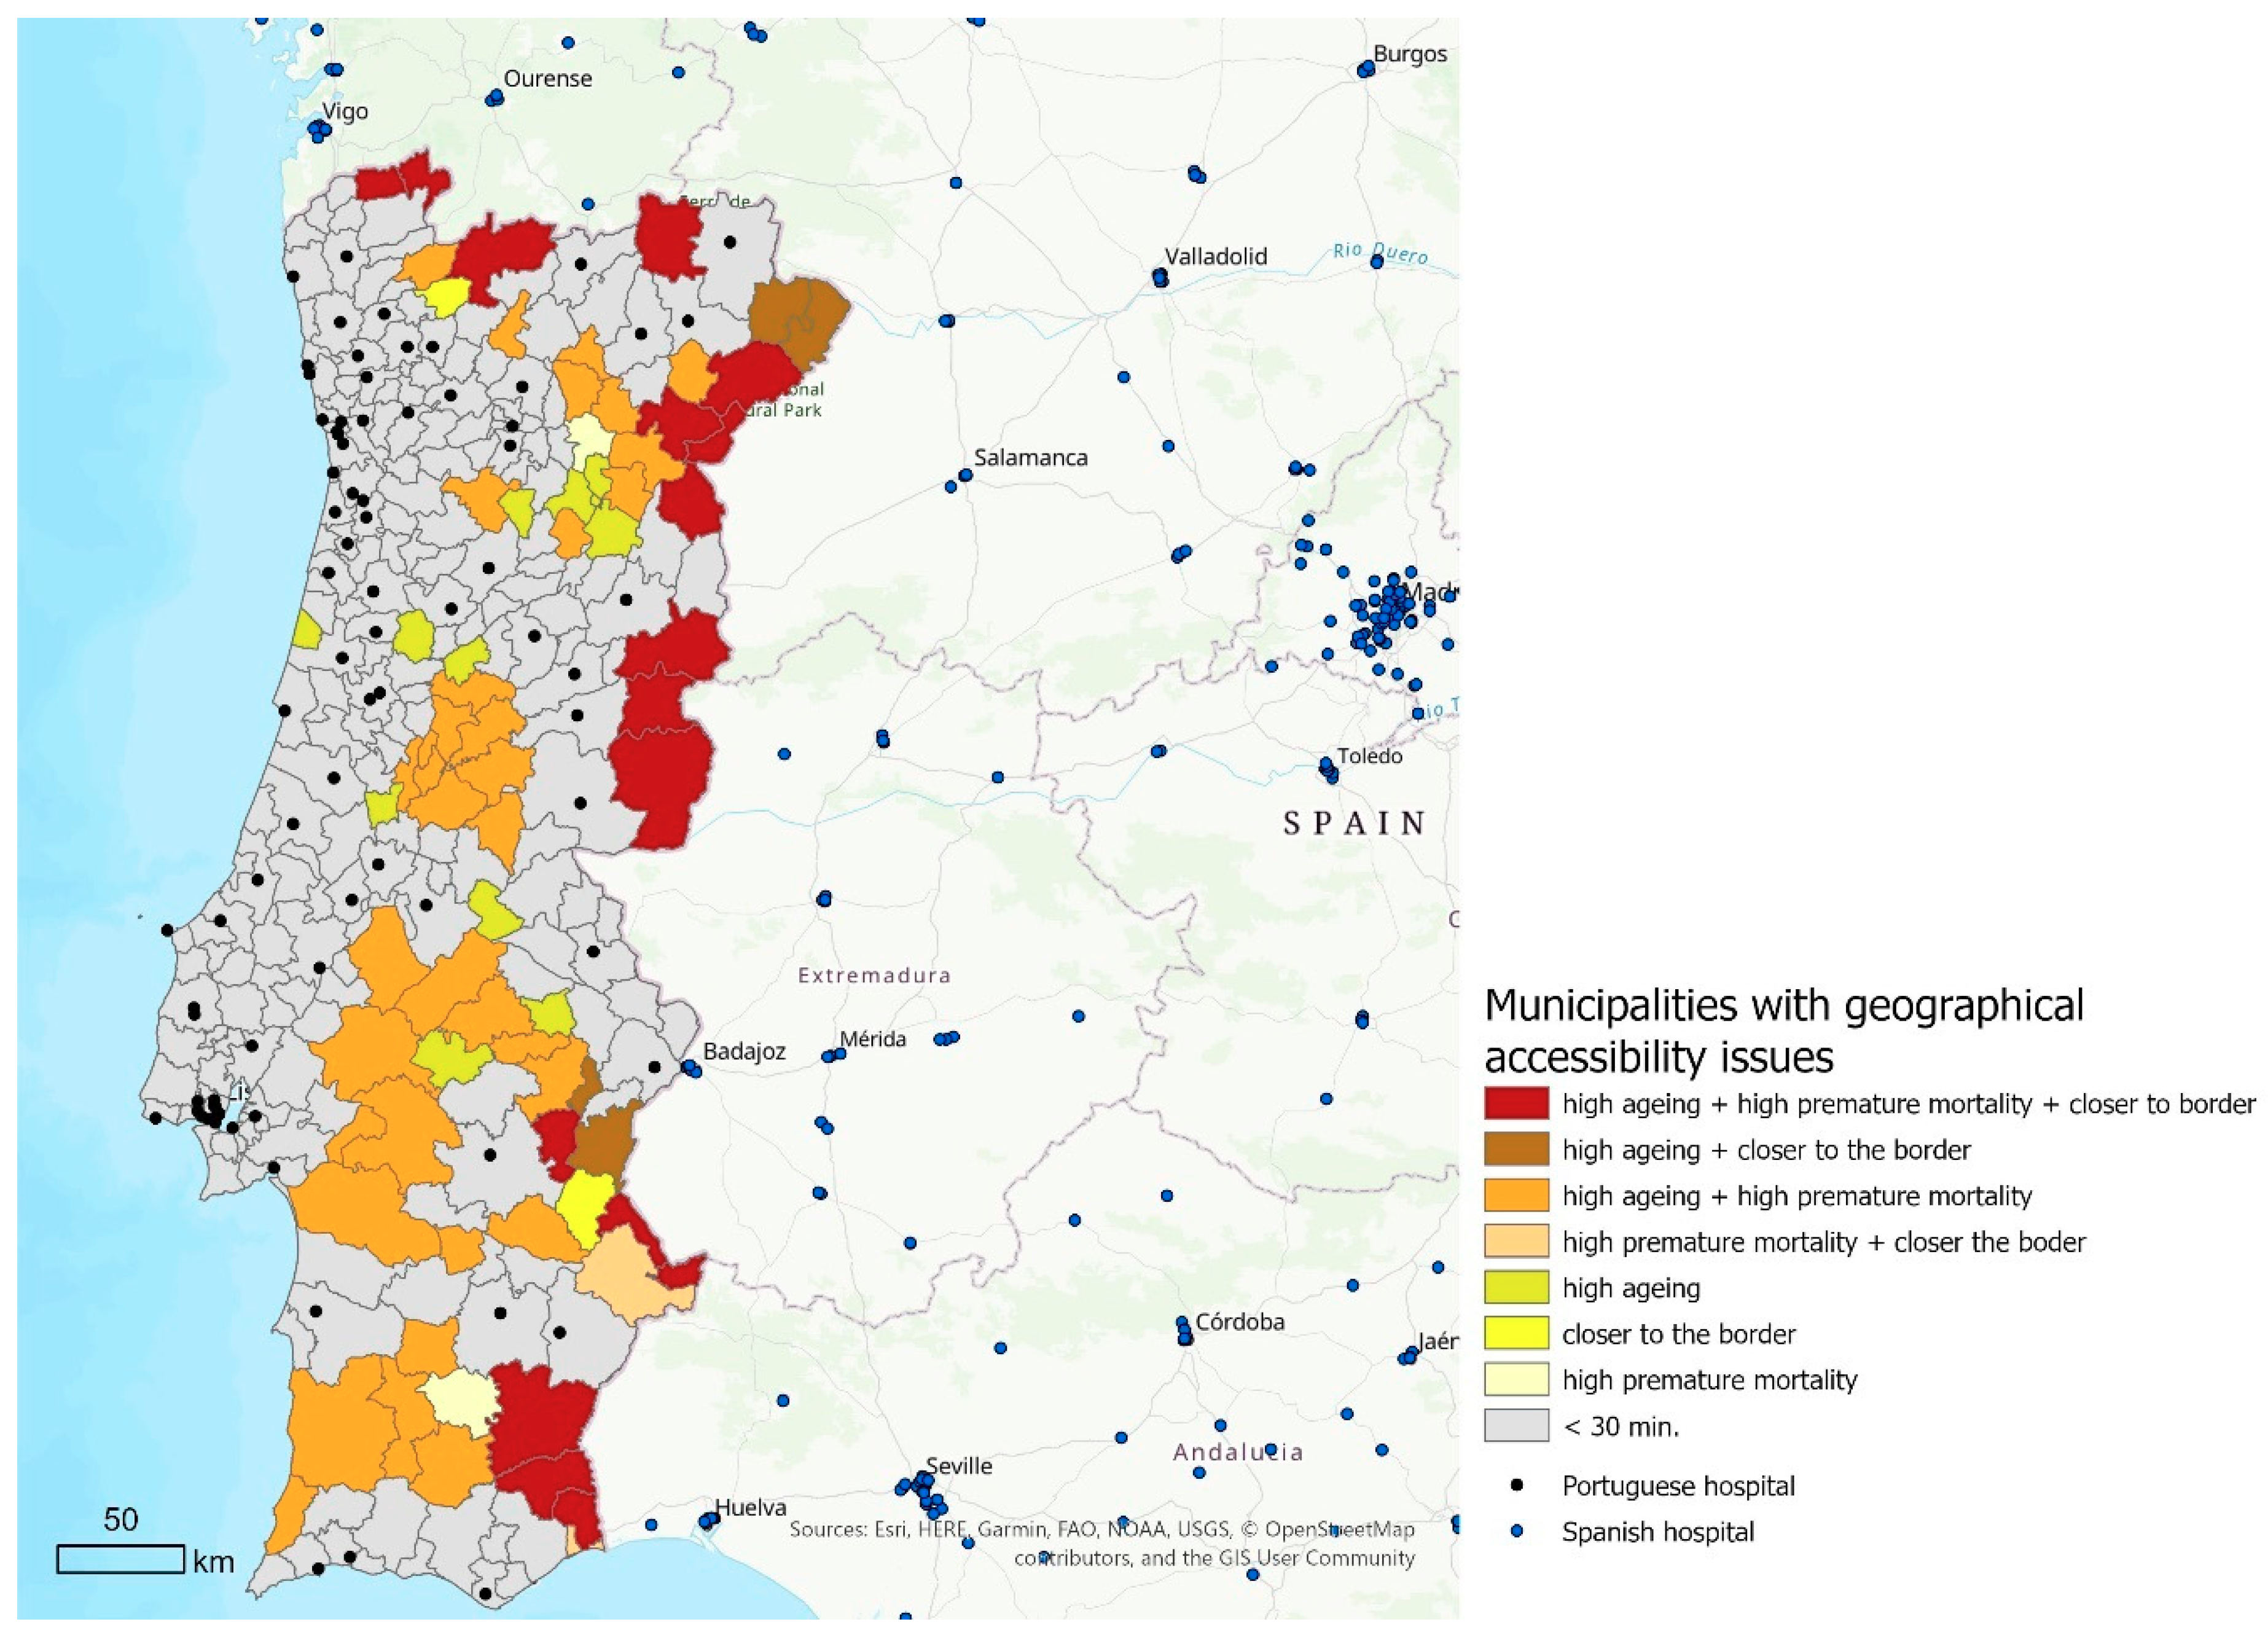
Table 1.
Descriptive statistics of the census tracts and municipalities.
| 1991 | 2001 | 2011 | |||
|---|---|---|---|---|---|
| Smallest level: Census tracts | Number of census tracts | 91,615 | 149,603 | 232,625 | |
| Area (km2) * | average | 0.9 | 0.5 | 0.3 | |
| min–max | 0.1–227 | 0.1–227 | 0.1–164 | ||
| Population (n°) | average | 102 | 65 | 43 | |
| min–max | 1–2585 | 1–1699 | 1–1742 | ||
| Lower Administrative level: Municipalities | Number of census tracts | average | 370 | 612 | 837 |
| min–max | 50–3700 | 74–5346 | 82–4099 | ||
| Area (km2) | average | 324 | 320 | 230 | |
| min–max | 8–1721 | 8–1720 | 7–1685 | ||
| Population (n°) | average | 34,094 | 35,501 | 36,143 | |
| min–max | 2052–663,394 | 1924–564,657 | 1834–547,733 | ||
* Only considering census tracts with population.
Table 2.
Change in population between 1991 and 2011 interval of population-weighted driving time to the hospital and population by interval in each year.
Table 2.
Change in population between 1991 and 2011 interval of population-weighted driving time to the hospital and population by interval in each year.
| 2011 | Pop. (1991) | ||||||||||
|---|---|---|---|---|---|---|---|---|---|---|---|
| ≤10 | 11–20 | 21–30 | 31–40 | 41–50 | 51–60 | 61–70 | ≥71 | N | % | ||
| 1991 | ≤10 | 90% | 10% | - | - | - | - | - | - | 3,950,420 | 39.1% |
| 11–20 | 12% | 88% | - | - | - | - | - | - | 3,522,533 | 34.9% | |
| 21–30 | 2% | 26% | 72% | - | - | - | - | - | 1,008,268 | 10.0% | |
| 31–40 | - | 3% | 47% | 50% | - | - | - | - | 470,573 | 4.7% | |
| 41–50 | - | 5% | 6% | 56% | 33% | - | - | - | 854,226 | 8.5% | |
| 51–60 | - | - | - | 14% | 35% | 50% | - | - | 129,093 | 1.3% | |
| 61–70 | - | - | 6% | - | 21% | 26% | 48% | - | 105,546 | 1.0% | |
| 71–80 | - | - | - | - | 68% | - | - | 32% | 17,985 | 0.2% | |
| 81–90 | - | - | - | - | - | 100% | - | - | 37,963 | 0.4% | |
| ≥91 | - | - | - | - | - | - | - | 100% | 4914 | 0.1% | |
| Pop. (2011) | N | 4,047,471 | 4,260,054 | 1,013,268 | 398,171 | 165,120 | 111,924 | 43,352 | 8261 | ||
| % | 40.3% | 42.4% | 10.1% | 4.0% | 1.6% | 1.1% | 0.4% | 0.1% | |||
Note: The percentage within the 1991–2011 matrix takes into account the number of people within one time-interval in 1991.
Table 3.
Association between municipality population-weighted driving time to the reference hospital and characteristics of the municipality.
Table 3.
Association between municipality population-weighted driving time to the reference hospital and characteristics of the municipality.
| Variable | Year | R2 | Coefficient (95%CI) | p-Value |
|---|---|---|---|---|
| Population aged 65 or more (%) | 2011 | 0.41 | 0.29 [0.25–0.33] | <0.01 |
| 1991 | 0.33 | 1.02 [0.84–1.18] | <0.01 | |
| Population density (n°/km2) | 2011 | 0.12 | −0.005 [−0.007–−0.004] | <0.01 |
| 1991 | 0.09 | −0.005 [−0.007–−0.004] | <0.01 | |
| Premature mortality per 100,000 inhabitants | 2011 | 0.21 | 0.14 [0.10–0.17] | <0.01 |
| 1991 | 0.12 | 0.13 [0.17–0.09] | <0.01 |
Note: p-value below 0.01 provides evidence that the association is statistically significant.
© 2020 by the authors. Licensee MDPI, Basel, Switzerland. This article is an open access article distributed under the terms and conditions of the Creative Commons Attribution (CC BY) license (http://creativecommons.org/licenses/by/4.0/).
Share and Cite
MDPI and ACS Style
Costa, C.; Tenedório, J.A.; Santana, P. Disparities in Geographical Access to Hospitals in Portugal. ISPRS Int. J. Geo-Inf. 2020, 9, 567. https://doi.org/10.3390/ijgi9100567
AMA Style
Costa C, Tenedório JA, Santana P. Disparities in Geographical Access to Hospitals in Portugal. ISPRS International Journal of Geo-Information. 2020; 9(10):567. https://doi.org/10.3390/ijgi9100567
Chicago/Turabian StyleCosta, Claudia, José António Tenedório, and Paula Santana. 2020. "Disparities in Geographical Access to Hospitals in Portugal" ISPRS International Journal of Geo-Information 9, no. 10: 567. https://doi.org/10.3390/ijgi9100567
Note that from the first issue of 2016, this journal uses article numbers instead of page numbers. See further details here.