


Abstract
For understanding the physics of energetic particles, the deuterium experimental campaigns started in Large Helical Device (LHD) from March 2017. To investigate the behavior of energetic particles, a Fast-ion D Alpha (FIDA) diagnostic was installed on the LHD. In the FIDA diagnostic, the Doppler-shifted D alpha light from fast-neutrals are utilized as signals of energetic particles, where these fast-neutrals are produced by the charge exchange process between fast-ions in the plasma and actively injected neutrals by neutral beam (NB). The advantages of the FIDA diagnostic are the velocity and the spatially resolved measurement of fast-ions at the crossing point between its line of sight (LOS) and the incident line of NB. The most recent FIDASIM is enhanced to simulate signals produced in three-dimensional magnetic configurations. The new version of FIDASIM uses the fast-ion distribution function produced by GNET as input to simulate FIDA signals at LHD. In order to validate the new version of the code, measurements of radial profiles of fast-ions using the FIDA diagnostic are performed in magnetohydrodynamic (MHD)-quiescent plasmas. The measured spectra are in good agreement with the theoretical prediction by 3D-supporting FIDASIM at the center of the plasma (R= 3.5 m∼3.7 m, reff/a99= −0.28∼0.05) on the LHD when the line averaged electron density is ne_avg < 1.23 × 10¹⁹ m−3. On the other hand, the measured spectra are in disagreement with the theoretical prediction by 3D-supporting FIDASIM at even the center of the plasma when the line averaged electron density is ne_avg ≥ 1.23 × 10¹⁹ m−3.
Export citation and abstract BibTeX RIS
1. Introduction
A magnetic confinement fusion reactor requires the sustainment of a high-temperature and high-density plasma by energetic alpha particles from fusion reactions. Therefore, it is important to understand the behavior of energetic particles (such as fast-ions provided by plasma heating devices and fusion reactions) in magnetic confinement devices. The study of energetic particle confinement has advanced in tokamak type devices [1], and is one of the main topics in ITER [2]. On the other hand, the energetic particle confinement study in helical devices is rapidly developing. The helical devices are characterized by the steady-state plasma operation that is advancing toward the realization of fusion reactors because the devices build the Iota (poloidal rotation of magnetic field lines) by a magnetic field produced by external coils [3–6]. In the past several years, the fast-ion confinement study in helical devices demonstrated the potential for alpha particle confinement [7–9]. At the large helical device (LHD), magnetohydrodynamics mode-induced transport and loss of fast-ions have been studied with high power neutral beam (NB) injection [10, 11]. To investigate the confinement of fast-ions, neutral particle analyzers (NPAs) (E||B-NPA, compact-NPA, Si-NPA, and natural diamond NPA) which detect charge-exchanged neutral particles were installed in the LHD [12, 13]. Also, a fast-ion-loss detector (FILD) which detects escaping beam ion was installed [14, 15], and a fast-ion D Alpha (FIDA) diagnostic was installed [16]. In the LHD, we have conducted only hydrogen experimental campaigns for several years. To understand physics of fast-ions, the deuterium experimental campaigns have been performed in the LHD since March 2017. To further investigate the confinement of fast-ions, the LHD upgraded detectors such as the FIDA, the E||B-NPA and the FILD, and newly installed a diamond-NPA and neutron detector, to study fast-ion physics [17–24].
In the FIDA diagnostic, the Doppler-shifted D alpha lights from fast-neutrals are utilized as signals of energetic particles, where these fast-neutrals are produced by the charge exchange process between fast-ions in plasmas and actively induced neutrals by NB injection [25, 26]. The advantages of the FIDA diagnostic are the velocity and spatially resolved measurement of fast-ions at the crossing point between its line of sight (LOS) and the incident line of NB.
Originally, FIDASIM predicted signals produced in two-dimensional axisymmetric devices. However, the effect of three-dimensional fields on fast-ion confinement is important. Therefore, FIDASIM is enhanced to simulate signals produced in three-dimensional geometry and is used here to predict FIDA signals at LHD. In other three-dimensional fields devices, the analysis of the spectra using the FIDASIM is on-going, such as Wendelstein 7-X [27]. The code requires a distribution function, plasma profiles, magnetic equilibrium, and diagnostic geometry as inputs. GNET [28–32], which solves a drift kinetic equation in five-dimensional phase space with Monte Carlo technique taking into account the guiding-center motion in the three-dimensional magnetic configuration, is used to calculate the distribution function. Additionally, IDL code is developed to prepare all of the LHD input files in an FIDASIM readable format. In order to validate FIDASIM, measurement of radial profile of fast-ions using the FIDA diagnostic was performed in MHD-quiescent plasmas. In this paper, we describe the current status of the FIDA diagnostic and FIDASIM on the LHD and representative results. After an introduction to the instrument (section 2) and the experiment (section 3), Section 4 describes the setup for FIDASIM calculation with GNET code. In section 5, comparison of FIDA diagnostic results with FIDASIM results are discussed. Conclusions are drawn in section 6.
2. Experimental setup
The LHD is one of the largest helical devices in the world. The LHD specifications are the pole number is l= 2, the toroidal pitch number is m= 10, the plasma major radius is from 3.42 m to 4.10 m, the plasma minor radius is 0.63 m, the plasma volume is 30 m3, and the maximum toroidal field strength is 3 T [33]. Figure 1 shows the schematic toroidal cross-section view of the LHD and the geometrical arrangement of the tangential-FIDA diagnostic on the LHD. The green arrows indicate the injection directions of the NB #1, the NB #2, the NB #3, the NB #4, and the NB #5, respectively. The blue region indicates the volume covered by the various LOS of the tangential-FIDA. The orange arrow indicates the direction of magnetic field. Three negative-source-based NB lines (the NB #1, the NB #2, and the NB #3) and two positive-source-based NB lines (the NB #4 and the NB #5) have been installed at the LHD [34], with typical acceleration voltages of ∼180 keV and ∼80 keV, respectively. The negative-beam lines contain two sources each, while the positive beam lines contain four sources each. The tangential NB #1, NB #2 and NB #3 are used as the main sources of passing energetic particles in the LHD. The perpendicular NB #4 and NB #5 are used as the main sources of trapped energetic particles in the LHD. The NB #3 and the NB #4 can be used as a diagnostic probe beam of the FIDA diagnostic for the measurement of passing energetic particles. In this study, the NB #4 is used as a diagnostic probe beam of the FIDA diagnostic, because the FIDA signal is higher with the NB #4 than with NB #3 as the diagnostic beam. The NB #4 produces a neutral particle beam by extracting positive ions. On the other hand, NB #3 produces a neutral particle beam by extracting negative ions. This difference changes the energy of the NB. The beam energy of NB #3 is approximately 180 keV and the beam energy of NB #4 is approximately 80 keV. This beam energy has a great influence on the charge exchange cross-section. Because the charge-exchange cross-section peaks at low energy, FIDA signals normally are dominated by ions with energies below 100 keV. The FIDA LOS are horizontally aligned and the radial distributions of Doppler-shifted H alpha and D alpha light emitted from passing energetic particles can be measured in this arrangement [24]. The measurement region is located in horizontally elongated poloidal cross section and covers from the magnetic axis to the inboard edge of the LHD plasmas. By modulated injection of the NB #4, the passive FIDA signal and the BES signal caused by the NB#3 can be excluded, therefore the FIDA measurement is an active and local measurement at the intersection of the lines of sight and the beam of the NB #4. The Doppler-shifted H alpha and D alpha lights are collected and transferred by the bundled 50 channels optical fibers which are 400 μm in diameter to the spectrometer. The FLP-200 spectrometer is designed and produced by BUNKOKEIKI Co., Ltd. The spectrometer has a grating number of 1200 mm, focal length of 200 mm, and the F = 2.8. A notch filter is placed in the optics to eliminate the cold component of the H alpha and D alpha emission. An electron multiplying charge-coupled device (EMCCD) records the collected light. The EMCCD is the iXon 897 manufactured by ANDOR. The exposure time of the measurement is set to 7 ms, while the sampling interval is set to 10 ms in this experiment.
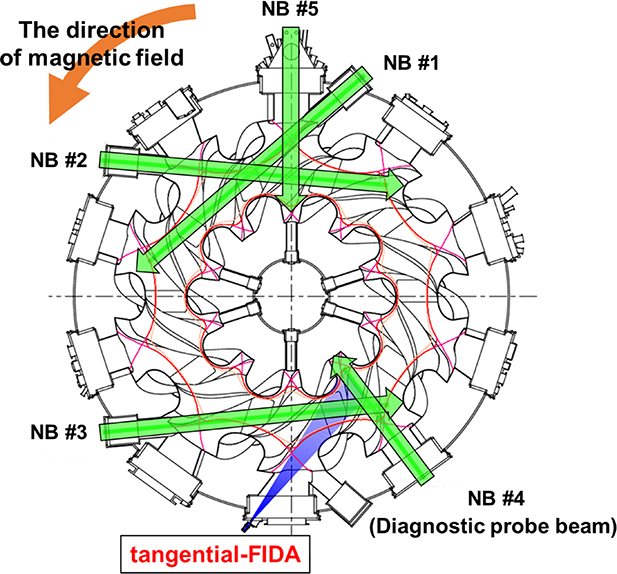
Figure 1. The schematic toroidal cross-section view of the LHD and the geometrical arrangement of the tangential-FIDA diagnostic on LHD. The green arrows indicate the injection directions of the NB #1, the NB #2, the NB #3, the NB #4, and the NB #5, respectively. The blue region indicates the volume covered by the various LOS of the tangential-FIDA . The orange arrow indicates the direction of magnetic field.
Download figure:
Standard image High-resolution imageFigure 2 shows the measured intensity as a function of wavelength of a typical LOS that was observed using a white light source and the expected intensity when using a halogen lamp as the white light source for calibration. Each LOS measured intensity is color solid lines, and the expected intensity of the halogen lamp is a broken black line. The hatching region indicates the wavelength region where the notch filter is located. The calibration factors are determined by dividing the expected intensity of the halogen lamp by the measured intensity per channel and pixel. The halogen lamp as the white light source is placed in cross points of the LOS and the center of the probe beam inside the vacuum vessel and emits spatially uniform light in the visible range with a well-known, continuous spectrum. This calibration factor is considered the wavelength dependent quantum efficiency of the CCD camera, the transmission curve of the fibers, due to the reflection dependence of the grating, and the transmission curve of the notch filter. This calibration factor is necessary to attempt a relative comparison between all LOS.

Figure 2. (a) The measured intensity of the typical LOS that was observed the white light source as a function of wavelength and expected intensity of the halogen lamp as the white light source for calibration. (b) Corresponding calibration factors for each channels.
Download figure:
Standard image High-resolution image3. Experimental results
Figure 3 shows the typical discharge waveforms for the tangential-FIDA measurement. In this experiment, the rotational direction of magnetic field is counter-clockwise when viewed from above. The typical magnetic configuration in the LHD (Rax= 3.6 m, γ= 1.254) is used and the field strength is set at 2.75 T. In this series of experiment, gas species of all NBs are deuterium. The measurement is performed by the injected NB #4 while the plasmas are sustained by the tangential NBs and the electron cyclotron resonance heating (ECH). The ECH power is approximately 2.7 MW and injected from t= 3.30 s−6.30 s. Also, the tangential NB #1 (co-NB), NB #2 (ctr-NB) and NB #3 (co-NB) are used as the main sources of passing energetic particles. The injection energies are: the NB #1 ∼174 keV, the NB #2 ∼150 keV, the NB #3 ∼175 keV, and the NB #4 ∼57 keV. The injection powers are: the NB #1 ∼0.70 MW, the NB #2 ∼0.66 MW, the NB #3 ∼1.24 MW, and the NB #4 ∼6.09 MW shown in figure 3(a). The line averaged electron density (ne_avg) is measured by far infrared laser interferometer system [35]. The ne_avg is approximately 0.65 × 10¹⁹ m−3 shown in figure 3(b). The temporal evolution of the central electron temperature (Te0) is measured by Thomson scattering [36]. The maximum central ion temperature (Ti0) is measured by charge-exchange recombination spectroscopy (CXRS) [37]. The Te0 and the Ti0 appear in figure 3(c). The neutron emission rate (Sn) is measured by a fission chamber [19] shown in figure 3(d). The plasma-stored energy (Wp) is measured by a diamagnetic coil [38]. The Wp is approximately 200 kJ during the tangential-NBs injection. In this discharge, the D/(H + D) ratio from visible spectroscopy is ∼0.77. In this discharge, to observe the fast-ion radial profile in MHD-quiescent deuterium plasmas, the tangential-NBs use just one ion source (of two available) to limit the power. Thus, as shown in figure 3(e), very weak magnetic field fluctuations are observed by Mirnov coils in the frequency spectrogram. The plasma is MHD-quiescent during the injection of the NB #1 and the NB #2 as shown in figure 3(e). However, magnetic field fluctuations are observed during the injection of the NB #3, at approximately 100 kHz and 160 kHz occurred. In this observation geometry, as shown in figure 1, D alpha light shifts to the red side for the NB #1 and the NB #3, while D alpha light shifts to the blue side for the NB #2. As mentioned above, the NB #4 is modulated to separate the tangential-FIDA component; thus the background signal can be removed from the tangential-FIDA signals.
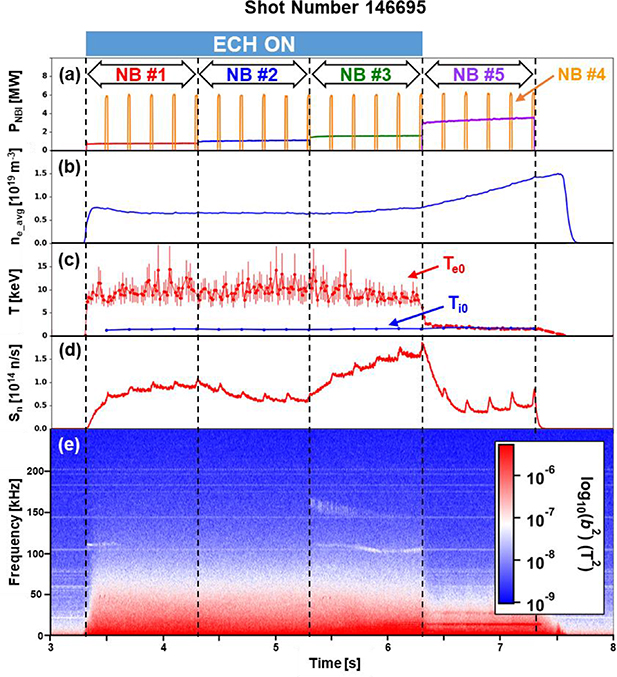
Figure 3. The typical discharge waveforms for the tangential-FIDA measurement. Time evolution of (a) the power of NBs, (b) the line averaged electron density, (c) the electron and ion temperature, (d) the neutron emission rate, and (e) the spectrogram of the magnetic fluctuation.
Download figure:
Standard image High-resolution imageFigure 4 shows the typical observed tangential-FIDA spectra. In this result, the measured spectral range was set between 643 nm and 671 nm on the spectrometer, but figure 4 shows only between 645 nm and 670 nm. The intensity of each wavelength is calibrated, including the notch filtered region (as discussed in section 2). The circle symbol and red solid line in figure 4 show the spectra from t= 4.26 s to 4.28 s which corresponds to the background measurement without the NB #4. On the other hand, the square symbol and blue solid line in figure 4 are the spectra from t= 4.28 s to 4.30 s. These are the spectra when the NB #4 injected and they correspond to the foreground measurement. The tangential-FIDA spectra are obtained by subtracting the background spectra from the foreground and are shown by the triangle symbol and green solid line in figure 4. The several impurity lines are observed both in the foreground and in the background spectra. Fortunately, most of the impurity lines are removed by the background subtraction, as shown in figure 4. The bremsstrahlung radiation is also removed by the subtraction because the electron density is almost stationary during the measurement, as shown in figure 4.
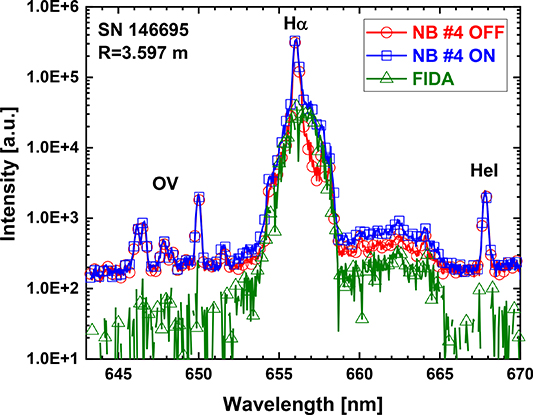
Figure 4. Measured spectra at R = 3.597 m when the NB #4 turn on (measurement signal) and the NB #4 turn off (background signal), and the tangential-FIDA spectra that removed background signal from measurement signal in the discharge SN146695.
Download figure:
Standard image High-resolution image4. Setup for FIDASIM calculations
FIDASIM is able to calculate the light from various sources [39]. The output is the expected spectra and profiles for each LOS. Required input includes plasma parameters, magnetic configuration, diagnostic beam information, LOS geometry, and phase-space distribution of energetic particles. Figure 5 shows a flowchart to obtain FIDA diagnostic spectroscopic results using FIDASIM. In the simulation, we use the electron temperature profile, electron density profile, and ion temperature profile measured in the experiment. The deuterium ion density profile is evaluated from the carbon density measured by CXRS and the ratio of the deuterium and hydrogen measured by visible spectroscopy [40]. A three-dimensional plasma MHD equilibrium is calculated by VMEC [41]. The birth positions of the fast-ions derived by NBs are calculated by the HFREYA code, which is one of the modules included in FIT3D [42, 43]. Based on measured plasma parameters and the HFREYA code calculated results, five-dimensional phase-space distributions of fast-ions are calculated by GNET [28–32]. The most recent FIDASIM has been extended to calculate produced in three-dimensional geometry, and is called 3D-supporting FIDASIM in this study [44, 45]. FIDASIM can be select gas species of the plasma and NBs from hydrogen or deuterium. FIDASIM calculations are performed not only in a case of considering the deuterium ratio but also pure deuterium (the deuterium ratio of 100%). As a result, the FIDASIM calculation result with the deuterium ratio of 77% was almost the same as with pure deuterium. Therefore, in this research, FIDASIM calculations are performed by assuming pure deuterium.

Figure 5. Calculation scheme of the 3D-supporting FIDASIM using GNET.
Download figure:
Standard image High-resolution imageFigure 6 shows the schematic view of the calculation region for the FIDASIM. The magnetic configuration and the lines of sight for the tangential-FIDA are shown for the typical magnetic configuration of the LHD. The origin of the Cartesian coordinates system is set to the center of the torus, and the x-axis is anti-parallel to the NB #4 injection direction, the y-axis is in the perpendicular direction to the x-axis on the equatorial plane, and the z-axis is in the vertical direction. In the case of figure 6, we determined the calculation region to be from 2.7 m to 4.7 m on x-axis, from −1.0 m to 1.0 m on y-axis, and from −0.6 m to 0.6 m on z-axis. Also, we made 40 grids for x-axis, 41 grids for y-axis, and 25 grids for z-axis with 5 cm increments in between. Note that we make the large calculation region on y-axis because the electron density of LHD is much lower than the tokamak type. In this case, we must consider a halo diffusion. In the low-density plasma case, the Halo expands greater than the high density plasma case because the neutral mean free path is large. For the FIDA diagnostic, we selected the 16 LOS (R= 2.9558 m, 3.029 m, 3.099 m, 3.168 m, 3.237 m, 3.283 m, 3.329 m, 3.374 m, 3.419 m, 3.464 m, 3.509 m, 3.553 m, 3.597 m, 3.642 m, 3.685 m and 3.729 m) shown by blue solid lines in figure 6. Note that the x-axis value is equivalent to the R value.

Figure 6. The schematic view of the calculation region for FIDASIM. The magnetic configuration and the lines of sight for tangential-FIDA are shown for the typical magnetic configuration of the LHD.
Download figure:
Standard image High-resolution imageFigure 7 shows the spatial density profiles and the velocity space distribution of the fast ions which are slowing down in energy by the Coulomb collision with the plasma during the NB #1 injection in the discharge SN146695 calculated by GNET code. In the GNET code, re-entering fast-ion is not considered. The spatial density profiles of the fast-ion show x-z planes of y= −1.0 m, 0.0 m and 1.0 m, respectively, in figure 7(a). The cross section of the plasma is horizontally long at the y= 0.0 m (direction of the NB #4 injection). The fast-ion velocity space distribution at y= 0.0 m during the NB #1 injection in the discharge SN146695 is shown in figure 7(b). As already mentioned, the rotational direction of magnetic field is counter-clockwise in this experiment. The NB #1 is co-beam as can be seen from figure 1. Therefore, the GNET code calculation result is reasonable.
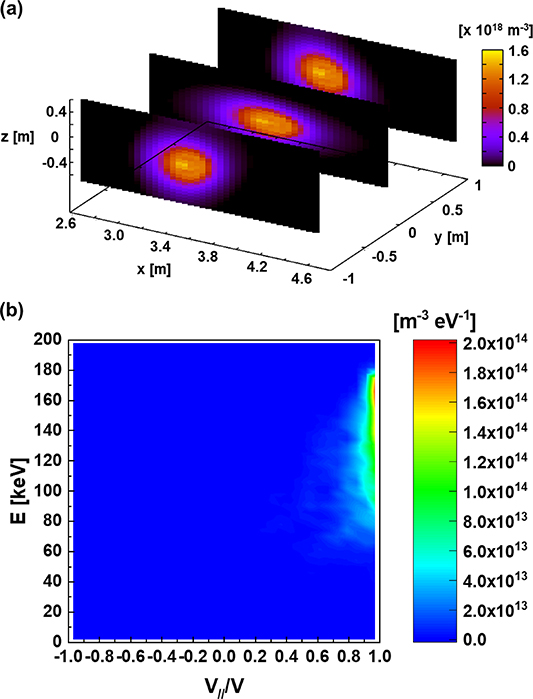
Figure 7. (a) Spatial density profiles of the fast-ion and (b) fast-ion velocity space distribution which were slowing down in energy by the Coulomb collision with the plasma during the NB #1 injection in the discharge SN146695 calculated by GNET code.
Download figure:
Standard image High-resolution image5. Comparison of FIDA diagnostic results with FIDASIM results
Figure 8 shows measured spectra of FIDA diagnostic and various sources of light in the D alpha spectral band calculated by FIDASIM in the case of the NB #1 injection (4.28 s∼4.30 s), the NB #2 injection (5.28 s∼5.30 s), and the NB #3 injection (6.28 s∼6.30 s), at R= 3.597 m in the discharge SN146695. The x-axis is the wavelength, the left y-axis is theoretical radiance for FIDASIM results and the right y-axis is the intensity for FIDA diagnostic results. The right y-axis is arbitrary units because the spectrometer is not absolutely calibrated. Therefore, to attempt a relative comparison between the spectra measured by the FIDA diagnostic and the spectra predicted by FIDASIM, we use a technique to multiply the measured spectra by a calibration factor (fcalib). To determine fcalib, we focused on three peaks seen between 657 nm and 659 nm in the spectra of both measured and predicted. Magnifications are calculated by dividing radiances of three peak values by intensities of these three peak values, respectively, and thereby the fcalib is calculated by averaging these three magnifications. Finally, the fcalib obtained on the magnetic axis was determined as the fcalib for the discharge, and applied to all the measured results. The black solid line is measured spectra of the FIDA diagnostics that are multiplied by the fcalib= 5.5 × 10¹³ at the NB #1 case. The color solid lines are calculated by FIDASIM. The red solid line is the direct charge exchange (DCX) component signal which comes from the charge exchange reaction between beam neutrals and thermal ions. The yellow solid line is the beam emission (BES) component signal includes the full, half and third energy component of the beam. The green solid line is the HALO signal which comes from the newly created thermal neutrals which travel ballistically and charge exchange with other thermal ions creating more neutrals after neutralization. The blue solid line is the signal FIDA component. The violet solid line is the total radiance of FIDASIM results. As a result of the comparison of the FIDA diagnostic data with FIDASIM results, in the case of the NB #1 (figure 8(a)), they are in good agreement. Figure 8(a) shows FIDASIM can simulate the FIDA diagnostic in the three-dimensional magnetic field device such as the LHD. In the case of the NB #2, the DCX, BES, and HALO component results of FIDASIM are in good agreement with the FIDA diagnostic data, but the FIDA component result does not agree with the FIDA diagnostic data as shown in figure 8(b). This may be due to the difference between co-NB and ctr-NB on the calculation of the GNET code, or to an underestimation of the acceleration energy of NB #2. In the case of the NB #3, the maximum wavelength of the FIDASIM prediction does agree with the FIDA diagnostic data, but the experimental intensity between wavelengths of 659 nm and 663 nm is lower than the FIDASIM prediction as shown in figure 8(c). The likely cause of this discrepancy is the increased MHD activity that occurs during the NB #3 injection as shown in figure 3(e).

Figure 8. Measured spectra of FIDA diagnostic and various sources of light in the D alpha spectral band calculated by FIDASIM in the case of (a) the NB #1 injection (4.28 s∼4.30 s), (b) the NB #2 injection (5.28 s∼5.30 s), and (c) the NB #3 injection (6.28 s∼6.30 s), at R = 3.597 m in the discharge SN146695.
Download figure:
Standard image High-resolution imageFigure 9 shows the measured spectra of FIDA diagnostic and simulated spectra calculated by FIDASIM at 16 different major radii during the NB #1 and the NB #4 injection (4.28 s∼4.30 s) in the discharge SN146695. The black solid line is measured spectra of the FIDA diagnostics that are multiplied by the fcalib= 5.5 × 10¹³. The blue solid line is the total radiance of FIDASIM results. The red solid line is the signal FIDA component. The measured spectra and the predicted spectra are in good agreement at the center of the magnetic axis (R= 3.464 m∼3.729 m) which are the normalized minor radius of reff/a99 = −0.258∼0.126. Also, the measured spectra and the predicted spectra are in good agreement between 654 nm and 659 nm at all measurement positions; this indicates that the halo and injected beam emission are accurately modelled. As shown in figure 9, it is expected that the fast ion distribution is underestimated with increasing distance from the center of the plasma. There are two possible causes for this problem. First, the charge exchange loss may be overestimated due to insufficient estimation of the neutral particle distribution. Second, the calculation of re-entering particles is not considered in the GNET code. However, it is very important for the three-dimensional magnetic configuration device such as the LHD to be able to verify the fast-ion distribution by the FIDA diagnostic and FIDASIM. Note that the measured intensity between 651 nm and 654 nm is increasing at the R = 2.958 m∼3.237 m because DCX and BES reflect off the carbon wall of the plasma chamber and enter the LOS.
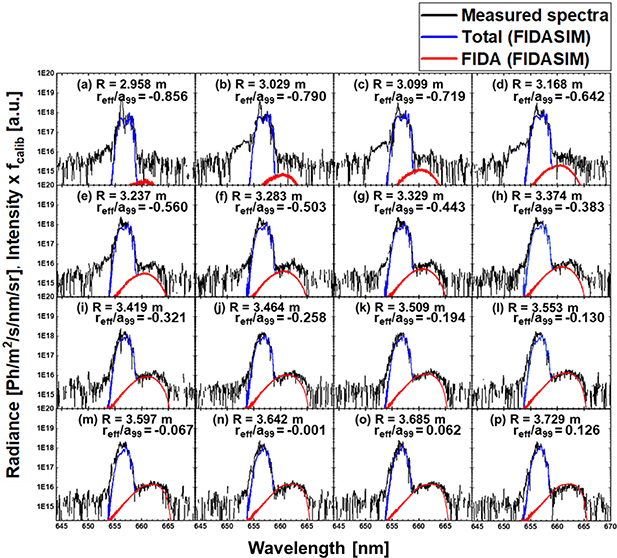
Figure 9. Measured spectra of FIDA diagnostics and simulated spectra calculated by FIDASIM at 16 different major radii (normalized minor radii) during the NB #1 injection (4.28 s∼4.30 s) in the discharge SN146695.
Download figure:
Standard image High-resolution imageFigure 10 shows the measured spectra of FIDA diagnostic and simulated spectra of total and FIDA spectra calculated by FIDASIM in the case of (a) SN146695, (b) SN146696, (c) SN146697, (d) SN146698, (e) SN146699, and (c) SN146701 during the NB #1 (4.28 s∼4.30 s). These discharges were MHD-quiescent deuterium plasmas. The fcalib is 5.5 × 10¹³ obtained from the SN146695 and also the SN146696. The line colors are the same as figure 9. In figures 10(a) and (b), shows the difference between an ion source A (left side of the ion beam injection direction) and an ion source B (right side of the ion beam injection direction) in the same plasma condition. As mentioned above, the experiment uses one ion source to observe the fast-ion radial profile in MHD-quiescent plasmas. These ion sources differ slightly in the injection angle. As a result of the comparison, we do not observe a major difference. Next, the gas puff system was used to change the plasma density. The ne_avg is: 0.65 × 10¹⁹ m−3 in the SN146695 and the SN146696, 0.59 × 10¹⁹ m−3 in the SN146697, 0.80 × 10¹⁹ m−3 in the SN146698, 1.23 × 10¹⁹ m−3 in the SN146699, and 2.67 × 10¹⁹ m−3 in the SN146701. It is observed with increasing ne_avg that the measured spectra of fast-ion component (between 659 nm and 662 nm corresponds to approximately 18 keV∼73 keV) gradually decreased. Also, the remaining component intensity gradually increases with increasing ne_avg. Therefore, the measured spectra of the fast-ion component are difficult to observe when the ne_avg is 2.67 × 10¹⁹ m−3. The imperfect background subtraction associated with this remaining component disturbs the comparison of the FIDA diagnostic radial profiles and the 3D-supporting FIDASIM radial profiles. The remaining component comes from bremsstrahlung, atomic, and molecular emissions other than DCX, BES, HALO, and FIDA components. The bremsstrahlung emission is removed by the subtraction the background spectra from the foreground. However, ne and te change slightly during the NB #4 injection. It is thought that these slight changes increase bremsstrahlung radiation. On the other hand, emissions excited by atomic and molecular collision processes in a low-temperature and high-density region which exists around the plasma whenever the NB #4 injects. Neutral particles are released from armor plates (carbon, molybdenum, and stainless-steel walls) by particles derived from perpendicular-NB, then these particles collide with low ionization state ions by infiltrating a low-temperature and high-density region. Since this emission occurs when the NB #4 is on, it is not subtracted by the NB #4 modulation. Additionally, in the LHD, this emission is larger than in the tokamak device because the power of the measurement beam is larger than other devices, so it cannot be ignored. To account for this effect, background obtained in an ECH plasma with the NB #4 modulation (but no negative-source-based NB) is used to subtract this remaining component.

Figure 10. Measured spectra of FIDA diagnostic and simulated spectra of total and FIDA spectra calculated by FIDASIM in the case of (a) SN146695, (b) SN146696, (c) SN146697, (d) SN146698, (e) SN146699, and (f) SN146701 during the NB #1 injection (4.28 s∼4.30 s).
Download figure:
Standard image High-resolution imageFigure 11 shows a comparison of the FIDA diagnostic radial profiles and the FIDASIM radial profiles for five different electron density discharges after integration over wavelength. The x-axis is the normalized minor radius of the LHD, and the y-axis is the radiance after spectral integration. From the FIDASIM results, intensities from 660.05 nm to 665.3 nm are clearly the FIDA component (as shown in figure 10), therefore we select that range of wavelength for the comparison. The circle symbol and red broken line are measurement results of the FIDA diagnostic. The triangle symbol and blue broken line are calculated by FIDASIM. The results of the simulation indicate a similar tendency with the experiments. In the ne_avg= 1.23 × 10¹⁹ m−3 case, the discrepancy between FIDASIM and the FIDA diagnostic is very large at reff/a99= −0.28 ∼ 0.05. This implies that GNET based on the neoclassical theory overestimates the fast ion distribution when slowing-down time is short. On the other hand, in the range of reff/a99< −0.28, the inconsistency of the comparison of FIDA diagnostic results and FIDASIM results is due to the underestimation of the fast-ion distribution calculated by GNET code, as shown in figure 9. One of the possible causes of this underestimation may be the model of the fast-ion losses assumed in GNET. In the present simulations, the fast ions that reached to the last-close-flux-surface were treated as instantly lost from the plasma. The charge exchange losses also have a large impact on the slowing down distribution of the fast ions, especially near the plasma edge where the neutral density is high.
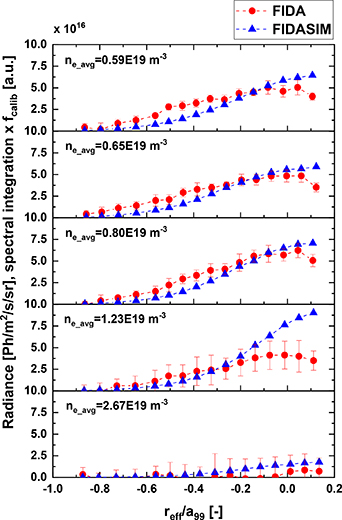
Figure 11. Comparison of the FIDA diagnostic and FIDASIM radial profiles for five different discharges of spectral integration. The radiance and spectral integration profile are for Doppler shifts (660.05 nm∼665.30 nm) during the NB #1 injection (4.28 s∼4.30 s).
Download figure:
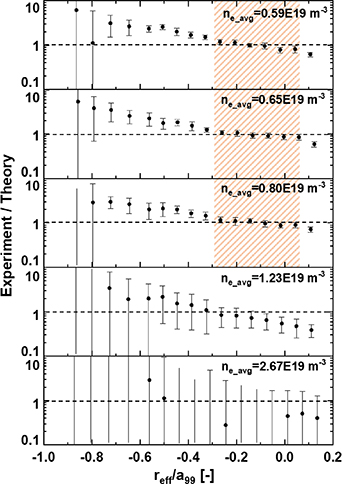
Standard image High-resolution imageFigure 12 shows the ratio between the FIDA diagnostic and FIDASIM after spectral integration vs normalized minor radius for the four different of electron density discharges in MHD-quiescent plasmas during the NB #1 injection (4.28 s∼4.30 s). As shown in figure 12, the Experiment/Theory ratio is approximately 1.0 between −0.28 and 0.05 on the normalized minor radius (between ∼3.5 m and ∼3.7 m on the major radius) when the line averaged electron density is ne_avg < 1.23 × 10¹⁹ m−3. The result indicates that, on average, the measurement and the simulation are consistent for these discharges at the center of the plasma (reff/a99= −0.28∼0.05) when the line averaged electron density is ne_avg < 1.23 × 10¹⁹ m−3. Overall, the FIDA diagnostic results and the FIDASIM results are in good agreement in MHD-quiescent plasmas at the center of the plasma for co-injection. This indicates that the FIDA diagnostic is able to be a strong tool for understanding fast-ion behavior with the MHD instabilities. This ratio can help to predict the measured spectrum from the FIDASIM calculation results. In this study, the FIDA measurement results are in agreement with the FIDASIM calculation results at the center of the plasma. The fact indicates that the GNET calculations are correct at the center of the plasma. Furthermore, the FIDA measurement results are in disagreement with the FIDASIM calculation results outside the center of the plasma. The fact is considered to indicate the limit of the orbit calculation using the Boozer coordinate system.
Figure 12. Ratio between the FIDA diagnostic (Experiment) and FIDASIM (Theory) of spectral integration of normalized minor radius for the five different of line averaged electron density discharges in MHD-quiescent plasmas during the NB #1 injection (4.28 s∼4.30 s).
Download figure:
Standard image High-resolution image
6. Conclusion
In summary, the data support the following conclusions.
AGREES:
- 1.Doppler-shifted H alpha and D alpha light emitted from passing energetic particles are consistent with NB injection angle and energy because the spectrum shape of FIDAM diagnostic results and FIDASIM results are in good agreement.
- 2.For shape of spectrum for the NB #1, FIDA diagnostic results and FIDASIM results are in good agreement in MHD-quiescent plasmas at the center of the plasma (R= 3.464 m∼3.729 m, reff/a99= − 0.258∼0.126) (figure 9).
- 3.The measured spectra and the predicted spectra are in good agreement between 654 nm and 659 nm throughout plasma; this indicates that the halo and injected beam emission are accurately modelled.
- 4.The Experiment/Theory ratio is approximately 1.0 between −0.28 and 0.05 on the normalized minor radius (between 3.5 m and 3.7 m on the major radius) when the line averaged electron density is ne_avg < 1.23 × 10¹⁹ m−3 in MHD-quiescent plasmas (figure 12).
DISAGREE:
- 1.The spectra magnitude and profile of FIDA component results of FIDASIM do not agree with the measured FIDA spectra in the case of the NB #2 injection (figure 8(b)).
- 2.It is expected that the fast-ion distribution is underestimated with fading in the distance from the center of the plasma (figure 9).
- 3.It is observed with increasing the ne_avg that the difference between the measured spectra and predicted spectra of FIDA component gradually increased (figure 10).
Further investigation of all three of these discrepancies is anticipated. This study indicates that the FIDA diagnostic is able to be a strong tool for understanding fast-ion distribution in the three-dimensional magnetic field device. For future works, we will endeavor to understand fast-ion behavior with the MHD instabilities using the FIDA diagnostic and the latest FIDASIM in the LHD. Also, in order to validate the fast-ion distribution by not only the GNET code but also MEGA code [46], and MORH code [47], measurements of radial profiles of fast ions using the FIDA diagnostic will be performed in MHD-quiescent plasmas.
Acknowledgments
This research was supported by the NINS program of Promoting Research by Networking among Institutions (Grant Number 01411702), the NIFS International Collaboration Research programs (NIFS18/KLPR047 and NIFS07/KLPH004), and the LHD project budget (ULRR006, ULRR035, ULRR036, and ULRR702). A part of this work was performed on 'Plasma Simulator' (FUJITSU FX100) of NIFS with the support and under the auspices of the NIFS Collaboration Research program NIFS18KNST135.