Lactate Kinetics Reflect Organ Dysfunction and Are Associated with Adverse Outcomes in Intensive Care Unit Patients with COVID-19 Pneumonia: Preliminary Results from a GREEK Single-Centre Study

 , ,
, ,  , , , and
Abstract
:
1. Introduction
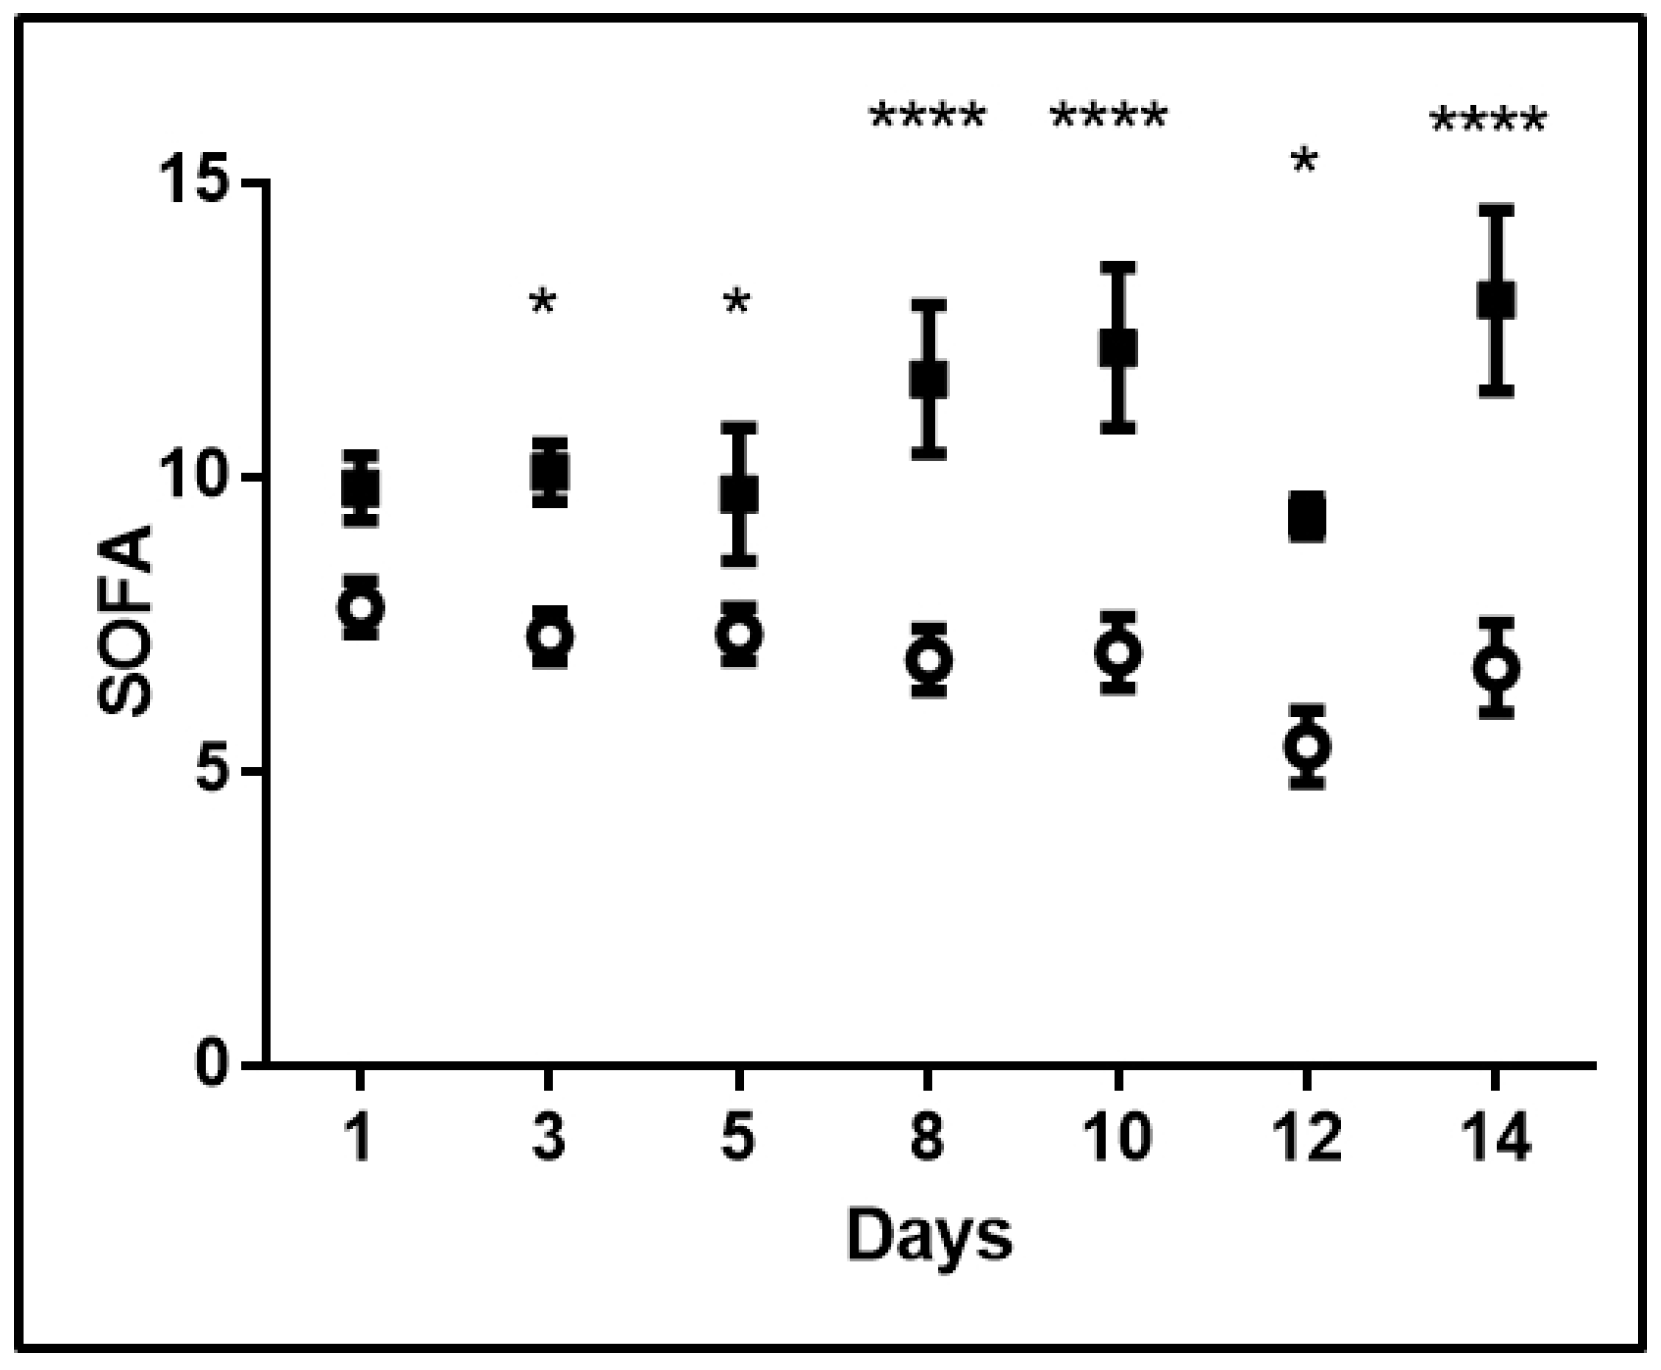
2. Results
3. Discussion
4. Materials and Methods
4.1. Study Population
4.2. Lactate Measurement
4.3. Statistical Analysis
5. Conclusions
Supplementary Materials
Author Contributions
Funding
Acknowledgments
Conflicts of Interest
References
- Zhu, N.; Zhang, D.; Wang, W.; Li, X.; Yang, B.; Song, J.; Zhao, X.; Huang, B.; Shi, W.; Lu, R.; et al. A Novel Coronavirus from Patients with Pneumonia in China, 2019. N. Engl. J. Med. 2020, 382, 727–733. [Google Scholar] [CrossRef] [PubMed]
- Harapan, H.; Itoh, N.; Yufika, A.; Winardi, W.; Keam, S.; Te, H.; Megawati, D.; Hayati, Z.; Wagner, A.L.; Mudatsir, M. Coronavirus disease 2019 (COVID-19): A literature review. J. Infect. Public Health 2020, 13, 667–673. [Google Scholar] [CrossRef] [PubMed]
- Yang, X.; Yu, Y.; Xu, J.; Shu, H.; Xia, J.; Liu, H.; Wu, Y.; Zhang, L.; Yu, Z.; Fang, M.; et al. Clinical course and outcomes of critically ill patients with SARS-CoV-2 pneumonia in Wuhan, China: A single-centered, retrospective, observational study. Lancet Respir. Med. 2020, 8, 475–481. [Google Scholar] [CrossRef] [Green Version]
- Grasselli, G.; Zangrillo, A.; Zanella, A.; Antonelli, M.; Cabrini, L.; Castelli, A.; Cereda, D.; Coluccello, A.; Foti, G.; Fumagalli, R.; et al. Baseline Characteristics and Outcomes of 1591 Patients Infected With SARS-CoV-2 Admitted to ICUs of the Lombardy Region, Italy. JAMA 2020, 323, 1574–1581. [Google Scholar] [CrossRef] [PubMed] [Green Version]
- Richardson, S.; Hirsch, J.S.; Narasimhan, M.; Crawford, J.M.; McGinn, T.; Davidson, K.W.; Barnaby, D.P.; Becker, L.B.; Chelico, J.D.; Cohen, S.L.; et al. Presenting Characteristics, Comorbidities, and Outcomes Among 5700 Patients Hospitalized With COVID-19 in the New York City Area. JAMA 2020, 323, 2052–2059. [Google Scholar] [CrossRef]
- Docherty, A.B.; Harrison, E.M.; Green, C.A.; Hardwick, H.E.; Pius, R.; Norman, L.; Holden, K.A.; Read, J.M.; Dondelinger, F.; Carson, G.; et al. Features of 20,133 UK patients in hospital with covid-19 using the ISARIC WHO Clinical Characterisation Protocol: Prospective observational cohort study. BMJ 2020, 369, m1985. [Google Scholar] [CrossRef]
- Bakker, J.; Nijsten, M.W.; Jansen, T.C. Clinical use of lactate monitoring in critically ill patients. Ann. Intensive Care 2013, 3, 12. [Google Scholar] [CrossRef] [Green Version]
- Vincent, J.L.; Quintairos, E.S.A.; Couto, L., Jr.; Taccone, F.S. The value of blood lactate kinetics in critically ill patients: A systematic review. Crit. Care 2016, 20, 257. [Google Scholar] [CrossRef] [Green Version]
- Vincent, J.L.; Dufaye, P.; Berré, J.; Leeman, M.; Degaute, J.P.; Kahn, R.J. Serial lactate determinations during circulatory shock. Crit. Care Med. 1983, 11, 449–451. [Google Scholar] [CrossRef]
- Abramson, D.; Scalea, T.M.; Hitchcock, R.; Trooskin, S.Z.; Henry, S.M.; Greenspan, J. Lactate clearance and survival following injury. J. Trauma 1993, 35, 584–588; discussion 588–589. [Google Scholar] [CrossRef]
- Bakker, J.; Gris, P.; Coffernils, M.; Kahn, R.J.; Vincent, J.L. Serial blood lactate levels can predict the development of multiple organ failure following septic shock. Am. J. Surg. 1996, 171, 221–226. [Google Scholar] [CrossRef]
- Suistomaa, M.; Ruokonen, E.; Kari, A.; Takala, J. Time-pattern of lactate and lactate to pyruvate ratio in the first 24 h of intensive care emergency admissions. Shock 2000, 14, 8–12. [Google Scholar] [CrossRef] [PubMed] [Green Version]
- Singer, M.; Deutschman, C.S.; Seymour, C.W.; Shankar-Hari, M.; Annane, D.; Bauer, M.; Bellomo, R.; Bernard, G.R.; Chiche, J.D.; Coopersmith, C.M.; et al. The Third International Consensus Definitions for Sepsis and Septic Shock (Sepsis-3). JAMA 2016, 315, 801–810. [Google Scholar] [CrossRef] [PubMed]
- Ilias, I.; Jahaj, E.; Kokkoris, S.; Zervakis, D.; Temperekidis, P.; Magira, E.; Pratikaki, M.; Vassiliou, A.G.; Routsi, C.; Kotanidou, A.; et al. Clinical Study of Hyperglycemia and SARS-CoV-2 Infection in Intensive Care Unit Patients. In Vivo 2020, 34, 3029–3032. [Google Scholar] [CrossRef] [PubMed]
- Alhazzani, W.; Møller, M.H.; Arabi, Y.M.; Loeb, M.; Gong, M.N.; Fan, E.; Oczkowski, S.; Levy, M.M.; Derde, L.; Dzierba, A.; et al. Surviving Sepsis Campaign: Guidelines on the Management of Critically Ill Adults with Coronavirus Disease 2019 (COVID-19). Crit. Care Med. 2020, 48, e440–e469. [Google Scholar] [CrossRef]
- Huang, C.; Wang, Y.; Li, X.; Ren, L.; Zhao, J.; Hu, Y.; Zhang, L.; Fan, G.; Xu, J.; Gu, X.; et al. Clinical features of patients infected with 2019 novel coronavirus in Wuhan, China. Lancet 2020, 395, 497–506. [Google Scholar] [CrossRef] [Green Version]
- Arentz, M.; Yim, E.; Klaff, L.; Lokhandwala, S.; Riedo, F.X.; Chong, M.; Lee, M. Characteristics and Outcomes of 21 Critically Ill Patients With COVID-19 in Washington State. JAMA 2020, 323, 1612–1614. [Google Scholar] [CrossRef] [PubMed] [Green Version]
- Wu, C.; Chen, X.; Cai, Y.; Xia, J.; Zhou, X.; Xu, S.; Huang, H.; Zhang, L.; Zhou, X.; Du, C.; et al. Risk Factors Associated With Acute Respiratory Distress Syndrome and Death in Patients With Coronavirus Disease 2019 Pneumonia in Wuhan, China. JAMA Intern. Med. 2020. [Google Scholar] [CrossRef] [Green Version]
- Zhou, F.; Yu, T.; Du, R.; Fan, G.; Liu, Y.; Liu, Z.; Xiang, J.; Wang, Y.; Song, B.; Gu, X.; et al. Clinical course and risk factors for mortality of adult inpatients with COVID-19 in Wuhan, China: A retrospective cohort study. Lancet 2020, 395, 1054–1062. [Google Scholar] [CrossRef]
- Quah, P.; Li, A.; Phua, J. Mortality rates of patients with COVID-19 in the intensive care unit: A systematic review of the emerging literature. Crit. Care 2020, 24, 285. [Google Scholar] [CrossRef]
- Wynants, L.; Van Calster, B.; Bonten, M.M.J.; Collins, G.S.; Debray, T.P.A.; De Vos, M.; Haller, M.C.; Heinze, G.; Moons, K.G.M.; Riley, R.D.; et al. Prediction models for diagnosis and prognosis of covid-19 infection: Systematic review and critical appraisal. BMJ 2020, 369, m1328. [Google Scholar] [CrossRef] [PubMed] [Green Version]
- Auld, S.C.; Caridi-Scheible, M.; Blum, J.M.; Robichaux, C.; Kraft, C.; Jacob, J.T.; Jabaley, C.S.; Carpenter, D.; Kaplow, R.; Hernandez-Romieu, A.C.; et al. ICU and Ventilator Mortality Among Critically Ill Adults With Coronavirus Disease 2019. Crit. Care Med. 2020. [Google Scholar] [CrossRef] [PubMed]
- Zou, X.; Li, S.; Fang, M.; Hu, M.; Bian, Y.; Ling, J.; Yu, S.; Jing, L.; Li, D.; Huang, J. Acute Physiology and Chronic Health Evaluation II Score as a Predictor of Hospital Mortality in Patients of Coronavirus Disease 2019. Crit. Care Med. 2020. [Google Scholar] [CrossRef] [PubMed]
- Du, Y.; Tu, L.; Zhu, P.; Mu, M.; Wang, R.; Yang, P.; Wang, X.; Hu, C.; Ping, R.; Hu, P.; et al. Clinical Features of 85 Fatal Cases of COVID-19 from Wuhan. A Retrospective Observational Study. Am. J. Respir. Crit. Care Med. 2020, 201, 1372–1379. [Google Scholar] [CrossRef] [Green Version]
- Tan, L.; Wang, Q.; Zhang, D.; Ding, J.; Huang, Q.; Tang, Y.Q.; Wang, Q.; Miao, H. Lymphopenia predicts disease severity of COVID-19: A descriptive and predictive study. Signal Transduct. Target. Ther. 2020, 5, 33. [Google Scholar] [CrossRef]
- Ferreira, F.L.; Bota, D.P.; Bross, A.; Mélot, C.; Vincent, J.L. Serial evaluation of the SOFA score to predict outcome in critically ill patients. JAMA 2001, 286, 1754–1758. [Google Scholar] [CrossRef] [Green Version]
- Ranieri, V.M.; Rubenfeld, G.D.; Thompson, B.T.; Ferguson, N.D.; Caldwell, E.; Fan, E.; Camporota, L.; Slutsky, A.S. Acute respiratory distress syndrome: The Berlin Definition. JAMA 2012, 307, 2526–2533. [Google Scholar] [CrossRef]


| Characteristics | All Patients | Survivors | Non-Survivors | p-Value |
|---|---|---|---|---|
| Number of patients, N (%) | 45 | 34 (75.6%) | 11 (24.4%) | |
| Age (years), (mean ± SD) | 64 ± 10 | 63 ± 10 | 67 ± 10 | 0.244 |
| Sex, N (%) | 0.765 | |||
| Male | 33 (73.3%) | 24 (72.7%) | 9 (27.3%) | |
| Female | 12 (26.7%) | 10 (83.3%) | 2 (16.7%) | |
| Comorbidities, N (%) | 0.887 | |||
| Hypertension | 18 | 15 (83.3%) | 3 (16.7%) | |
| Diabetes | 5 | 3 (60.0%) | 2 (40.0%) | |
| Coronary artery disease | 3 | 1 (33.3%) | 2 (66.7%) | |
| COPD | 1 | 0 (0.0%) | 1 (100.0%) | |
| Asthma | 1 | 1 (100.0%) | 0 (0.0%) | |
| Hyperlipidaemia | 10 | 8 (80.0%) | 2 (20.0%) | |
| Chronic kidney disease | 1 | 0 (0.0%) | 1 (100.0%) | |
| Hepatitis | 1 | 1 (100.0%) | 0 (0.0%) | |
| Characteristics on ICU Admission | ||||
| APACHE II score, (median, IQR) | 17 (14–19) | 16 (14–18) | 18 (16–22) | 0.025 * |
| SOFA score, (median, IQR) | 9 (8–10) | 8 (7–10) | 10 (8–11) | 0.031 * |
| PaO2/FiO2 (mmHg), (mean ± SD) | 166 ± 70 | 171 ± 71 | 151 ± 70 | 0.418 |
| PCO2 (mmHg), (mean ± SD) | 45 ± 9 | 44 ± 7 | 50 ± 13 | 0.051 |
| pH, (median, IQR) | 7.33 (7.29–7.45) | 7.36 (7.31–7.45) | 7.31 (7.25–7.38) | 0.063 |
| HCO3 (mEq/L), (median, IQR) | 23 (21–27) | 23 (21–25) | 21 (21–30) | 0.474 |
| Vitals signs | ||||
| Heart rate (bpm), (mean ± SD) | 84 ± 28 | 87 ± 25 | 77 ± 37 | 0.247 |
| Mean Arterial pressure (mmHg), (median, IQR) | 78 (70–90) | 77 (70–84) | 78 (68–105) | 0.71 |
| Respiratory rate (breaths/min), (mean ± SD) | 22 ± 3 | 21 ± 3 | 24 ± 3 | 0.023 * |
| Temperature (°C), (mean ± SD) | 37.0 ± 1.4 | 37.3 ± 1.2 | 36.0 ± 1.6 | 0.0051 * |
| Laboratory data | ||||
| Haemoglobin, (mean ± SD) | 12.4 ± 2.2 | 12.8 ± 1.8 | 11.2 ± 2.8 | 0.033 * |
| Haematocrit, (mean ± SD) | 37.3 ± 6.3 | 38.6 ± 4.7 | 33.4 ± 8.8 | 0.015 * |
| White Blood Cell count (per μL), (median, IQR) | 9400 (5200–11,750) | 9050 (5275–10,868) | 12,800 (1300–154,100) | 0.572 |
| Neutrophils (%), (median, IQR) | 82.0 (78.0–87.5) | 81.5 (78.6–87.0) | 86.0 (72.0–90.0) | 0.891 |
| Lymphocytes (%), (median, IQR) | 13.0 (7.5–18.5) | 13.0 (8.0–18.3) | 9.0 (5.0–21.0) | 0.561 |
| Platelets (per μL), (mean ± SD) | 196,844 ± 85,148 | 207,912 ± 63,197 | 162636 ± 130449 | 0.127 |
| PT (sec), (median, IQR) | 13 (13–14) | 13 (13–14) | 13 (12–14) | 0.923 |
| APTT (sec), (mean ± SD) | 34.3 ± 5.5 | 34.3 ± 5.8 | 34.5 ± 5.1 | 0.923 |
| INR, (median, IQR) | 1.06 (1.00–1.10) | 1.06 (1.00–1.10) | 1.07 (1.00–1.13) | 0.881 |
| Creatinine (mg/dL), (mean ± SD) | 1.1 ± 0.5 | 0.9 ± 0.2 | 1.5 ± 0.8 | 0.0003 * |
| Glucose (mg/dL), (median, IQR) | 142 (117–189) | 142 (116–186) | 145 (117–262) | 0.525 |
| Total Bilirubin (mg/dL), (median, IQR) | 0.6 (0.5–0.8) | 0.6 (0.5–0.8) | 0.5 (0.4–0.8) | 0.321 |
| Albumin (g/dL), (mean ± SD) | 3.4 ± 0.5 | 3.4 ± 0.5 | 3.1 ± 0.5 | 0.129 |
| Globulin (g/dL), (mean ± SD) | 2.6 ± 0.5 | 2.7 ± 0.5 | 2.3 ± 0.7 | 0.064 |
| CKMB (IU/L), (median, IQR) | 24.0 (15.5–32.5) | 23.5 (14.8–33.0) | 25.0 (20.0–32.0) | 0.711 |
| CK (U/L), (median, IQR) | 159.0 (55.5–365.0) | 169.5 (63.8–364.8) | 137.0 (21.0–376.0) | 0.493 |
| Fibrinogen (mg/dL), (mean ± SD) | 632.6 ± 166.3 | 652.7 ± 157.7 | 570.5 ± 184.5 | 0.157 |
| CRP (mg/dL), (mean ± SD) | 17.0 ± 11.6 | 15.9 ± 9.3 | 20.4 ± 17.1 | 0.269 |
| γ-GT (IU/L), (median, IQR) | 59.0 (27.0–113.0) | 62.0 (27–122.5) | 42.0 (24.0–78.0) | 0.225 |
| Urea (mg/dL), (median, IQR) | 34.0 (27.0–49.5) | 31.0 (24.8–41.0) | 46.0 (39.0–89.0) | 0.0013 * |
| AST (IU/L), (median, IQR) | 42.0 (28.5–58.5) | 42.5 (33.8–60.0) | 28.0 (26.0–58.0) | 0.274 |
| ALT (IU/L), (mean ± SD) | 39.2 ± 20.9 | 40.4 ± 20.4 | 35.6 ± 23.1 | 0.506 |
| Na+ (mEq/L), (mean ± SD) | 137.9 ± 5.8 | 138.0 ± 5.1 | 137.5 ± 8.0 | 0.779 |
| K+ (mg/dL), (mean ± SD) | 4.1 ± 0.7 | 4.2 ± 0.7 | 3.8 ± 0.7 | 0.117 |
| ALP (U/L), (median, IQR) | 67.0 (45.0–105.0) | 65.5 (43.8–130.8) | 67.0 (52.0–102.0) | 0.740 |
| LDH (U/L), (median, IQR) | 479.0 (347.0–631.5) | 482.5 (356.5–630.3) | 470.0 (235.0–637.0) | 0.636 |
| High-sensitive troponin T (ng/mL), (median, IQR) | 15 (10–42) | 12 (10–28) | 33 (16–83) | 0.013 * |
| Amylase (U/L), (median, IQR) | 65.0 (38.5–97.8) | 66.0 (38.0–106.0) | 56.0 (40.0–97.0) | 0.693 |
| Lactate (mmol/L) | 1.4 (1.1–2.1) | 1.4 (1.0–1.8) | 2.0 (1.4–2.3) | 0.0066 * |
| COVID-19-Targeted Treatment | 0.81 | |||
| Azithromycin/chloroquine/lopinavir/ritonavir | 20 | 17 | 3 | |
| Azithromycin/chloroquine | 15 | 10 | 5 | |
| Lopinavir/ritonavir/chloroquine | 5 | 4 | 1 | |
| Chloroquine | 4 | 2 | 2 | |
| Plasma | 1 | 1 | 0 | |
| Outcomes | ||||
| LoS in the ICU (days), (median, IQR) | 13.0 (8.0–17.0) | 13.0 (10.0–19.0) | 8.0 (4.0–11.0) | 0.007 * |
| Mechanical ventilation, N (%) | 39 | 28 | 11 | ns |
| Duration of mechanical ventilation (days), (median, IQR) | 10.0 (4.0–14.0) | 10.0 (3.0–16.0) | 8.0 (4.0–11.0) | ns |
| Variable | Univariate RR | 95% CI | p |
|---|---|---|---|
| APACHE II score (per 1 unit increase) | 1.235 | 1.033–1.476 | 0.020 * |
| SOFA score (per 1 unit increase) | 1.424 | 0.939–2.160 | 0.096 |
| Lactate (per 0.1 mmol/L increase) | 2.911 | 1.552–5.460 | 0.001 * |
| Troponin T (per 1 ng/mL) | 1.004 | 1.001–1.007 | 0.015 * |
© 2020 by the authors. Licensee MDPI, Basel, Switzerland. This article is an open access article distributed under the terms and conditions of the Creative Commons Attribution (CC BY) license (http://creativecommons.org/licenses/by/4.0/).
Share and Cite
Vassiliou, A.G.; Jahaj, E.; Ilias, I.; Markaki, V.; Malachias, S.; Vrettou, C.; Ischaki, E.; Mastora, Z.; Douka, E.; Keskinidou, C.; et al. Lactate Kinetics Reflect Organ Dysfunction and Are Associated with Adverse Outcomes in Intensive Care Unit Patients with COVID-19 Pneumonia: Preliminary Results from a GREEK Single-Centre Study. Metabolites 2020, 10, 386. https://doi.org/10.3390/metabo10100386
Vassiliou AG, Jahaj E, Ilias I, Markaki V, Malachias S, Vrettou C, Ischaki E, Mastora Z, Douka E, Keskinidou C, et al. Lactate Kinetics Reflect Organ Dysfunction and Are Associated with Adverse Outcomes in Intensive Care Unit Patients with COVID-19 Pneumonia: Preliminary Results from a GREEK Single-Centre Study. Metabolites. 2020; 10(10):386. https://doi.org/10.3390/metabo10100386
Chicago/Turabian StyleVassiliou, Alice G., Edison Jahaj, Ioannis Ilias, Vassiliki Markaki, Sotirios Malachias, Charikleia Vrettou, Eleni Ischaki, Zafeiria Mastora, Evangelia Douka, Chrysi Keskinidou, and et al. 2020. "Lactate Kinetics Reflect Organ Dysfunction and Are Associated with Adverse Outcomes in Intensive Care Unit Patients with COVID-19 Pneumonia: Preliminary Results from a GREEK Single-Centre Study" Metabolites 10, no. 10: 386. https://doi.org/10.3390/metabo10100386