Hydrogeology of Volcanic Highlands Affects Prioritization of Land Management Practices
by
 ,
,
Anwar A. Adem
1,2 ,
,
Gashaw G. Addis
3,
Dessalew W. Aynalem
1,
Seifu A. Tilahun
1,
Wolde Mekuria
4,
Mulugeta Azeze
1 and
Tammo S. Steenhuis
1,5,* 1
Faculty of Civil and Water Resources Engineering, Bahir Dar Institute of Technology, Bahir Dar University, Bahir Dar 6000, Ethiopia
2
Department of Natural Resource Management, College of Agriculture and Environmental Science, Bahir Dar University, Bahir Dar 6000, Ethiopia
3
Amhara Design and Supervision Works Enterprise (ADSWE), Bahir Dar 6000, Ethiopia
4
International Water Management Institute, Addis Ababa 2689, Ethiopia
5
Department of Biological and Environmental Engineering, Cornell University, Ithaca, NY 14853, USA
*
Author to whom correspondence should be addressed.
Water 2020, 12(10), 2702; https://doi.org/10.3390/w12102702
Submission received: 8 August 2020
/
Revised: 10 September 2020
/
Accepted: 22 September 2020
/
Published: 27 September 2020
(This article belongs to the Special Issue Hydrology and Sedimentology of Hilly and Mountainous Landscapes)
Abstract
:Volcanic highlands supply water to 40% of the world’s population. Soil degradation threatens this water supply. Studies on geohydrology that affect the effectiveness of land and water management (LWM) practices in reducing soil degradations are limited. To aid in the effectiveness of LWM practices, we conducted a field experiment in the Gomit watershed in the semihumid Ethiopian Highlands on the interaction of hydrogeology and LWM practices. We found that in a watershed with strongly faulted tertiary basalt, 30% of the rainfall was drained through faults to another basin. Consequently, the discharge at the outlet was less than half of that of other watersheds with quaternary basalts. Despite the high sediment concentration, i.e., around 15 g L−1, in the Gomit watershed, the sediment yield of less than 4 Mg ha−1 a−1 was below average for the agricultural watershed in Ethiopia because of the low runoff response. While some faults facilitated drainage, others acted as a barrier. Groundwater stored behind the barriers was used as a municipal potable water source. Since the effectiveness of LWM practices depends on the amount of erosion that can be prevented, considerations of country-wide prioritizing of investments in land and water management practices should include the geology of the watersheds.
1. Introduction
Mountainous volcanic highlands are complex hydrological systems that provide water to 40% of the world’s population in lower-lying areas [1,2,3,4]. For example, the Blue Nile, originating in the Ethiopian Highlands, is essential for the survival and well-being of the 130 million people living in Sudan and Egypt [5]. Another example is the drainage basin of the Amazon river that starts in the Andes Mountains and includes the greater part of Brazil and Peru, significant parts of Colombia, Ecuador, and Bolivia, and a small area of Venezuela. While maintaining a water supply for low-lying areas is important, the highlands themselves support the livelihood of millions of people. In Ethiopia alone, 100 million people are living in the highlands.
Despite the critical role of mountainous volcanic highlands, a good understanding of their hydrology is lacking [6]. Specifically, the water resources engineering practices that were developed in nonvolcanic regions do not seem to apply to volcanic highlands. A good example is in Oregon’s central the Cascade Range where, despite the use of sound engineering methods in building an irrigation reservoir, the project failed because the water infiltrated through large sinkholes before it could be stored behind the dam [7].
Geohydrological field research that has been carried out in volcanic regions shows that the water movement in such regions is distinct from that in sedimentary basins. One of the differences is that in volcanic highlands, discharge is affected, under otherwise similar conditions, by the age of the geological formation, among other factors, as shown by Tague and Grant [8]. They found that in Oregon’s Cascade Range, the summer baseflow was proportional to the percentage of volcanic rocks that were younger than 2 million years. Muñoz-Villers and McDonnell [9] in Mexico and Iwagami et al. [10] in Japan reported that runoff was directly related to the percentage of highly permeable, strongly weathered, and fractured volcanic rocks. Another difference between volcanic derived andosols and sediments is that despite the large percentage of clay particles in andosols, volcanic experimental watershed studies in Ecuador [11,12], in Oregon’s Cascade Range [8], in Ethiopia [13,14,15,16], and in Honduras [17] exhibited high hydraulic conductivities and water flows, mainly via the subsurface to the valley bottoms where they surface. Finally, unlike most low lying watersheds, subsurface transfer of flow from one surface basin to another has been reported in volcanic watersheds in the southern Rio Grande Valley, USA [18], the Andean basins in Chile [3,19,20,21], a Costa Rican rainforest [22,23], and the Ethiopian Highlands [24,25].
The current study was carried out in the Ethiopian Highlands, which are similar to volcanic highlands elsewhere with highly conductive topsoil, subsurface interbasin transfers of water, and a large population that depends on the natural resource base for ecological services, both in the highlands and downstream. The land in the highlands is becoming increasingly degraded with the shift to continuous cultivation of crops to feed the rapidly increasing population, resulting in a loss of organic matter and subsequent hardpan formation affecting the recharge and surface runoff processes [26,27,28]. This, in turn, is threatening the natural resources base and the associated ecological services [29,30,31,32,33]. The severe famine between 1983–1985 was caused partly by the degraded resource base [34]. To prevent further degradation, the government began implementing land and water management (LWM) practices [35,36,37,38]. The structural practices include bunds, hillside terraces, check dams, infiltration furrows, and biological measures including enclosures preventing the grazing of animals.
To better understand the effect on soil loss of the degrading resource base, researchers have carried out studies at several scales: research at the plot scale was carried out by Shiferaw and Holden [39], Welle et al. [40], Araya et al. [41], and Araya et al. [42], and at watershed-scale by Bewket and Sterk [43], Taye et al. [44], Alemu et al. [45], and Adimassu et al. [46]. To reduce soil erosion and enhance ecosystem services, the effect of soil and water conservation was studied by Dagnew et al. [31], Yitbarek et al. [35], Nyssen et al. [47], Nyssen et al. [48]. These studies showed that the effectiveness of the various LWM practices was dependent on the amount of rainfall. In the semiarid Ethiopian Highlands, LWM efforts have been effective at maintaining the ecosystem services by increasing the moisture content in the soil by reducing the amount of runoff, mainly with infiltration furrows or stone bunds. [30,48,49,50,51]. In subhumid and humid highlands, where precipitation exceeds potential evaporation during the rainy monsoon phase, excess rainfall is drained by farmers so that fields remain unsaturated [31,37,52,53]. In these highlands, the effect of land use on runoff generation was studied by Mekuria et al. [33], Girmay et al. [51], Bewket and Sterk [54], Gebresamuel et al. [55], and Taye et al. [56], and the interaction of slope and runoff generation was researched by Descheemaeker et al. [50], Taye et al. [56], Engda et al. [57], and Tilahun et al. [58]. None of these studies addressed the underlying hydrogeology of the region to explain differences in runoff and erosion between the various experimental sites and LWM practices [59,60].
Thus, despite the implementation of government-imposed water conservation practices, the land has become more degraded in humid and subhumid highlands [26,61], and sediment concentrations in streams have been increasing [62,63]. Annual soil losses equivalent to 1–8 mm per year are not uncommon in small watersheds, with the upper end of the sediment losses being from watersheds that have active gully formations [64,65]. Restoring natural resource bases before soils are fully degraded is important because the harm caused in one year cannot be repaired in a human lifetime [66].
Despite many studies worldwide that have shown the importance of geology on the hydrological responses of volcanic highlands, none of the watershed studies on the Ethiopian Highlands has considered this and its impact on LWM practices. The objective of this study is therefore to investigate the effect of geology on both on watershed runoff response and the effectiveness of LWM practices in the volcanic highland in general and specifically in Ethiopia.
We selected the Gomit watershed in the Rib watershed because, over the last ten years, land and water management (LWM) practices were implemented. In addition, its unique subsurface hydrogeology allowed water to bypass the gauge and only a small portion of the rainfall was recorded at the outlet. We investigated surface and subsurface transport and erosion. Since land and water management practices will be most effective for hydrogeological conditions that promote surface runoff and associated high soil losses, this study links sediment loss with geological features, and will aid in prioritizing the regions for the implementation of LWM practices for maximum benefit. Since the Ethiopian Highlands are like other volcanic highlands, the results are valid more widely.
2. Materials and Methods
2.1. Gomit Watershed
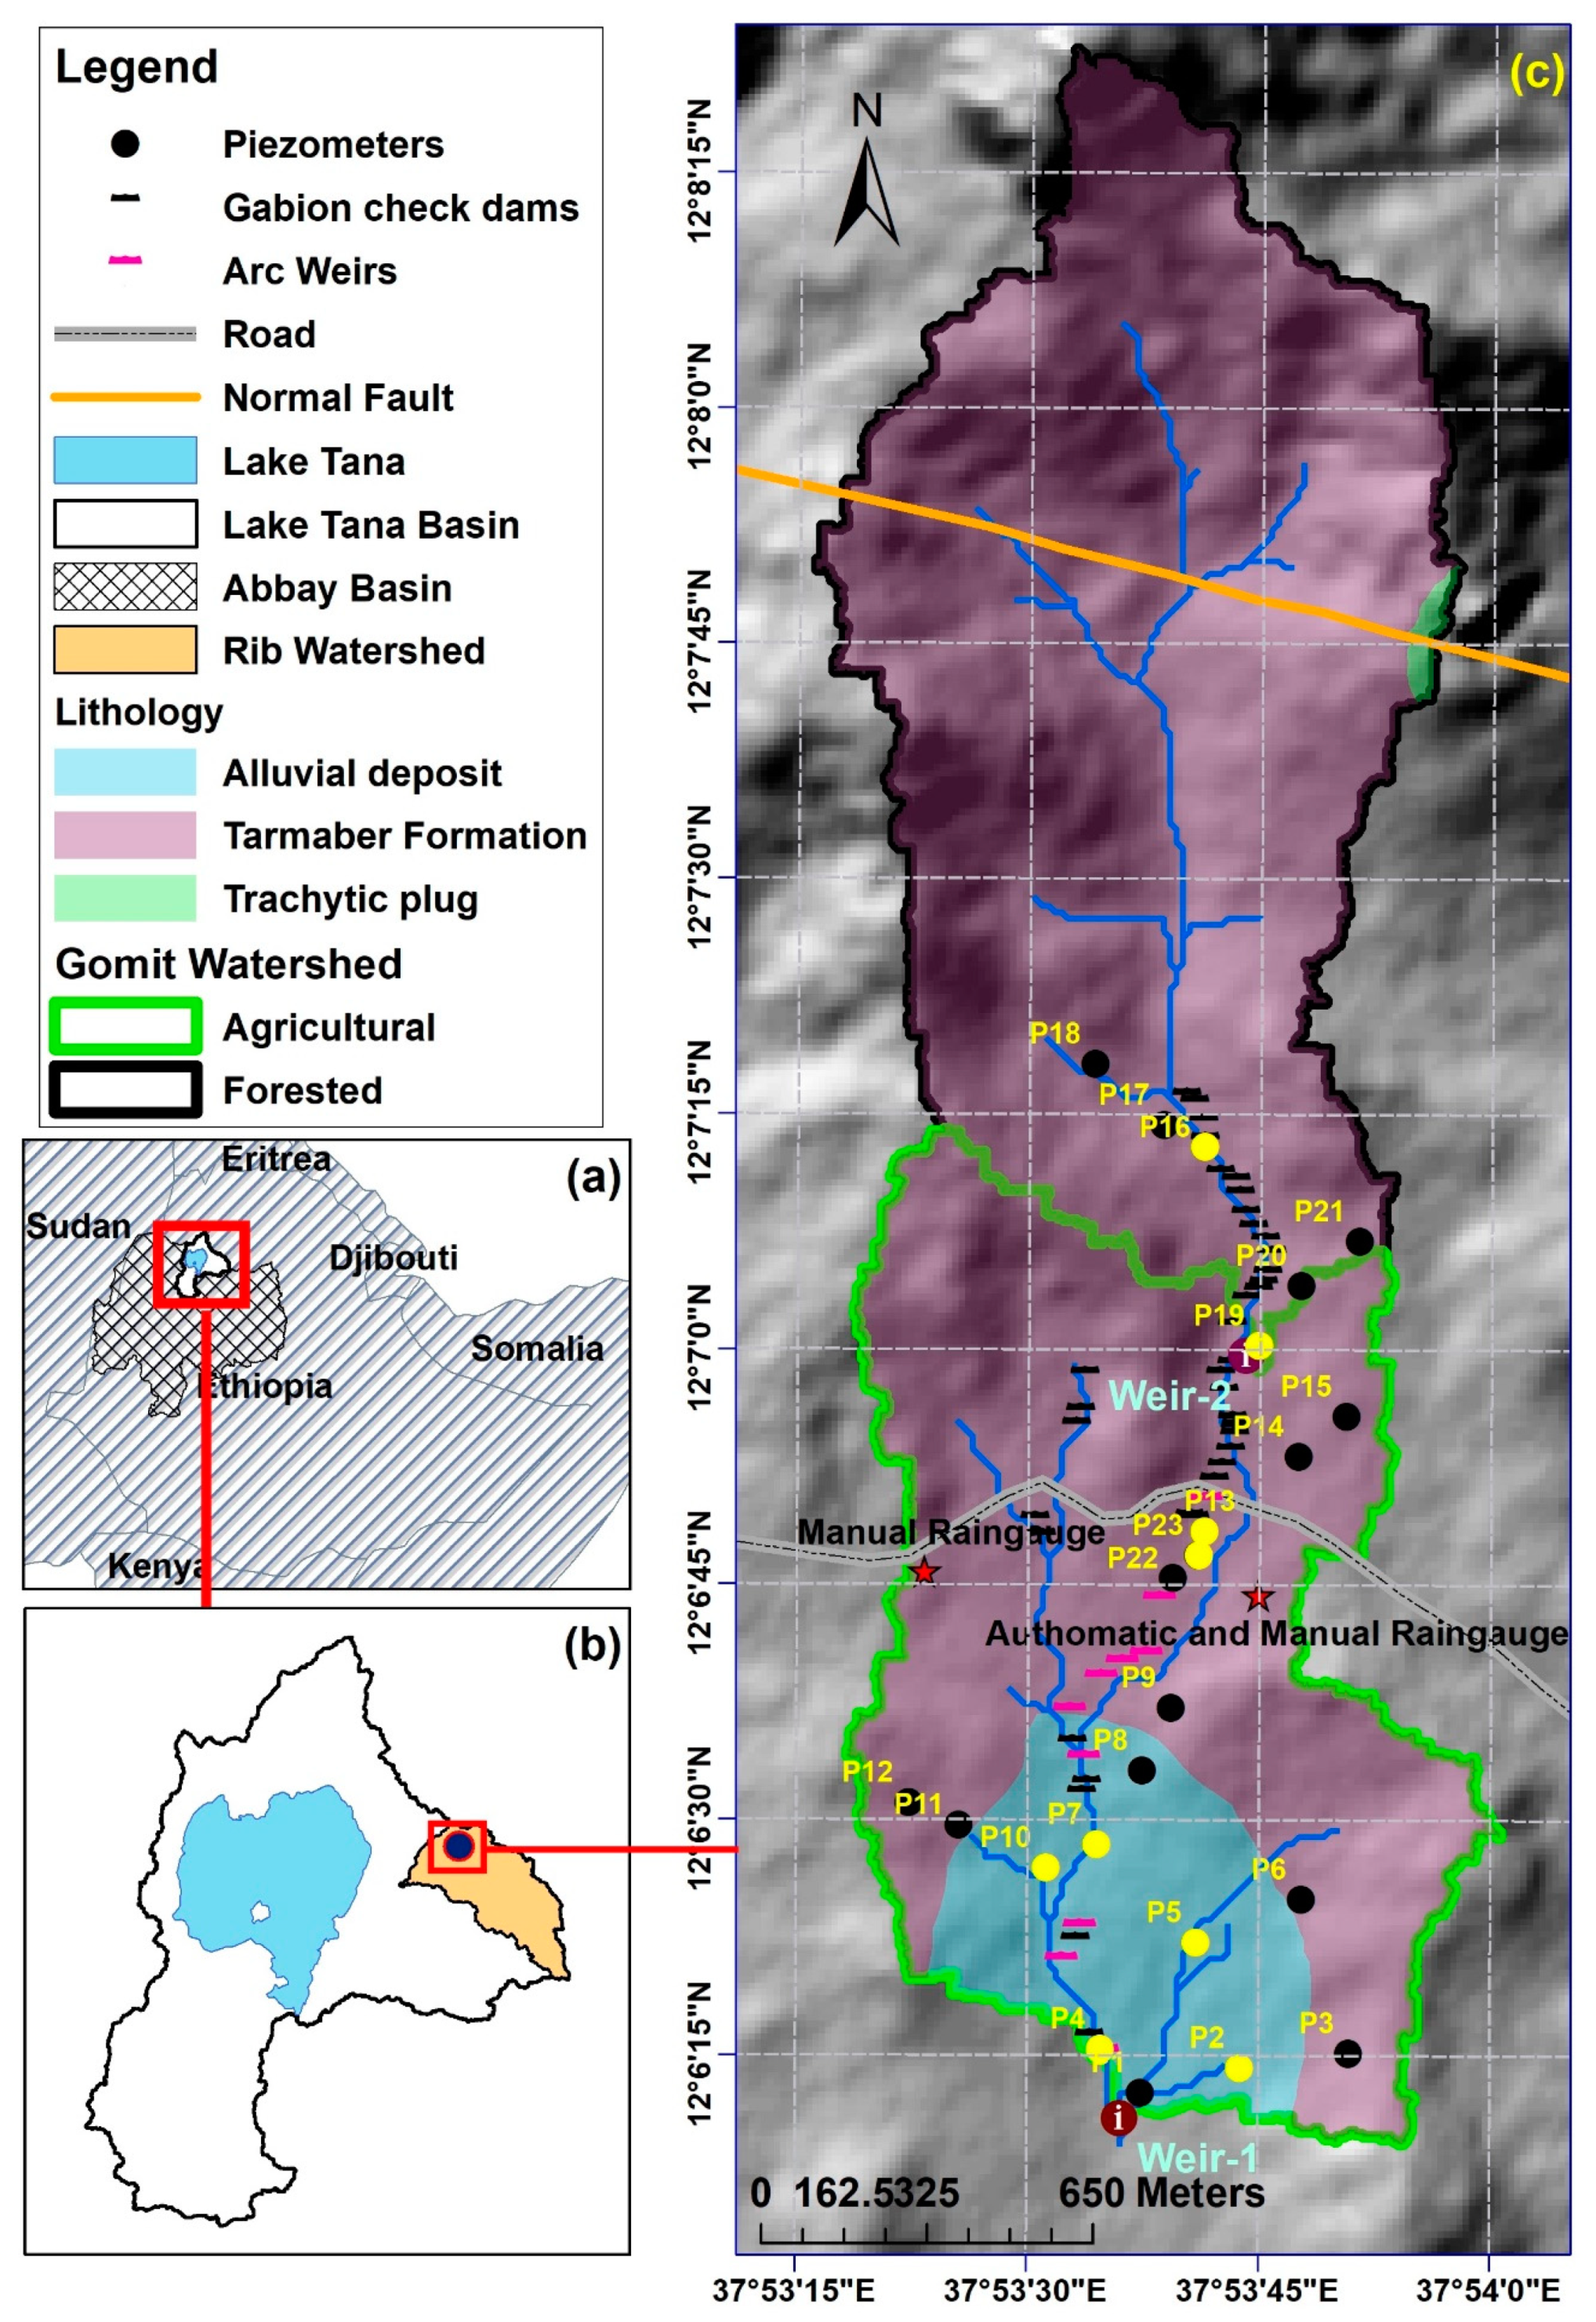
The 359-ha Gomit watershed (12°6′9.2″ to 12°8′23″ N and 37°53′16.5″ to 37°54′0.3″ E) is in the headwaters of the Rib River in the Lake Tana basin in the headwaters of the Blue Nile on the Northwestern Ethiopian Plateau. The location of the outlet is 12°6′8.6″ N and 37°53′36.3″ E with an elevation of 1974 m (Figure 1). The highest point in the watershed is 2612 m. The mean annual rainfall from 1997 to 2015 is 1265 mm and annual potential evaporation is 1428 mm [67]. Finger millet, tef, bean, maize, and niger seed are the primary crops.
The Gomit watershed was divided into two sections (Figure 1): the 196 ha watershed located upstream that was largely forested, with 85% of slopes greater than 15 degrees, and the 163 ha downstream area with mainly agricultural activities, with 30% of slopes less than 15 degrees (Figure 1). Leptosols (49%) and Luvisols (39%) are the major soil types in the upper forested area. Luvisols (44%) and Nitosols (26%) are the main soils in the agricultural downstream area. Further detail is provided in Appendix A, Table A1.
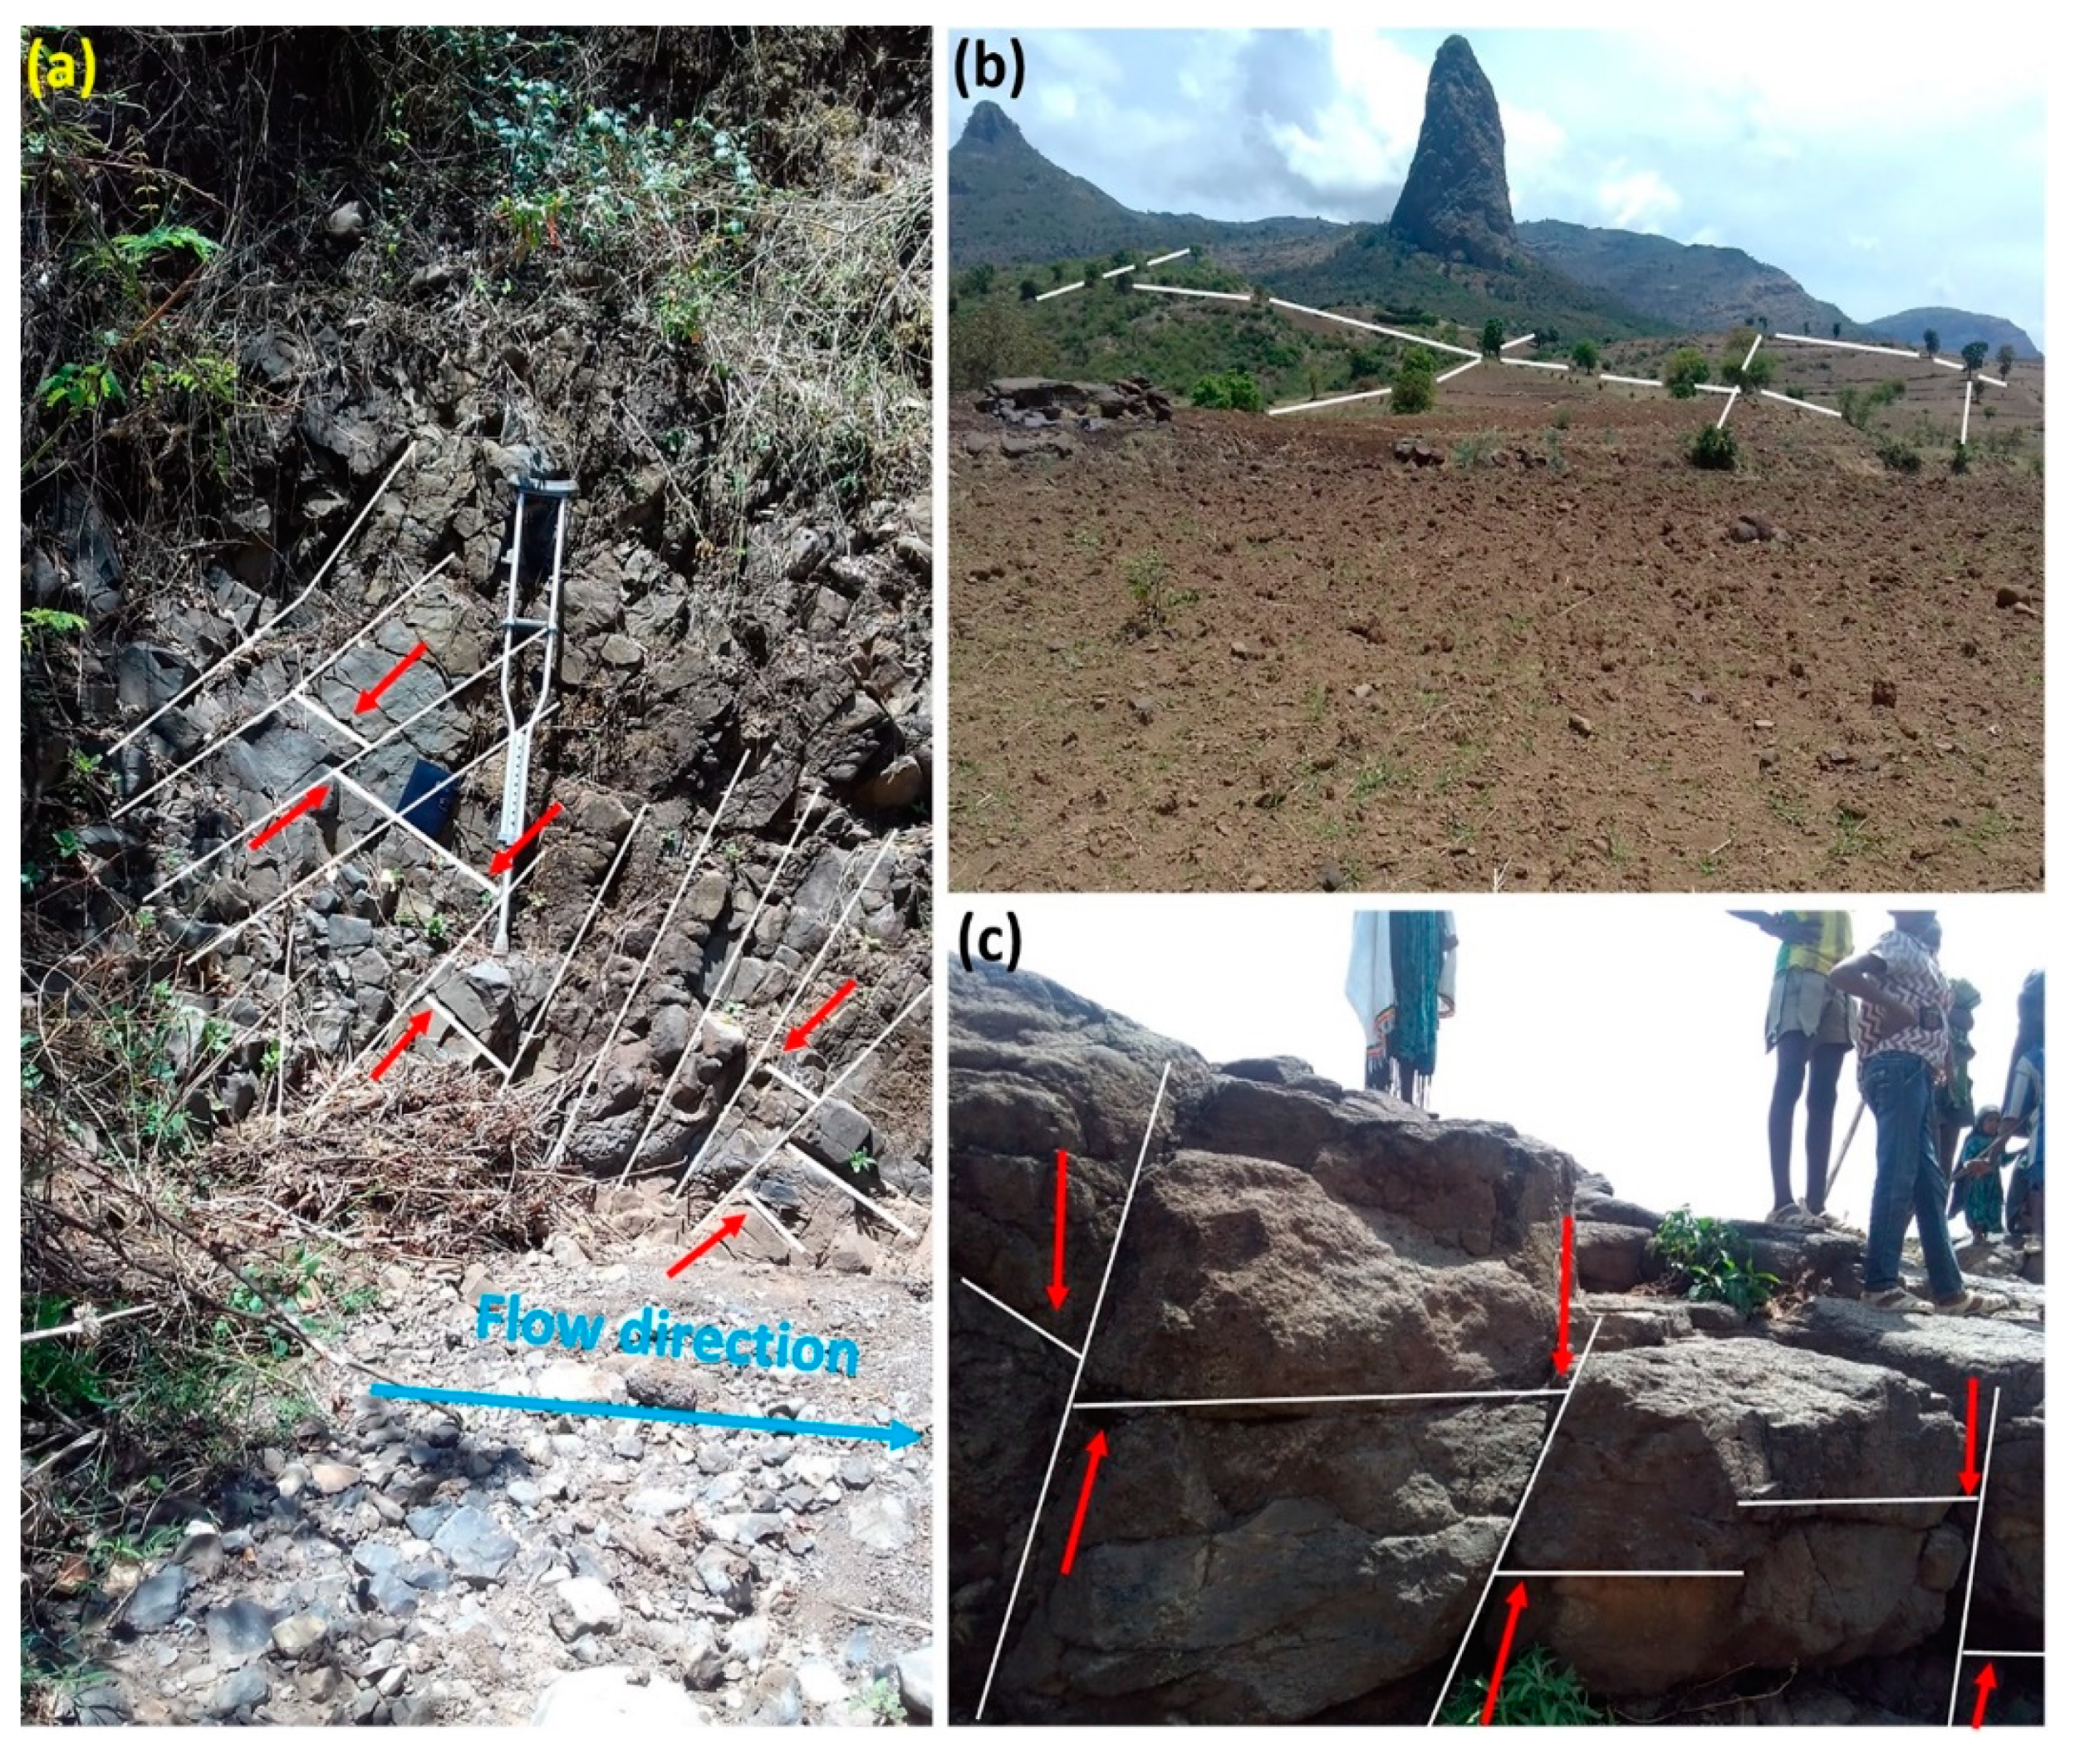
Geologically, the Northwestern Ethiopian Plateau is comprised of Cenozoic rocks of dominantly Tertiary trap (plateau) volcanics, minor Quaternary volcanics, and associated sediments. Flood basalts and associated rhyolites erupted between 31 and 29 Ma [68,69,70], roughly coeval with the initiation of the NE-directed extension in the southern Red Sea [71,72,73]. The Lake Tana basin is located in low tholeiitic Miocene-Pliocene basalt, with lesser amounts of felsites and nonmarine sedimentary rocks, and locally restricted basalt cinder cones and flows [70,74,75]. The eastern and northeastern parts of the Lake Tana basin, including the study area, are dominantly covered by Tarmaber Guassa formation; the thickness varies from approximately 500 m in the south to 1500 m in the north of Lake Tana. The landscape of the Tarmaber formation is characterized by hills, ridges, and mountains forming domical shapes and plugs [76,77]. The trachyte plugs in the northeast part of the Gomit watershed, visible in Figure 1, are typical features of this formation. The agricultural downstream area consists of alluvial deposits with clay, silt, sand, and gravel lenses (Figure 1).
The normal fault in an east-west direction, visible in the forested upstream watershed in Figure 1, is the major unit of Debre Tabor graben, which is one of the three grabens of the Lake Tana basin (Gondar, Debre Tabor, and Dengel Ber) [78]. The fault passes through the trachyte plug and connects shallow and deep geological environments [79] with rocks dipping perpendicular to the hillside (Figure 1).
2.2. Land and Water Management (LWM) Practices
Starting in 2006, LWM practices were incrementally implemented in the entire watershed (Table 1). The practices consisted of stone bunds, 50-cm-deep infiltration furrows with soil bunds downhill, improved river courses with arc weirs and check dams, and enclosures preventing animals from grazing (Figure 2, Table 1 and Figure A1 in Appendix A). In addition to natural generation, starting in 2006, several species of trees were planted mainly in the forested area and grasses on the bunds in both the forest and agricultural parts of the watershed (Figure 2d). Arc weirs were locally adapted conservation structures constructed across the river from masonry (Figure 2b). In Table 1, only the arc weirs and check dams are reported that were functional in 2015. The physical conservation practices and biological plantings were generally sustained except where free-grazing was permitted.
The areal extent of conservation practices increased from year to year up to the current values listed in Table 1 and Figure A1 in the Appendix A. In 2015, the downstream area consisted of 45% cropped agricultural lands, of which over 90% were conserved with a combination of 50-cm-deep infiltration furrows, soil bunds, and stone bunds; just under 20% was bush and shrubland, two thirds with conservation practices; 8% was grassland located on areas with a high water table in rain phase; the remaining quarter of the downstream part consisted of a village with widely spaced houses and farmsteads with a few eucalyptus trees (Table 1).
In 2015, the upper part of the watershed was 77% bush and shrubland, mainly regenerated by excluding cattle from grazing and replanting trees (Figure 2d, Table 1). A small portion had structural conservation practices to promote infiltration; 11% was natural forest, and 11% was agricultural land. Our 2015 survey indicated that the vegetation in the forested part of the watershed consisted of Sesbania grandiflora, Pigeon pea, Gravilia robusta, Jacaranda mimosifolia, Elephant grass, and Vetiver grass as exotic plants; Rhamnus prinoides, Salix mucronata, Dodonaea angustifolia, Croton macrostachyus, Brown’s myrobalan, Agave sisalana, acacia, Olea Africana, Juniperus procera, Jastropha, Cordia Africana, Ruinex nervosus, and Podocarpus falcatus as indigenous plants.
2.3. Method of Data Collection and Analysis
Rainfall: Rainfall was measured for three years between 2015 and 2017 with one automatic tipping bucket rain gauge (made by RainWise Inc, recording precipitation at 5-min intervals with an accuracy of 2% at 3.8 cm h−1) and two manual rain gauges located within the watershed (Figure 1). The automatic and one of the manual rain gauges were located on the east side of the watershed; the other manual rain gauge was at the west side at the same elevation (Figure 1). Two manual rain gauges were read each morning at 9 am. Although differences in rainfall were expected due to orographic effects, the highest elevations were not inhabited, and could therefore not be gauged because guards were not available to safeguard the equipment. The daily precipitation has been provided in the Supplemental Material Table S2.
Infiltration: A total of 18 infiltration measurements were taken in duplicate at three landscape positions (i.e., upper, mid, and foot slope) for three land uses in August and early September 2015. Since the sites were not accessible by car and it was difficult to carry sufficient water, a single-ring infiltrometer (30 cm diameter) was used to measure the steady-state infiltration rates. The ring was inserted and hammered to a depth of 10 cm after removing plant residues. Infiltrated water depth was measured at constant time intervals (5 min) by adding water into the ring. A ruler was used to read the water depth in the infiltrometer.
Extraction of geological structures: Detailed geological faults and lineaments in the Gomit watershed were extracted using PCI Geomatica 2018 software employing edge detection, thresholding, and curve extraction steps [80]. Input data consisted of a 1:250,000 geological map [81] and a digital elevation model (DEM) with a resolution of 30 m and band 8 of the Landsat-8 image (0.50–0.68 micrometers); Eighth band of Landsat-8 (OLI) is useful for edge detection [82]. Verification of faults and lineaments were made by field visits. During these visits, the general trend of discontinuities (strike and deep) on the exposed rock units was measured.
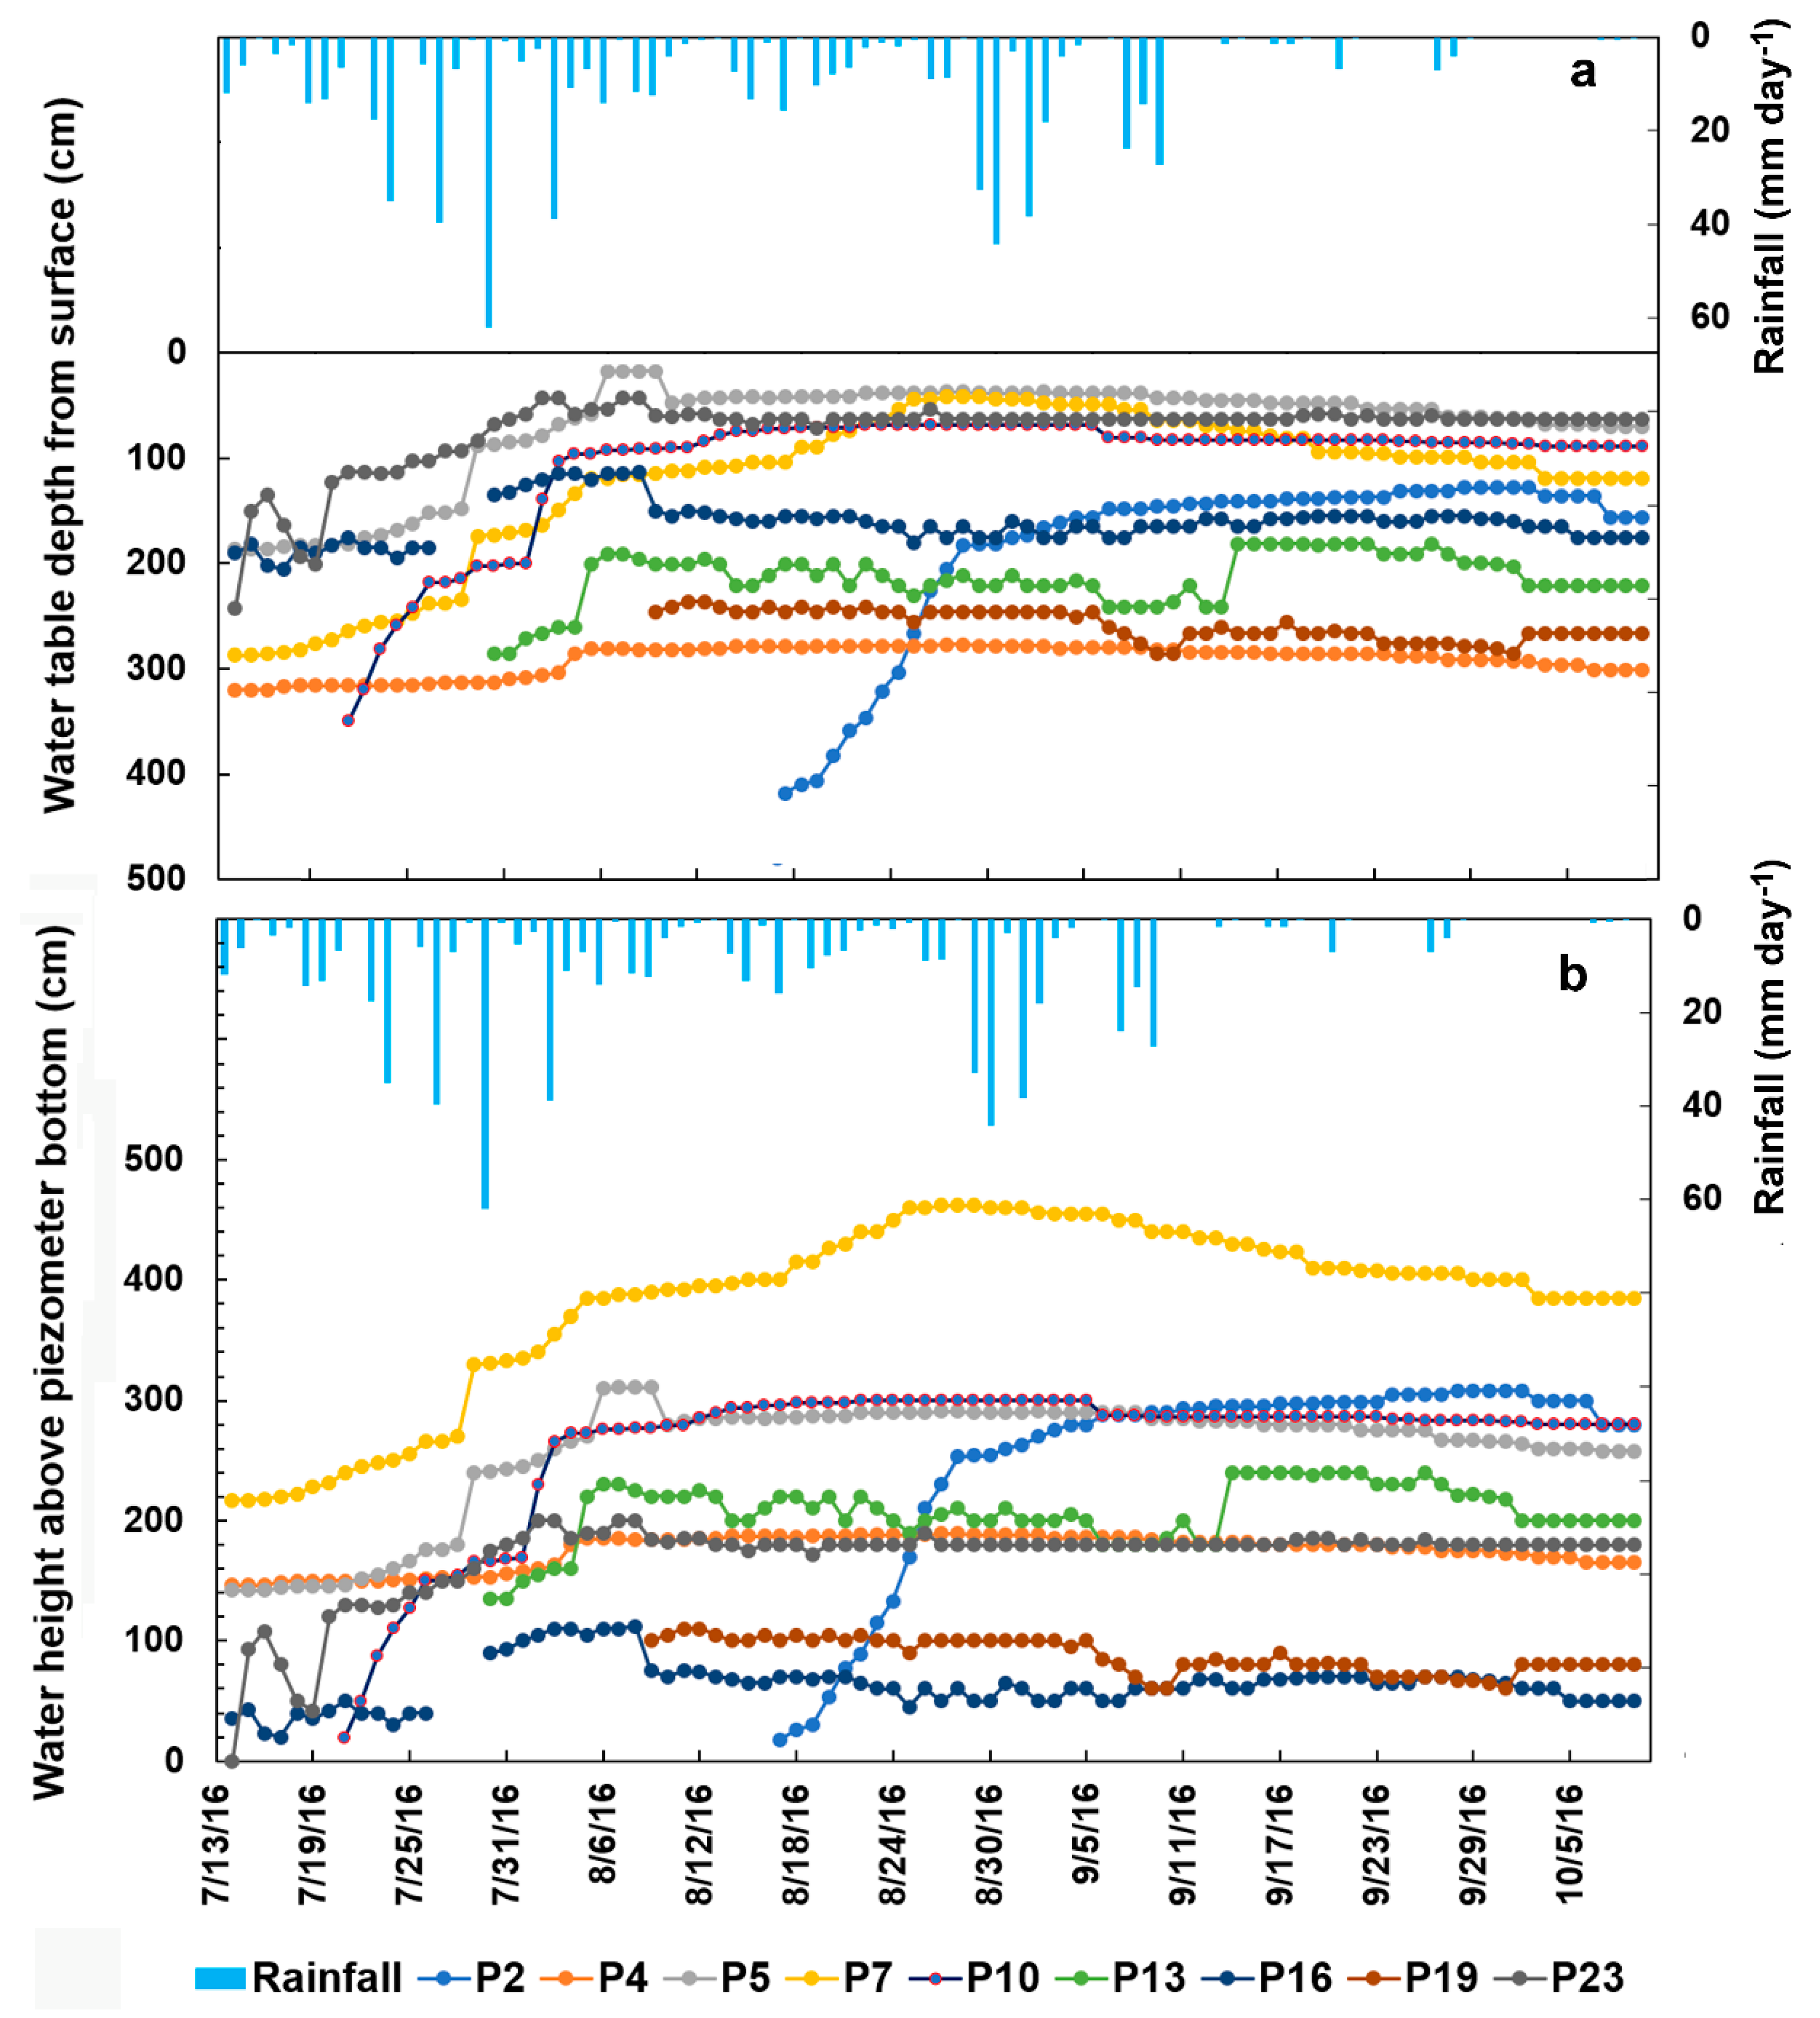
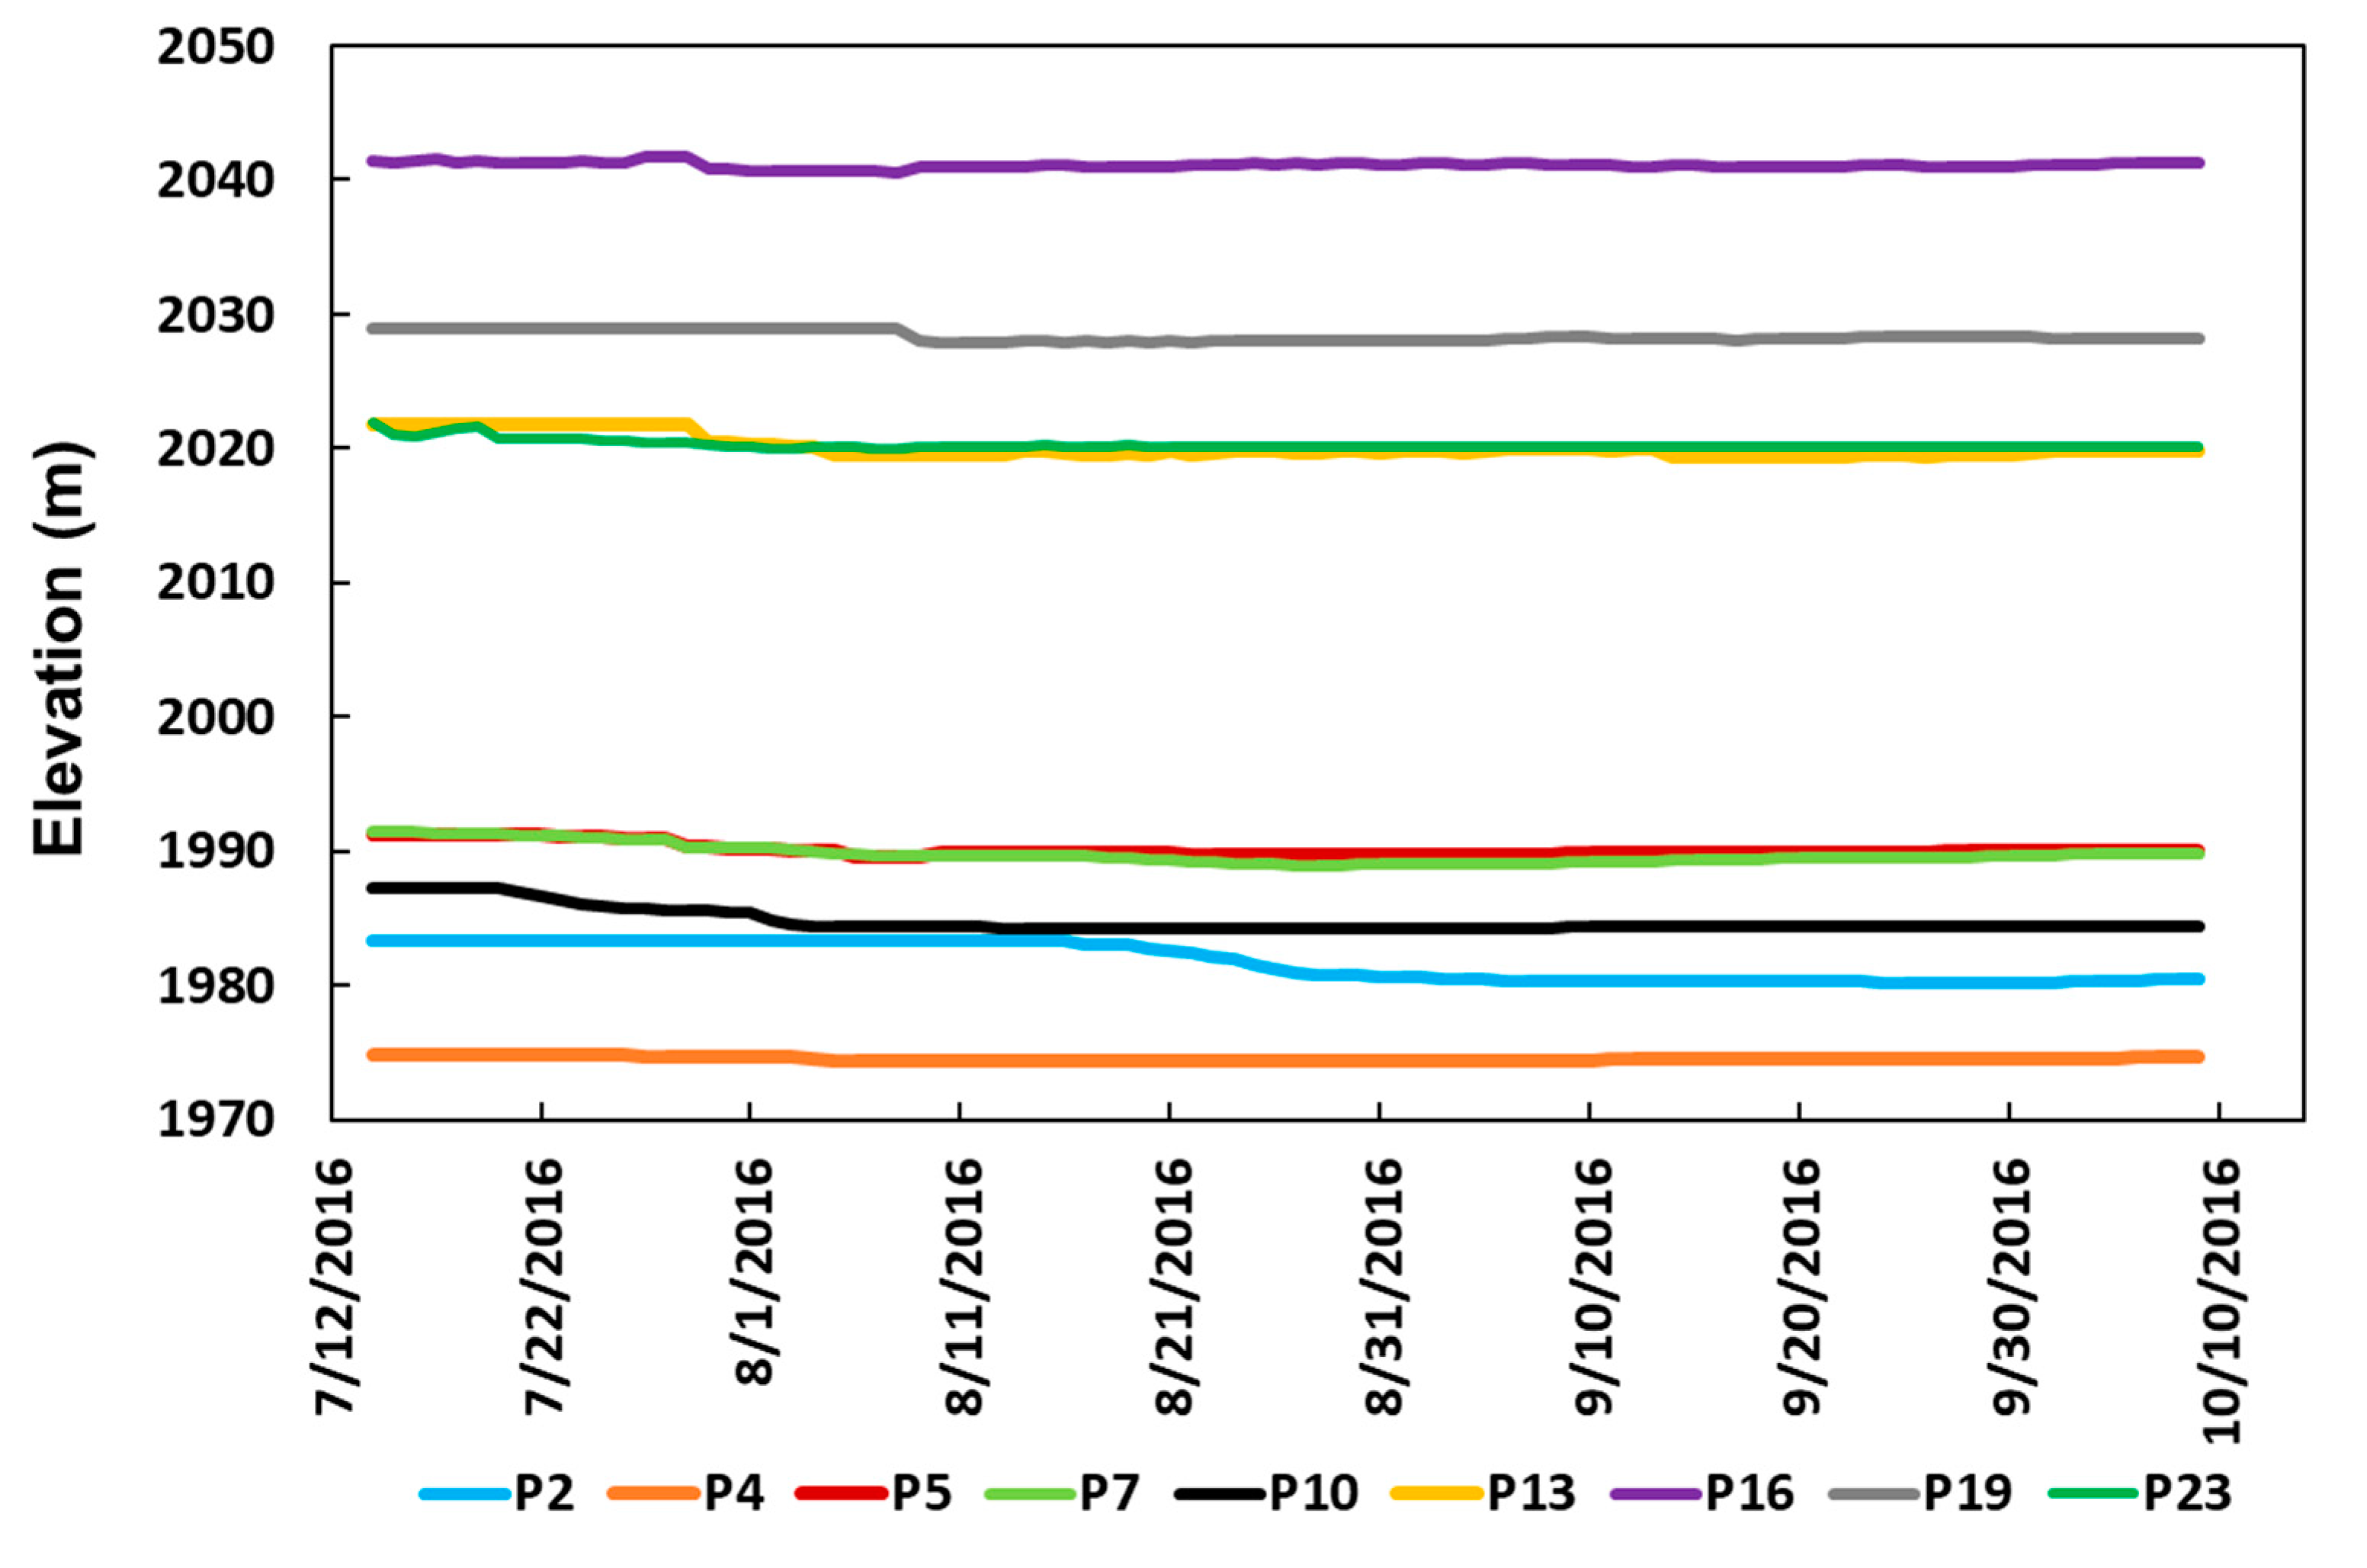
Perched shallow groundwater levels: In 2016, 23 piezometers were installed on the upslope, midslope, and downslope positions to monitor fluctuations in the shallow groundwater table (Figure 1). Piezometers were made from 5-cm-diameter PVC pipes with the bottom 30 cm screened. The screened part was wrapped with filter fabric to prevent intrusion of silt and sand. The upper ends of the piezometer were capped to avoid rainfall entering the piezometer. The deepest piezometer was 504 cm. The depth to the water table was manually measured two times per day when the groundwater table was in the piezometer range. From the 23 installed piezometers, 9 recorded the existence of the water table during the rain phase, six (P4, P5, P7, P10, P16, and P23) were situated at the downslope, and three (P2, P13, and P19) were at the midslope (Figure 1c, Table A2 in the Appendix A). Ground water table observations are listed in the Supplementary Material Table S2.
Runoff: Two triangular weirs with step-wise increasing sites following the bank of the rivers were installed. The bottom steps had a small v-notch structure. Weir-1 measured the discharge at the outlet of the entire watershed and Weir-2 that at the outlet of the upper watershed (Figure 1). Between 2015 and 2017, measurements were taken during storms (both day and night) by local observers. Manual measurements of flow depth and velocity started when the water in the stream became turbid. Both water depth and surface water velocity at the two gauging sites were recorded at 20-min intervals in 2015 and 10-min intervals in 2016 and 2017. Measurements were ended when the water became clear. Finally, water depth and velocity were measured at 6:00 a.m. and 6:00 p.m.
The surface velocity was determined with a float method [83]. The float method is well suited for smaller streams like Gomit due to its operational ease and cost-effectiveness. The float was released 9 m and 16 m upstream from each weir each time a height measurement was made. The time required for the float to reach the weir was recorded. The product of two thirds of the float velocity and the wetted cross-sectional area was used to calculate the discharge.
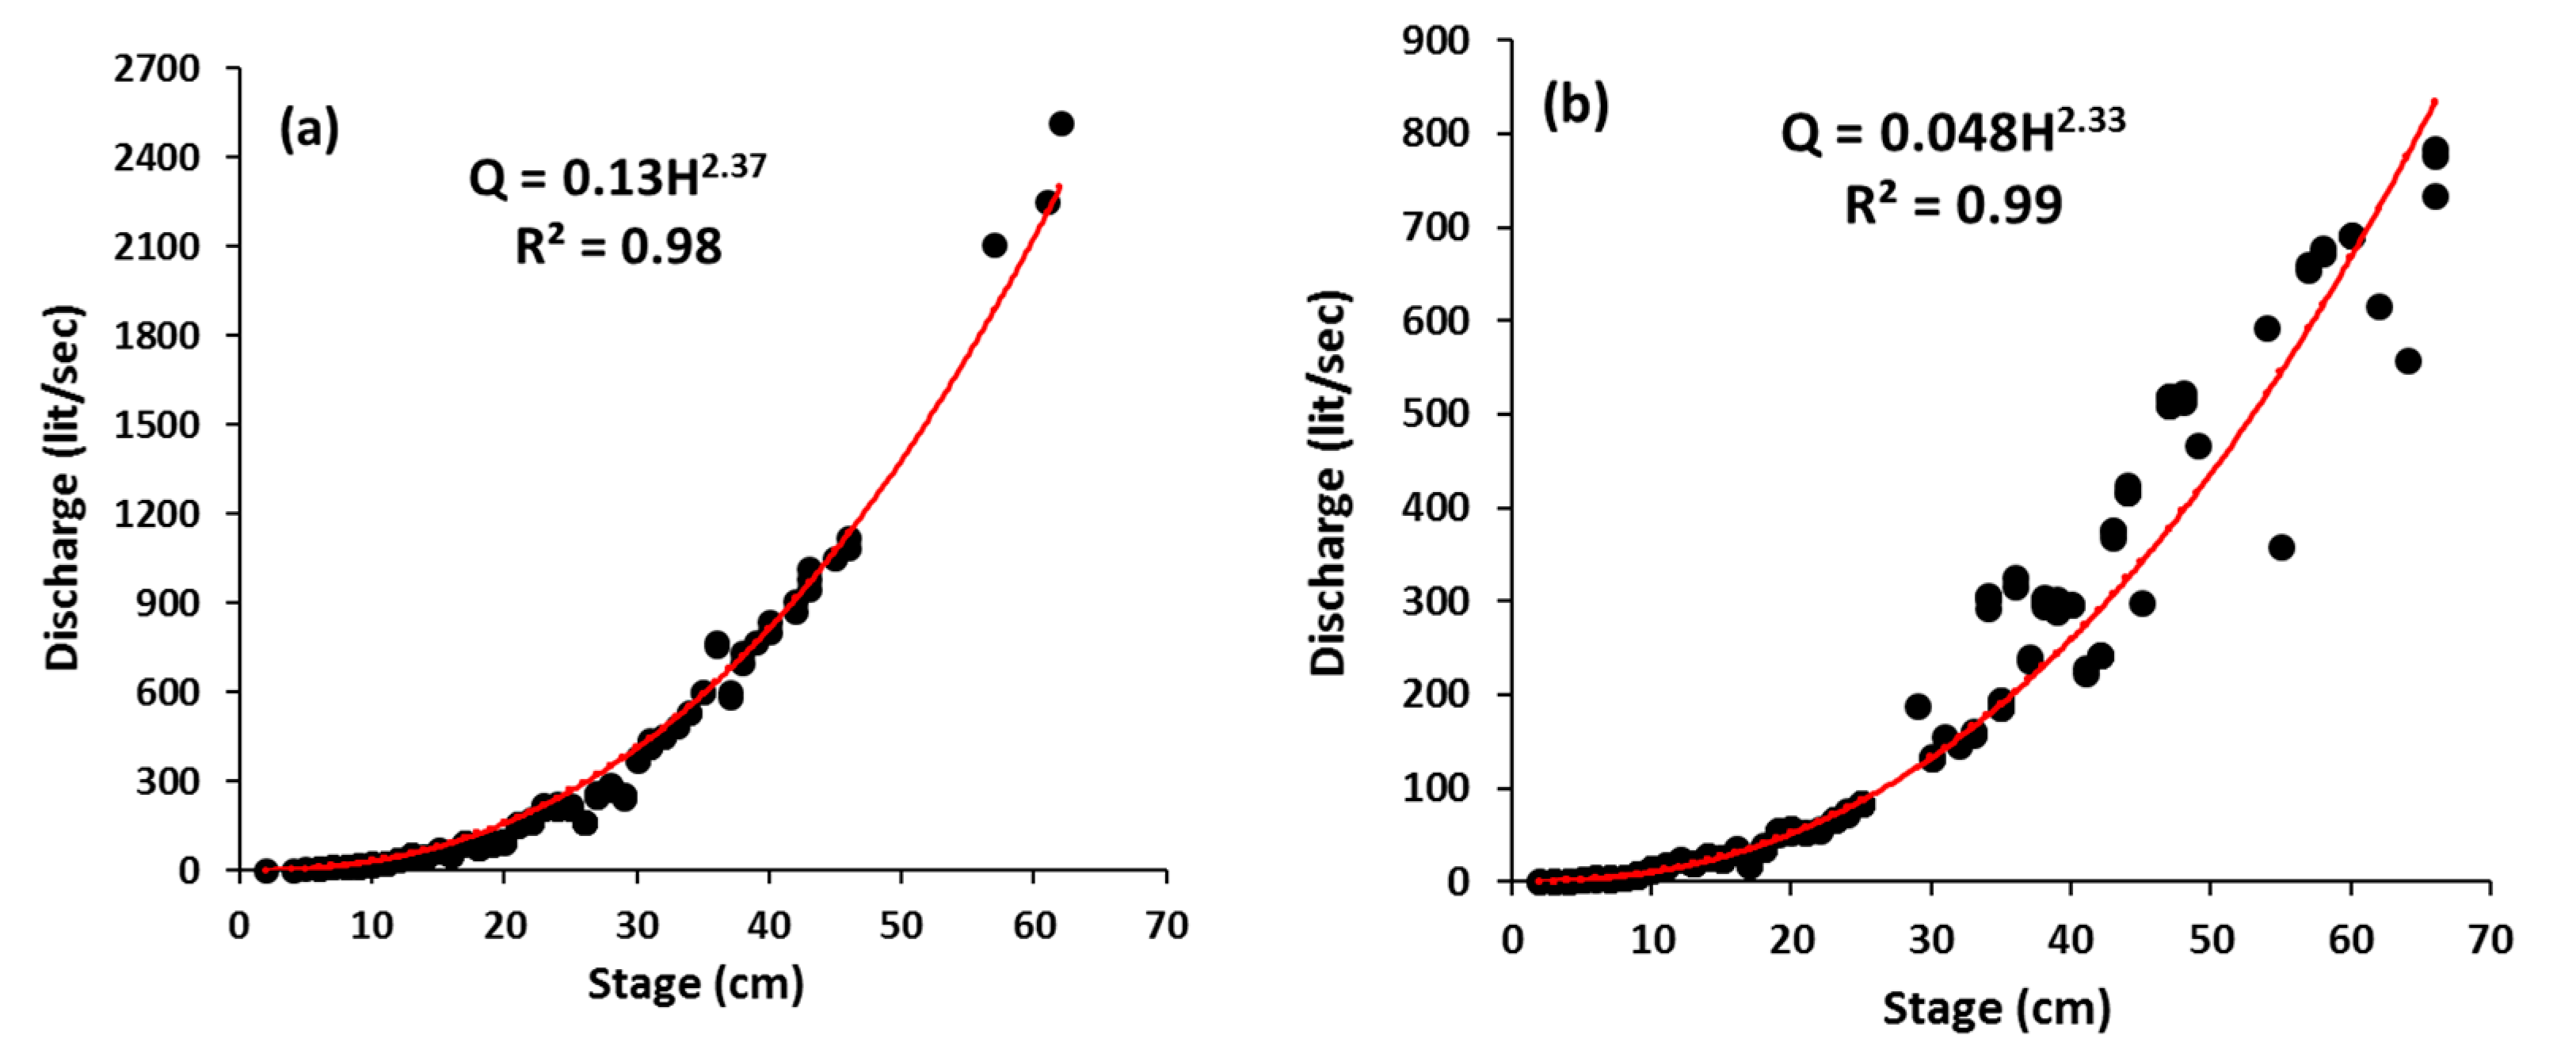
For each gauging site, a best-fit rating curve was developed using all 20- and 10-min flow depths and mean discharge measurements. A power equation was fitted to the flow depth and storm discharge. See Figure A3 in Appendix A for stage-discharge rating curves and Table S1 for the daily discharge data. The calculated discharges were summed to obtain daily and annual runoff data. The runoff coefficient was calculated by dividing the runoff depth by the rainfall over a fixed period.
Sediment concentrations: One-liter water samples were taken at 20-min intervals in 2015 and 10-min intervals in 2016 and 2017 at the two gauging stations for sediment concentration analyses. In the field, the samples were kept in a room prepared for filtration. Sampling during the storm period started when the flowing water looked turbid, and the sampling continued until the water became clear. Each sample was filtered using a Whatman filter paper with a pore opening of 2.5 μm [31]. The filtered sediment was oven-dried and weighed [31]. The sediment load during each interval was obtained as the product of the average discharge during the interval and the sediment concentration. The total sediment load was calculated as the sum of interval sediment loads. The runoff and sediment load for the agricultural part was determined by taking the difference between the forested and the entire watershed. Average sediment concentrations for storm events were determined by dividing the total sediment load by the total storm runoff during that storm period.
Baseflow separation: The baseflow contribution of the watershed was computed by separating baseflow from the surface runoff using an automated method of baseflow estimation. The digital filter technique used in this study was developed by Nathan and McMahon [83]. The base flow separation procedure is based upon a recursive digital filter which is commonly used in signal analysis and processing [84]. The technique has no true physical basis, but it does provide an objective and repeatable estimate of an index of base flow that is easily automated [83]. The equation of the filter is:
where is the filtered direct runoff on day t, is the observed stream discharge on day t, is the baseflow on day t, and is the filter parameter. To obtain realistic results, a value of 0.925 was employed by Nathan and McMahon [83] and Arnold et al. [85]. The filter can be passed over the streamflow several times [86]. Based on the study by Partington et al. [87], the backward pass was selected for the separation of the baseflow from the simulated stream discharge.
Statistical analysis: A paired t-test was used to compare two population means of infiltration rates from the three land slopes (bottom, mid and up-slope) and land use types using an Excel spreadsheet. In addition, descriptive statistical methods in Excel like maximum, minimum, sum, mean, and median were used to compare the results. Probability of exceedance (PE) was used to compare the steady-state infiltration rate and rainfall intensity.
3. Results
3.1. Rainfall
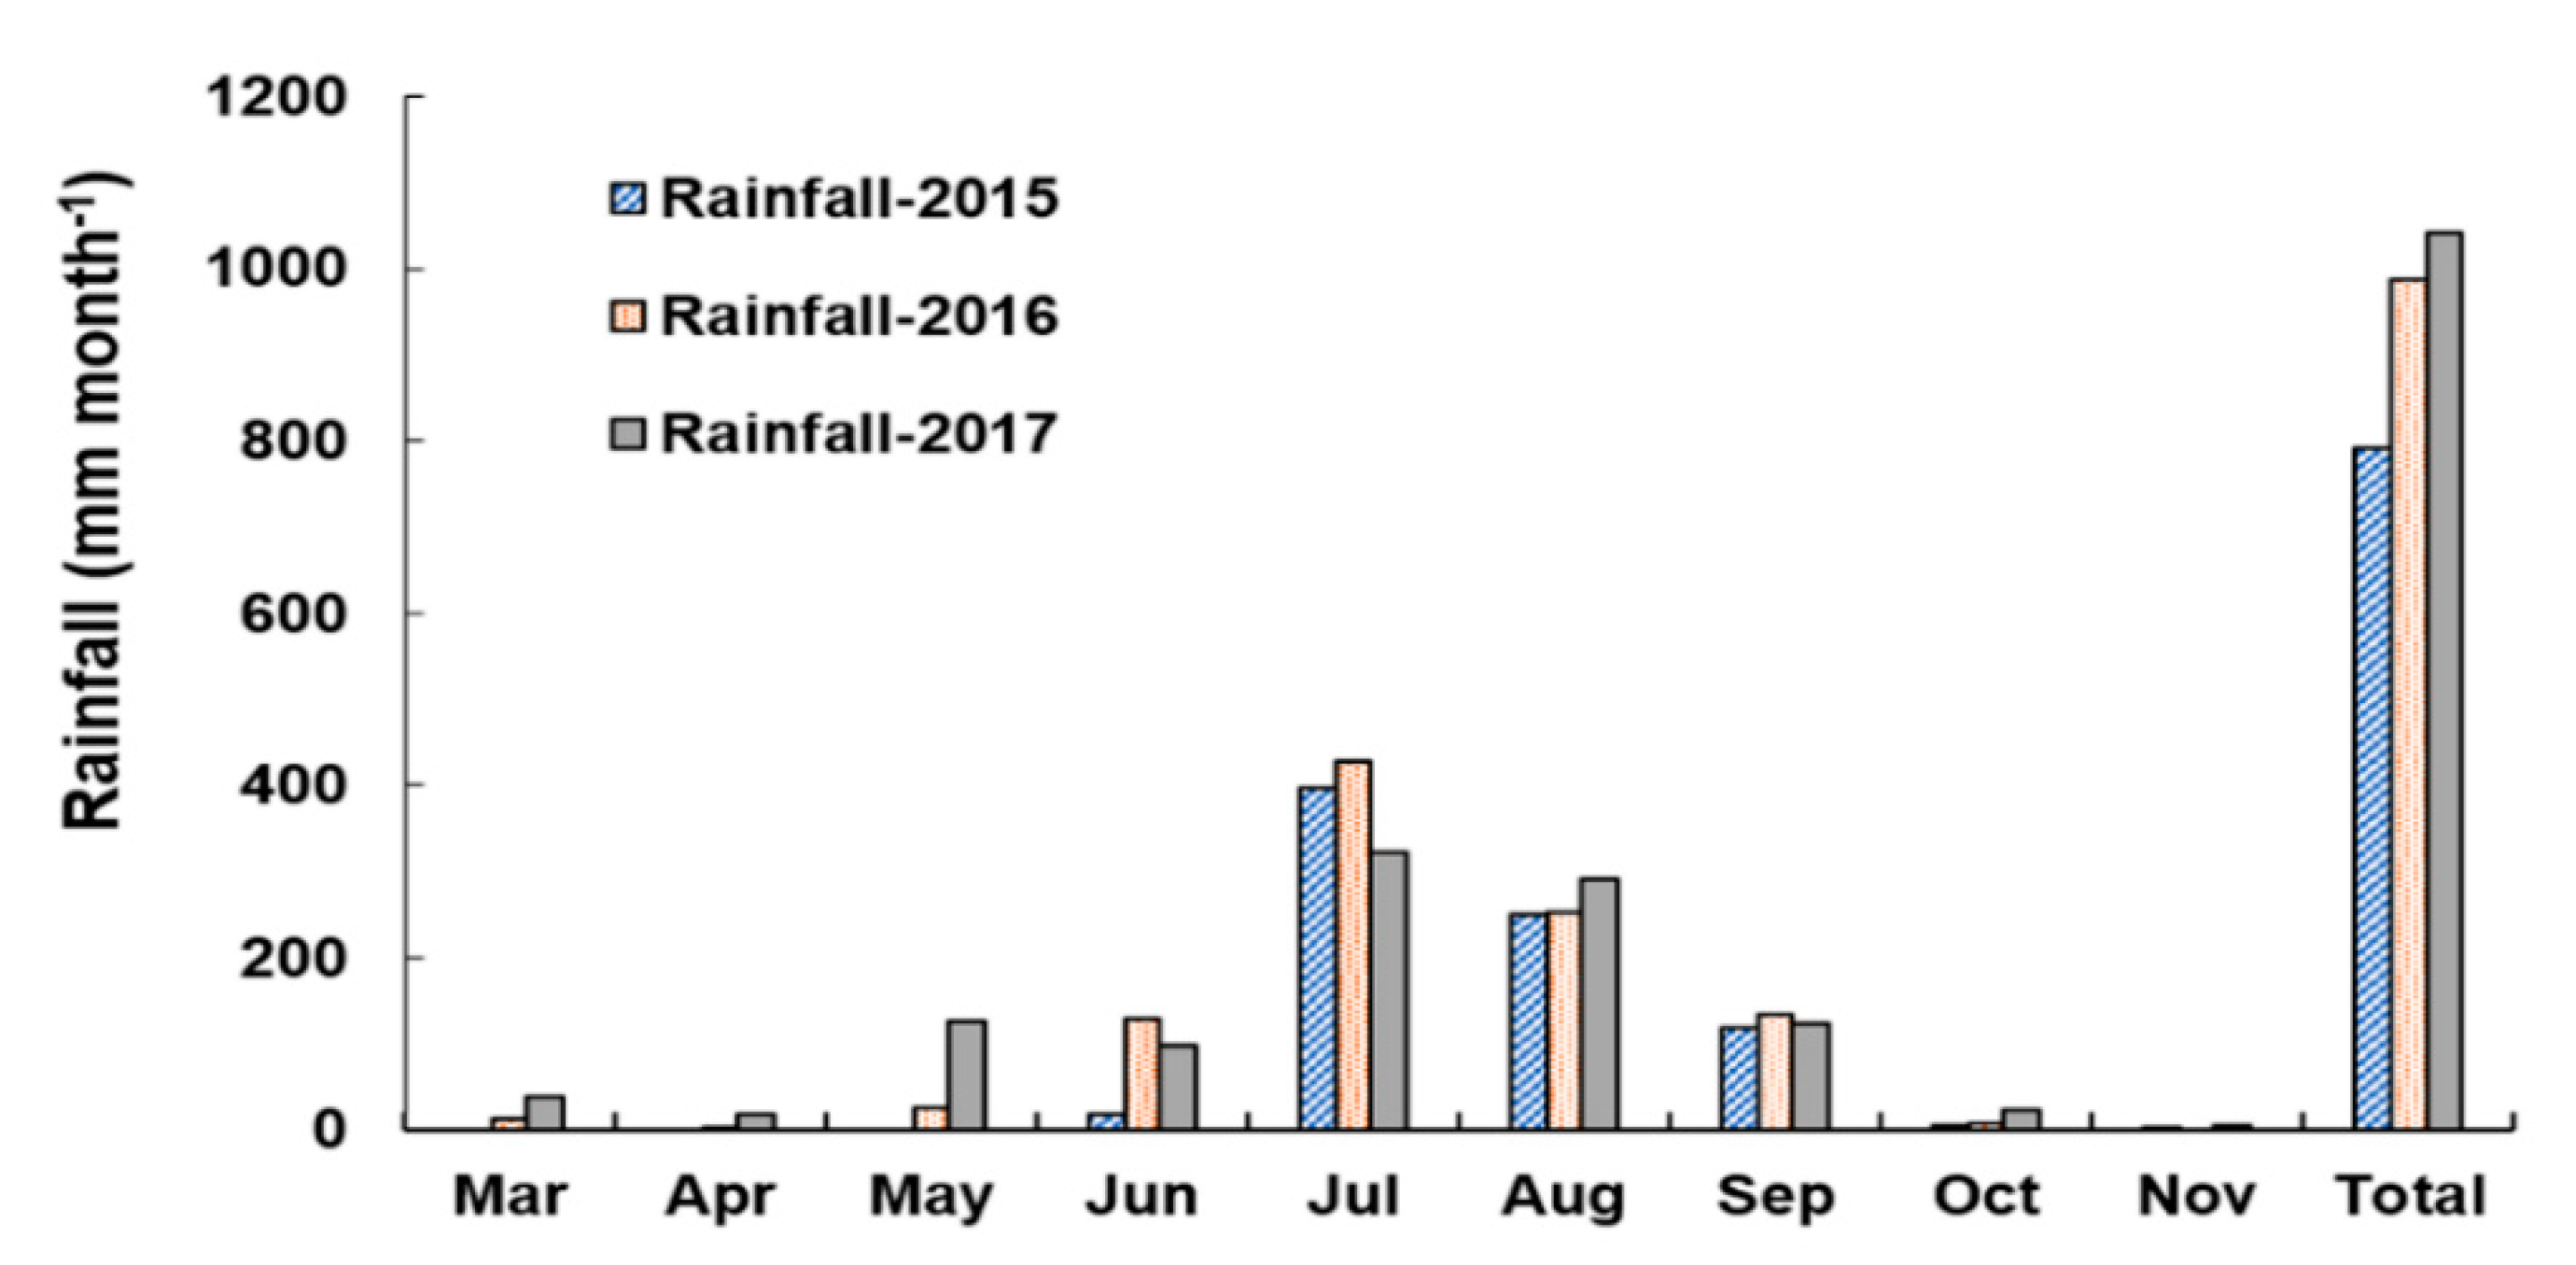
The annual rainfall recorded in Gomit was 894 mm in 2015, 988 mm in 2016, and 1042 mm in 2017 (Figure 3). In the three years, the annual rainfall was less than the long-term mean (1997–2015) rainfall of 1265 mm. Especially the first year was dry. The monthly rainfall patterns in July, August, and September (constituting the main part of the rain phase) were nearly the same between the three years, with July being the wettest month (Figure 3). The main difference in total rainfall was caused by the start of the rain phase which was late June in 2015 and early May in 2017. Less than 50 mm of rain fell during the dry phase each year.
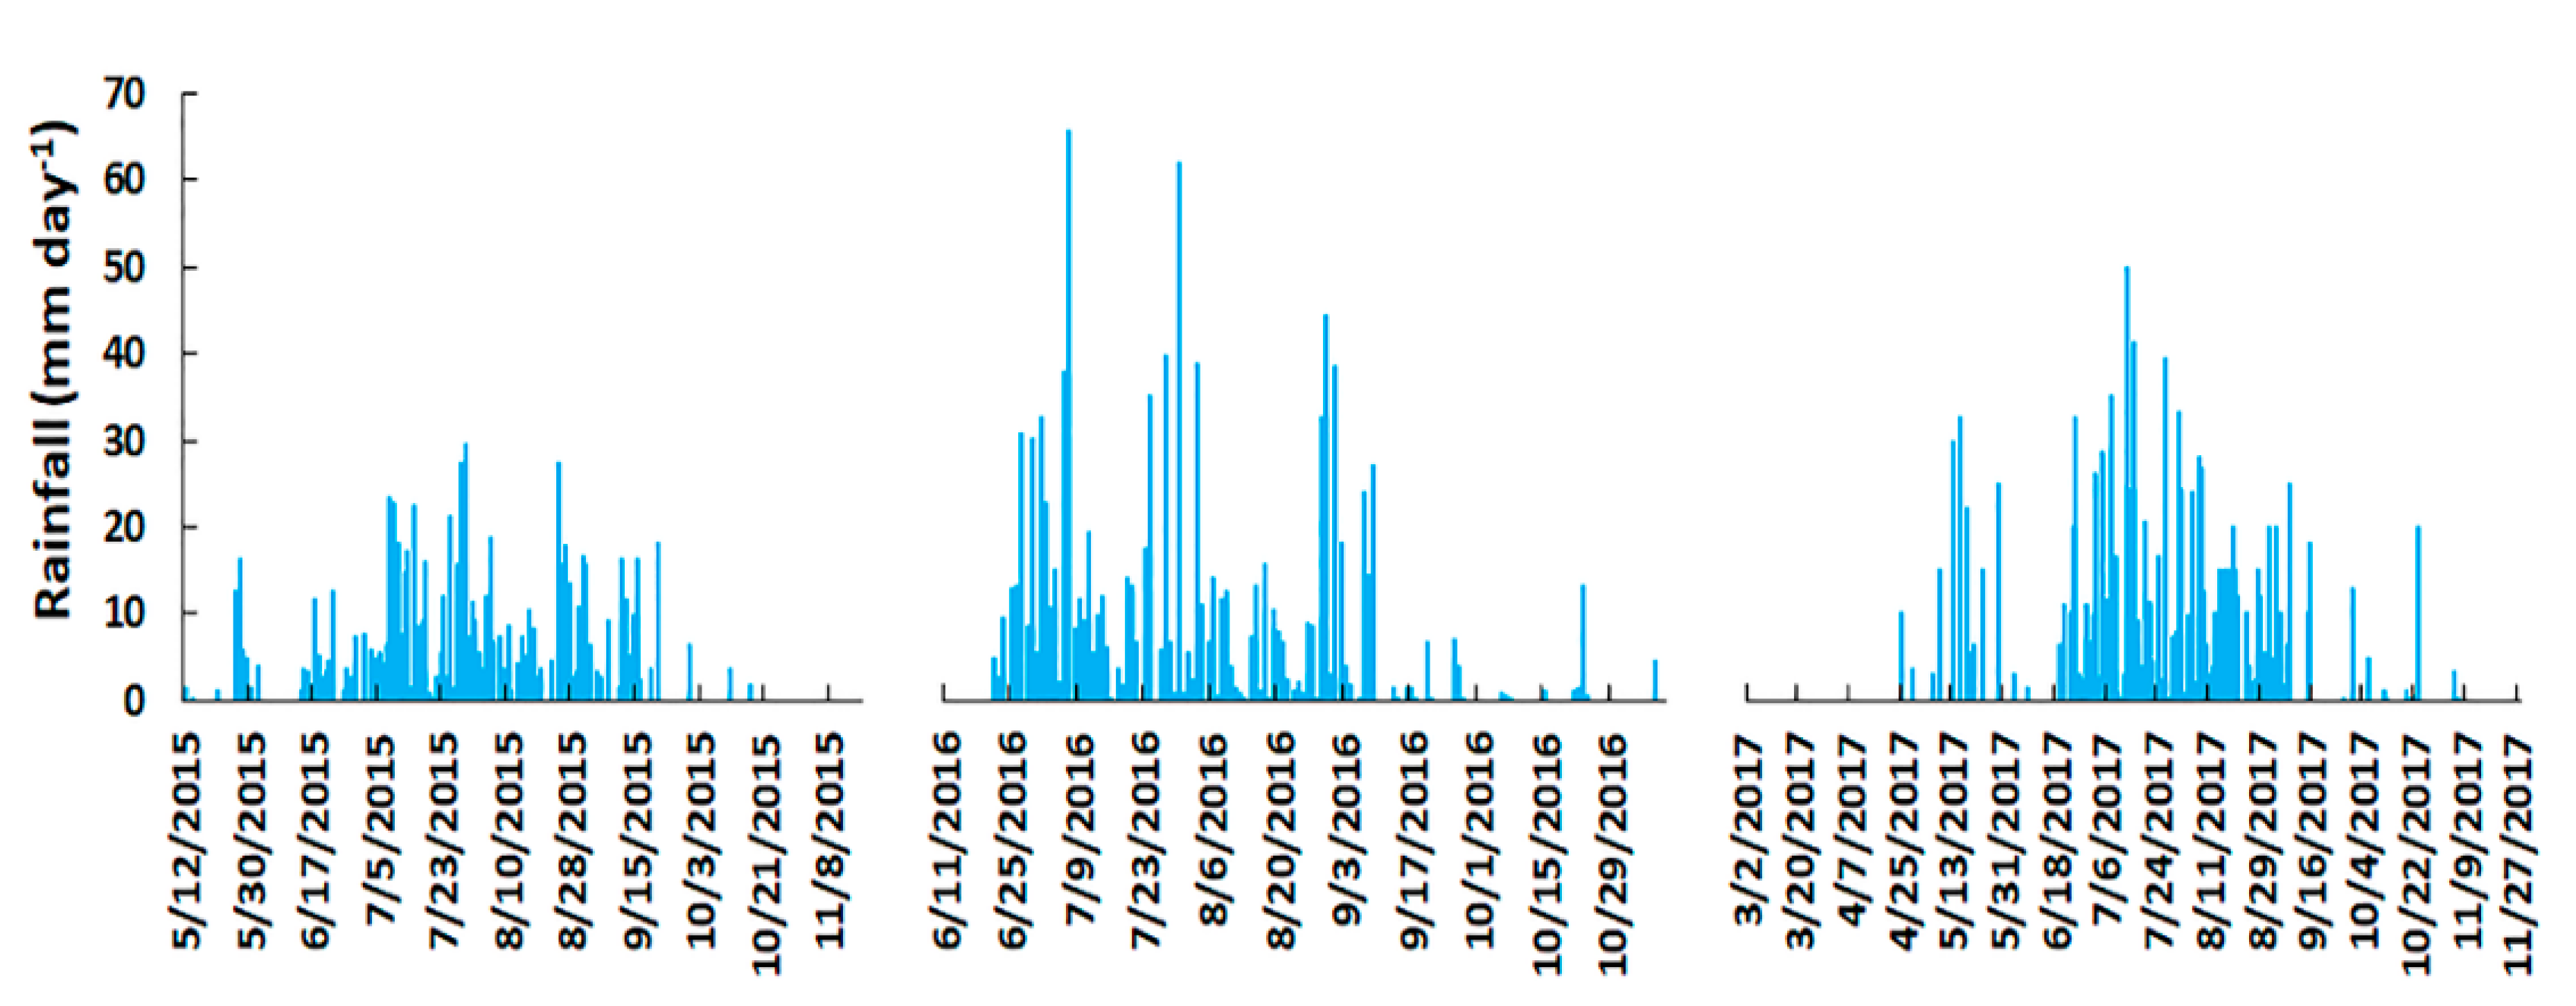
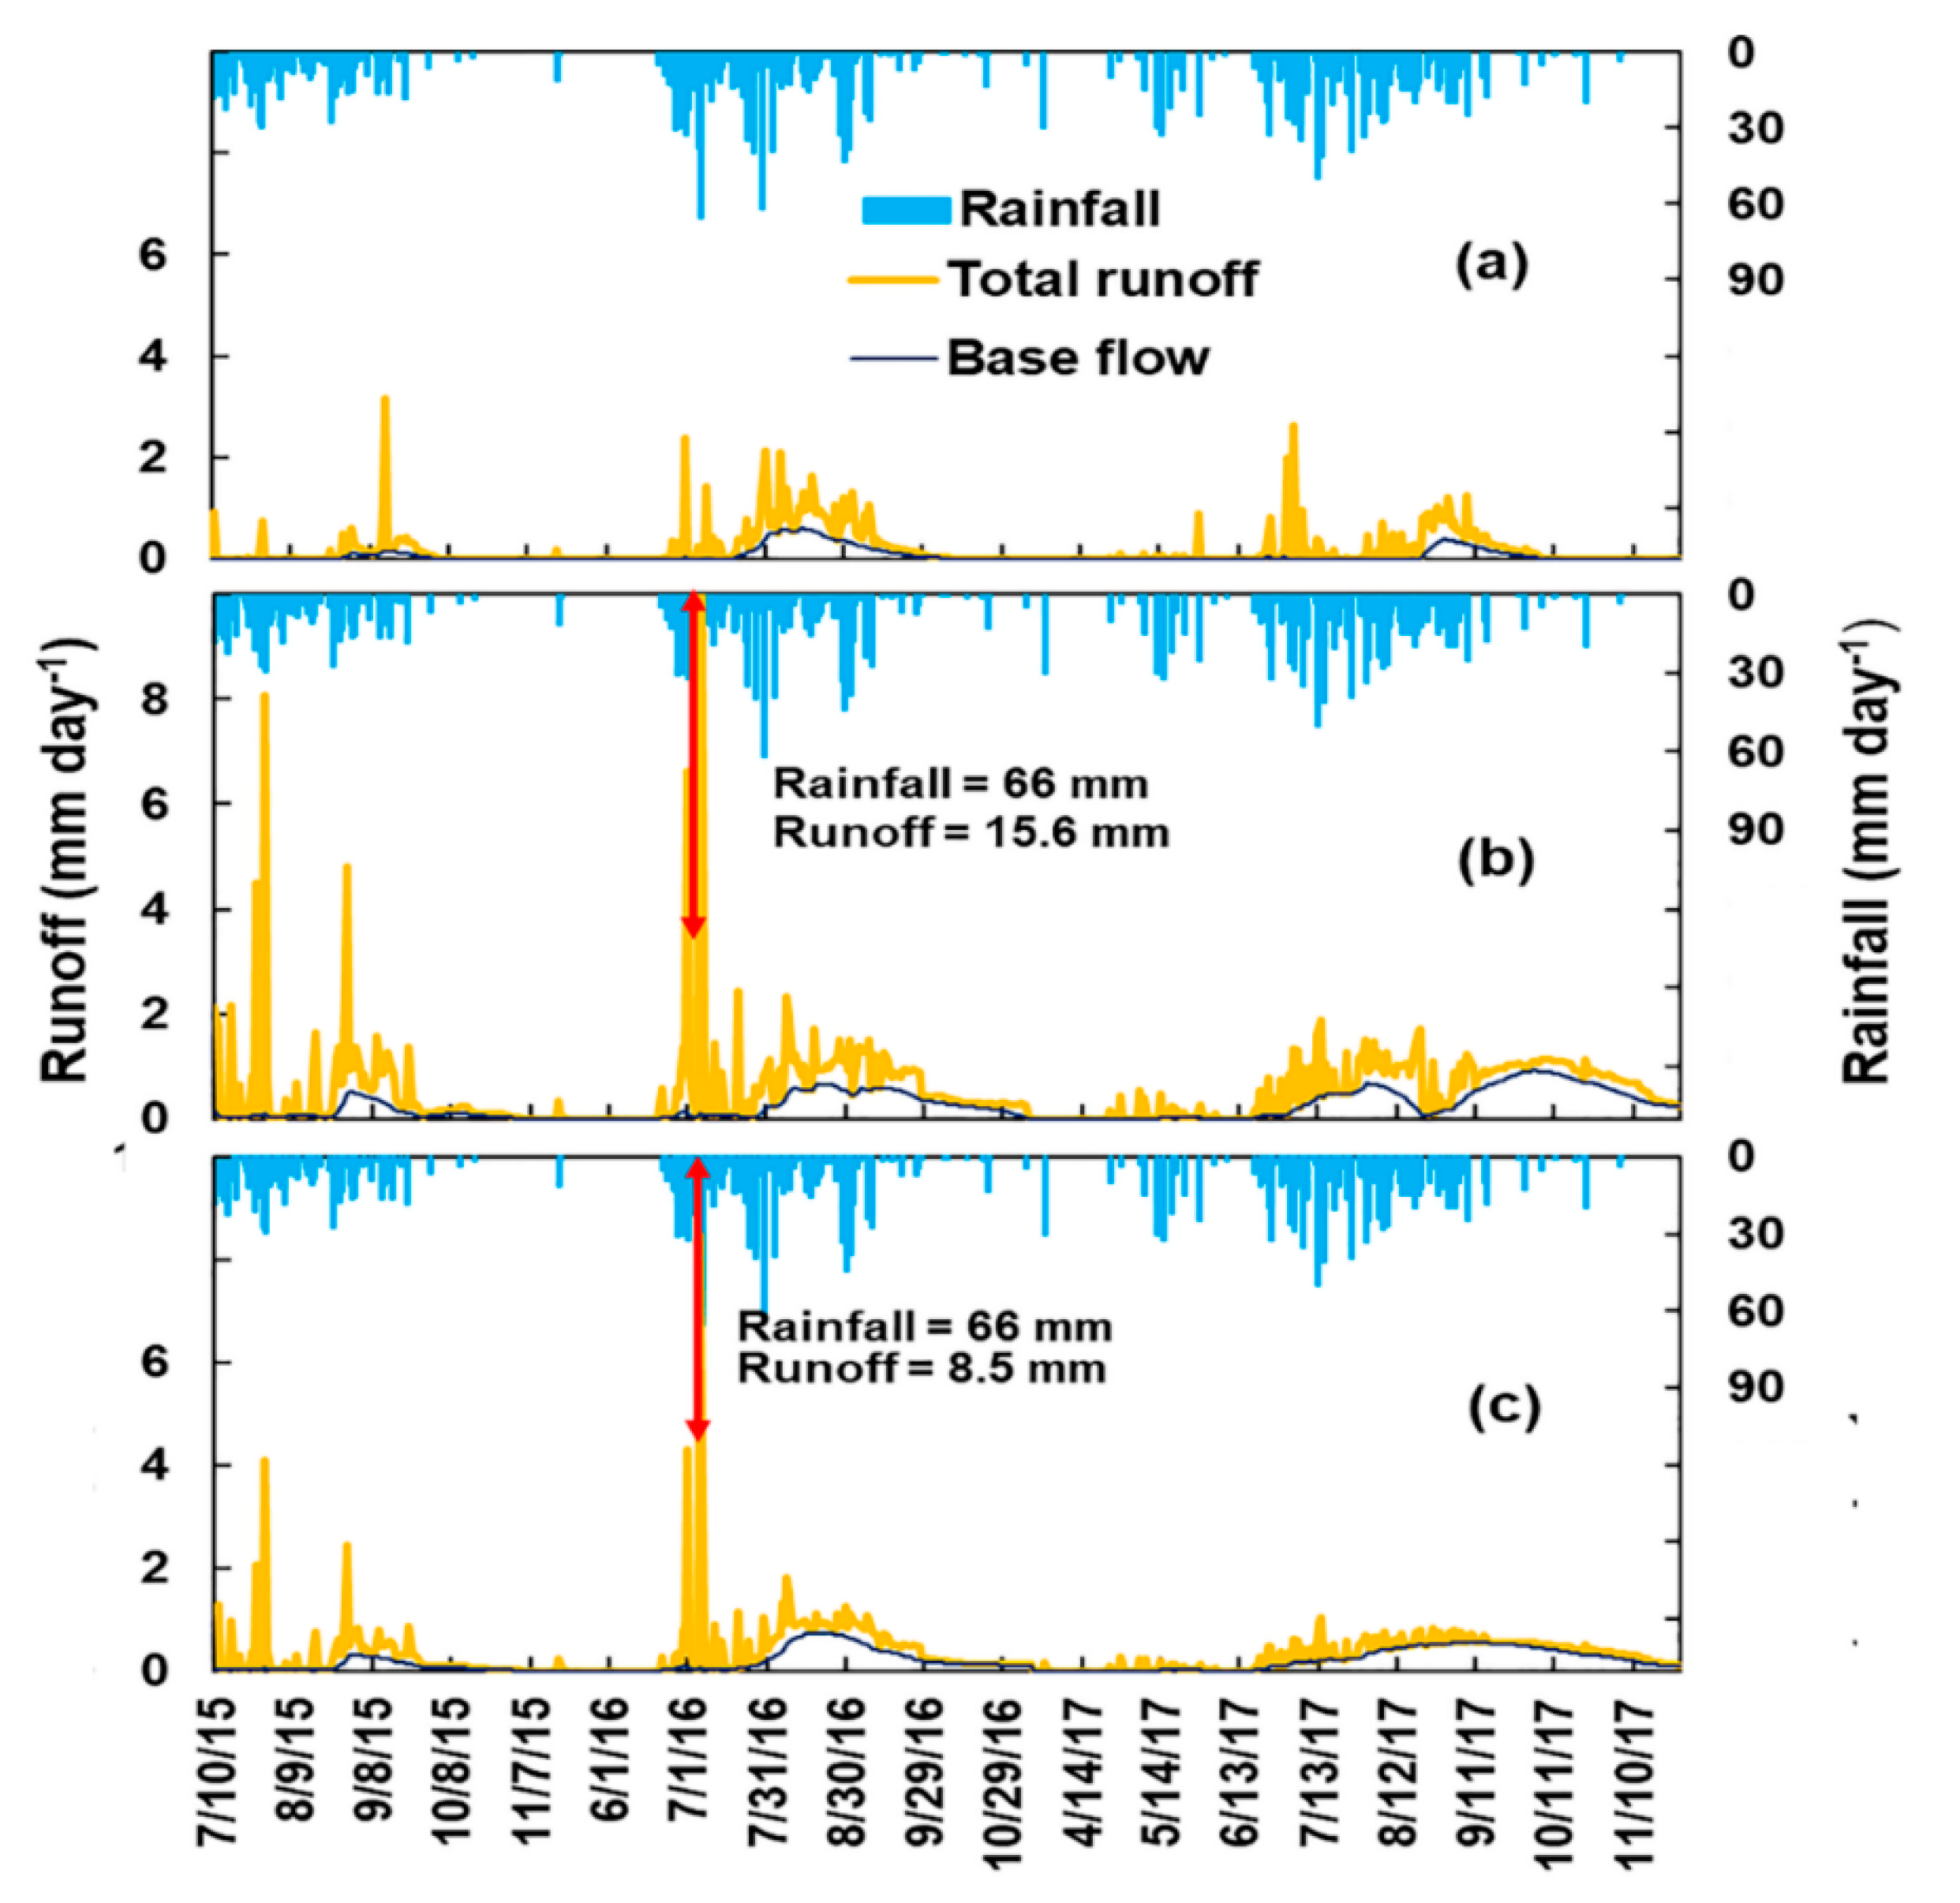
Of the three years, the maximum daily rainfall, i.e., 66 mm, occurred on 7 July 2016 (Figure 4). The maximum rainfall in a single hour was 41 mm; this occurred on 24 July 2016. The greatest 5-min intensity was 12.2 mm, recorded on 1 September 2016. The cumulative 5-min rainfall is plotted in Appendix A, Figure A4, and daily rainfall is plotted in Figure 4. In 2015, rainfall per day was relatively low. In July 2016, two large storms of more than 60 mm d−1 were recorded. In 2017, rainfall started early and stopped at the beginning of June for 15 days.
3.2. Infiltration and Rainfall Intensity
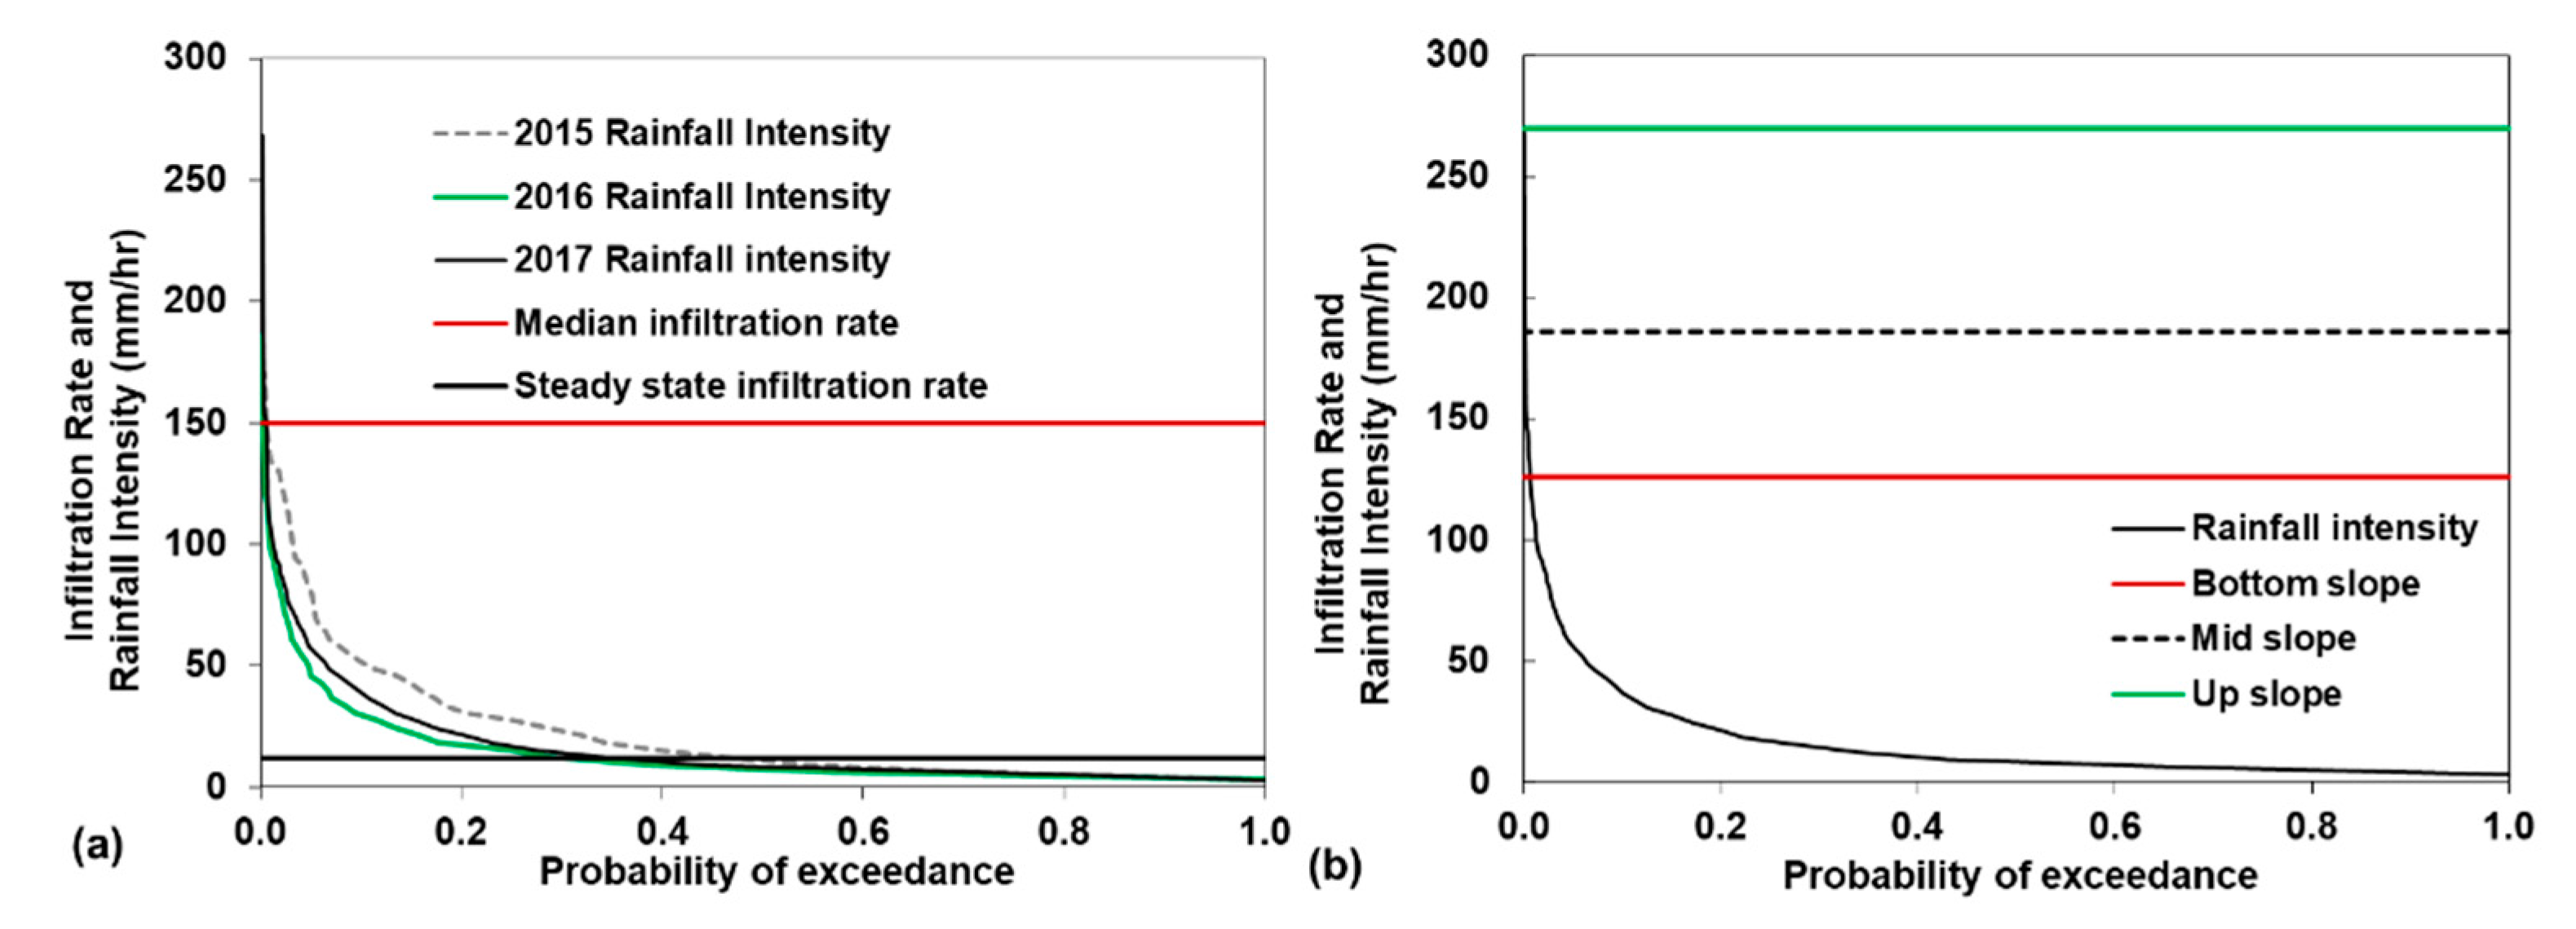
The steady-state median ranged from 12 to 468 mm h−1 (Table 2). The average infiltration rate for the downslope was 98 mm h−1, which was statistically less than either the 217 mm h−1 for the midslope or the 270 mm h−1 for the upslope (Table 2). The rates between upslope and midslope were not statistically different. The probability of exceedance (PE) of the average steady-state infiltration rate by the rainfall intensity was 9% for the downslope and less than 1% for midslope and upslope areas. The minimum infiltration rate was 12 mm h−1, with an exceedance probability of 35% (Table 2). It was recorded on the grassland at the downslope where the soil was saturated from the middle to the end of the rain phase at the time that measurements were taken. The high water table limited the infiltration because water could not be stored in the soil. In addition, the infiltration rate for the teff crop was limited due to tilling the field five times. For this crop, the infiltration rate was the least downslope with an exceedance probability of 18%. The maximum rate of infiltration of almost 5 m h−1 was observed on the maize plot up- and mid-slope, as shown in Table 2. Additional details are provided in Figure A4 in Appendix A.
3.3. Geology
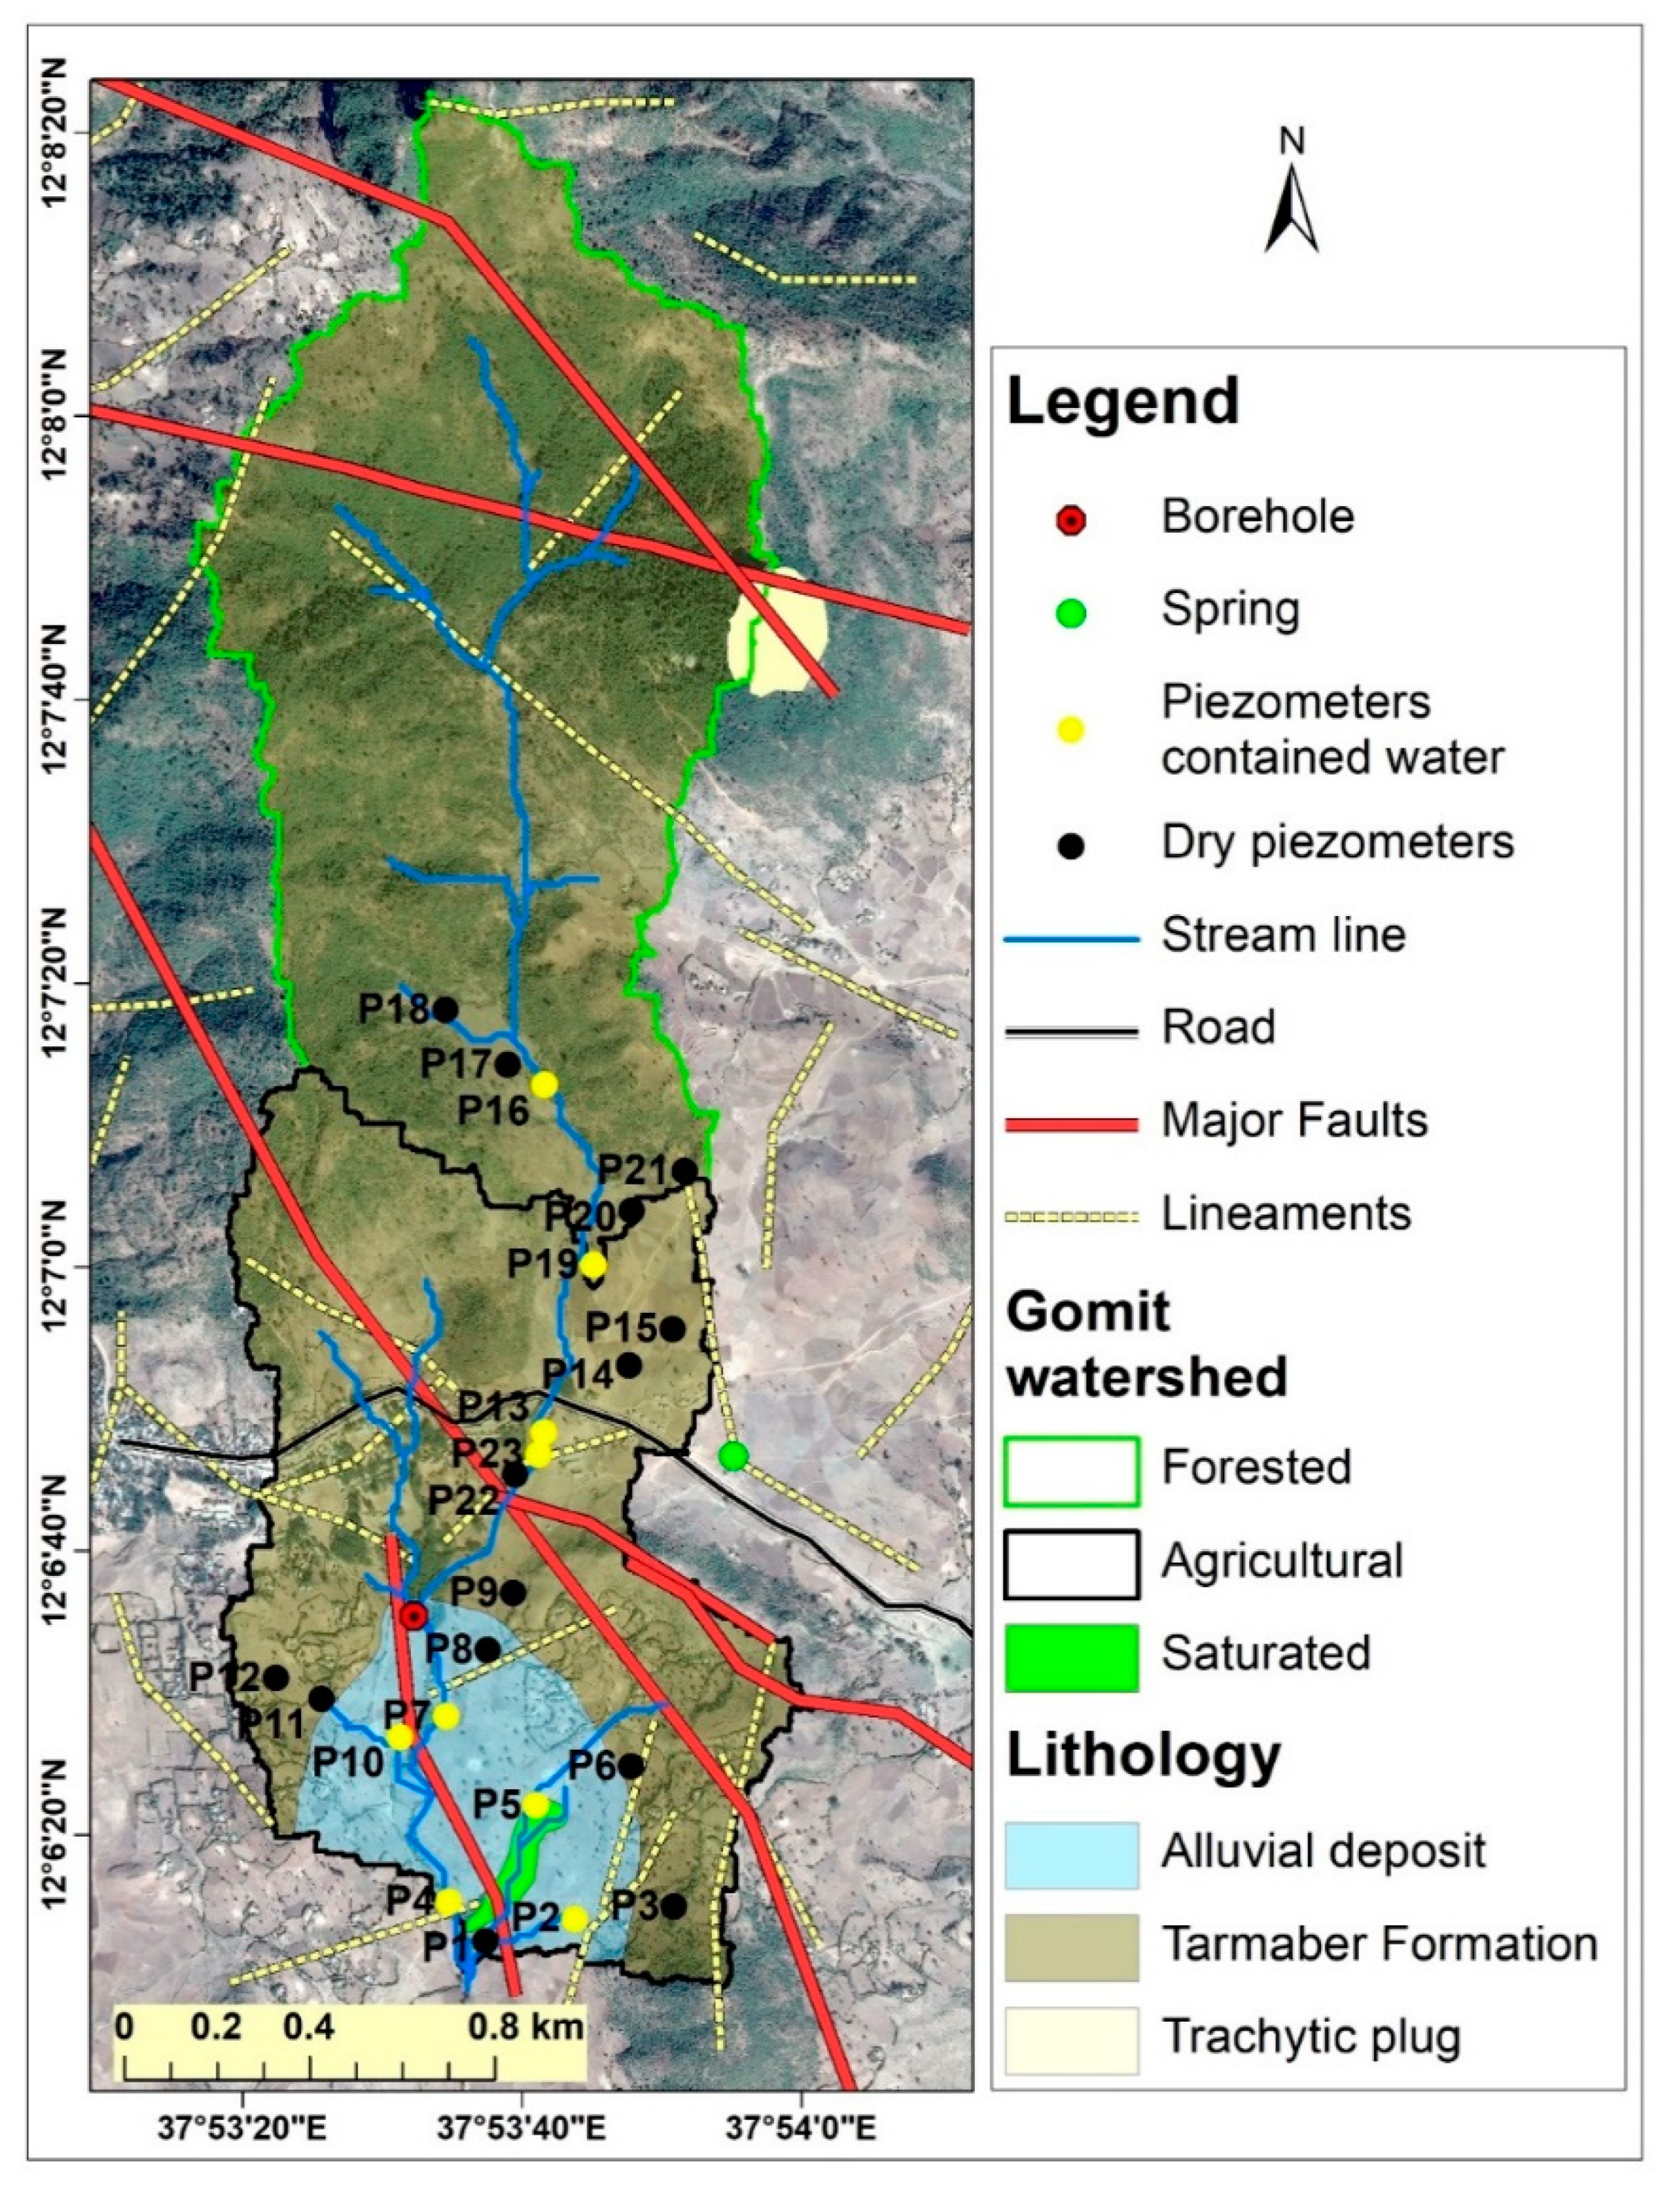
The Lake Tana basin consists of three grabens (Gondar, Dengel Ber, and Debre Tabor) [78,88]. The Gomit watershed belongs to the Debre Tabor graben, which is the most highly faulted of the three grabens. The main geological units of Debre Tabor graben are aphanitic basalt, weathered scoriaceous basalt, alluvial deposit, and trachytic plugs (Figure 5). The trachyte plug on the northeast boundary of the watershed was formed by an intrusion of lava during a volcanic eruption in the tertiary period (Figure 6b). The lineaments and faults in the Gomit watershed are oriented in several directions, many of which are perpendicular to the streams (Figure 5). The two major faults located in the upstream area (red lines in Figure 5) intersect at the trachyte plug. A major fault in the north-south direction and parallel to the stream was found in the downstream part of the watershed. A municipal borehole is at the upper part of this fault. It provides drinking water to a community of around 5000 people. A spring that provides water to 50 households is located between two minor lineaments (in the NW direction) in the downstream area at the east side of the watershed. The yield varied with time. It was high in the rain phase and low in the dry phase.
3.4. Perched Groundwater Level
From the installed 23 piezometers, nine recorded the presence of the water table during the rain phase, six (P4, P5, P7, P10, P16, and P23) were situated at the downslope, and three (P2, P13, and P19) were at the midslope (Figure 7a, Table A2 in the Appendix A). The water levels in the downslope piezometers increased early in August and then remained nearly constant until almost the end of the measurement period (end of October). The water levels in P5, P7, and P23 were within 75 cm from the surface. The midslope piezometers (P2, P13, and P19) remained dry for one month or longer after the beginning of observations, after which the water table rose until a constant level was reached (Figure 7a, Figure A2 in the Appendix A). When the water height was plotted above the bottom of the piezometer, P7 had the greatest level because it was the longest piezometer, even when the bottom was bedrock (Figure 7b, Figure A2 in the Appendix A). The remaining 14 piezometers were dry throughout the 2016 wet season. Most of these piezometers were found in the up- and mid-slope positions (Figure 1). This indicates that the infiltrated water upslope from these piezometers does not flow over the bedrock but laterally through the faults.
3.5. Discharge at the Two Outlets
In both 2016 and 2017, the streamflow averaged over the watershed was 80 mm a−1. This was greater than 33 mm a−1 for 2015, which has less rain (Table 3). The upper watershed produced less than half the streamflow of the agricultural area. Overall, the runoff was only a small portion of the total rainfall (see Table 3). The maximum was 13% of rainfall in the agricultural area in 2017.
Thirty-one percent of the total discharge was baseflow in the forested part, 62% in the agricultural part, and 54% in the whole watershed (Table 3). The direct runoff included the interflow and surface runoff. In most of the rainfall events, less than 2 cm day−1 did not generate direct runoff (Figure 8). Only a few storms, with more than 2 cm day−1, caused the stream water to rise. In the forested watershed, the baseflow started in late August and disappeared in mid-October. In the agricultural area, baseflow started in mid-July and stayed up to the end of mid-November (Figure 8). The baseflow contribution of the forested area was smaller than that of the agricultural area.
3.6. Sediment Concentration and Yield
3.6.1. Sediment Concentration
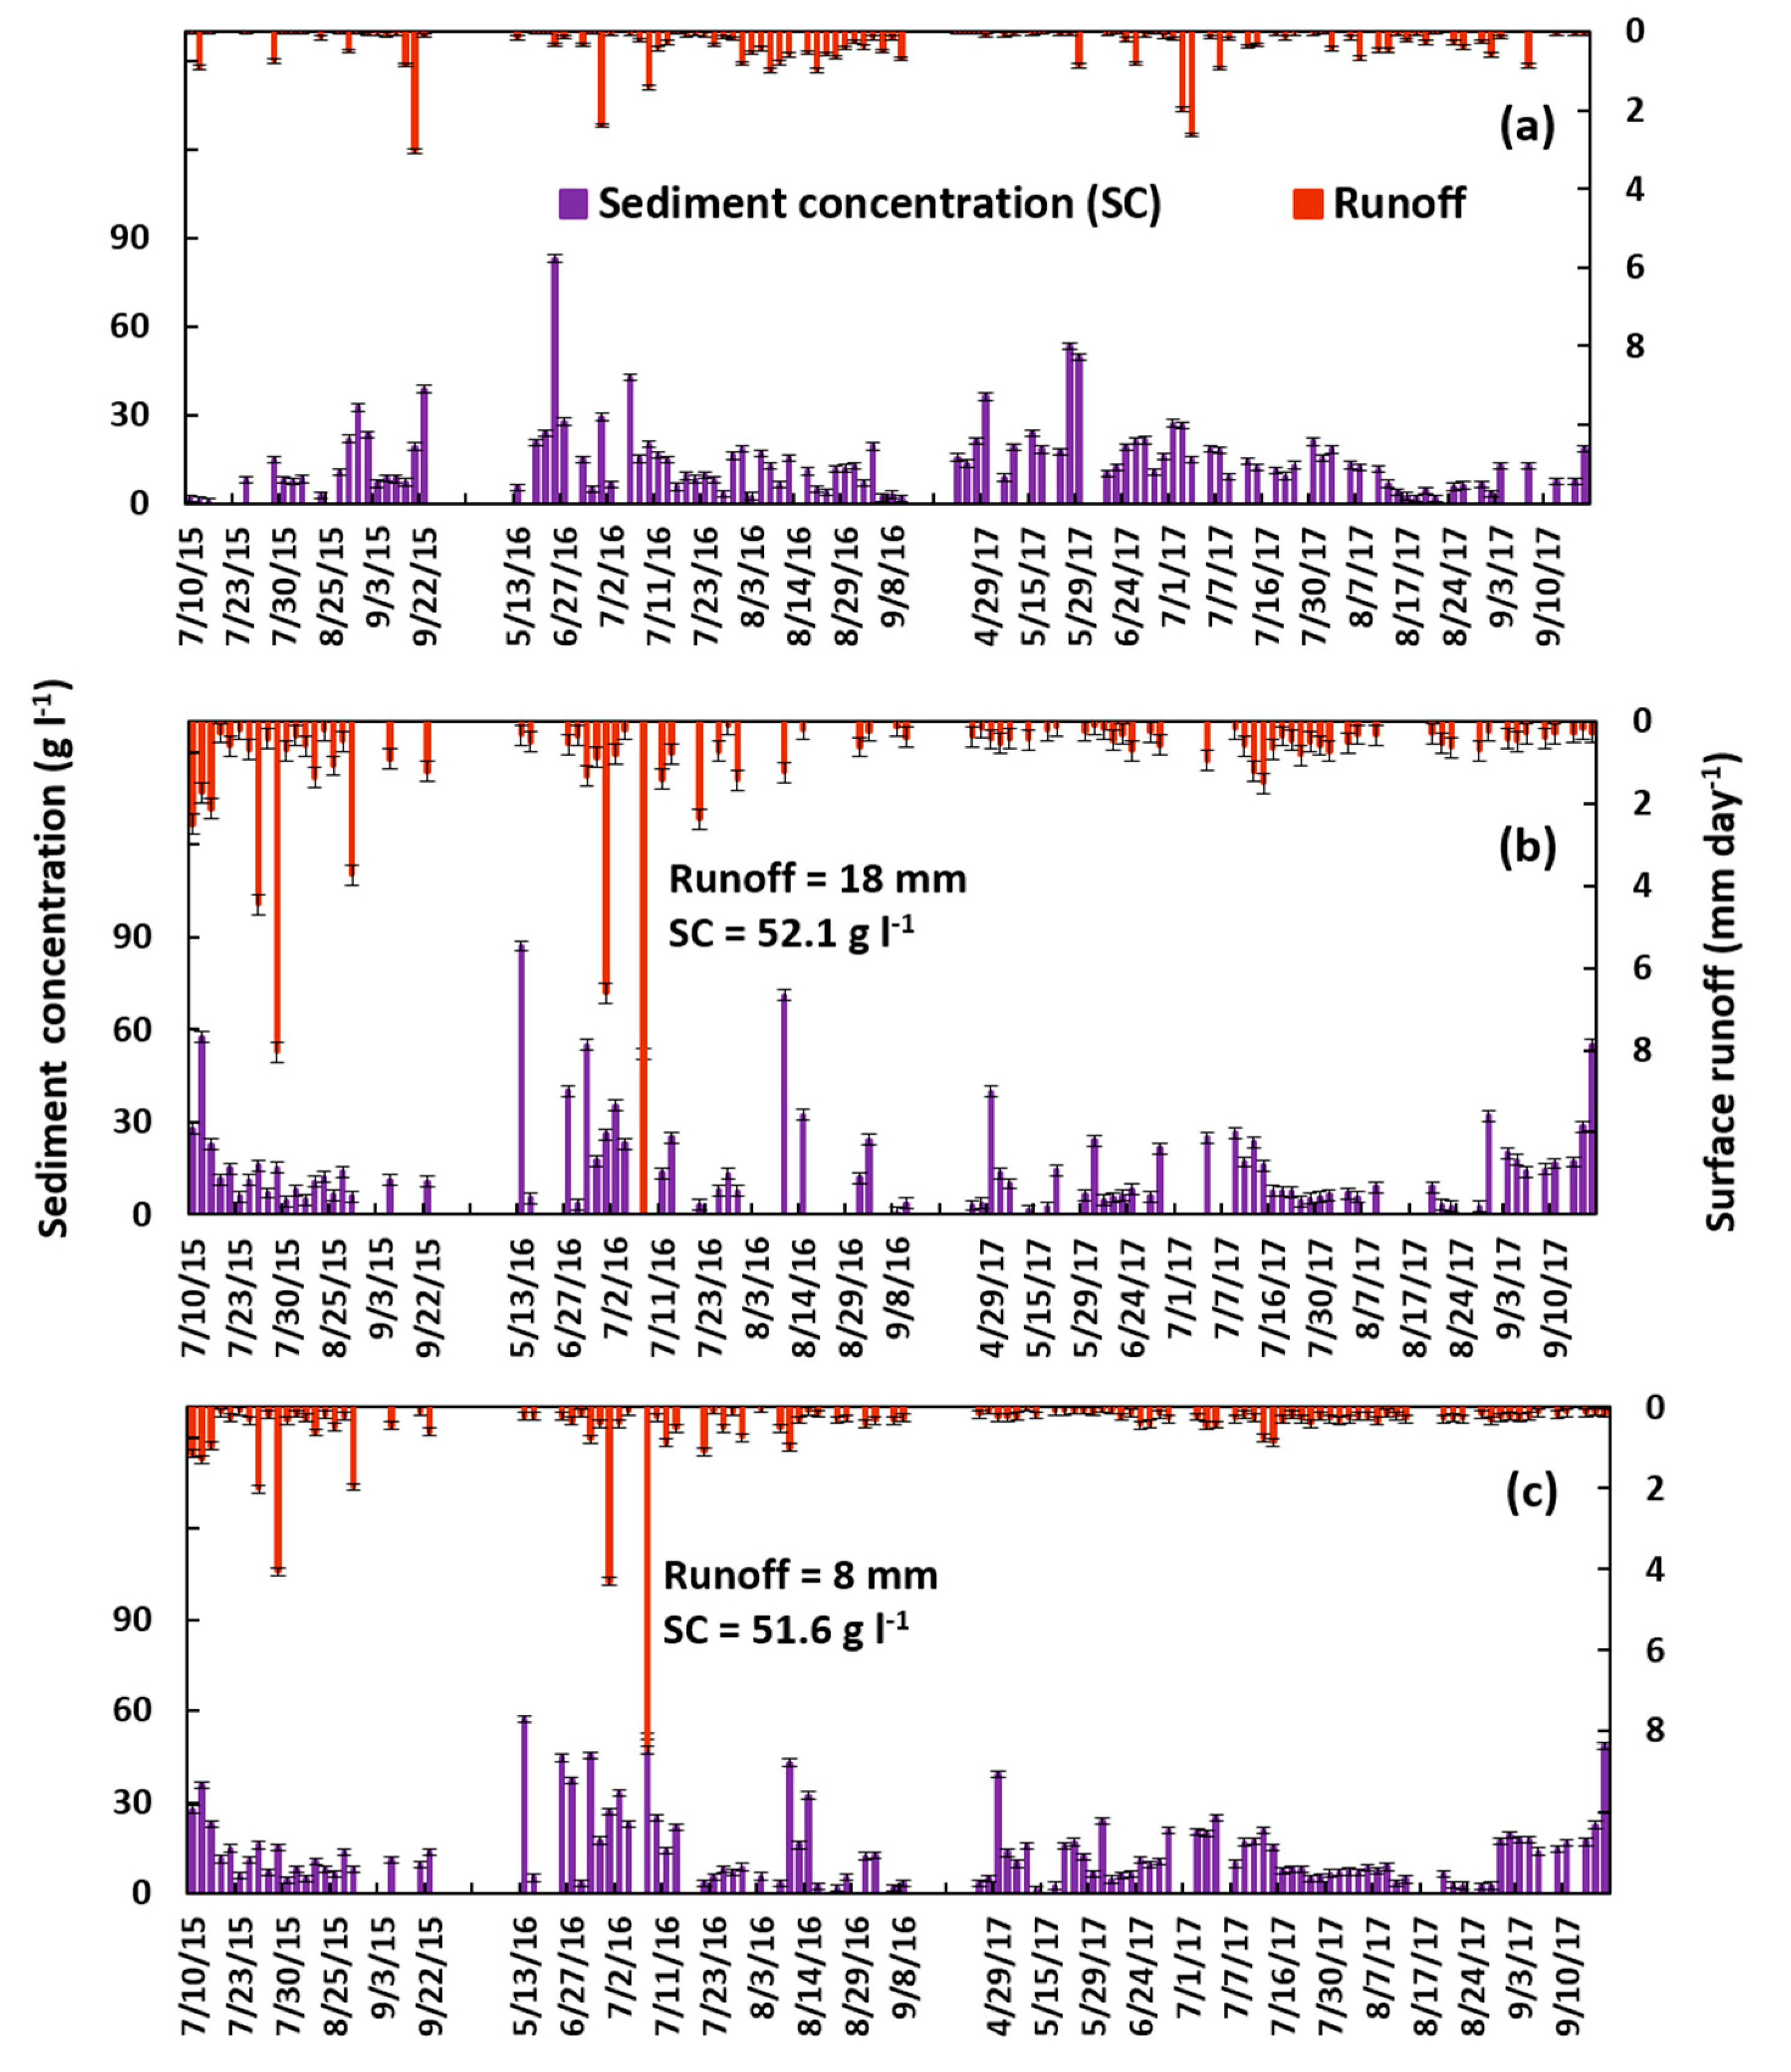
The average sediment concentrations for the three years were 13.6 g L−1 for Weir-1 at the outlet of the entire watershed and 14.4 g L−1 for Weir-2 at the uphill forested watershed. Sediment concentrations for both weirs were greater in 2016 than the other two years because several large storms occurred within a brief period during the beginning of the rain phase on 27 June 2016 with 15 mm of rain in 5 min.
Daily sediment concentrations and corresponding discharge amounts are depicted in Figure 9 for the three years. The maximum daily sediment concentrations were registered in the early part of the rain phase in 2016: 57 g L−1 for Weir-1 at the outlet of the entire watershed on 13 May 2016 with rainfall of 11 mm d−1 (Figure 9c), and 83 g L−1 for Weir-2 for the forested upper part on 26 June 2016, with rainfall of 13 mm d−1 (Figure 9a). The maximum sediment concentration of the agricultural part of the watershed was 87 g L−1 on 13 May 2016 (Figure 9b). Discharge on any of these days was less than 0.4 mm (Figure 9).
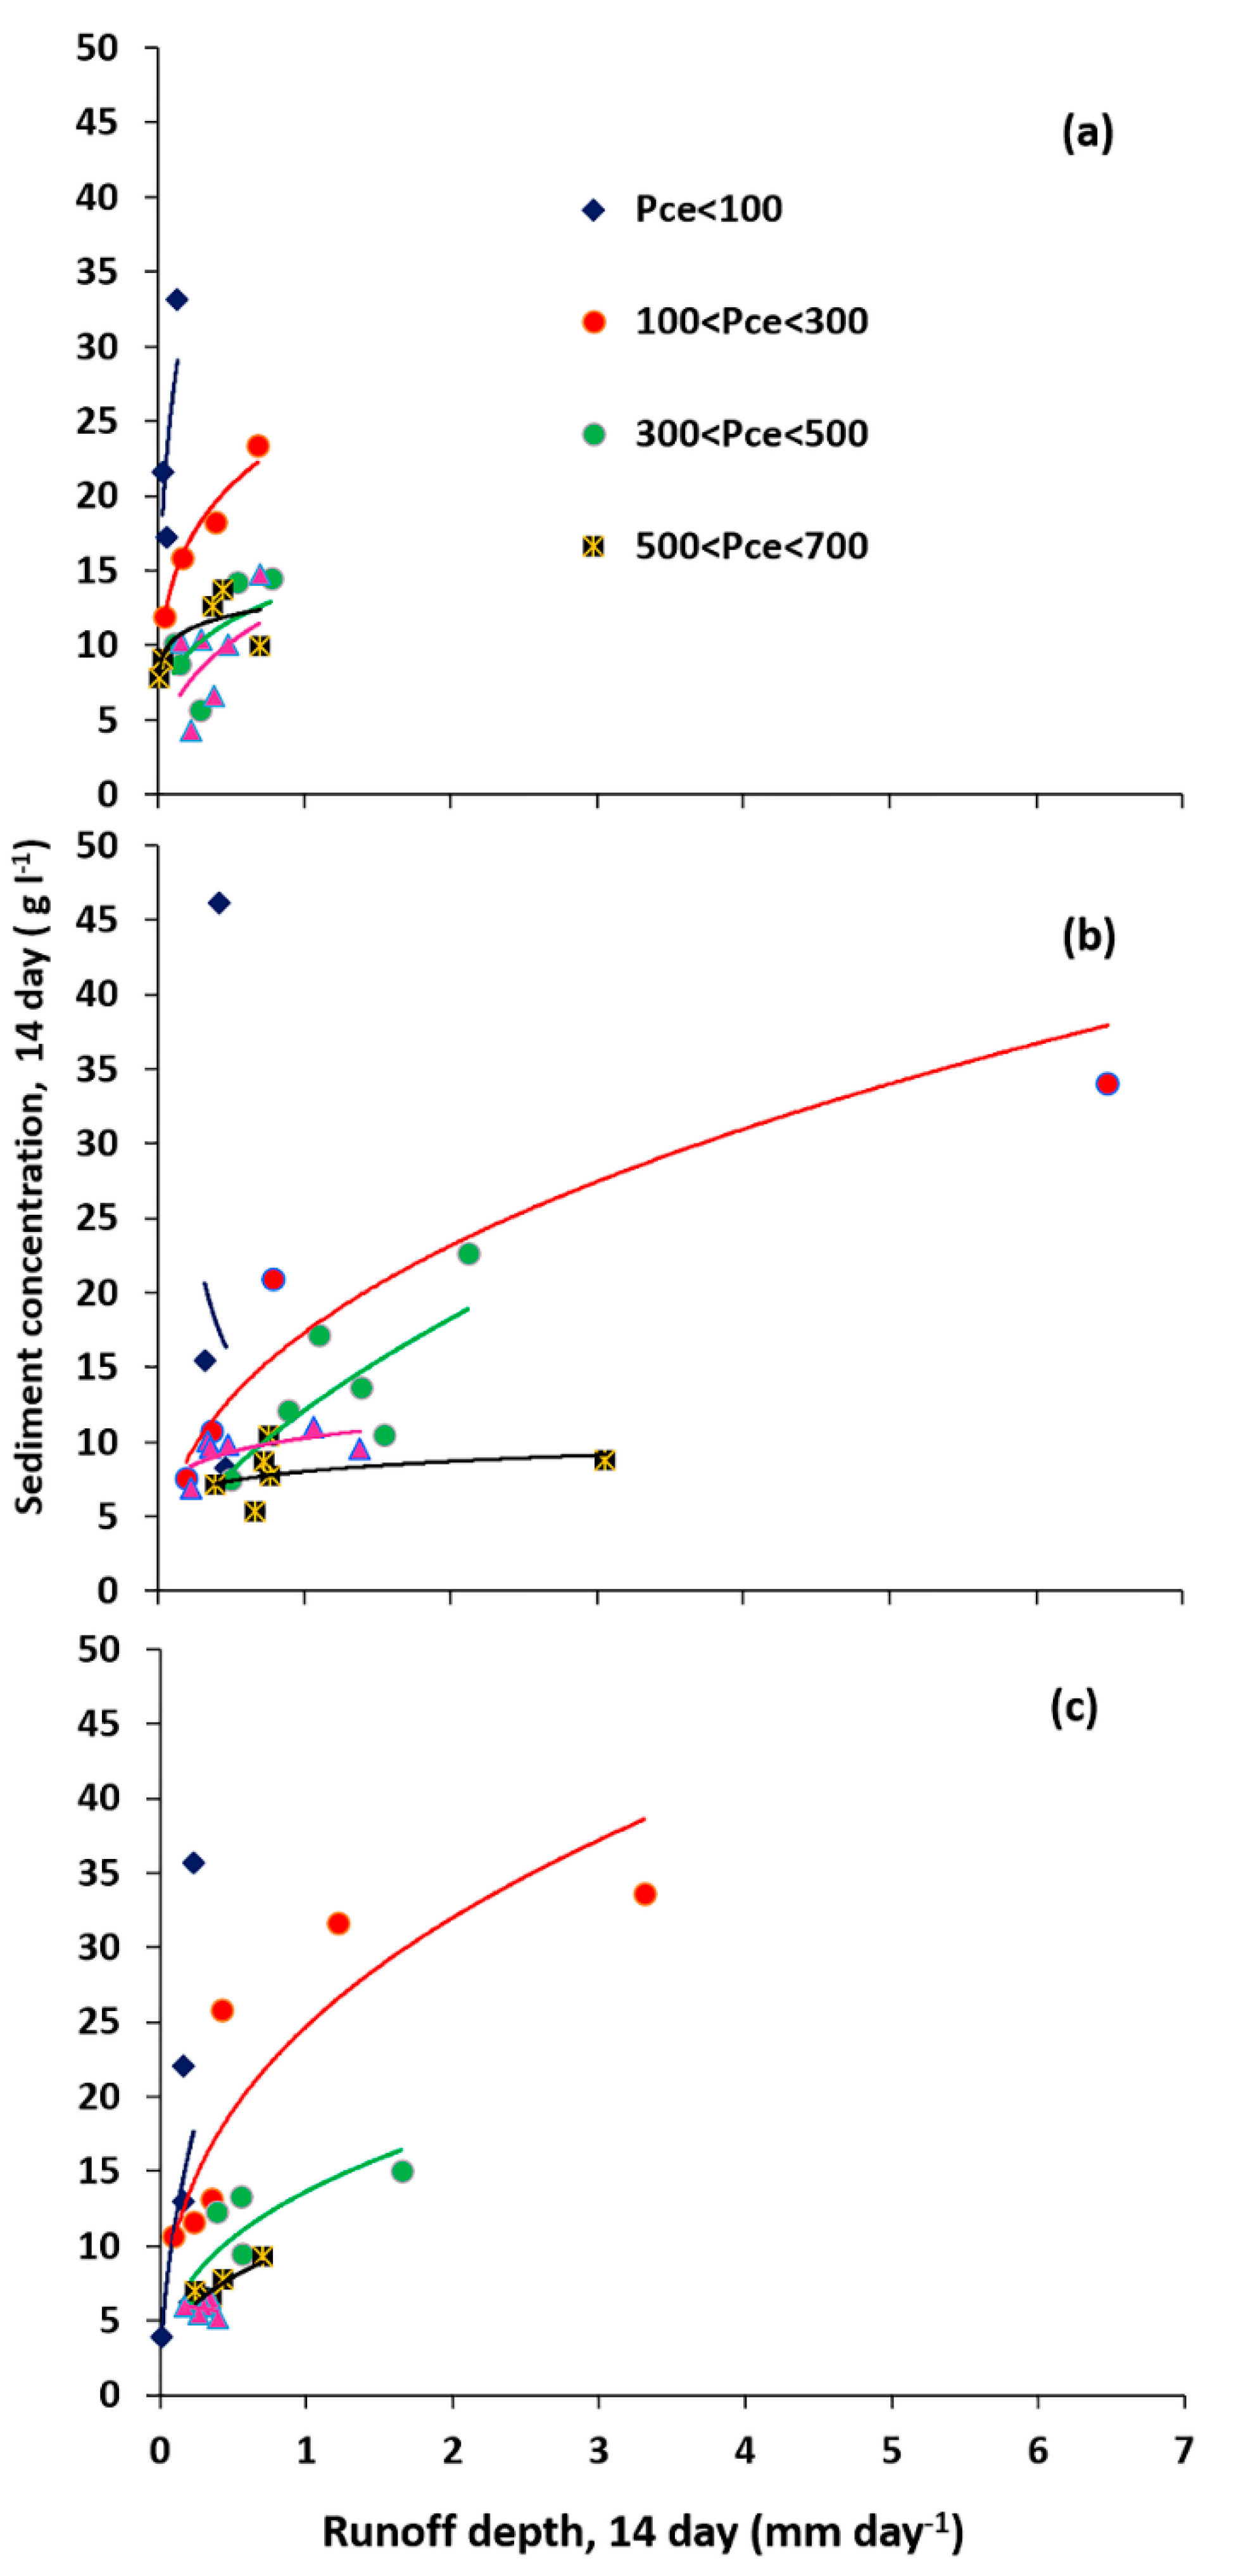
Thus, despite the differences in the runoff, the sediment concentration between the two contrasting watersheds was nearly the same. The pattern was similar too with sediment concentrations greater at the beginning of the rain phase than at the end (Figure 10). As shown by Guzman, et al. [89], the pattern can best be organized by plotting the average 14-day suspended sediment concentration against 14-day average discharge for cumulative effective rainfall amounts (Pce) (Figure 10). In all three watersheds, the largest sediment concentration that increased with the average runoff amount occurred at the beginning of the rainy season for cumulative effective rainfall of less 100 mm (Pce < 100). Concentration decreased for 100 < Pce < 300 and then Pce > 300. The concentration discharge relationship was independent of the cumulative effective rain. The decrease in concentration with the advance of the rain phase was an indication that sediment supply becomes limiting in the conveyance system after the beginning of the rain phase [90].
3.6.2. Sediment Yield
Sediment yield in 2015 was at 1 Mg ha−1 for the forested part and 5.6 Mg ha−1 for the agricultural part, while it was 2.5 and 13.7 Mg ha−1 respectively in 2016 (Table 4). The 2016 annual sediment yield was three times greater than that in 2015 (Table 4) while the annual direct runoff in 2016 was two times greater than that in 2015 (Weir 1 and 2) (Table 4). Thus, doubling in runoff resulted in a threefold increase in sediment yield. The greater sediment loss was caused by two large storms on 7 and 30 July, 2016 producing high sediment loads. These storms contributed to 40% of the runoff and 72% of the sediment yield in 2016. The 2017 sediment yield of the agricultural part was less than in 2016 (Table 4), despite the fact that the amount of rainfall was greater because fewer storm events generated runoff in 2017. The monthly sediment yield leaving the watersheds during the three years was high during July, and accounted for 54–82% of the annual sediment load (Table 4).
4. Discussion
4.1. Interaction of Geology And Hydrology
In the results section, the hydrology (both discharge and soil loss) and geology were presented separately. Here, we link hydrological observations with geological features. Linking the two results can provide a better understanding of the watershed [91] and, as we will show, aids in prioritizing areas for land and water management (LWM). First, the effect of the faults and lineaments on the surface runoff and the water table elevations are assessed, followed by a discussion of land and water management (LWM) practices.
4.1.1. Interaction of Geology with Direct Runoff and Baseflow
Table 3 shows that over the three years, only 7% of the rain ran off in the entire watershed. Performing the annual water budget with the data in Table 3 assuming that evapotranspiration between June and September is 416 mm [67], the excess rainfall that cannot be accounted for is 465 mm in 2015, 492 mm in 2016, and 547 mm in 2017. Some of the water which is unaccounted for would have evaporated during the dry phase, but according to observations in other watersheds within 100 km from the study area, this would constitute less than 200 mm a−1 [16,92]. Field evidence (Figure 6a) suggests that the remainder of the unaccounted water flowed out of the watershed via the subsurface through the faults and lineaments. During field visits, we found in the forested watershed a high angle fault that was perpendicular to the stream and dipped nearly perpendicular to the slope and was open (orange line in Figure 1, and red in Figure 5). A picture of the fault where it intersects with the stream is shown in Figure 6a. We noted baseflow in the creek upstream of this geological feature but none downstream. The high angle fault directed the flow of water to the Tekeze basin, where it surfaces as springs that are used for irrigation [93]. The Tekeze River connects with the Nile in Sudan. In addition to this particular fault, numerous faults and lineaments perpendicular to the streams were detected (Figure 5). These can cause a significant transfer of surface and subsurface water to the deep groundwater, or can act as barriers, as we will see in the next section.
4.1.2. Relationship between Geology and Perched Groundwater
The groundwater table elevations were measured with the 23 piezometers. Fourteen piezometers remained dry throughout the measurement period (Figure 1). Analyzing the perched groundwater observation (Figure 1, Figure 5 and Figure 7) with respect to the geology, we note that wells with water (yellow filled circles in Figure 5) were mainly located east of and close to the main river. Only two wells were located downstream, west of the river: P2 in the downstream area was located approximately 225 m east of the river, and P5 (also downstream) was near a side branch of the main river. The wells without water were on the west side (such as P22), or at a greater distance from the river area and were at a higher elevation than the nearby piezometer with water (Figure 1).
Wells that were located close together that were especially interesting and helped to describe the effect of the faults were P13 and P23 on the east side of the river and P22 on the west side (Figure 1). All three wells were at the same elevation of 2020 m. Wells P13 and P23 had nearly the same water level throughout the period of observation (Figure 7, Figure A2 in the Appendix A), while there was no water in P22. Thus, there was a direct connection between P13 and P23, and the lineament between P22 west of the river and P23 and P13 east of the river acted as a barrier (Figure 5). Another set of piezometers of interest comprised P2, P4, and P1. P2 and P4 contained water during the observation period and P1 did not. The elevation of P1 was 1971.8 m. Compared to P1, P4 was 4.5 m higher and P2 was 11.5 m higher. The N-NW major fault (red line in Figure 5) and E-N lineament between P2 and P4 (yellow hatched line in Figure 5) acted as barriers. The distinct boundary at this location of the small green (wet) area and dark (lack of vegetation) downstream in Figure 5 was caused by the fault and lineament as well. The fault prevents subsurface flow downstream and water ponded upstream of the fault. The final pair of interest was P7 and P5. These wells, although located approximately 500 m apart, had the same water level pattern (Figure 7). This could indicate that they were part of the same perched aquifer in the alluvial deposit, since no major faults or lineaments were found between the two piezometers.
The water levels in the piezometers in the Gomit watershed were nearly independent of rainfall once they reached their maximum levels (Figure 7). In other watersheds like Debre Mawi, the water table fluctuated with the amount of rainfall [13,16,58]. In addition, Alemie et al. [13] observed for a few hand-dug wells that the groundwater level remained constant during the wet phase. The constant level indicated that water flowed over a blocked fault through the alluvial deposits to the river. The delayed rise in Piezometer P2 at some distance from the river and P10 on the west side of the main river could have been caused by this spill effect.
4.1.3. Interaction of Groundwater and Baseflow
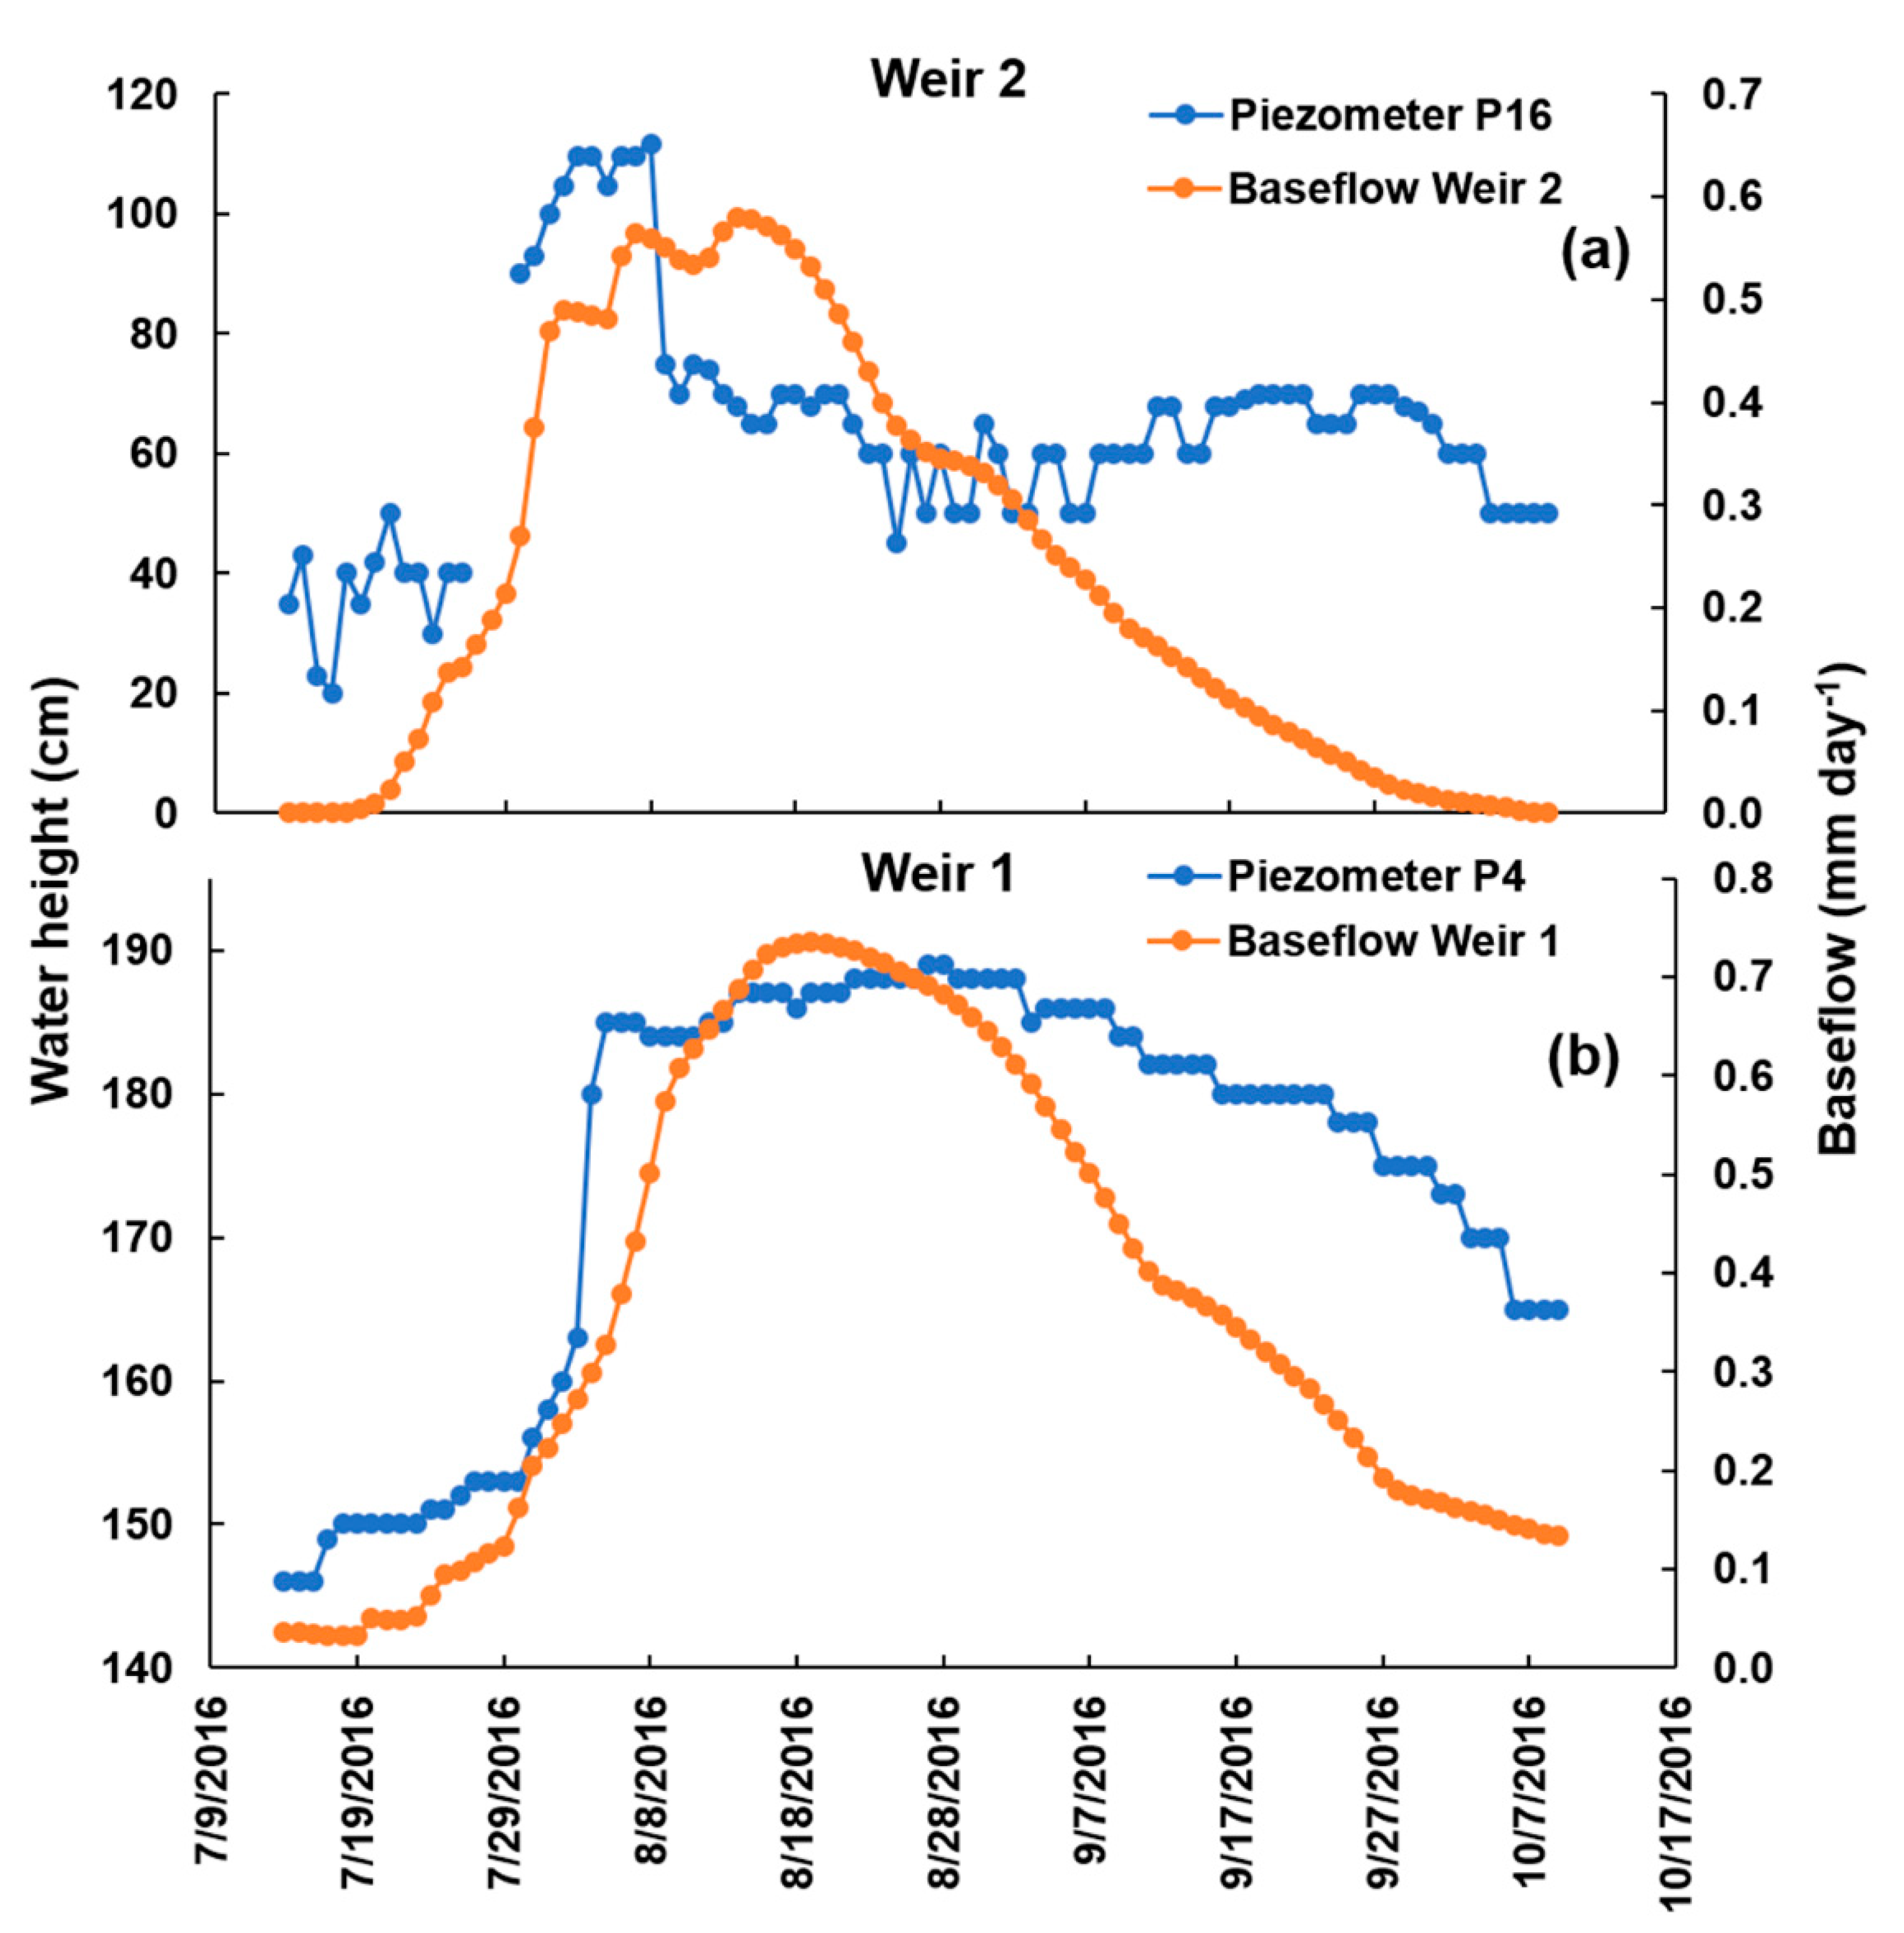
The baseflow started to rise symmetrically with the rise of the groundwater level at the downslope, as shown by comparing the water level in piezometer 16 with the discharge in weir 2 that was located just downstream of weir 1 (Figure 11a). Similarly, the rise in piezometer 4 was related to the rise in discharge with weir 1 (Figure 11b). After the initial rise, the discharge and water level in the piezometer became independent. We hypothesize that the discharge was related to the amount of flow over the barrier, while the groundwater level was related to the height of the barrier. In other words, the river acted as an overflow, limiting the height of the water table. As long as the supply continued, the water table remained at the same height in the piezometer; however, after the rain stopped, it declined due to evaporation.
Finally, the groundwater table and the runoff were related. We theorized that the 2 cm of rain needed before runoff occurred (Figure 8) was related to the amount of water needed to bring the water table to the surface. Only then, surface runoff occurred as saturation excess overland flow because the infiltration rates were too great for any infiltration excess flow.
4.1.4. Regional Ethiopian Highlands—The Interaction of Geology and Annual Discharge
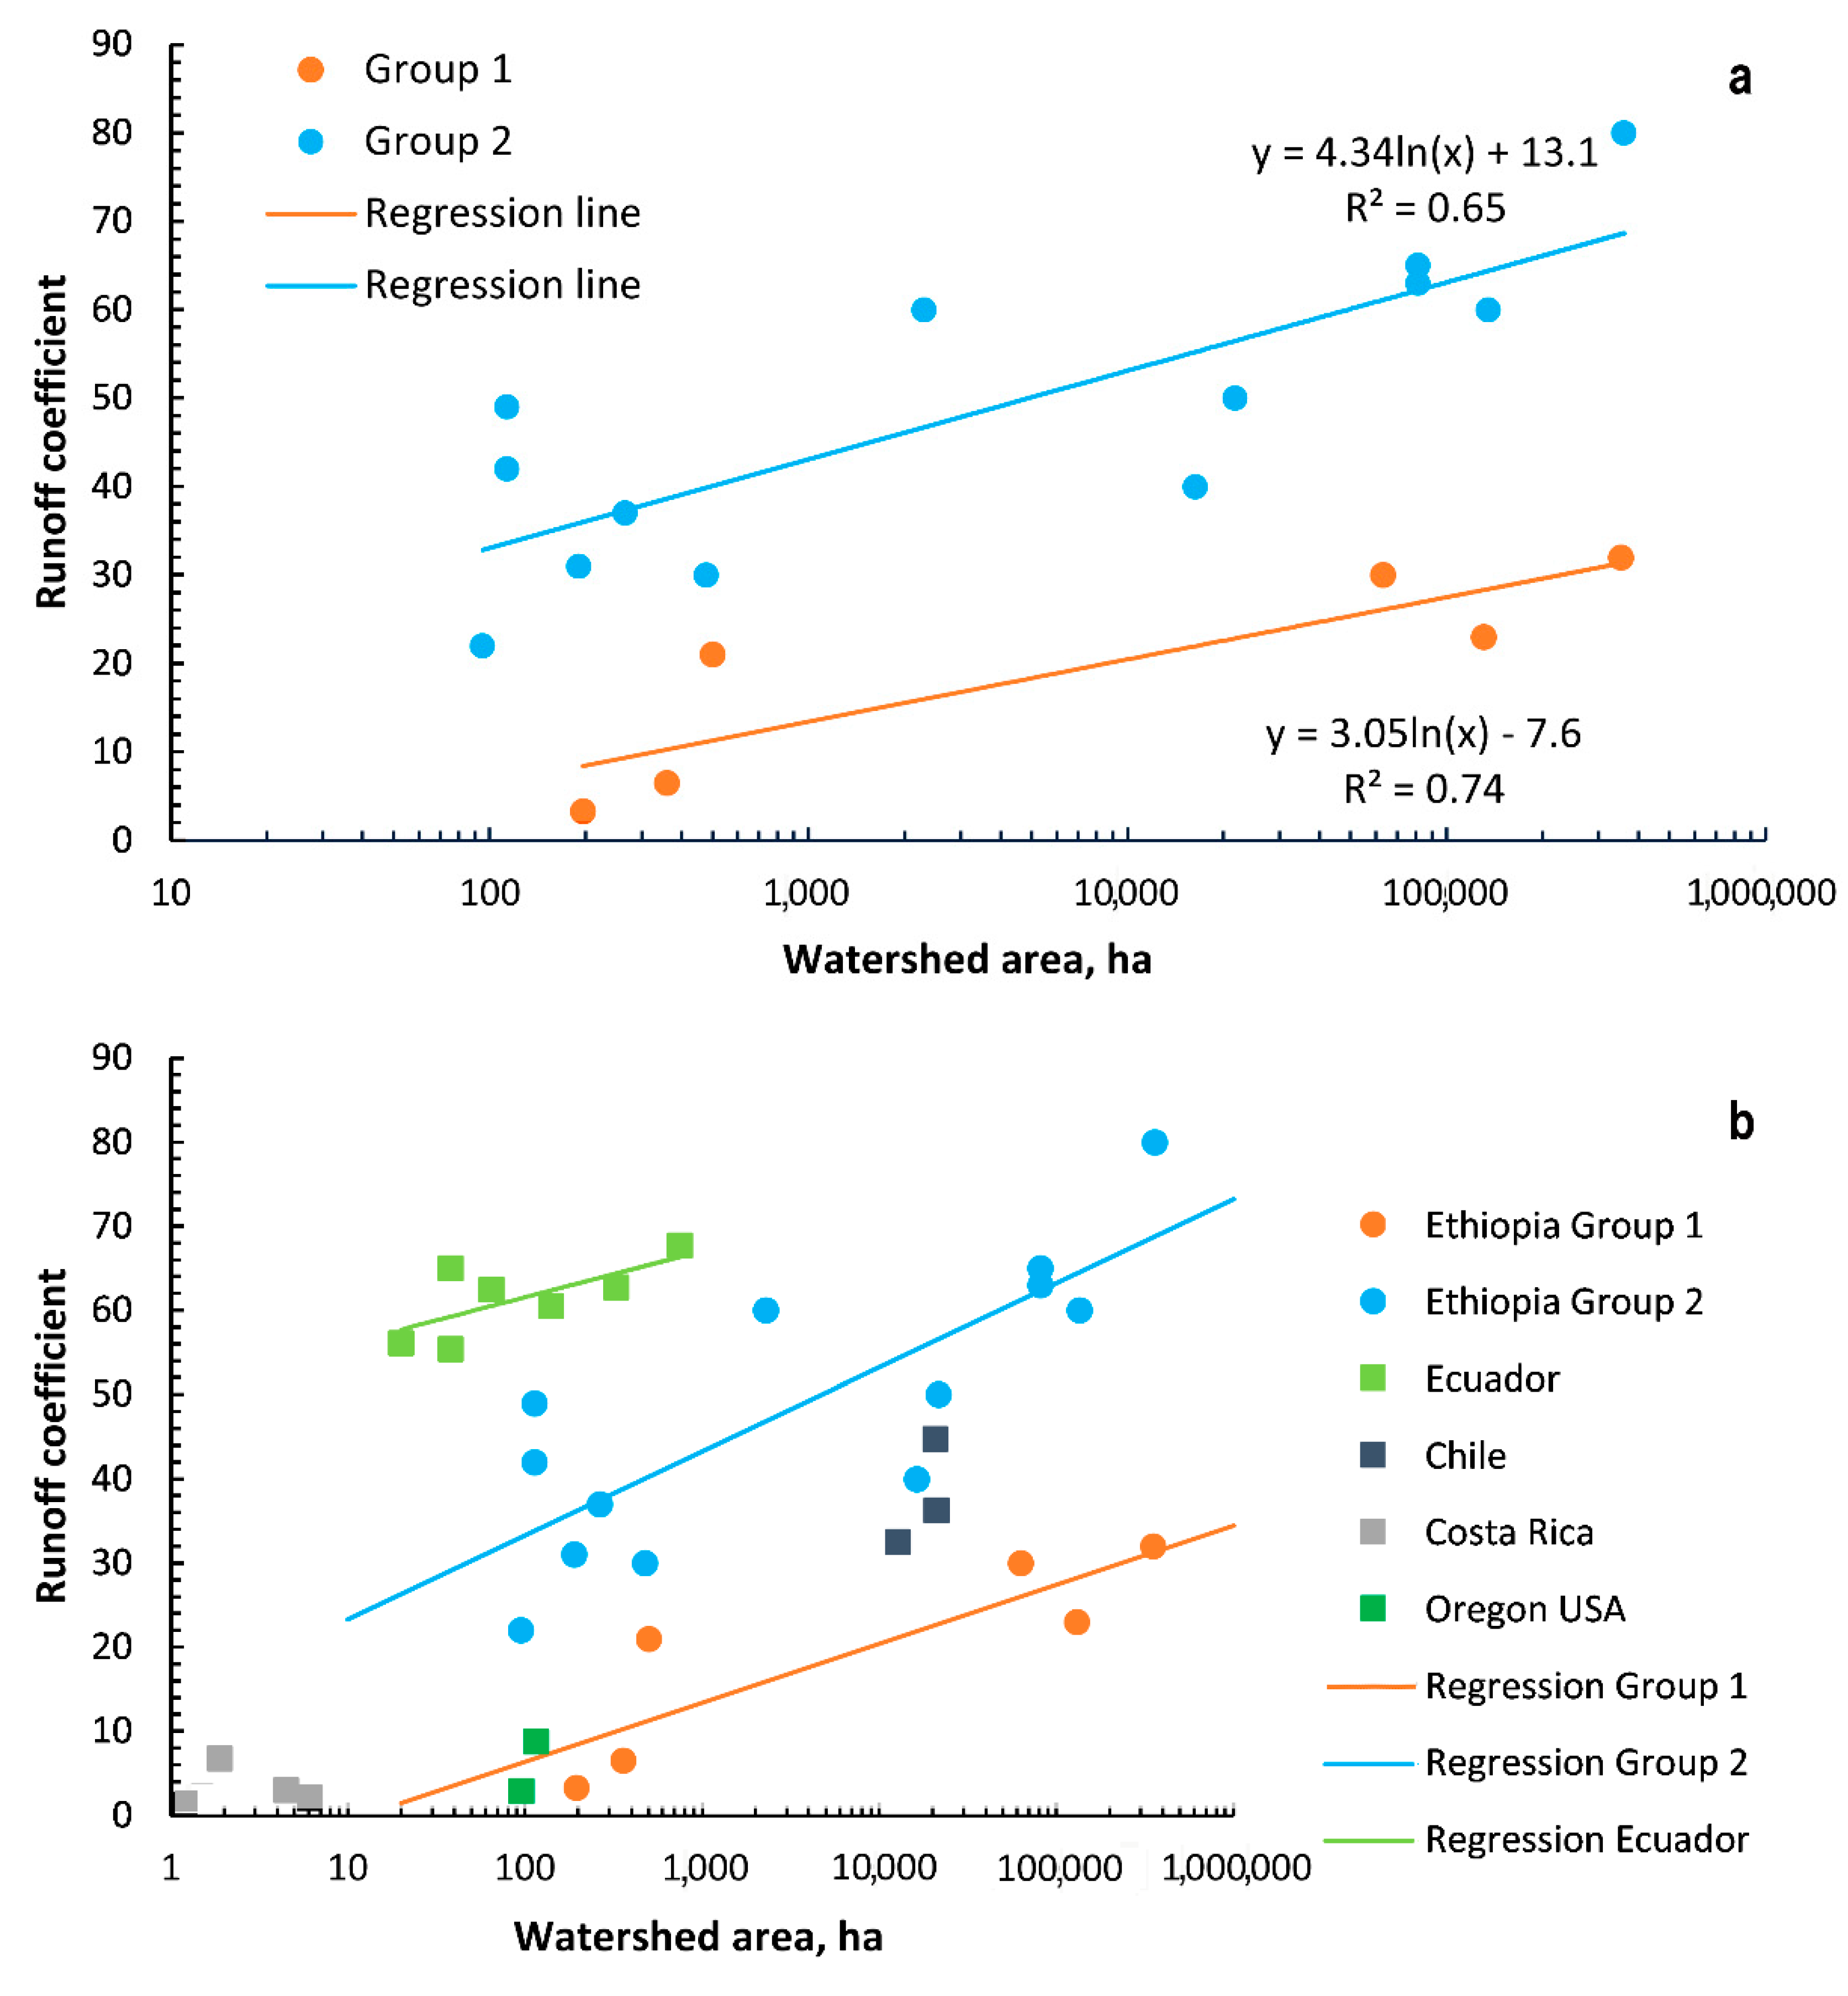
The runoff coefficients of the watersheds in the semihumid and humid Ethiopian Highlands shown in Table A3 in Appendix A and Figure 12a ranged from 3% to 80%. The runoff coefficient in the May Zeg watershed in the semiarid Tigray was the only one that was less and was not considered here. The Rib watershed had a runoff coefficient of 23%, which was the smallest of the large rivers in the Lake Tana basin. The runoff coefficient for the Gomit watershed, which is part of the Rib watershed (Figure 1), was even lower than for the entire Rib watershed. The watershed area and the runoff coefficients listed in Table A3 are plotted in Figure 12a as a function of the logarithm of the watershed area. The watersheds fall clearly into two groups. The first group consists of Gomit, Tikur Wuha, Megech, Rib, and Beles. The remaining watersheds in Table A3 are in group two. Most of the watersheds in the second group are found south of Lake Tana. In both groups, the runoff ratio increased with area but the intercept with the y-axis was distinctly different.
Most of the watersheds in group 1 in Figure 12a are found in tertiary basalt. These basalts can be found in the northern, western, and eastern parts of Lake Tana [94,95]. These basalts are part of the Debre Tabor graben [78]. Watersheds in group 2 are located on quaternary basalt that is distinct for the southern part of the Lake Tana basin. Quaternary basalt in Lake Tana’s southern part is associated with Dengel Ber graben (Chorowicz et al., 1998). The tertiary basalt of the Gondar and Debre Tabor grabens are older and more fractured than the quaternary basalt of the Dengel Ber graben [96]. The tertiary basalt, with a more mature subsurface flow network, can transport greater amounts of flow than the quaternary basalt in which the flow network is not so eroded. Thus, the geology, like those of other highlands in the world [3,8,9,10,11,12,17,18,19,20,21,22,23], directly affects the amount of subsurface flow (and thereby indirectly the surface flow) in the watersheds.
Interestingly, our findings for the Gomit watershed (Table A3, Figure 12a) fit very well with the regional context. It falls into group 1. Since the watershed is smaller than the Rib basin, the runoff coefficients are even less than that of its main watershed with the major faults perpendicular to the stream.
4.1.5. Global Context—The Interaction of Geology and Annual Discharge
To investigate how well our results are in agreement with findings globally, we calculated annual runoff coefficients from published watershed studies [3,11,97,98] on volcanic highlands that measured both runoff and rainfall. Two watersheds were in the Cascade Range in the semiarid part of Oregon with a fractured volcanic rock substrate. The watersheds were 116 ha and 96 ha (Table A4). Less than 10% of the rainfall appeared as runoff [97]. In the Ecuadorean Andes, seven watersheds were monitored ranging in size from 20 ha to 753 ha [11]. The subsoil was made up of volcanic and volcanoclastic rock deposits that were compacted during the last glacial ice period of the last ice age [11]. Runoff coefficients ranged from 55% to 68% (Table A4). In the Chilean Andes, three watersheds with sizes varying from 127 km2 to 210 km2 were monitored. The geologic substrate made up of lava was deposited in the middle and middle-upper Pleistocene and was characterized by dense jointing, favoring the fast movement of groundwater [3]. Finally, a set of small watersheds was monitored in Portugal and Costa Rica (Table A4). The plots in Portugal did not qualify as watersheds and were not further considered [98]. Geological information was not provided by the authors for the watersheds in Costa Rica. The runoff coefficient was less than 7%.
We plotted the runoff coefficients of these globally distributed watersheds with those in the Ethiopian Highlands in Figure 12b. The runoff coefficient for Ecuador was distinctly greater than any of the watersheds in Ethiopia due to the compacted volcanic and volcanoclastic rock deposits. The watersheds in the Oregon Cascade Range, with their fractured volcanic rock substrates, are comparable to the group 1 watersheds in Ethiopia. The watersheds in Costa Rica and Chile fall between group 1 and group 2. Teir runoff is directly related to the fraction portion of high permeable, strongly weathered, and fractured volcanic rocks, as reported by Iwagami et al. [10], and the amount of fraction varies from one region to another. This was not unexpected. Consistent among the volcanic regions is the observation that the runoff ratio increases linearly with the logarithm of the area of the watershed.
4.2. Sediment—Discharge Interaction
4.2.1. Gomit Watershed
A monthly summary of discharge and both sediment yield and concentration of the forested, agricultural, and entire watersheds are shown in Figure 13. In the three sites, the peaks of sediment concentrations were observed at the beginning of the rainy phase and before the direct runoff peak in July, indicating that the sediment supply became limited during this month with high rainfall. The steep reforested upper watershed had less direct runoff and baseflow than the lower agricultural watershed. Both the forested and agricultural parts of the watershed had similar average sediment concentrations (between 14 and 15 g L−1) but sediment yield was greater in the agricultural watershed due to the larger runoff response (Figure 13). Other factors were responsible for the similar sediment concentration in the two parts of the watershed and might be related to picking up sediment in the river channel in both land uses [99].
4.2.2. Regional Ethiopian Context
The rate of the annual sediment load from the entire Gomit watershed was relatively small as compared to other watersheds, while the sediment concentration was greater (Table 5). This may be related to the low runoff response of the watershed and, to some degree, to the sediment trapping capacity of the SWC structures installed in the watershed. In Table 5, we also show that sediment yield decreased in the first year after the implementation of soil and water conservation in watersheds, e.g., those at Debre Mawi, Anjeni, Birr, and May Zeg Zeg. However, as shown by Guzman et al. [100], the sediment concentration decrease was only temporary (in most cases) for structural practices. Increasing evaporation with vegetative measures in the watershed by increasing the acreage of eucalyptus trees will reduce the long-term runoff and sediment concentration.
4.3. Land and Water Management Practices
The general purpose of LWM practices is to decrease surface runoff by increasing the infiltration of water. This is accomplished by increasing the time that the water is on the field. In practice in the Ethiopian Highlands, this is accomplished by storing the runoff water in the infiltration furrows or upstream of the stone and soil bunds. This allows sediment to settle in the furrows and behind the bunds, eventually forming terraces.
The surface runoff is much less in the Gomit watershed than in other watersheds because of the many faults that transport the excess rainfall out of the watershed. Thus, the faults have the same function as the LWM practices by infiltrating the excess runoff. So, there is less need for the application of LWM practices when the watershed is highly fractured. This is certainly the case in the Gomit watershed with high coverage of existing bunds and infiltration furrows (Table 2) in the agricultural area from past years (Figure 2a). This is evidence that these practices are not effective, because otherwise, the bunds would have formed terraces and the infiltration furrows would have filled up. In the group 2 watersheds (Figure 12), such as the Debre Mawi, all bunds were filled up within five years [31]. Figure 2a shows that in the Gomit watershed, the 5-year-old bunds did not accumulate sediment.
The investment in LWM practices in the Gomit watershed in group 1 was, therefore, not as cost-effective as for group 2 watersheds. For the same investment, practices implemented in the Gomit watershed could have been installed in one of the watersheds in group 2, resulting in greater amounts of soil saved. Priority should be given to watersheds transporting substantial amounts of sediment outward. This will make LWM investments more effective.
Since the volcanic highlands have a similar pattern of water flow through losses through faults as other volcanic highlands, our findings on LWM practices are valid in semihumid and humid monsoon volcanic highland regions throughout the world. Since the investment cost of LWM practices per hectare is approximately the same, independently of the runoff amounts, the maximum amount of soil per dollar invested is found in those watersheds that have minimum subsurface flow and maximum runoff and soil loss.
5. Conclusions
We examined the runoff depth and soil loss in the Gomit watershed. The runoff depth was much less than in other watersheds to the south. The runoff coefficient was low compared to those of other watersheds found in the region because as much as 29% of the rainfall left as subsurface flow. This loss of water was through faults and likely appears as spring at lower elevations in the Tekeze basin.
An average sediment concentration of between 14 and 15 g L−1 in the Gomit watershed was high compared to those of watersheds worldwide, but the sediment yield (between 2 and 4 Mg ha−1 a−1) was below average for an agricultural watershed in Ethiopia. This was due to the low runoff response of the watershed. In addition, LWM practices might have trapped some sediment.
Finally, since the type of geological formation determines, for a given rainfall, the discharge and sediment load of a watershed, the process of prioritizing watersheds for the implementation of management practices should take into account the geological nature of the region. More research is needed on how various geological formations affect the hydrology of the highlands in the tropics that serve as water towers for hundreds of millions of people.
Supplementary Materials
The observed experimental data are available online at https://www.mdpi.com/2073-4441/12/10/2702/s1, Table S1: Rainfall and streamflow data for Gomit watershed, Table S2: Perched groundwater level data of Gomit watershed
Author Contributions
All authors were involved in the conceptualization and methodology. A.A.A. collected the data, analyzed it, and wrote the first draft. All authors were involved in writing the last version of the manuscript. All authors have read and agreed to the published version of the manuscript.
Funding
This publication was made possible through support provided by the CGIAR Research Program on Water, Land and Ecosystem’s East Africa focal regional program and by the Feed the Future Innovation Lab for Small Scale Irrigation through the U.S. Agency for International Development, under the terms of Contract No. AID-OAA-A-13-0005. The contents of the paper do not necessarily reflect the views of CGIAR and USAID.
Acknowledgments
Bahir Dar Institute of Technology and the Postgraduate School at Bahir Dar provided financial support during the write-up.
Conflicts of Interest
The authors declare that they do not have a conflict of interest.
Appendix A

Table A1.
Watershed characteristics of the Gomit watershed.
| Characteristics | Forested | Agricultural | Entire Watershed |
|---|---|---|---|
| Major soils (%) | |||
| Alisols | 10 | 0.5 | 6 |
| Ferralsols | - | 8 | 3 |
| Leptosols | 49 | 16 | 34 |
| Luvisols | 39 | 44 | 41 |
| Nitosols | - | 26 | 12 |
| Regosols | 0.6 | - | 0.3 |
| Vertisols | 2 | 6 | 4 |
| Slope class (%) | |||
| Flat | 0.5 | 2 | 1 |
| Gentle | 4 | 27 | 12 |
| Moderately steep | 9 | 32 | 17 |
| Steep | 32 | 28 | 30 |
| Hilly | 35 | 10 | 26 |
| Mountainous | 20 | 2 | 13 |
Table A2.
Properties of the piezometers in the Gomit watershed.
| Piezometer | Easting | Northing | Altitude, m | Well Depth, cm | Land Use | Remark |
|---|---|---|---|---|---|---|
| P1 | 1,338,242 | 379,614.2 | 1971.8 | 436 | Crop land | |
| P2 | 1,338,290 | 379,807.6 | 1983.3 | 436 | Grass land | |
| P3 | 1,338,317 | 380,021.8 | 2015.3 | 224 | Bush and grass land | |
| P4 | 1,338,327 | 379,534.8 | 1976.3 | 466 | Crop land | Water, stream bank |
| P5 | 1,338,536 | 379,722.9 | 1992.7 | 328 | Grazing land | Found groundwater |
| P6 | 1,338,620 | 379,929.1 | 1995.3 | 220 | Grassland | Between cultivation |
| P7 | 1,338,728 | 379,528.7 | 1993.6 | 503.9 | Crop land | Found ground water |
| P8 | 1,338,872 | 379,618.2 | 1999.7 | 130 | Crop land | |
| P9 | 1,338,995 | 379,673.9 | 2011.4 | 313 | Crop land | |
| P10 | 1,338,683 | 379,428.6 | 1987.2 | 368.5 | Grass and crop land | |
| P11 | 1,338,766 | 379,258.5 | 2000.9 | 120 | Crop land | |
| P12 | 1,338,811 | 379,159.6 | 2008.3 | 233 | Grass and crop land | |
| P13 | 1,339,326 | 379,742.4 | 2021.8 | 421 | Grass land | |
| P14 | 1,339,487 | 379,924.7 | 2026.3 | 112.2 | Crop land | |
| P15 | 1339566 | 380,018.2 | 2041.7 | 232.5 | Crop land | |
| P16 | 1,340,096 | 379,741.9 | 2046.0 | 225 | Crop land | Water, stream bank |
| P17 | 1,340,139 | 379,661.6 | 2056.9 | 273.2 | Crop land | |
| P18 | 1,340,258 | 379,526.7 | 2070.1 | 150 | Crop land | Near stream bank |
| P19 | 1,339,683 | 379,808.5 | 2029.0 | 346 | Grass and crop land | |
| P20 | 1,339,823 | 379,930 | 2056.6 | 359 | Grass and crop land | |
| P21 | 1,339,909 | 380,044.6 | 2062.1 | 159 | Grass and crop land | |
| P22 | 1,339,262 | 379,675 | 2022.0 | 155 | Grazing land | Near stream bank |
| P23 | 1,339,285 | 379,694 | 2022.0 | 243 | Crop land | Near stream bank |
Table A3.
Watershed size, annual rainfall, and annual runoff coefficients for watersheds in the Ethiopian Highlands.
Table A3.
Watershed size, annual rainfall, and annual runoff coefficients for watersheds in the Ethiopian Highlands.
| Watershed | Area (ha) | Annual Rainfall (mm a−1) | Runoff Coefficient (%) | Source |
|---|---|---|---|---|
| Gumara | 135,100 | 1460 | 60 | Dessie et al. [24], Gebrehiwot et al. [106] |
| Rib | 130,800 | 1460 | 23 | |
| Gilgel Abay | 359,800 | 1562 | 80 | |
| Megech | 63,100 | 1170 | 40 | |
| Dirma | 16,300 | 1200 | 40 | Dessie et al. [24] |
| Gibera | 2300 | 1460 | 60 | |
| Gelda | 21,700 | 1500 | 50 | |
| Beles | 352,000 | 971 | 32 | Gebrehiwot et al. [106] |
| Koga | 266 | 1562 | 37 | |
| Maybar | 477 | 1417 | 30 | Bayabil et al. [14] |
| Anjeni | 113 | 1675 | 42 | Bayabil et al. [14] |
| Andit Tid | 113 | 1467 | 49 | |
| Debre Mawi | 95 | 1240 | 22 | Dagnew et al. [102] |
| Birr | 300 | 1355 | 79 | Gebrehiwot et al. [106] |
| May Zeg Zeg | 200 | 762 | 1.6 | Nyssen et al. [48] |
| Tikur-Wuha | 500 | 1602 | 21 | Akale et al. [107] |
| Guale | 190 | 1561 | 31 | |
| Birr | 192 | 1225 | 63 | Ayele et al. [103] |
| Gomit | 359 | 987 | 11 | This study |
| 166 | 987 | 3.3 |
Table A4.
Annual runoff coefficients in some watersheds of the world.
| Basin/Region | Country | Area (ha) | Total Rainfall (mm) | Runoff (% Rainfall) | Source |
|---|---|---|---|---|---|
| Ribeirinha | Portugal | 0.35 | 1787 | 0.4 | Fontes et al. [98] |
| Granja | Portugal | 0.18 | 2313 | 0.9 | Fontes et al. [98] |
| Canary Islands | Spain | 0.02 | 69 | 2.3 | Guerra et al. [108] |
| Zhurucay M1 | Ecuador | 20 | 1300 | 56 | Mosquera et al. [11] |
| Zhurucay M2 | Ecuador | 38 | 1300 | 55 | Mosquera et al. [11] |
| Zhurucay M3 | Ecuador | 38 | 1293 | 65 | Mosquera et al. [11] |
| Zhurucay M4 | Ecuador | 65 | 1294 | 62 | Mosquera et al. [11] |
| Zhurucay M5 | Ecuador | 140 | 1267 | 60 | Mosquera et al. [11] |
| Zhurucay M6 | Ecuador | 328 | 1254 | 63 | Mosquera et al. [11] |
| Zhurucay M7 | Ecuador | 753 | 1277 | 68 | Mosquera et al. [11] |
| Chillán | Chile | 21,000 | - | 36.3 | Muñoz et al. [3] |
| Renegado | Chile | 12,700 | - | 32.5 | Muñoz et al. [3] |
| Diguillín | Chile | 20,700 | - | 44.8 | Muñoz et al. [3] |
| Ways | USA | 116 | 314 | 8.8 | Ochoa et al. [97] |
| Jensen | USA | 96 | 314 | 2.9 | Ochoa et al. [97] |
| Reventazón Forest | Costa Rica | 6.1 | 3826 | 2.1 | Toohey et al. [109] |
| Reventazón Coffee | Costa Rica | 4.5 | 3826 | 3.0 | Toohey et al. [109] |
| Reventazón Sugar cane | Costa Rica | 1.9 | 3826 | 6.8 | Toohey et al. [109] |
| Reventazón Pasture | Costa Rica | 1.2 | 3826 | 1.3 | Toohey et al. [109] |
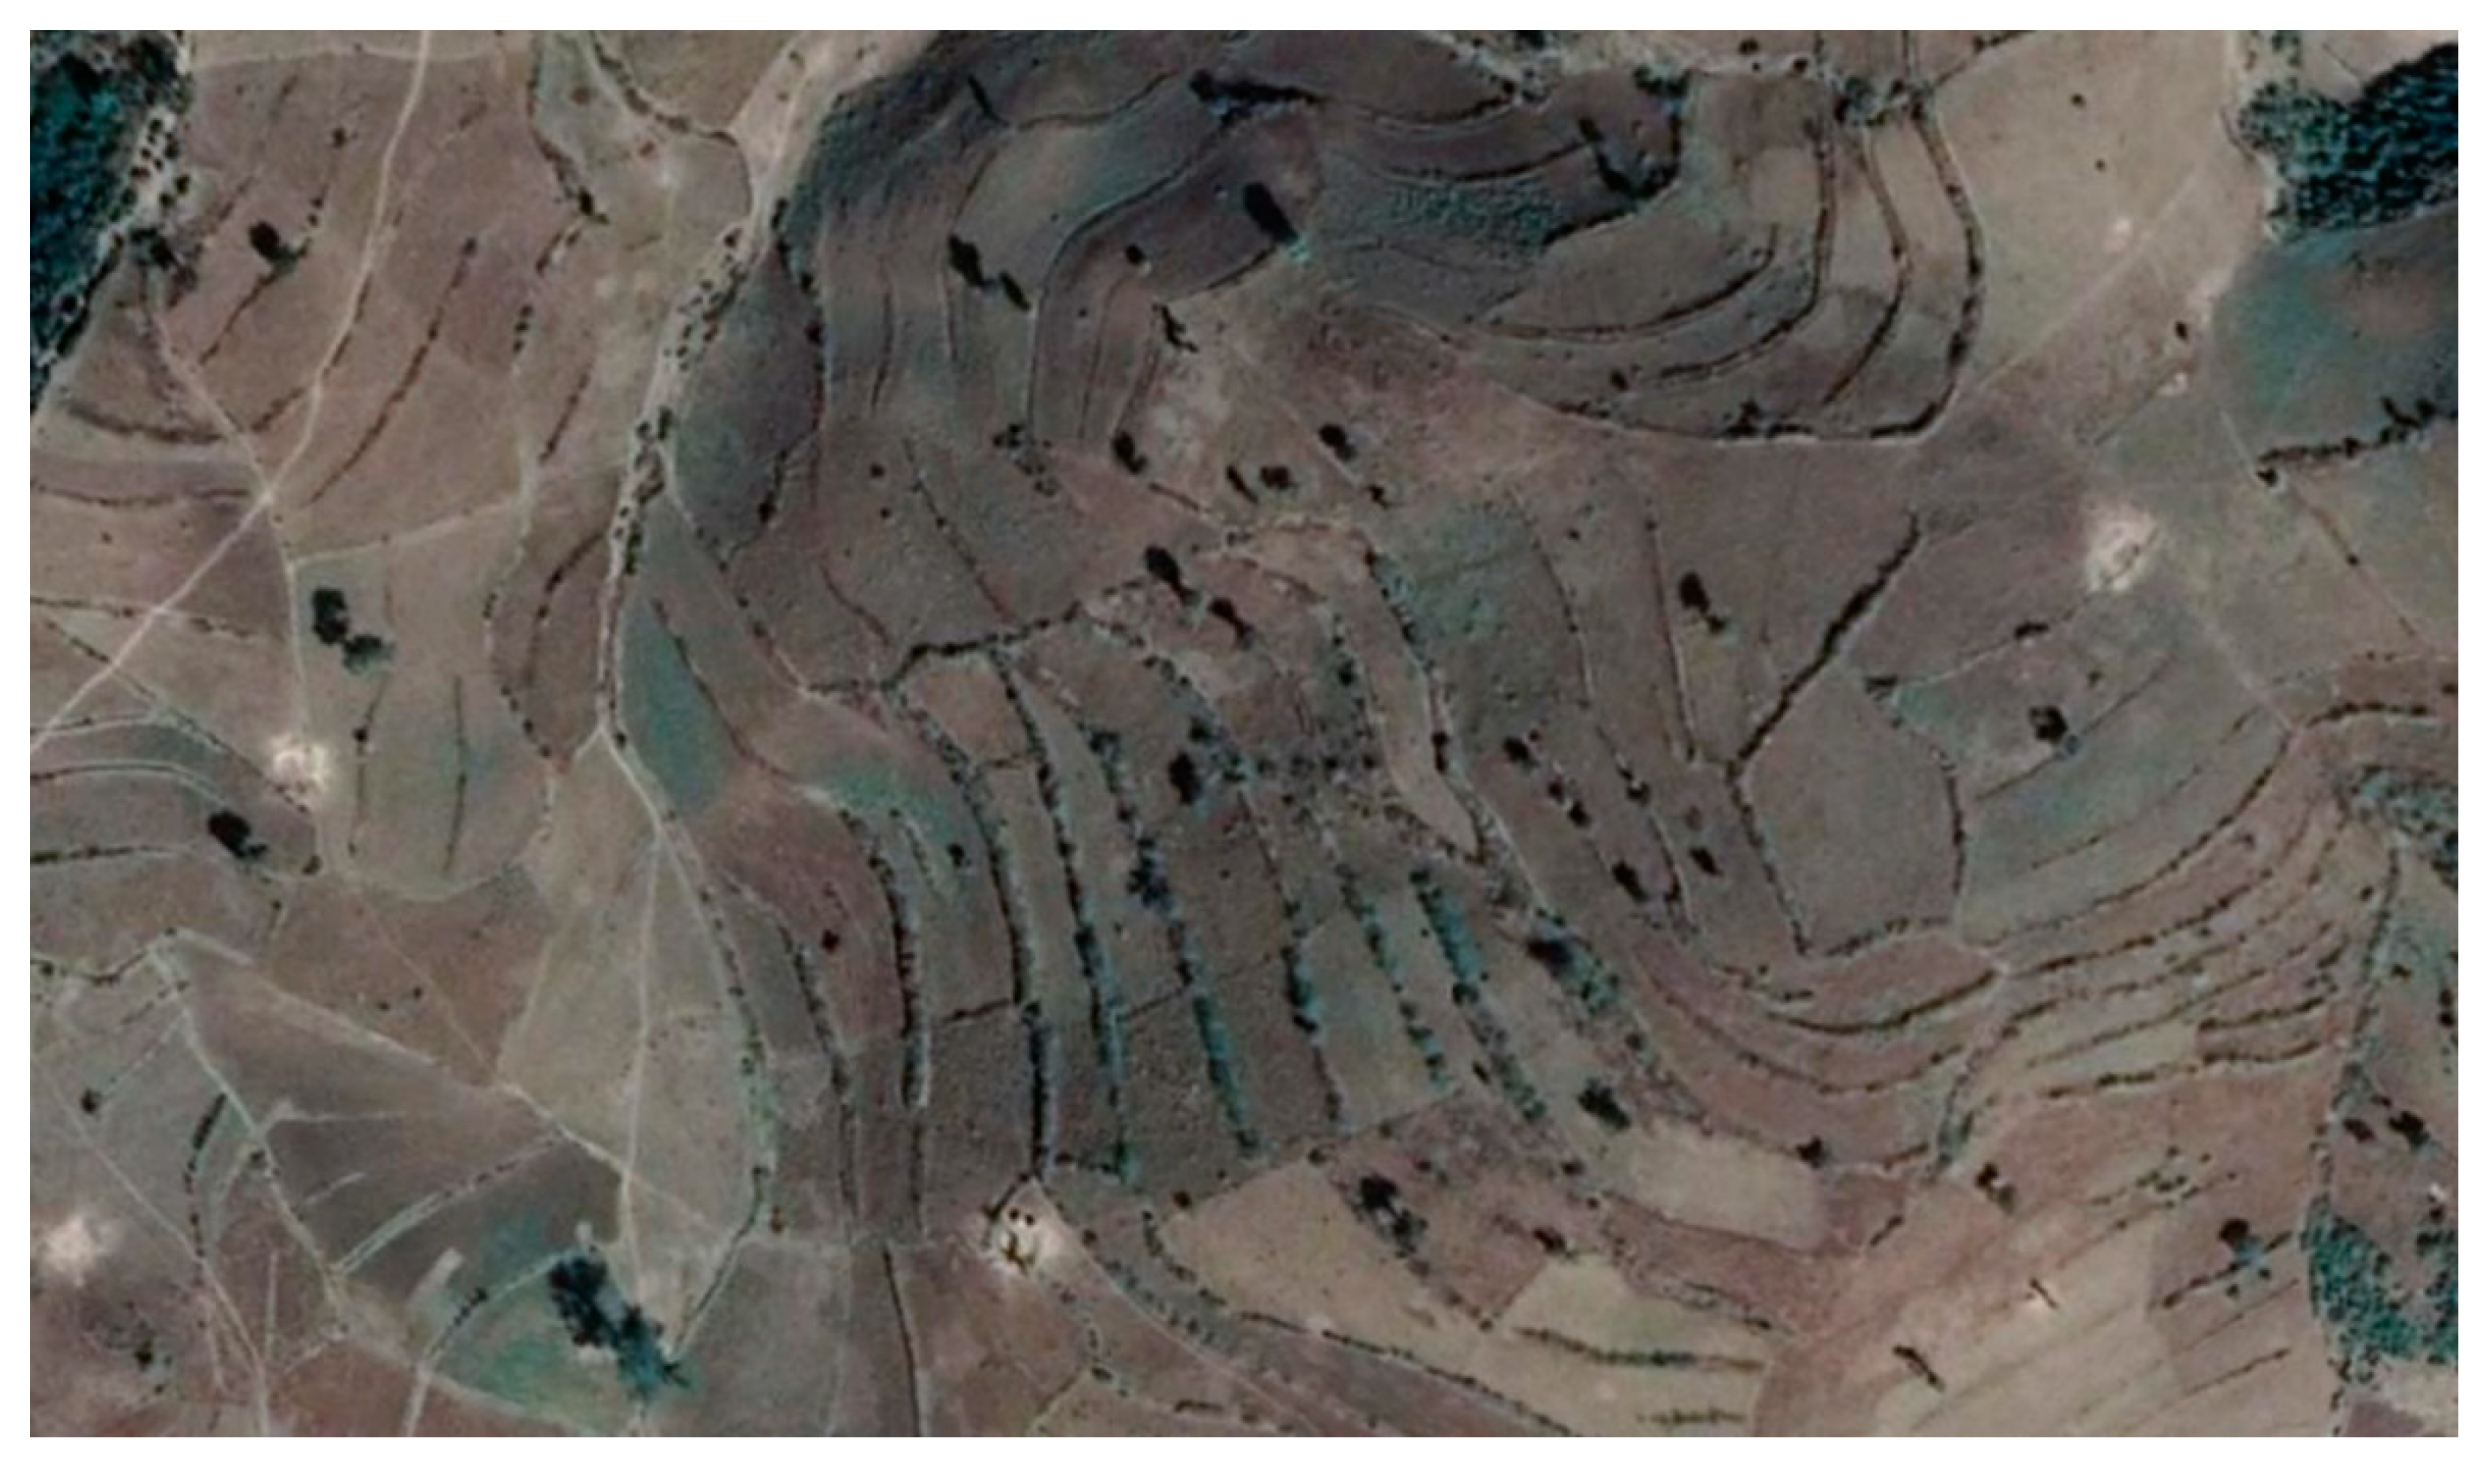
Figure A1.
Google Earth images showing land and water management practices in the Gomit watershed.

Figure A2.
Piezometer water levels are plotted as a function of elevation above sea level. The well locations are given in Table A2.
Figure A2.
Piezometer water levels are plotted as a function of elevation above sea level. The well locations are given in Table A2.

Figure A3.
Stage discharge relationship for weir-1 (a) and weir-2 (b) where Q is discharge in lit/sec and H is the stage height in cm.
Figure A3.
Stage discharge relationship for weir-1 (a) and weir-2 (b) where Q is discharge in lit/sec and H is the stage height in cm.

Figure A4.
Exceedance probability of five-minute rainfall intensity (a) for 2015, 2016, 2017, and (b) for all the three years. Note that the exceedance probability versus rainfall intensities and infiltration rates of (a) Gomit watershed in 2015, 2016, and 2017, and (b) bottom slope, midslope, and upslope of Gomit watershed from 2015 to 2017 rainfall. The minimum infiltration rate, which occurred at the bottom of the hill where the soil was saturated, was exceeded by the rainfall intensity 30% of the time it rained in 2016/2017 and 50% in 2015. The median infiltration rate is a good indication of whether the upslope regions generate runoff because water that runs off in one location can infiltrate downhill. The median infiltration rate was only exceeded by the rainfall intensity with 0.6% in the bottom slope, 0.1% in the midslope, and 0% in the upslope, indicating that all rainwater (except for the near stream areas) infiltrates 99.4% of the time before reaching the stream.

References
- Beniston, M. Climatic change in mountain regions: A review of possible impacts. In Climate Variability and Change in High Elevation Regions: Past, Present & Future; Springer: Berlin/Heidelberg, Germany, 2003; pp. 5–31. [Google Scholar]
- Marques, J.E.; Marques, J.M.; Chaminé, H.I.; Carreira, P.M.; Fonseca, P.E.; Santos, F.A.M.; Moura, R.; Samper, J.; Pisani, B.; Teixeira, J. Conceptualizing a mountain hydrogeologic system by using an integrated groundwater assessment (Serra da Estrela, Central Portugal): A review. Geosci. J. 2013, 17, 371–386. [Google Scholar] [CrossRef]
- Muñoz, E.; Arumí, J.L.; Wagener, T.; Oyarzún, R.; Parra, V. Unraveling complex hydrogeological processes in Andean basins in south-central Chile: An integrated assessment to understand hydrological dissimilarity. Hydrol. Process. 2016, 30, 4934–4943. [Google Scholar] [CrossRef]
- Viviroli, D.; Dürr, H.H.; Messerli, B.; Meybeck, M.; Weingartner, R. Mountains of the world, water towers for humanity: Typology, mapping, and global significance. Water Resour. Res. 2007, 43, 1–13. [Google Scholar] [CrossRef] [Green Version]
- Easton, Z.M.; Awulachew, S.B.; Steenhuis, T.S.; Habte, S.A.; Zemadim, B.; Seleshi, Y.; Bashar, K.E. Hydrological processes in the Blue Nile. In The Nile River Basin: Water, Agriculture, Governance and Livelihoods; Awulachew, S.B., Smakhtin, V., Molden, D., Peden, D., Eds.; Routledge: New York, NY, USA, 2012; pp. 84–111. [Google Scholar]
- Kundzewicz, Z.; Kraemer, D. Striving towards assessment of mountain water resources. In Ecohydrology of High Mountain Areas, Proceedings of the International Conference on Ecohydrology of High Mountain Areas, Katmandu, Nepal, 24–28 March 1996; ICIMOD: Katmandu, Nepal, 1996; pp. 24–28. [Google Scholar]
- Harpham, K. Taming the Tumalo: A Damned Dam Repurposed for Recharge. Master’s Thesis, Oregon State University, Corvallis, OR, USA, 2016. [Google Scholar]
- Tague, C.; Grant, G.E. A geological framework for interpreting the low-flow regimes of Cascade streams, Willamette River Basin, Oregon. Water Resour. Res. 2004, 40, 1–9. [Google Scholar] [CrossRef]
- Muñoz-Villers, L.E.; McDonnell, J.J. Runoff generation in a steep, tropical montane cloud forest catchment on permeable volcanic substrate. Water Resour. Res. 2012, 48, 1–17. [Google Scholar] [CrossRef] [Green Version]
- Iwagami, S.; Tsujimura, M.; Onda, Y.; Shimada, J.; Tanaka, T. Role of bedrock groundwater in the rainfall–runoff process in a small headwater catchment underlain by volcanic rock. Hydrol. Process. 2010, 24, 2771–2783. [Google Scholar] [CrossRef]
- Mosquera, G.M.; Lazo, P.X.; Célleri, R.; Wilcox, B.P.; Crespo, P. Runoff from tropical alpine grasslands increases with areal extent of wetlands. Catena 2015, 125, 120–128. [Google Scholar] [CrossRef]
- Mosquera, G.M.; Crespo, P.; Breuer, L.; Feyen, J.; Windhorst, D. Water transport and tracer mixing in volcanic ash soils at a tropical hillslope: A wet layered sloping sponge. Hydrol. Process. 2020. [Google Scholar] [CrossRef] [Green Version]
- Alemie, T.C.; Tilahun, S.A.; Ochoa-Tocachi, B.F.; Schmitter, P.; Buytaert, W.; Parlange, J.Y.; Steenhuis, T.S. Predicting shallow groundwater tables for sloping highland aquifers. Water Resour. Res. 2019, 55, 11088–11100. [Google Scholar] [CrossRef]
- Bayabil, H.K.; Tilahun, S.A.; Collick, A.S.; Yitaferu, B.; Steenhuis, T.S. Are runoff processes ecologically or topographically driven in the (sub) humid Ethiopian Highlands? The case of the Maybar watershed. Ecohydrology 2010, 3, 457–466. [Google Scholar] [CrossRef] [Green Version]
- Guzman, C.D.; Tilahun, S.A.; Dagnew, D.C.; Zimale, F.A.; Zegeye, A.D.; Boll, J.; Parlange, J.-Y.; Steenhuis, T.S. Spatio-temporal patterns of groundwater depths and soil nutrients in a small watershed in the Ethiopian Highlands: Topographic and land-use controls. J. Hydrol. 2017, 555, 420–434. [Google Scholar] [CrossRef]
- Tilahun, S.A.; Yilak, D.L.; Schmitter, P.; Zimale, F.A.; Langan, S.; Barron, J.; Parlange, J.Y.; Steenhuis, T.S. Establishing irrigation potential of a hillside aquifer in the African highlands. Hydrol. Process. 2020, 34, 1741–1753. [Google Scholar] [CrossRef] [Green Version]
- Caballero, L.A.; Easton, Z.M.; Richards, B.K.; Steenhuis, T.S. Evaluating the bio-hydrological impact of a cloud forest in Central America using a semi-distributed water balance model. J. Hydrol. Hydromech. 2013, 61, 9–22. [Google Scholar] [CrossRef] [Green Version]
- Langman, J.B.; Ellis, A.S. Geochemical indicators of interbasin groundwater flow within the southern Rio Grande Valley, southwestern USA. Environ. Earth Sci. 2013, 68, 1285–1303. [Google Scholar] [CrossRef]
- Parra, V.; Arumí, J.L.; Muñoz, E. Identifying a Suitable Model for Low-Flow Simulation in Watersheds of South-Central Chile: A Study Based on a Sensitivity Analysis. Water 2019, 11, 1506. [Google Scholar] [CrossRef] [Green Version]
- Arumí, J.L.; Muñoz, E.; Oyarzún, R. Andean Mountain Groundwater, Drinking Water Sources, and Vulnerability: A Case Study in Central Chile. In Groundwaters; IntechOpen Limited: London, UK, 2019. [Google Scholar] [CrossRef] [Green Version]
- Montgomery, E.L.; Rosko, M.J.; Castro, S.O.; Keller, B.R.; Bevacqua, P.S. Interbasin underflow between closed Altiplano basins in Chile. Groundwater 2003, 41, 523–531. [Google Scholar] [CrossRef]
- Zanon, C.; Genereux, D.P.; Oberbauer, S.F. Use of a watershed hydrologic model to estimate interbasin groundwater flow in a Costa Rican rainforest. Hydrol. Process. 2014, 28, 3670–3680. [Google Scholar] [CrossRef]
- Genereux, D.P.; Jordan, M. Interbasin groundwater flow and groundwater interaction with surface water in a lowland rainforest, Costa Rica: A review. J. Hydrol. 2006, 320, 385–399. [Google Scholar] [CrossRef]
- Dessie, M.; Verhoest, N.E.; Admasu, T.; Pauwels, V.R.; Poesen, J.; Adgo, E.; Deckers, J.; Nyssen, J. Effects of the floodplain on river discharge into Lake Tana (Ethiopia). J. Hydrol. 2014, 519, 699–710. [Google Scholar] [CrossRef]
- Razack, M.; Furi, W.; Fanta, L.; Shiferaw, A.J. Water Resource Assessment of a Complex Volcanic System Under Semi-Arid Climate Using Numerical Modeling: The Borena Basin in Southern Ethiopia. Water 2020, 12, 276. [Google Scholar] [CrossRef] [Green Version]
- Tebebu, T.Y.; Bayabil, H.K.; Stoof, C.R.; Giri, S.K.; Gessess, A.A.; Tilahun, S.A.; Steenhuis, T.S. Characterization of degraded soils in the humid Ethiopian Highlands. Land Degrad. Dev. 2017, 28, 1891–1901. [Google Scholar] [CrossRef] [Green Version]
- Tebebu, T.Y.; Bayabil, H.K.; Steenhuis, T.S. Can Degraded Soils be Improved by Ripping Through the Hardpan and Liming? A Field Experiment in the Humid Ethiopian Highlands. Land Degrad. Dev. 2020. [Google Scholar] [CrossRef]
- Zimale, F.A.; Tilahun, S.A.; Tebebu, T.Y.; Guzman, C.D.; Hoang, L.; Schneiderman, E.M.; Langendoen, E.J.; Steenhuis, T.S. Improving watershed management practices in humid regions. Hydrol. Process. 2017, 31, 3294–3301. [Google Scholar] [CrossRef]
- Taddese, G. Land degradation: A challenge to Ethiopia. Environ. Manag. 2001, 27, 815–824. [Google Scholar] [CrossRef]
- Mekuria, W.; Veldkamp, E.; Haile, M.; Nyssen, J.; Muys, B.; Gebrehiwot, K. Effectiveness of exclosures to restore degraded soils as a result of overgrazing in Tigray, Ethiopia. J. Arid Environ. 2007, 69, 270–284. [Google Scholar] [CrossRef]
- Dagnew, D.C.; Guzman, C.D.; Zegeye, A.D.; Tibebu, T.Y.; Getaneh, M.; Abate, S.; Zemale, F.A.; Ayana, E.K.; Tilahun, S.A.; Steenhuis, T.S. Impact of conservation practices on runoff and soil loss in the sub-humid Ethiopian Highlands: The Debre Mawi watershed. J. Hydrol. Hydromech. 2015, 63, 210–219. [Google Scholar] [CrossRef] [Green Version]
- Tadesse, L.; Suryabhagavan, K.; Sridhar, G.; Legesse, G.J. Land use and land cover changes and Soil erosion in Yezat Watershed, North Western Ethiopia. Int. Soil Water Conserv. Res. 2017, 5, 85–94. [Google Scholar] [CrossRef] [Green Version]
- Mekuria, W.; Wondie, M.; Amare, T.; Wubet, A.; Feyisa, T.; Yitaferu, B. Restoration of degraded landscapes for ecosystem services in North-Western Ethiopia. Heliyon 2018, 4, 1–25. [Google Scholar] [CrossRef] [Green Version]
- Hurni, H.; Pimentel, D. Land degradation, famine, and land resource scenarios in Ethiopia. World Soil Eros. Conserv. 1993, 27–61. [Google Scholar] [CrossRef]
- Yitbarek, T.W.; Belliethathan, S.; Stringer, L.C. The onsite cost of gully erosion and cost-benefit of gully rehabilitation: A case study in Ethiopia. Land Degrad. Dev. 2012, 23, 157–166. [Google Scholar] [CrossRef]
- Teshome, A.; Rolker, D.; de Graaff, J. Financial viability of soil and water conservation technologies in northwestern Ethiopian Highlands. Appl. Geogr. 2013, 37, 139–149. [Google Scholar] [CrossRef]
- Haregeweyn, N.; Tsunekawa, A.; Nyssen, J.; Poesen, J.; Tsubo, M.; Meshesha, D.T.; Schütt, B.; Adgo, E.; Tegegne, F. Soil erosion and conservation in Ethiopia A review. Prog. Phys. Geogr. Earth Environ. 2015, 39, 750–774. [Google Scholar] [CrossRef] [Green Version]
- Mengistu, D.; Bewket, W.; Lal, R. Conservation Effects on Soil Quality and Climate Change Adaptability of Ethiopian Watersheds. Land Degrad. Dev. 2015, 27, 1603–1621. [Google Scholar] [CrossRef]
- Shiferaw, B.; Holden, S. Poverty, resource scarcity, and incentives for soil and water conservation: Analysis of interactions with a bio-economic model. In Proceedings of the 25th International Conference of Agricultural Economists, Durban, South Africa, 16–22 August 2003. [Google Scholar]
- Welle, S.; Chantawarangul, K.; Nontananandh, S.; Jantawat, S. Effectiveness of grass strips as barrier against runoff and soil loss in Jijiga area, northern part of Somali region, Ethiopia. Witthayasan Kasetsat Witthayasat 2006, 40, 549–558. [Google Scholar]
- Araya, T.; Cornelis, W.; Nyssen, J.; Govaerts, B.; Bauer, H.; Gebreegziabher, T.; Oicha, T.; Raes, D.; Sayre, K.D.; Haile, M. Effects of conservation agriculture on runoff, soil loss and crop yield under rainfed conditions in Tigray, Northern Ethiopia. Soil Use Manag. 2011, 27, 404–414. [Google Scholar] [CrossRef]
- Araya, T.; Cornelis, W.M.; Nyssen, J.; Govaerts, B.; Getnet, F.; Bauer, H.; Amare, K.; Raes, D.; Haile, M.; Deckers, J. Medium-term effects of conservation agriculture based cropping systems for sustainable soil and water management and crop productivity in the Ethiopian Highlands. Field Crops Res. 2012, 132, 53–62. [Google Scholar] [CrossRef]
- Bewket, W.; Sterk, G. Farmers’ participation in soil and water conservation activities in the Chemoga watershed, Blue Nile basin, Ethiopia. Land Degrad. Dev. 2002, 13, 189–200. [Google Scholar] [CrossRef]
- Taye, G.; Poesen, J.; Deckers, J.; Tekka, D.; Haregeweyn, N.; van Wesemael, B.; Nyssen, J. The effect of soil and water conservation treatments on rainfall-runoff response and soil losses in the Northern Ethiopian Highlands: The case of May Leiba catchment. In Excursion Guide: Post-Conference Excursion: Geomorphological Hazards, Land Degradation and Resilience in the North Ethiopian Highlands; Ethiopian Association of Geomorphologists (EAG): Addis Ababa, Ethiopia, 2011; pp. 86–92. [Google Scholar]
- Alemu, W.G.; Amare, T.; Yitaferu, B.; Selassie, Y.G.; Wolfgramm, B.; Hurni, H. Impacts of soil and water conservation on land suitability to crops: The case of Anjeni Watershed, Northwest Ethiopia. J. Agric. Sci. 2013, 5, 95. [Google Scholar] [CrossRef] [Green Version]
- Adimassu, Z.; Mekonnen, K.; Yirga, C.; Kessler, A. Effect of soil bunds on runoff, soil and nutrient losses, and crop yield in the central highlands of Ethiopia. Land Degrad. Dev. 2014, 25, 554–564. [Google Scholar] [CrossRef]
- Nyssen, J.; Clymans, W.; Poesen, J.; Vandecasteele, I.; De Baets, S.; Haregeweyn, N.; Naudts, J.; Hadera, A.; Moeyersons, J.; Haile, M. How soil conservation affects the catchment sediment budget—A comprehensive study in the north Ethiopian Highlands. Earth Surface Process. Landf. 2009, 34, 1216–1233. [Google Scholar] [CrossRef]
- Nyssen, J.; Clymans, W.; Descheemaeker, K.; Poesen, J.; Vandecasteele, I.; Vanmaercke, M.; Zenebe, A.; Camp, M.V.; Haile, M.; Haregeweyn, N.; et al. Impact of soil and water conservation measures on catchment hydrological response—A case in north Ethiopia. Hydrol. Process. 2010, 24, 1880–1895. [Google Scholar] [CrossRef] [Green Version]
- Gebrernichael, D.; Nyssen, J.; Poesen, J.; Deckers, J.; Haile, M.; Govers, G.; Moeyersons, J. Effectiveness of stone bunds in controlling soil erosion on cropland in the Tigray Highlands, northern Ethiopia. Soil Use Manag. 2005, 21, 287–297. [Google Scholar] [CrossRef]
- Descheemaeker, K.; Nyssen, J.; Poesen, J.; Raes, D.; Haile, M.; Muys, B.; Deckers, S. Runoff on slopes with restoring vegetation: A case study from the Tigray Highlands, Ethiopia. J. Hydrol. 2006, 331, 219–241. [Google Scholar] [CrossRef]
- Girmay, G.; Singh, B.; Nyssen, J.; Borrosen, T. Runoff and sediment-associated nutrient losses under different land uses in Tigray, Northern Ethiopia. J. Hydrol. 2009, 376, 70–80. [Google Scholar] [CrossRef]
- Hurni, H. Degradation and conservation of the resources in the Ethiopian Highlands. Mt. Res. Dev. 1988, 123–130. [Google Scholar] [CrossRef]
- Nyssen, J.; Poesen, J.; Moeyersons, J.; Deckers, J.; Haile, M.; Lang, A. Human impact on the environment in the Ethiopian and Eritrean highlands—A state of the art. Earth-Sci. Rev. 2004, 64, 273–320. [Google Scholar] [CrossRef]
- Bewket, W.; Sterk, G. Dynamics in land cover and its effect on stream flow in the Chemoga watershed, Blue Nile basin, Ethiopia. Hydrol. Process. Int. J. 2005, 19, 445–458. [Google Scholar] [CrossRef]
- Gebresamuel, G.; Singh, B.R.; Dick, Ø. Land-use changes and their impacts on soil degradation and surface runoff of two catchments of Northern Ethiopia. Acta Agric. Scand. Sect. B Soil Plant Sci. 2010, 60, 211–226. [Google Scholar] [CrossRef]
- Taye, G.; Poesen, J.; Wesemael, B.V.; Vanmaercke, M.; Teka, D.; Deckers, J.; Goosse, T.; Maetens, W.; Nyssen, J.; Hallet, V. Effects of land use, slope gradient, and soil and water conservation structures on runoff and soil loss in semi-arid Northern Ethiopia. Phys. Geogr. 2013, 34, 236–259. [Google Scholar] [CrossRef] [Green Version]
- Engda, T.A.; Bayabil, H.K.; Legesse, E.S.; Ayana, E.K.; Tilahun, S.A.; Collick, A.S.; Easton, Z.M.; Rimmer, A.; Awulachew, S.B.; Steenhuis, T.S. Watershed hydrology of the (semi) humid Ethiopian Highlands. In Nile River Basin; Springer: Berlin/Heidelberg, Germany, 2011; pp. 145–162. [Google Scholar] [CrossRef]
- Tilahun, S.A.; Ayana, E.K.; Guzman, C.D.; Dagnew, D.C.; Zegeye, A.D.; Tebebu, T.Y.; Yitaferu, B.; Steenhuis, T.S. Revisiting storm runoff processes in the upper Blue Nile basin: The Debre Mawi watershed. Catena 2016, 143, 47–56. [Google Scholar] [CrossRef] [Green Version]
- Di Paola, G. The Ethiopian Rift Valley (between 7 00′ and 8 40′ lat. north). Bull. Volcanol. 1972, 36, 517–560. [Google Scholar] [CrossRef]
- Woldegabriel, G.; Aronson, J.L.; Walter, R.C. Geology, geochronology, and rift basin development in the central sector of the Main Ethiopia Rift. Geol. Soc. Am. Bull. 1990, 102, 439–458. [Google Scholar] [CrossRef]
- Tebebu, T.Y.; Steenhuis, T.S.; Dagnew, D.C.; Guzman, C.D.; Bayabil, H.K.; Zegeye, A.D.; Collick, A.S.; Langan, S.; MacAlister, C.; Langendoen, E.J. Improving efficacy of landscape interventions in the (sub) humid Ethiopian Highlands by improved understanding of runoff processes. Front. Earth Sci. 2015, 3, 49. [Google Scholar] [CrossRef] [Green Version]
- Steenhuis, T.; Enkamil, M.; Asmare, D.; Tilahun, S.; Yitaferu, B.; Worqlul, A.; Zemadin, B.; MacAlister, C.; Baker, T.; Langan, S. Evaluation of rain water management practices for sediment load reduction in the (semi) humid Blue Nile basin. In Rainwater Management for Resilient Livelihoods in Ethiopia, Proceedings of the Nile Basin Development Challenge Science Meeting, Addis Ababa, 9–10 July 2013; Mekuria, W., Ed.; NBDC Technical Report 5; International Livestock Research Institute: Nairobi, Kenya, 2013. [Google Scholar]
- Abate, M.; Nyssen, J.; Moges, M.M.; Enku, T.; Zimale, F.A.; Tilahun, S.A.; Adgo, E.; Steenhuis, T. Long-Term Landscape Changes in the Lake Tana Basin as Evidenced by Delta Development and Floodplain Aggradation in Ethiopia. Land Degrad. Dev. 2017, 28, 1820–1830. [Google Scholar] [CrossRef]
- Tebebu, T.Y.; Abiy, A.Z.; Dahlke, H.E.; Zegeye, A.D.; Easton, Z.M.; Tilahun, S.A.; Collick, A.S.; Kidnau, S.; Moges, S.; Dadgari, F.; et al. Surface and subsurface flow effects on permanent gully formation and upland erosion near Lake Tana in the northern Highlands of Ethiopia. Hydrol. Earth Syst. Sci. 2010, 14, 2207–2217. [Google Scholar] [CrossRef] [Green Version]
- Bayabil, H.K.; Yiftaru, B.; Steenhuis, T.S. Shift from transport limited to supply limited sediment concentrations with the progression of monsoon rains in the Upper Blue Nile Basin. Earth Surface Process. Landf. 2017, 42, 1317–1328. [Google Scholar] [CrossRef]
- Steiner, K.G. Causes of Soil Degradation and Development Approaches to Sustainable soil Management; Margraf Verlag: Weikersheim, Germany, 1996. [Google Scholar]
- Adem, A.A.; Aynalem, D.W.; Tilahun, S.A.; Steenhuis, T.S. Predicting Reference Evaporation for the Ethiopian Highlands. J. Water Resour. Prot. 2017, 9, 1244–1269. [Google Scholar] [CrossRef] [Green Version]
- Hofmann, C.; Courtillot, V.; Feraud, G.; Rochette, P.; Yirgu, G.; Ketefo, E.; Pik, R. Timing of the Ethiopian flood basalt event and implications for plume birth and global change. Nature 1997, 389, 838–841. [Google Scholar] [CrossRef]
- Ukstins, I.A.; Renne, P.R.; Wolfenden, E.; Baker, J.; Ayalew, D.; Menzies, M. Matching conjugate volcanic rifted margins: 40Ar/39Ar chrono-stratigraphy of pre-and syn-rift bimodal flood volcanism in Ethiopia and Yemen. Earth Planet. Sci. Lett. 2002, 198, 289–306. [Google Scholar] [CrossRef]
- Ayalew, D.; Barbey, P.; Marty, B.; Reisberg, L.; Yirgu, G.; Pik, R. Source, genesis, and timing of giant ignimbrite deposits associated with Ethiopian continental flood basalts. Geochim. Cosmochim. Acta 2002, 66, 1429–1448. [Google Scholar] [CrossRef]
- Wolfenden, E.; Ebinger, C.; Yirgu, G.; Deino, A.; Ayalew, D. Evolution of the northern Main Ethiopian rift: Birth of a triple junction. Earth Planet. Sci. Lett. 2004, 224, 213–228. [Google Scholar] [CrossRef]
- Jepsen, D.; Athearn, M. Land and Water Resources of the Blue Nile River Basin, Appendix II-Geology; US Department of Interior/Ethiopia’s Water Resources Department: Addis Ababa, Ethiopia, 1964; Volume 221. [Google Scholar]
- Pik, R.; Marty, B.; Carignan, J.; Lavé, J. Stability of the Upper Nile drainage network (Ethiopia) deduced from (U–Th)/He thermochronometry: Implications for uplift and erosion of the Afar plume dome. Earth Planet. Sci. Lett. 2003, 215, 73–88. [Google Scholar] [CrossRef]
- Pik, R.; Deniel, C.; Coulon, C.; Yirgu, G.; Hofmann, C.; Ayalew, D. The northwestern Ethiopian Plateau flood basalts: Classification and spatial distribution of magma types. J. Volcanol. Geotherm. Res. 1998, 81, 91–111. [Google Scholar] [CrossRef]
- Abbate, E.; Albianelli, A.; Azzaroli, A.; Benvenuti, M.; Tesfamariam, B.; Bruni, P.; Cipriani, N.; Clarke, R.J.; Ficcarelli, G.; Macchiarelli, R. A one-million-year-old Homo cranium from the Danakil (Afar) Depression of Eritrea. Nature 1998, 393, 458–460. [Google Scholar] [CrossRef]
- Fantaye, S.M. Integrated Hydrological and Hydrogeological System Analysis of the Lake Tana Basin, Northwestern Ethiopia. Ph.D. Thesis, Addis Ababa University, Addis Ababa, Ethiopia, 2015. [Google Scholar]
- Kebede, S.; Hailu, A.; Crane, E.Ó.; Dochartaigh, B.É.; Bellwood-Howard, I. Africa Groundwater Atlas: Hydrogeology of Ethiopia. British Geological Survey. Available online: http://earthwise.bgs.ac.uk/index.php/Hydrogeology_of_Ethiopia (accessed on 28 August 2019).
- Chorowicz, J.; Collet, B.; Bonavia, F.; Mohr, P.; Parrot, J.; Korme, T. The Tana basin, Ethiopia: Intra-plateau uplift, rifting and subsidence. Tectonophysics 1998, 295, 351–367. [Google Scholar] [CrossRef]
- Bense, V.; Gleeson, T.; Loveless, S.; Bour, O.; Scibek, J. Fault zone hydrogeology. Earth-Sci. Rev. 2013, 127, 171–192. [Google Scholar] [CrossRef]
- Abdullah, A.; Akhir, J.M.; Abdullah, I. Automatic mapping of lineaments using shaded relief images derived from digital elevation model (DEMs) in the Maran—Sungi Lembing area, Malaysia. Electron. J. Geotech. Eng. 2010, 15, 949–958. [Google Scholar]
- MoWE. Geological Map of the Tana Sub-Basin, Detailed Groundwater Investigations & Monitoring in Tana and Beles Sub-Basins; Final Stage 1 Report—Part 3: Geological and Geomorphological Survey, Sogreah Consultants and Geomatrix PLC; Ministry of Water and Energy (MoWE): Addis Ababa, Ethiopia, 2011.
- Salui, C.L. Methodological Validation for Automated Lineament Extraction by LINE Method in PCI Geomatica and MATLAB based Hough Transformation. J. Geol. Soc. India 2018, 92, 321–328. [Google Scholar] [CrossRef]
- Nathan, R.; McMahon, T. Evaluation of automated techniques for base flow and recession analyses. Water Resour. Res. 1990, 26, 1465–1473. [Google Scholar] [CrossRef]
- Lyne, V.; Hollick, M. Stochastic time-variable rainfall-runoff modelling. In Engineering Management Conference 1979, Melbourne, 21-22 March 1979; Institution of Engineers: Barton, Australia, 1979; pp. 89–93. [Google Scholar]
- Arnold, J.; Allen, P.; Muttiah, R.; Bernhardt, G. Automated base flow separation and recession analysis techniques. Groundwater 1995, 33, 1010–1018. [Google Scholar] [CrossRef]
- Arnold, J.G.; Allen, P.M. Automated methods for estimating baseflow and ground water recharge from streamflow records 1. J. Am. Water Resour. Assoc. 1999, 35, 411–424. [Google Scholar] [CrossRef]
- Partington, D.; Brunner, P.; Simmons, C.; Werner, A.; Therrien, R.; Maier, H.; Dandy, G. Evaluation of outputs from automated baseflow separation methods against simulated baseflow from a physically based, surface water-groundwater flow model. J. Hydrol. 2012, 458, 28–39. [Google Scholar] [CrossRef] [Green Version]
- Mohr, P.; Rogers, A.S. Gravity traverses in Ethiopia (second interim report). Bull. Geophys. Obs. Addis Ababa 1966, 9, 7–58. [Google Scholar]
- Guzman, C.; Tilahun, S.; Zegeye, A.; Steenhuis, T. Suspended sediment concentration–discharge relationships in the (sub-) humid Ethiopian Highlands. Hydrol. Earth Syst. Sci. 2013, 17, 1067–1077. [Google Scholar] [CrossRef] [Green Version]
- Mhiret, D.A.; Dagnew, D.C.; Alemie, T.C.; Guzman, C.D.; Tilahun, S.A.; Zaitchik, B.F.; Steenhuis, T.S. Impact of Soil Conservation and Eucalyptus on Hydrology and Soil Loss in the Ethiopian Highlands. Water 2019, 11, 2299. [Google Scholar] [CrossRef] [Green Version]
- Scibek, J.; Gleeson, T.; McKenzie, J. The biases and trends in fault zone hydrogeology conceptual models: Global compilation and categorical data analysis. Geofluids 2016, 16, 782–798. [Google Scholar] [CrossRef]
- Tilahun, S.; Guzman, C.; Zegeye, A.; Engda, T.; Collick, A.; Rimmer, A.; Steenhuis, T. An efficient semi-distributed hillslope erosion model for the subhumid Ethiopian Highlands. Hydrol. Earth Syst. Sci. 2013, 17, 1051–1063. [Google Scholar] [CrossRef] [Green Version]
- Kahsay, K.D.; Pingale, S.M.; Hatiye, S.D. Impact of climate change on groundwater recharge and base flow in the sub-catchment of Tekeze basin, Ethiopia. Groundw. Sustain. Dev. 2018, 6, 121–133. [Google Scholar] [CrossRef]
- Abiy, A.Z.; Melesse, A.M.; Behabtu, Y.M.; Abebe, B. Groundwater Vulnerability Analysis of the Tana Sub-basin: An Application of DRASTIC Index Method. In Landscape Dynamics, Soils and Hydrological Processes in Varied Climates; Springer: Berlin/Heidelberg, Germany, 2016; pp. 435–461. [Google Scholar]
- Nigate, F.; Ayenew, T.; Belete, W.; Walraevens, K. Overview of the Hydrogeology and Groundwater Occurrence in the Lake Tana Basin, Upper Blue Nile River Basin. In Social and Ecological System Dynamics; Springer: Berlin/Heidelberg, Germany, 2017; pp. 77–91. [Google Scholar]
- Kebede, S. Groundwater as strategic resource. In Groundwater in Ethiopia; Springer: Berlin/Heidelberg, Germany, 2013; pp. 247–264. [Google Scholar]
- Ochoa, C.G.; Caruso, P.; Ray, G.; Deboodt, T.; Jarvis, W.T.; Guldan, S.J. Ecohydrologic connections in semiarid watershed systems of central Oregon USA. Water 2018, 10, 181. [Google Scholar] [CrossRef] [Green Version]
- Fontes, J.; Pereira, L.; Smith, R. Runoff and erosion in volcanic soils of Azores: Simulation with OPUS. Catena 2004, 56, 199–212. [Google Scholar] [CrossRef]
- Zegeye, A.D.; Langendoen, E.J.; Stoof, C.R.; Tilahun, S.A.; Dagnew, D.C.; Zimale, F.A.; Guzman, C.D.; Yitaferu, B.; Steenhuis, T.S. Morphological dynamics of gully systems in the sub-humid Ethiopian Highlands: The Debre Mawi watershed. Soils 2016, 2, 443–458. [Google Scholar] [CrossRef] [Green Version]
- Guzman, C.D.; Zimale, F.A.; Tebebu, T.Y.; Bayabil, H.K.; Tilahun, S.A.; Yitaferu, B.; Rientjes, T.H.M.; Steenhuis, T.S. Modeling discharge and sediment concentrations after landscape interventions in a humid monsoon climate: The Anjeni watershed in the highlands of Ethiopia. Hydrol. Process. 2017, 31, 1239–1257. [Google Scholar] [CrossRef]
- Steenhuis, T.; Easton, Z.; Awulachew, S.B.; Ahmed, A.; Bashar, K.; Adgo, E.; Selassie, Y.; Tilahun, S. The Nile Basin sediment loss and degradation, with emphasis on the Blue Nile. In The Nile River Basin—Water, Agriculture, Governance and Livelihoods; Awulachew, S.B., Smakhtin, V., Molden, D., Peden, D., Eds.; Earthscan from Routledge: London, UK, 2012; pp. 112–132. [Google Scholar]
- Zimale, F.A.; Moges, M.A.; Alemu, M.L.; Ayana, E.K.; Demissie, S.S.; Tilahun, S.A.; Steenhuis, T.S. Hydromechanics. Budgeting suspended sediment fluxes in tropical monsoonal watersheds with limited data: The Lake Tana basin. J. Hydrol. Hydromech. 2018, 66, 65–78. [Google Scholar] [CrossRef] [Green Version]
- Dagnew, D.C.; Guzman, C.D.; Zegeye, A.D.; Akal, A.T.; Moges, M.A.; Tebebu, T.Y.; Mekuria, W.; Ayana, E.K.; Tilahun, S.A.; Steenhuis, T.S. Sediment Loss Patterns in the Sub-Humid Ethiopian Highlands. Land Degrad. Dev. 2017, 28, 1795–1805. [Google Scholar] [CrossRef]
- Ayele, G.K.; Addisie, M.B.; Langendoen, E.J.; Tegegne, N.H.; Tilahun, S.A.; Moges, M.A.; Nicholson, C.F.; Steenhuis, T.S. Evaluating erosion control practices in an actively gullying watershed in the highlands of Ethiopia. Earth Surface Process. Landf. 2018, 43, 2835–2843. [Google Scholar] [CrossRef]
- WLRC. Long-Term Agro-Climate and Hydro-Sediment Observatory Report: Case of Maybar Micro-Watershed, Awash River Basin, Ethiopia; Water and Land Resources Centre (WLRC): Addis Ababa, Ethiopia, 2016. [Google Scholar]
- Gebrehiwot, S.G.; Ilstedt, U.; Gärdenäs, A.; Bishop, K. Hydrological characterization of watersheds in the Blue Nile Basin, Ethiopia. Hydrol. Earth Syst. Sci. 2011, 15, 11–20. [Google Scholar] [CrossRef] [Green Version]
- Akale, A.T.; Dagnew, D.C.; Belete, M.A.; Tilahun, S.A.; Mekuria, W.; Steenhuis, T.S. Impact of soil depth and topography on the effectiveness of conservation practices on discharge and soil loss in the Ethiopian Highlands. Land 2017, 6, 78. [Google Scholar] [CrossRef] [Green Version]
- Guerra, J.; Arbelo, C.; Armas, C.; Mora, J.; Rodríguezt, A. Water erosion rates and mechanisms in andosols and volcanic aridisols in two contrasting bioclimatic regions (Canary Islands, Spain). In Proceedings of the ISCO 2004 13th International Soil Conservation Organization Conference, Sharing Solutions, Brisbane, Australia, 4–8 July 2004. [Google Scholar]
- Toohey, R.C.; Boll, J.; Brooks, E.S.; Jones, J.R. Effects of land use on soil properties and hydrological processes at the point, plot, and catchment scale in volcanic soils near Turrialba, Costa Rica. Geoderma 2018, 315, 138–148. [Google Scholar] [CrossRef]
Figure 1.
The Gomit watershed situated in (a) Ethiopia, (b) Lake Tana basin with Rib and (c) the locations in the Gomit watershed of streamflow gauging (Wier-1 and Weir-2), rain gauge, piezometers, arc-weirs, gabion check dams, and lithology. The approximate location of the main normal fault line (orange line) based on information of the Ministry of Water and Energy is shown. The yellow filled circles are wells that contained water during the growing season.

Figure 2.
Physical and biological conservation practices in Gomit watershed: (a) bunds with trachyte plug in the background, (b) arc-weir, (c) gabion check dam, and (d) protected forested land.
Figure 2.
Physical and biological conservation practices in Gomit watershed: (a) bunds with trachyte plug in the background, (b) arc-weir, (c) gabion check dam, and (d) protected forested land.

Figure 3.
Mean monthly wet season rainfall in 2015, 2016, and 2017 in the Gomit watershed.

Figure 4.
Daily rainfall of Gomit watershed.

Figure 5.
Map of the Gomit watershed with rain gauges, piezometers, spring, and borehole. The approximate locations of the major fault lines (red lines) and lineaments (yellow dashed lines) were identified by various methods. The yellow filled circles are the wells that contained water during the growing season.

Figure 6.
Images showing (a) the intersection of the stream channel with jointed and faulted basaltic units trending in the northwest direction in the forested watershed. The dip angle of the fault plane (white lines) is opposite the hillslope and the stream flow direction; (b) Acacia trees that grow along Figure 6. Specifically, we noted that the fine-grained aphanitic basalt outcrops in the northeastern part of the watershed (a) were intersected by joints and faults. The basaltic unit was tilting and jointed and had a thickness ranging from 1.5 to 2 m. It was highly fractured with a WNW dipping direction. In addition, during the field visit, we identified small scale faults with minor displacement on the dark gray and aphanitic basalt with the major strike direction in an NW-SE direction (c). The spring identified above was associated with these minor faults. Finally, our field visits noted that deep-rooted acacia trees were associated with the faults (b). We also found, in addition to the major trachyte plug, several smaller plugs on the northern part of the Gomit watershed (b). Talus deposits that cover the plugs have large open pore spaces that facilitate the flow of water to the fissures.

Figure 7.
Shallow groundwater for installed piezometers in the Gomit watershed for the year 2016. The piezometers P4, P5, P7, P10, P16, and P23 were located downslope and the P2, P13, and P19 on the midslope. The remaining 14 piezometers at mid- and up-slope positions remained dry. The locations of the piezometers are depicted in Figure 1: (a) plotted as depth from the soil surface and (b) plotted as height above the bottom of the piezometer.

Figure 8.
Baseflow and surface runoff volume in comparison with rainfall for (a) forested watershed at weir-2, (b) agricultural downstream area, and (c) entire Gomit watershed at weir-1.
Figure 8.
Baseflow and surface runoff volume in comparison with rainfall for (a) forested watershed at weir-2, (b) agricultural downstream area, and (c) entire Gomit watershed at weir-1.

Figure 9.
Surface runoff and sediment concentration for (a) forested watershed at weir-2, (b) the agricultural downstream area, and (c) Gomit watershed at weir-1.
Figure 9.
Surface runoff and sediment concentration for (a) forested watershed at weir-2, (b) the agricultural downstream area, and (c) Gomit watershed at weir-1.

Figure 10.
Fourteen-day averaged storm suspended sediment concentration and runoff depth for the (a) forested, (b) agricultural, and (c) entire Gomit watershed. The regression lines have the same colors as the symbols.
Figure 10.
Fourteen-day averaged storm suspended sediment concentration and runoff depth for the (a) forested, (b) agricultural, and (c) entire Gomit watershed. The regression lines have the same colors as the symbols.

Figure 11.
The relationship between (a) baseflow rise at weir 2 and water height at piezometer 16; and (b) baseflow rise at weir 1 and water height at piezometer 4.
Figure 11.
The relationship between (a) baseflow rise at weir 2 and water height at piezometer 16; and (b) baseflow rise at weir 1 and water height at piezometer 4.

Figure 12.
The relation between runoff coefficient (RC) and watershed area. (a) Ethiopian Highlands Orange dots indicate group 1 watersheds including Gomit, Tikur Wuha, Megech, Rib, and Beles. Blue dots show group 2 watersheds including Gumara, Gilgel Abay, Dirma, Gibera, Gelda, Koga, Maybar, Anjeni, Andit Tid, Debre Mawi, May Zeg Zeg, Birr, and Guale (Table A3) watershed in the volcanic mountainous area in the world (squares, see Table A4 in the Appendix A for more information). (b) the Ethiopian highland watersheds and some global volcanic watersheds from Ecuador, Chile, Costa Rica and USA.

Figure 13.
Mean monthly runoff, sediment yield, and concentrations of (a) forested watershed, (b) agricultural downstream watershed, and (c) the entire Gomit watershed.
Figure 13.
Mean monthly runoff, sediment yield, and concentrations of (a) forested watershed, (b) agricultural downstream watershed, and (c) the entire Gomit watershed.

Table 1.
Characteristics, land use, and land management practices of the upper forested and downslope agricultural and the entire Gomit watershed. LWM: land and water management practices.
Table 1.
Characteristics, land use, and land management practices of the upper forested and downslope agricultural and the entire Gomit watershed. LWM: land and water management practices.
| Land Water Management Practices | Forested | Agricultural | Entire Watershed | |
|---|---|---|---|---|
| Area (ha) | - | 196 | 163 | 359 |
| Longest flow path (km) | - | 2.9 | 2.4 | 4.8 |
| Elevation range (m asl) | - | 2013–2612 | 1974–2159 | 1974–2612 |
| Arc weir (no.) | Locally adapted type of conservation structure | 0 | 9 | 9 |
| Gabion check dam (no.) | - | 15 | 27 | 42 |
| Bush and shrubland (%) | None | 19 | 7 | 15 |
| Bush and shrubland (%) | Enclosures | 51 | 5 | 35 |
| Bush and shrubland (%) | Contains infiltration furrows and stone bunds | 7 | 7 | 7 |
| Cultivated land (%) | 7 | 3 | 5 | |
| Cultivated land (%) | Contain infiltration furrows, stone, and soil bunds | 4 | 42 | 17 |
| Farm and village (%) | None | - | 14 | 5 |
| Grazing land (%) | None | 0.3 | 8 | 3 |
| Eucalyptus (%) | None | - | 3 | 1 |
| Natural forest (%) | Enclosures | 11 | - | 7 |
| Town village (%) | None | - | 11 | 4 |
Table 2.
Infiltration rates (IR) and the probability of exceedance (PE) of different land uses at three slope categories in the Gomit watershed.
Table 2.
Infiltration rates (IR) and the probability of exceedance (PE) of different land uses at three slope categories in the Gomit watershed.
| Land Use | Bottom Slope | Mid Slope | Upslope | |||
|---|---|---|---|---|---|---|
| IR (mm h−1) | PE % | IR (mm h−1) | PE % | IR (mm h−1) | PE % | |
| Bush and shrub land | 132 | 0.6 | 156 | 0.2 | 204 | 0.1 |
| Cultivated (Bean) | 156 | 0.2 | 288 | 0.0 | 432 | 0.0 |
| Cultivated (Finger millet) | 120 | 0.8 | 216 | 0.0 | 336 | 0.0 |
| Cultivated (Maize) | 144 | 0.4 | 468 | 0.0 | 468 | 0.0 |
| Cultivated (Teff) | 24 | 17.5 | 108 | 1.1 | 60 | 4.3 |
| Grazing land | 12 | 34.7 | 72 | 3.1 | 120 | 0.8 |
| Mean | 98 | 9.0 | 218 | 0.7 | 270 | 0.9 |
| Median | 126 | 0.7 | 186 | 0.1 | 270 | 0.1 |
Table 3.
Rainfall, direct runoff (surface flow and interflow), baseflow, and runoff coefficient for the entire Gomit watershed, the forested watershed, and the downstream agricultural area.
Table 3.
Rainfall, direct runoff (surface flow and interflow), baseflow, and runoff coefficient for the entire Gomit watershed, the forested watershed, and the downstream agricultural area.
| Watershed. | Year | Rainfall mm a−1 | Direct Runoff mm a−1 | Baseflow mm a−1 | Total Runoff mm a−1 | Rainfall-Runoff Ratio % |
|---|---|---|---|---|---|---|
| Forested | 2015 | 894 | 11 | 2 | 13 | 2 |
| 2016 | 988 | 32 | 21 | 53 | 5 | |
| 2017 | 1042 | 25 | 8 | 33 | 3 | |
| Mean | 975 | 23 | 10 | 33 | 3 | |
| St. Dev. * | 75 | 11 | 10 | 20 | 2 | |
| Agricultural | 2015 | 894 | 43 | 17 | 60 | 8 |
| 2016 | 988 | 54 | 66 | 120 | 12 | |
| 2017 | 1042 | 23 | 117 | 140 | 13 | |
| Mean | 975 | 40 | 67 | 107 | 11 | |
| St. Dev. | 75 | 16 | 50 | 42 | 3 | |
| Entire | 2015 | 894 | 24 | 9 | 33 | 4 |
| 2016 | 988 | 40 | 40 | 80 | 8 | |
| 2017 | 1042 | 57 | 22 | 79 | 8 | |
| Mean | 975 | 40 | 24 | 64 | 7 | |
| St. Dev. | 75 | 17 | 16 | 27 | 2 |
* Standard deviation.
Table 4.
Monthly sediment yields for forested, agricultural, and the entire Gomit watershed.
| Month | Sediment Yield (Mg ha−1) | ||||||||
|---|---|---|---|---|---|---|---|---|---|
| Entire Watershed | Forested Part | Agricultural Part | |||||||
| 2015 | 2016 | 2017 | 2015 | 2016 | 2017 | 2015 | 2016 | 2017 | |
| March | - | - | 0.002 | - | - | 0.01 | - | - | 0.003 |
| April | - | - | 0.04 | - | - | 0.10 | - | - | 0.04 |
| May | - | 0.13 | 0.26 | - | 0.01 | 0.11 | - | 0.28 | 1.00 |
| June | 0.002 | 0.67 | 0.32 | - | 0.38 | 0.20 | - | 1.02 | 0.34 |
| July | 2.13 | 6.12 | 0.94 | 0.12 | 1.39 | 0.78 | 4.53 | 11.8 | 1.97 |
| August | 0.33 | 0.6 | 0.38 | 0.14 | 0.65 | 0.20 | 0.55 | 0.55 | 0.53 |
| September | 0.14 | 0.05 | 0.32 | 0.7 | 0.09 | 0.24 | 0.53 | 0.02 | 0.06 |
| October | - | - | 0.01 | - | - | 0.07 | - | - | 0.07 |
| Total | 2.6 | 7.6 | 2.3 | 1.0 | 2.5 | 1.7 | 5.6 | 13.7 | 4.0 |
Table 5.
Mean annual sediment yield and daily average sediment concentration in some Ethiopian watersheds.
Table 5.
Mean annual sediment yield and daily average sediment concentration in some Ethiopian watersheds.
| Basin/Watershed | Area (ha) | Mean Annual Sediment Yield (Mg ha−1a−1) | Daily Average Sediment Concentration (g L−1) | Source |
|---|---|---|---|---|
| Blue Nile | 17,600,000 | 7 | 3.8 | Steenhuis et al. [101] |
| Gilgel Abay | 166,500 | 35.4 | 1.8 | Zimale et al. [102] |
| Gumara | 128,100 | 49.4 | 3.3 | |
| Rib | 128,900 | 24.6 | 4.8 | |
| Megech | 50,000 | 12.2 | 0.77 | |
| Debre Mawi | 95 | 62.1 ͼ | 12.9 ͼ | Dagnew et al. [31], Dagnew et al. [103] |
| 11.6 ͼͼ | 10.9 ͼͼ | |||
| Ene-Chilala-1 | 76 | 7.6 ͼ | 1.7 ͼ | Ayele et al. [104] |
| 2.1 ͼͼ | 1 ͼͼ | |||
| Ene-Chilala-2 | 146 | 19.5 ͼ | 2.5 ͼ | |
| 3 ͼͼ | 0.9 ͼ ͼ | |||
| Ene-Chilala-3 | 192 | 135.6 ͼ | 8.2 ͼ | |
| 18.3 ͼͼ | 4 ͼͼ | |||
| Maybar | 113 | 10.3 | - | WLRC [105] |
| Anjeni | 108 | 57.2 ͼ | - | Guzman et al. [99] |
| 6.3 ͼͼ | ||||
| Andit Tid | 477 | 5.2 | - | Guzman et al. [89] |
| May Zeg-Zeg | 187 | 14.3 ͼ | - | Nyssen et al. [47] |
| 9 ͼͼ | ||||
| Gomit (entire) | 369 | 4.2 | 13.6 | This study |
| Gomit (Forested) | 196 | 1.7 | 14.4 |
ͼ before SWC, ͼͼ after SWC.
© 2020 by the authors. Licensee MDPI, Basel, Switzerland. This article is an open access article distributed under the terms and conditions of the Creative Commons Attribution (CC BY) license (http://creativecommons.org/licenses/by/4.0/).
Share and Cite
MDPI and ACS Style
Adem, A.A.; Addis, G.G.; Aynalem, D.W.; Tilahun, S.A.; Mekuria, W.; Azeze, M.; Steenhuis, T.S. Hydrogeology of Volcanic Highlands Affects Prioritization of Land Management Practices. Water 2020, 12, 2702. https://doi.org/10.3390/w12102702
AMA Style
Adem AA, Addis GG, Aynalem DW, Tilahun SA, Mekuria W, Azeze M, Steenhuis TS. Hydrogeology of Volcanic Highlands Affects Prioritization of Land Management Practices. Water. 2020; 12(10):2702. https://doi.org/10.3390/w12102702
Chicago/Turabian StyleAdem, Anwar A., Gashaw G. Addis, Dessalew W. Aynalem, Seifu A. Tilahun, Wolde Mekuria, Mulugeta Azeze, and Tammo S. Steenhuis. 2020. "Hydrogeology of Volcanic Highlands Affects Prioritization of Land Management Practices" Water 12, no. 10: 2702. https://doi.org/10.3390/w12102702
Note that from the first issue of 2016, this journal uses article numbers instead of page numbers. See further details here.