Nitrate Contamination in Brazilian Urban Aquifers: A Tenacious Problem

 ,
,  , , ,
, , ,  , , , , and
Abstract
:1. Introduction
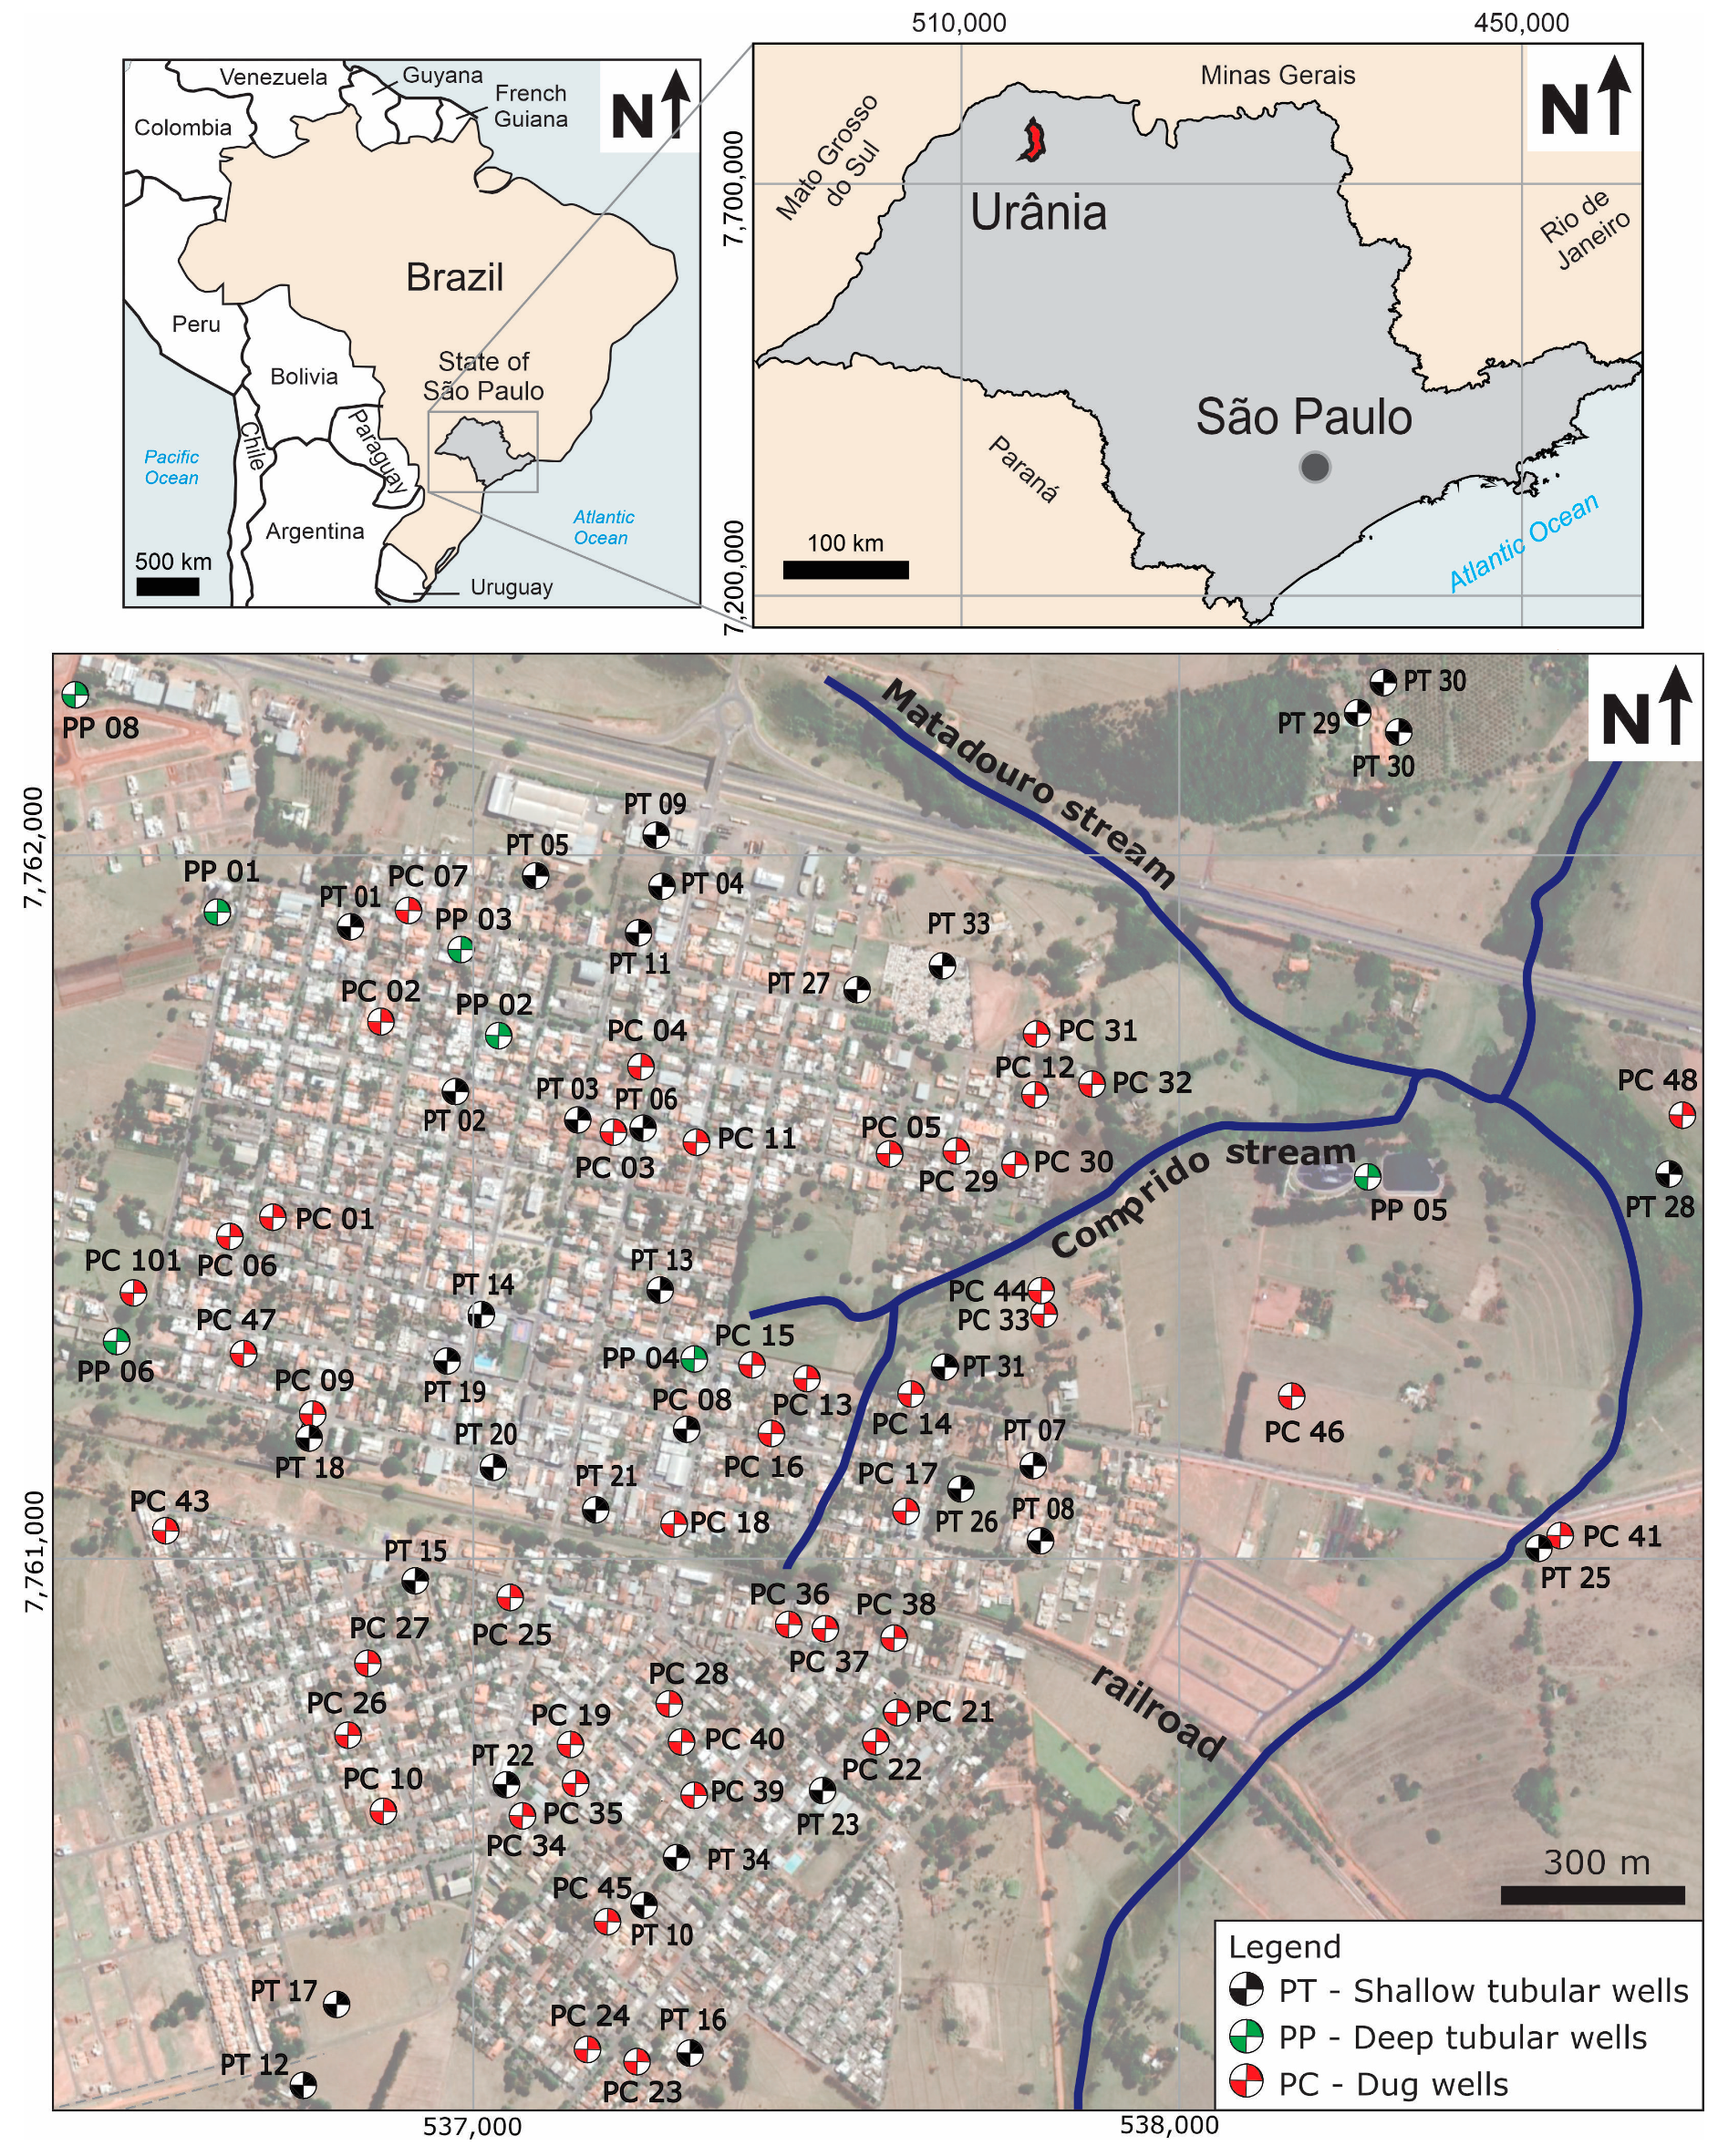
2. Site Description
3. Materials and Methods
3.1. Hydrogeological Conceptual Model of the Adamantina Aquifer
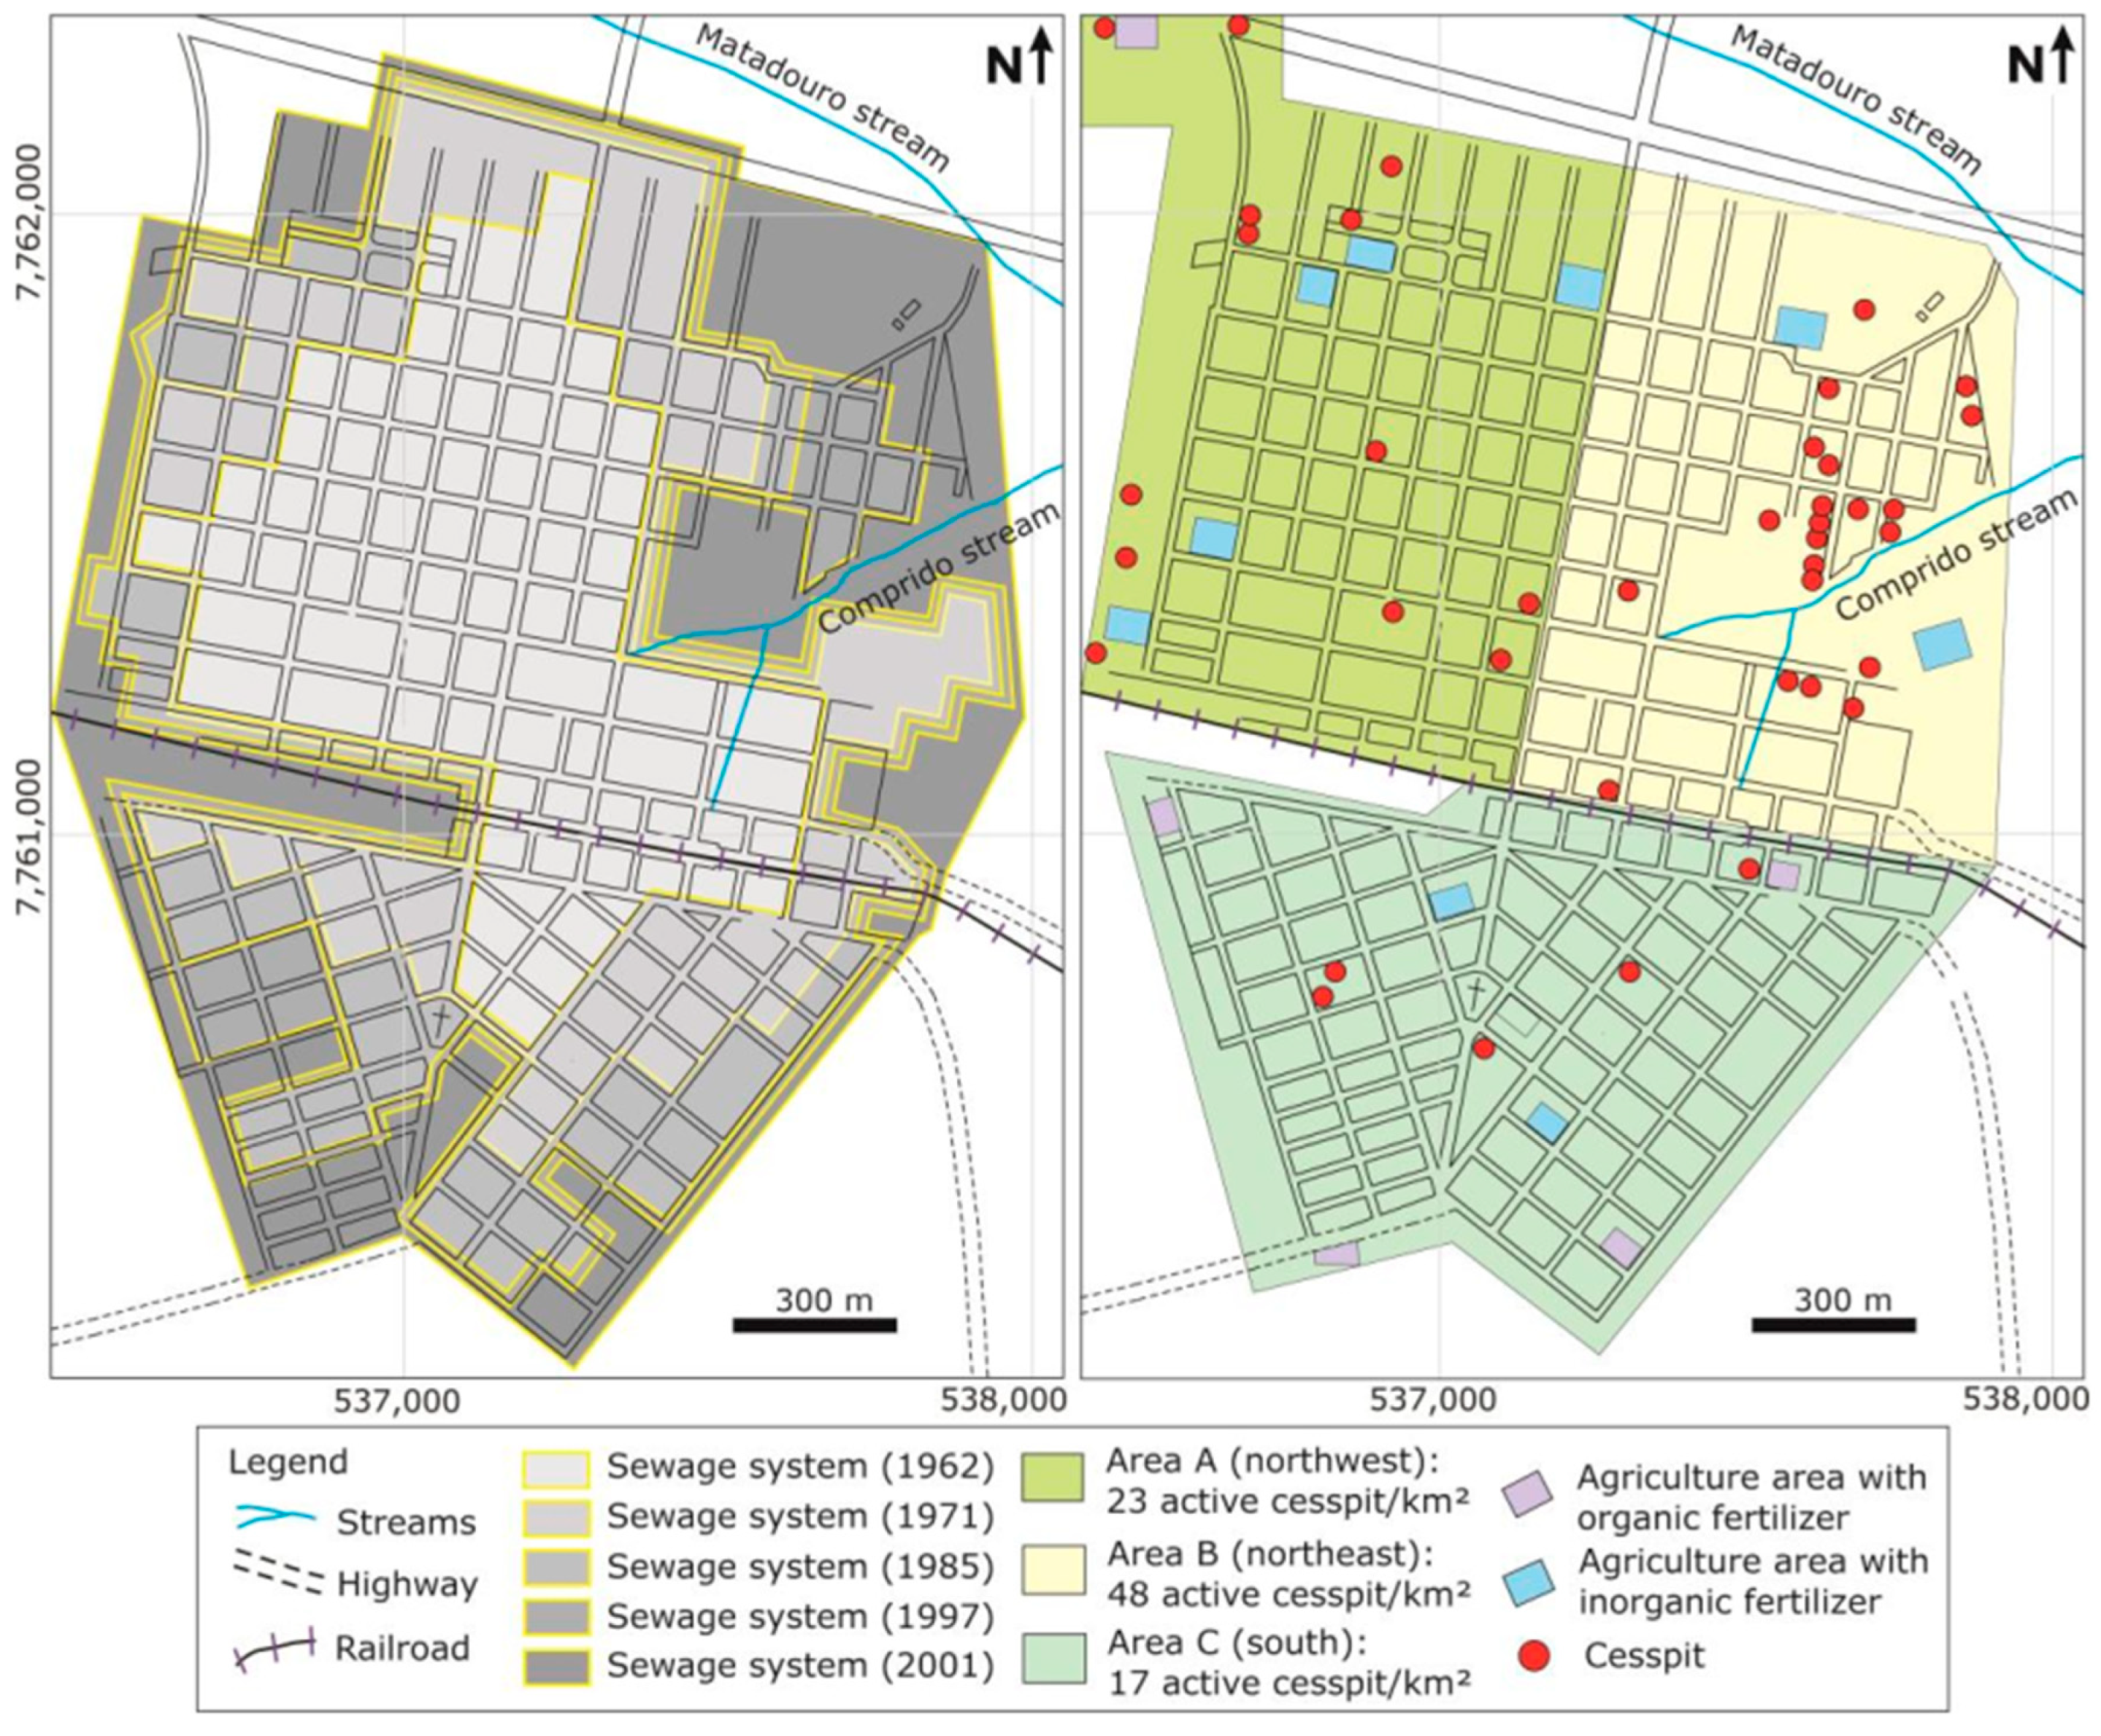
3.2. Evolution of Urban Occupation and Assessment of Potential Contamination
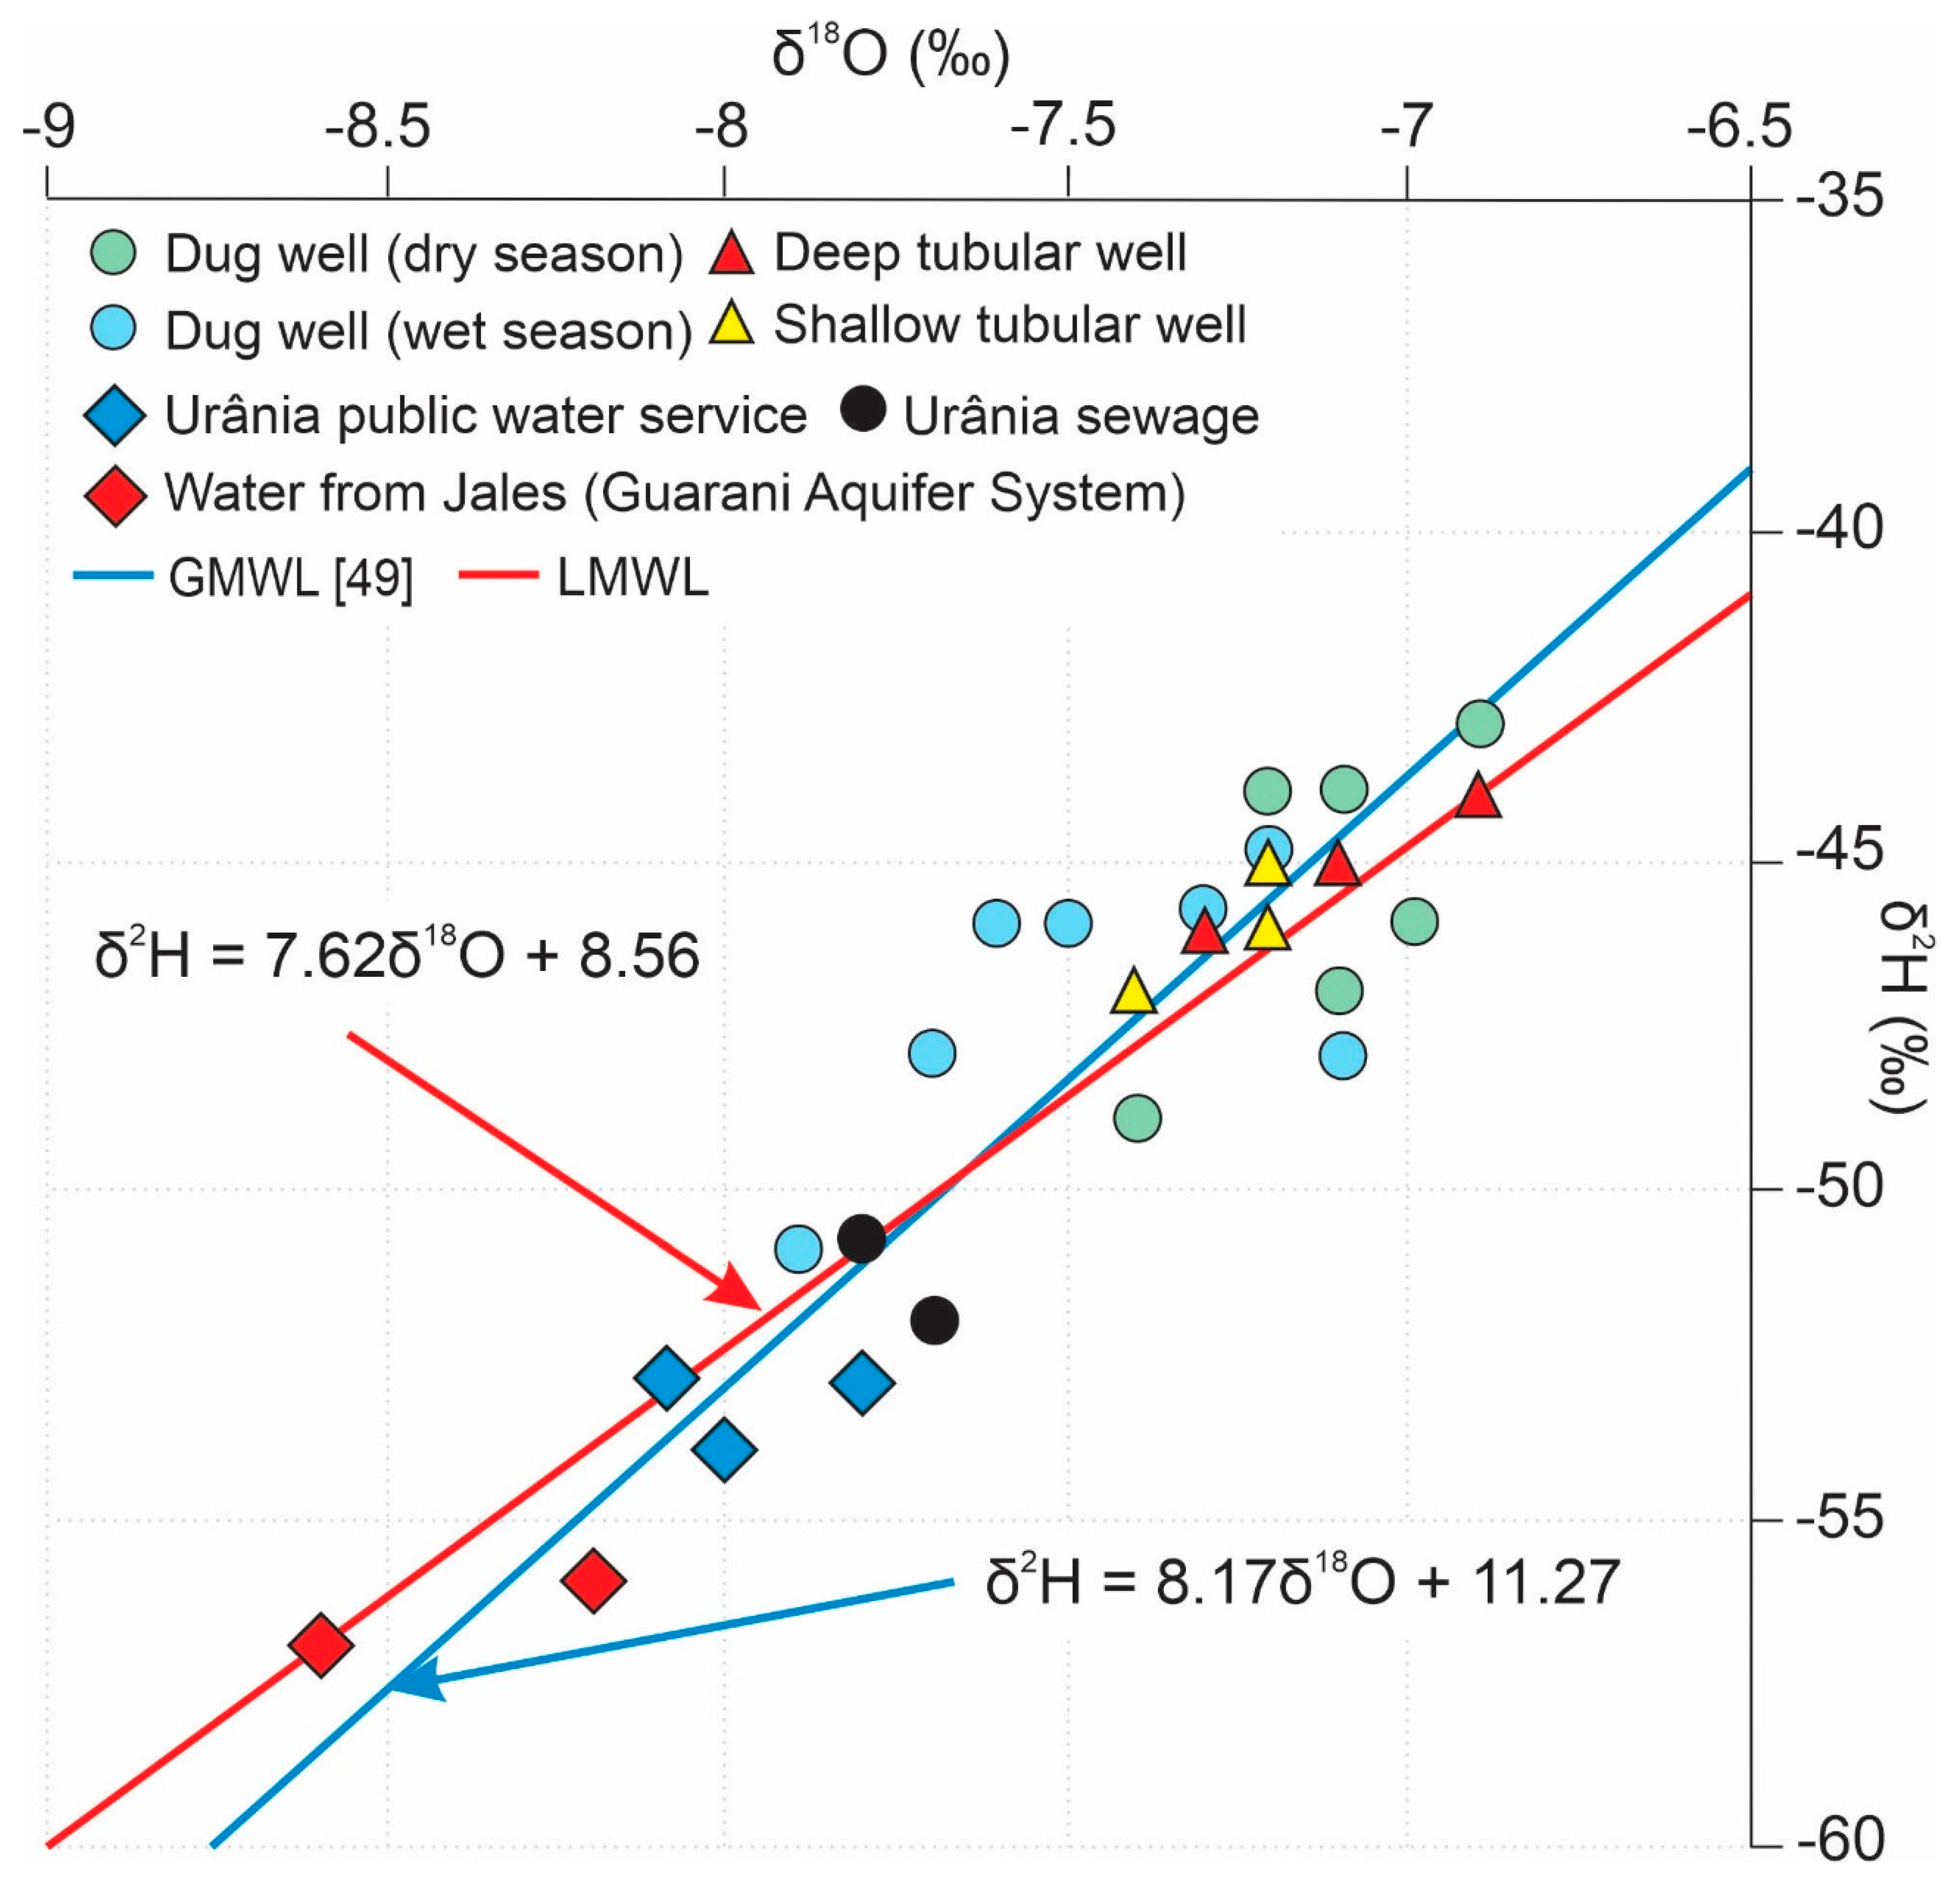
3.3. Sampling, Chemical, Physicochemical, and Stable Isotope Analysis
3.4. Estimating Mass of Nitrate Beneath Urânia
3.5. Numerical Model and Nitrate Transit Time Estimation
4. Results and Discussion
4.1. Hydrogeological Conceptual Model of the Adamantina Aquifer
4.2. Evolution of Urban Occupation and Assessment of Potential Contamination
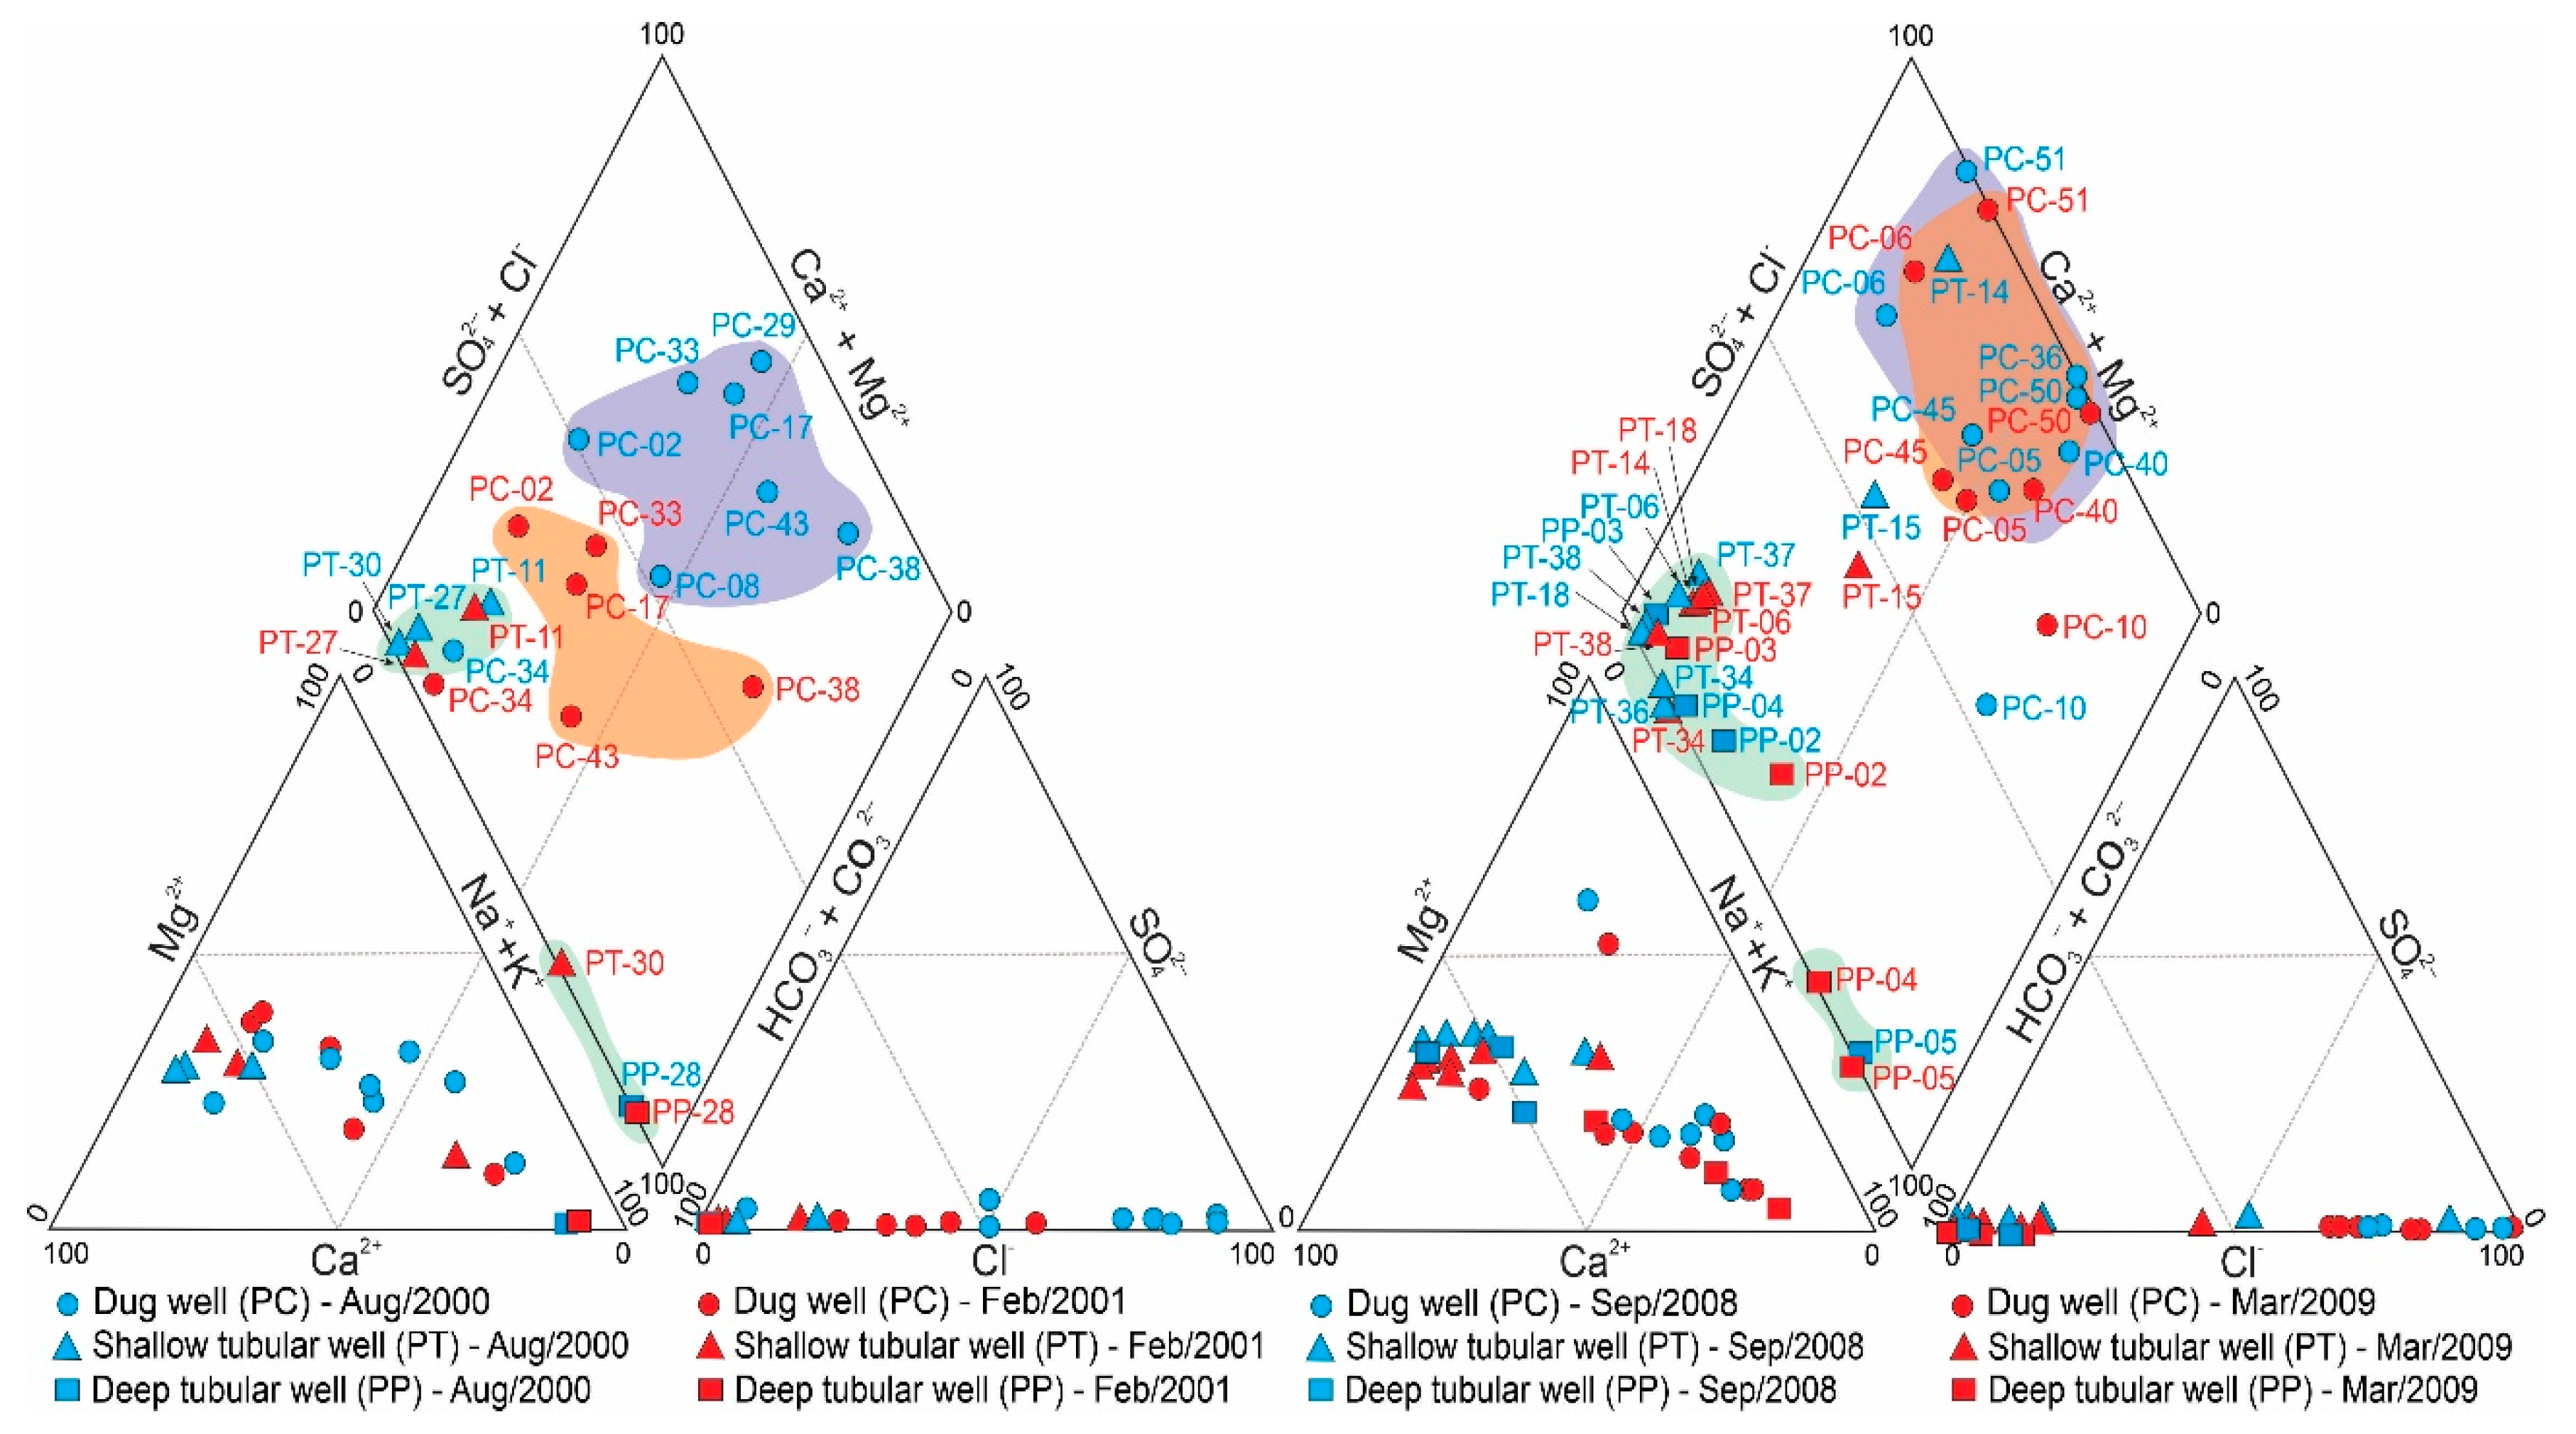
4.3. Chemical and Physicochemical Analysis
4.4. Mass of Nitrate Beneath Urânia
4.5. Numerical Model and Nitrate Transit Time Estimation
5. Conclusions
Author Contributions
Funding
Acknowledgments
Conflicts of Interest
References
- WHO—World Health Organization. Nitrate and Nitrite in Drinking-Water: Background Document for Development of WHO Guidelines for Drinking-water Quality; WHO Press: Geneva, Switzerland, 2011; p. 23. Available online: https://www.who.int/water_sanitation_health/dwq/chemicals/nitratenitrite2ndadd.pdf (accessed on 19 September 2020).
- United States Environmental Protection Agency US EPA. Ground Water Sampling Workshop—A Workshop Summary, Dallas, TX, USA, 30 November–2 December 1993; EPA: Washington, DC, USA; p. 126.
- Singh, B.; Sekhon, G.S. Nitrate pollution of groundwater from farm use of nitrogen fertilizer—A review. Agric. Environ. 1979, 4, 207–225. [Google Scholar] [CrossRef]
- Dahan, O.; Babad, A.; Lazarovitch, N.; Russak, E.E.; Kurtzman, D. Nitrate leaching from intensive organic farms to groundwater. Hydrol. Earth Syst. Sci. 2014, 18, 333–341. [Google Scholar] [CrossRef] [Green Version]
- Bahrami, M.; Zarei, A.R.; Rostami, F. Temporal and spatial assessment of groundwater contamination with nitrate by nitrate pollution index (NPI) and GIS (case study: Fasarud Plain, southern Iran). Environ. Geochem. Health 2020, 1–12. [Google Scholar] [CrossRef]
- Sahoo, P.K.; Kim, K.; Powell, M.A. Managing Groundwater Nitrate Contamination from Livestock Farms: Implication for Nitrate Management Guidelines. Curr. Pollut. Rep. 2016, 2, 178–187. [Google Scholar] [CrossRef] [Green Version]
- Cagnon, F.A. Origin and Hydrochemistry of Nitrate in the Groundwater of the Adamantina Aquifer in Urânia, SP [Port.]. Master’s Thesis, University of de São Paulo, São Paulo, Brazil, 2003. [Google Scholar]
- Varnier, C.; Hirata, R.; Aravena, R. Examining nitrogen dynamics in the unsaturated zone under an inactive cesspit using chemical tracers and environmental isotopes. Appl. Geochem. 2017, 78, 129–138. [Google Scholar] [CrossRef]
- Lerner, D.N. Groundwater recharge in urban areas. In Atmospheric Environment Part B. Urban Atmosphere; Elsevier: Amsterdam, The Netherlands, 1990; Volume 24, pp. 29–33. [Google Scholar]
- Foster, S.S.D.; Hirata, R.; Gomes, D.; D’Elia, M.; Paris, M. Groundwater Quality Protection: A Guide for Water Utilities, Municipal Authorities, and Environment Agencies; The World Bank: Washington, DC, USA, 2002. [Google Scholar]
- Marques, C.H.G.; Terada, R.; Galvão, P.; Hirata, R. Nitrate contamination temporal and spatial evolution of the Urânia urban aquifer [Port.]. Águas Subterr. 2019, 33, 258–269. [Google Scholar] [CrossRef]
- Price, M.; Reed, D.W. The influence of mains leakage and urban drainage on groundwater levels beneath conurbations in the UK. Proc. Inst. Civ. Eng. 1989, 86, 31–39. [Google Scholar] [CrossRef]
- Lawrence, A.R.; Barker, J.A.; Boonyakarnkul, T.; Chanvaivit, S.; Nagesuwan, P.; Sirirat, P.; Stuart, M.E.; Thandat, P.; Varathan, P. Impact of urbanization on groundwater: Hat Yai. Thailand. Br. Geol. Sur. (BGS) 1994. Available online: http://cidbimena.desastres.hn/pdf/eng/doc5925/doc5925-indice.pdf (accessed on 24 September 2020).
- Ortiz, C.R.F.; Díaz-Delgado, C.; Téllez, M.H.; Alberich, M.V.E. Demanda hídrica urbana en México: Modelado espacial con base en sistemas de información geográfica. Interciencia 2013, 38, 17–25. [Google Scholar]
- Yang, Y.; Lerner, D.N.; Barrett, H.M.; Tellam, J.H. Quantification of groundwater recharge in the city of Nottingham, UK. Environ. Geol. 1999, 38, 183–198. [Google Scholar] [CrossRef]
- Morris, B.L.; Darling, W.G.; Cronin, A.A.; Rueedi, J.; Whitehead, E.J.; Gooddy, D.C. Assessing the impact of modern recharge on a sandstone aquifer beneath a suburbof Doncaster, UK. Hydrogeol. J. 2006, 14, 979–997. [Google Scholar] [CrossRef] [Green Version]
- Foster, S.; Hirata, R.; Garduño, H. Urban Groundwater Use Policy—Balancing the Benefits and Risks in Developing Nations. GW-MATE Strategic Overview Series 3; The World Bank: Washington, DC, USA, 2010; Available online: www.worldbank.org/gwmate (accessed on 24 September 2020).
- Hirata, R.; Foster, S.; Oliveira, F.R. Urban Groundwater in Brazil: Assessment for a Sustainable Management [Port.], 1st ed.; Instituto de Geociências e FAPESP: São Paulo, Brazil, 2015; p. 112. [Google Scholar]
- Campos, H.; Hirata, R.; Rocha, G.; Mistreta, G. Nitrate Origin and Occurrence in Aquifers of the State of São Paulo, Brazil [Port.]. In Congresso Latino Americano de Hidrogeologia Subterránea, 2., Santiago; ALHSUD: Santiago, Chile, 1994; Volume 1, pp. 111–126. Available online: http://alhsud.com/principal/index.html (accessed on 24 September 2020).
- Sekhon, G.S. Fertilizer-N use efficiency and nitrate pollution of groundwater in developing countries. J. Contam. Hydrol. 1995, 20, 167–184. [Google Scholar]
- Galvão, P.; Hirata, R.; Halihan, T.; Terada, R. Recharge sources and hydrochemical evolution of an urban karst aquifer, Sete Lagoas, MG, Brazil. Environ. Earth Sci. 2017, 76, 159. [Google Scholar] [CrossRef]
- Simonato, M. Electricity Cost of Pumping Wells in Areas of Intense Exploitation: Study Case of São José do Rio Preto (SP) [Port.]. Master’s Thesis, University of de São Paulo, São Paulo, Brazil, 2013. [Google Scholar]
- Bertolo, R.A.; Bourrote, C.; Hirata, R.; Marcolan, L.N.O.; Sracek, O. Geochemistry of natural chromium occurrence in a sandstone aquifer in Bauru Basin, São Paulo State, Brazil. App. Geochem. 2011, 26, 1353–1363. [Google Scholar] [CrossRef]
- Varnier, C.; Iritani, M.; Viotti, M.; Oda, G.H.; Ferreira, L.M.R. Nitrate in groundwater of the Bauru Aquifer System, Marilia Municipality urban area (SP) [Port.]. Rev. Inst. Geol. 2010, 31, 1–21. [Google Scholar] [CrossRef] [Green Version]
- Procel, S.P. Nitrate Contamination and Its Relationship with Urban Growth in the Bauru Aquifer System in Presidente Prudente (SP) [Port.]. Master’s Thesis, University of de São Paulo, São Paulo, Brazil, 2011. [Google Scholar]
- IBGE—Instituto Brasileiro de Geografia e Estatística Home Page. Available online: http://www.ibge.gov.br/cidadesat/topwindow.htm?1 (accessed on 30 March 2016).
- Departamento de Águas e Energia do Estado de São Paulo. Study of Groundwater; Administrative Regions 7, 8 e 9 (Bauru, São José do Rio Preto e Araçatuba) [Port.]; ENCO: São Paulo, Brazil, 1976. [Google Scholar]
- Sracek, O.; Hirata, R. Geochemical and stable isotopes evolution of the Guarani Aquifer System in the State of São Paulo, Brazil. Hydrogeol. J. 2002, 10, 643–655. [Google Scholar] [CrossRef]
- Rocha, G.A.; Bertachini, A.C.; Campos, H.C.N.S.; Caixeta, J.B. Attempting to zoning the hydraulic and hydrochemical characteristics of the Bauru Aquifer [Port.]. In Geology and Hydrogeology Meeting of the Bauru Group in the State of São Paulo 1 [Port]; SBG São Paulo Chapter/ABAS: São Paulo, Brazil, 1981; pp. 37–57. [Google Scholar]
- Maldaner, C.H. Aquifer Recharge in an Urban Area: Urânia (SP) Case Study [Port.]. Master’s Thesis, University of de São Paulo, São Paulo, Brazil, 2010. [Google Scholar]
- Instituto Geográfico e Geológico do Estado de São Paulo. Topographic Map (Scale 1:50.000) [Port.]. Folha Santa Albertina SF-22-D-I-2; IGG: São Paulo, Brazil, 1966. [Google Scholar]
- Instituto Geográfico e Geológico do Estado de São Paulo. Topographic Map (Scale 1:50.000) [Port.]. Folha Jales SF-22-D-I-4; IGG: São Paulo, Brazil, 1966. [Google Scholar]
- Almodovar, M.L.N. The Natural Origin of Chromium Pollution in the Adamantina Aquifer, Municipality of Urânia (SP), São Paulo [Port.]. Ph.D. Thesis, University of de São Paulo, São Paulo, Brazil, 2000. [Google Scholar]
- Bertolo, R.; Hirata, R.; Sracek, O. Geochemistry and geochemical modeling of unsaturated zone in a tropical region in Urâia, São Paulo state, Brazil. J. Hydrol. 2006, 329, 49–62. [Google Scholar] [CrossRef]
- Gutierrez, A.S. Hydrogeochemical Model of the Adamantina Aquifer in Urânia (SP). Master’s Thesis, University of de São Paulo, São Paulo, Brazil, 2003. [CrossRef] [Green Version]
- Paula e Silva, F.D. Surficial geology and hydrostratigraphy of The Bauru Group in The State of São Paulo [Port.]. Ph.D. Thesis, State University of São Paulo, São Paulo, Brazil, 2003; p. 154. [Google Scholar]
- Palmér, R.M.I. A Numerical Model as a Tool to Understand Groundwater Circulation in Urânia (SP, Brazil). Master’s Thesis, Luleå/Sweden Technologic University, Luleå, Sweden, 2002. [Google Scholar]
- SABESP—Basic Sanitation Company of the State of São Paulo. Final Report of Deep Tubular Well, Urânia, Well 8. 1991, 8. Available online: http://site.sabesp.com.br/site/interna/Municipio.aspx?secaoId=18&id=133 (accessed on 24 September 2020).
- SABESP—Basic Sanitation Company of the State of São Paulo. Final Report of Deep Tubular Well, Aspásia (Urânia), Well 6. 1982, 8. Available online: http://site.sabesp.com.br/site/interna/Municipio.aspx?secaoId=18&id=440 (accessed on 24 September 2020).
- International Atomic Energy Agency. A new device for monthly rainfall sampling for GNIP. Water Environ. News 2002, 16, 5. [Google Scholar]
- CETESB—Environmental Company of the State of São Paulo. Nacional Sampling and Preservation Guide: Water, Sediments, Aquatic Communities and Liquid Effluents/Environmental Company of The State of São Paulo, organization: Carlos Jesus Bradã [et al.]; CETESB: São Paulo, Brazil; Agência Nacional de Águas (ANA) [Port]: Brasília, Brazil, 2011.
- United States Environmental Protection Agency (USEPA). Drinking Water Regulations and Health Advisories 1985 URL. Available online: http://www.epa.gov (accessed on 24 September 2020).
- American Public Health Association. Standard Methods for the Examination of Water and Wastewater, 19th ed.; American Public Health Association: Washington, DC, USA, 1995. [Google Scholar]
- Brandão, C.J.; Botelho, M.J.C.; Sato, M.I.Z. National Guide for the Sampling and Preservation of Water, Sediment, Aquatic Communities and Liquid Effluents [Port.]; CETESB: São Paulo, Brazil; Agência Nacional de Águas (ANA) [Port]: Brasília, Brazil, 2011; p. 325.
- Neuman, S. Theory of flow in unconfined aquifers considering delayed response of the water table. Water Resour. Res. 1972, 8, 1031–1045. [Google Scholar] [CrossRef]
- McDonald, M.G.; Harbaugh, A.W. A modular three-dimensional finite-difference groundwater flow model. Tech. Water Resour. Investig. 06-A1 1988, 576. [Google Scholar] [CrossRef]
- Zheng, C. MT3DMS v. 5.2. Supplemental User’s Guide. Tech. Rep. 2006, 41. Available online: https://hydro.geo.ua.edu/mt3d/mt3dms_v5_supplemental.pdf (accessed on 24 September 2020).
- Guiguer, N.; Franz, T. Visual MODFLOW. User’s Manual; Waterloo Hydrogeologic: Waterloo, ON, Canada, 1996; p. 231. [Google Scholar]
- Rozanski, K.; Araguás-Araguás, L.; Gonfiantini, R. Isotopic patterns in modern global precipitation. Climate change in continental isotopic records. GMS 1993, 78, 1–36. [Google Scholar] [CrossRef]
- Bourotte, C.; Bertolo, R.; Almodovar, M.; Hirata, R. Natural occurrence of hexavalent chromium in a sedimentary aquifer in the State of São Paulo, Brazil. An. Acad. Bras. Ciências 2009, 81, 227–242. [Google Scholar] [CrossRef] [Green Version]
- Bertolo, A.B.; Marcolan, L.N.O.; Bourotte, C.L.M. Water-Rock Interaction and the Hydrogeochemistry of Chromium in Groundwater from Multilevels Monitoring Wells in Urania, SP, Brazil. In Bibliographic Information; Instituto de Geociências da USP: São Paulo, Brazil, 2013; pp. 47–62. Available online: www.igc.usp.br/geologiausp (accessed on 18 September 2020).


| Sampling | Dug Well | Tubular Well | Monitoring Well | Chemical Analyzes | Stable Isotopes (18O, 2H, 15N) |
|---|---|---|---|---|---|
| January 98 (lab) | 14 | 10 | - | 24 | - |
| November 98 (lab) | 9 | 5 | - | 14 | - |
| March 99 (lab) | 11 | 10 | - | 21 | - |
| January 99 (lab) | 13 | 8 | - | 21 | - |
| April 00 (lab) | 11 | 9 | - | 20 | - |
| April 00 (field) | 31 | 19 | 50 | ||
| August 00 (lab) | 9 | 4 | - | 13 | - |
| August 00 (field) | 24 | 20 | 44 | ||
| February 01 (lab) | 8 | 5 | - | 13 | - |
| February 01 (field) | 25 | 19 | 44 | ||
| August 01 (lab) | 10 | 5 | - | 15 | - |
| August 01 (field) | 25 | 18 | 43 | ||
| September 01(lab) | 11 | 6 | - | 17 | 17 (15N) |
| September 01(field) | 12 | 7 | 19 | ||
| September 07 (lab) | 15 | 13 | 5 | 33 | 26 (18O, 2H) |
| September 08 (lab) | 8 | 12 | 5 | 25 | 39 (18O, 2H) |
| March 09 (lab) | 8 | 10 | - | 18 | 25 (18O, 2H) |
| January 18 (lab) | 5 | 15 | 2 | 22 | |
| September 19 (lab) | 7 | 7 | |||
| Total | 463 |
| Sep/2007 | Sep/2008 | Mar/2009 | |||||
|---|---|---|---|---|---|---|---|
| Well Type | ID | δ18O | δ2H | δ18O | δ2H | δ18O | δ2H |
| Dug wells | PC−05 | - | - | −7.8 | −51 | −7.9 | −51 |
| PC−06 | −7.1 | −44 | −7.4 | −48 | −7.2 | −45 | |
| PC−10 | −7.2 | −44 | −7.5 | −49 | −7.5 | −46 | |
| PC−36 | −6.9 | −43 | 7.5 | −49 | - | - | |
| PC−40 | −7.2 | −44 | −8.1 | −55 | −7.7 | −48 | |
| PC−45 | −6.9 | −43 | −7.2 | −48 | −7.1 | −45 | |
| PC−49 | −7.0 | −46 | - | - | - | - | |
| PC−50 | −7.4 | −49 | −7.7 | −50 | −7.6 | −46 | |
| PC−51 | −7.1 | − | −7.4 | −49 | −7.3 | −46 | |
| Shallow tubular wells | PT−03 | −7.0 | −47 | - | - | - | - |
| PT−06 | −7.1 | −46 | −7.3 | −48 | −7.2 | −46 | |
| PT−14 | −7.1 | −46 | −7.6 | −51 | −7.2 | −46 | |
| PT−15 | −7.4 | −48 | −7.4 | −49 | −7.2 | −46 | |
| PT−18 | −7.1 | −45 | −7.4 | −48 | −7.2 | −45 | |
| PT−34 | −7.1 | −47 | −7.4 | −48 | −7.3 | −46 | |
| PT−36 | −6.6 | −42 | −7.0 | −46 | - | - | |
| PT−37 | −7.1 | −44 | −7.3 | −48 | −7.1 | −45 | |
| PT−38 | −7.1 | −44 | −7.4 | −48 | −7.4 | −47 | |
| Deep tubular wells | PP−02 | −6.9 | −46 | −7.3 | −48 | −7.1 | −45 |
| PP−03 | −7.0 | −45 | −7.3 | −47 | −6.9 | −44 | |
| PP−04 | −7.1 | −47 | −7.4 | −48 | −7.3 | −46 | |
| PP−05 | −7.5 | −48 | −7.6 | −49 | −7.5 | −48 | |
| Water from Jales (GAS) | - | - | - | - | −8.2 | −56 | |
| Water from Jales (GAS) | - | - | - | - | −8.6 | −57 | |
| Public water service (Urânia) | −7.8 | −53 | −8.0 | −54 | −8.1 | −53 | |
| Sewage (Urânia) | - | - | −7.7 | −52 | −7.8 | −51 | |
| Period | 1960 | 1970 | 1980 | 1991 | 2000 | 2010 | 2018 |
|---|---|---|---|---|---|---|---|
| Urban population (hab) | 1708 | 5134 | 6498 | 7561 | 7063 | 7436 | 7502 |
| Rural population (hab) | 15,421 | 11,695 | 7012 | 4719 | 1759 | 1400 | 1158 |
| Total population (hab) | 17,129 | 16,829 | 13,510 | 12,280 | 8822 | 8836 | 8660 |
| Urbanization (%) | 9.97 | 30.51 | 48.10 | 61.57 | 80.06 | 84.16 | 86.63 |
| Urban households | - | - | 1473 | 2029 | 2134 | 2568 | - |
| Rural households | - | - | 1371 | 1106 | 513 | 457 | - |
| Total households | 3000 | - | 2844 | 3135 | 2647 | 3025 | 3210 |
| Water supply (%) | - | - | - | 97.88 | 98.13 | 99.26 | - |
| Sanitary sewage (%) | Cesspool | 59 | 64 | 79 | 96.3 | 98.71 | - |
| Municipal area (km2) | 357.84 | 357.84 | 357.84 | 357.84 | 209.27 | 209.27 | 209.27 |
| Urban area (km2) | 0.72 | 1.19 | 1.47 | 1.65 | 2.14 | 2.40 | - |
| NO3− Concentration (mg/L) | Area (m2) | Average Thickness (m) | Total Mass (kg) | |
|---|---|---|---|---|
| Shallow zone | 130 | 2.7 | 12 | 0.6 |
| 120 | 14.3 | 12 | 3.1 | |
| 110 | 43.8 | 12 | 8.7 | |
| 100 | 89.6 | 12 | 16.1 | |
| 90 | 125.7 | 12 | 20.4 | |
| 80 | 392.4 | 12 | 56.5 | |
| 70 | 389.9 | 12 | 49.1 | |
| 60 | 267.2 | 12 | 28.9 | |
| 50 | 306.1 | 12 | 27.6 | |
| 40 | 358.6 | 12 | 25.8 | |
| 30 | 455.8 | 12 | 24.6 | |
| 20 | 627.3 | 12 | 22.6 | |
| 10 | 840.0 | 12 | 15.1 | |
| Total | 3913.2 | - | 299.0 | |
| Intermediate zone | 80 | - | - | - |
| 70 | 11.3 | 48 | 5.7 | |
| 60 | 55.0 | 48 | 23.8 | |
| 50 | 150.0 | 48 | 54.0 | |
| 40 | 388.8 | 48 | 112.0 | |
| 30 | 563.1 | 48 | 121.6 | |
| 20 | 475.0 | 48 | 68.4 | |
| 10 | 646.3 | 48 | 46.5 | |
| Total | 2289.4 | - | 432.0 | |
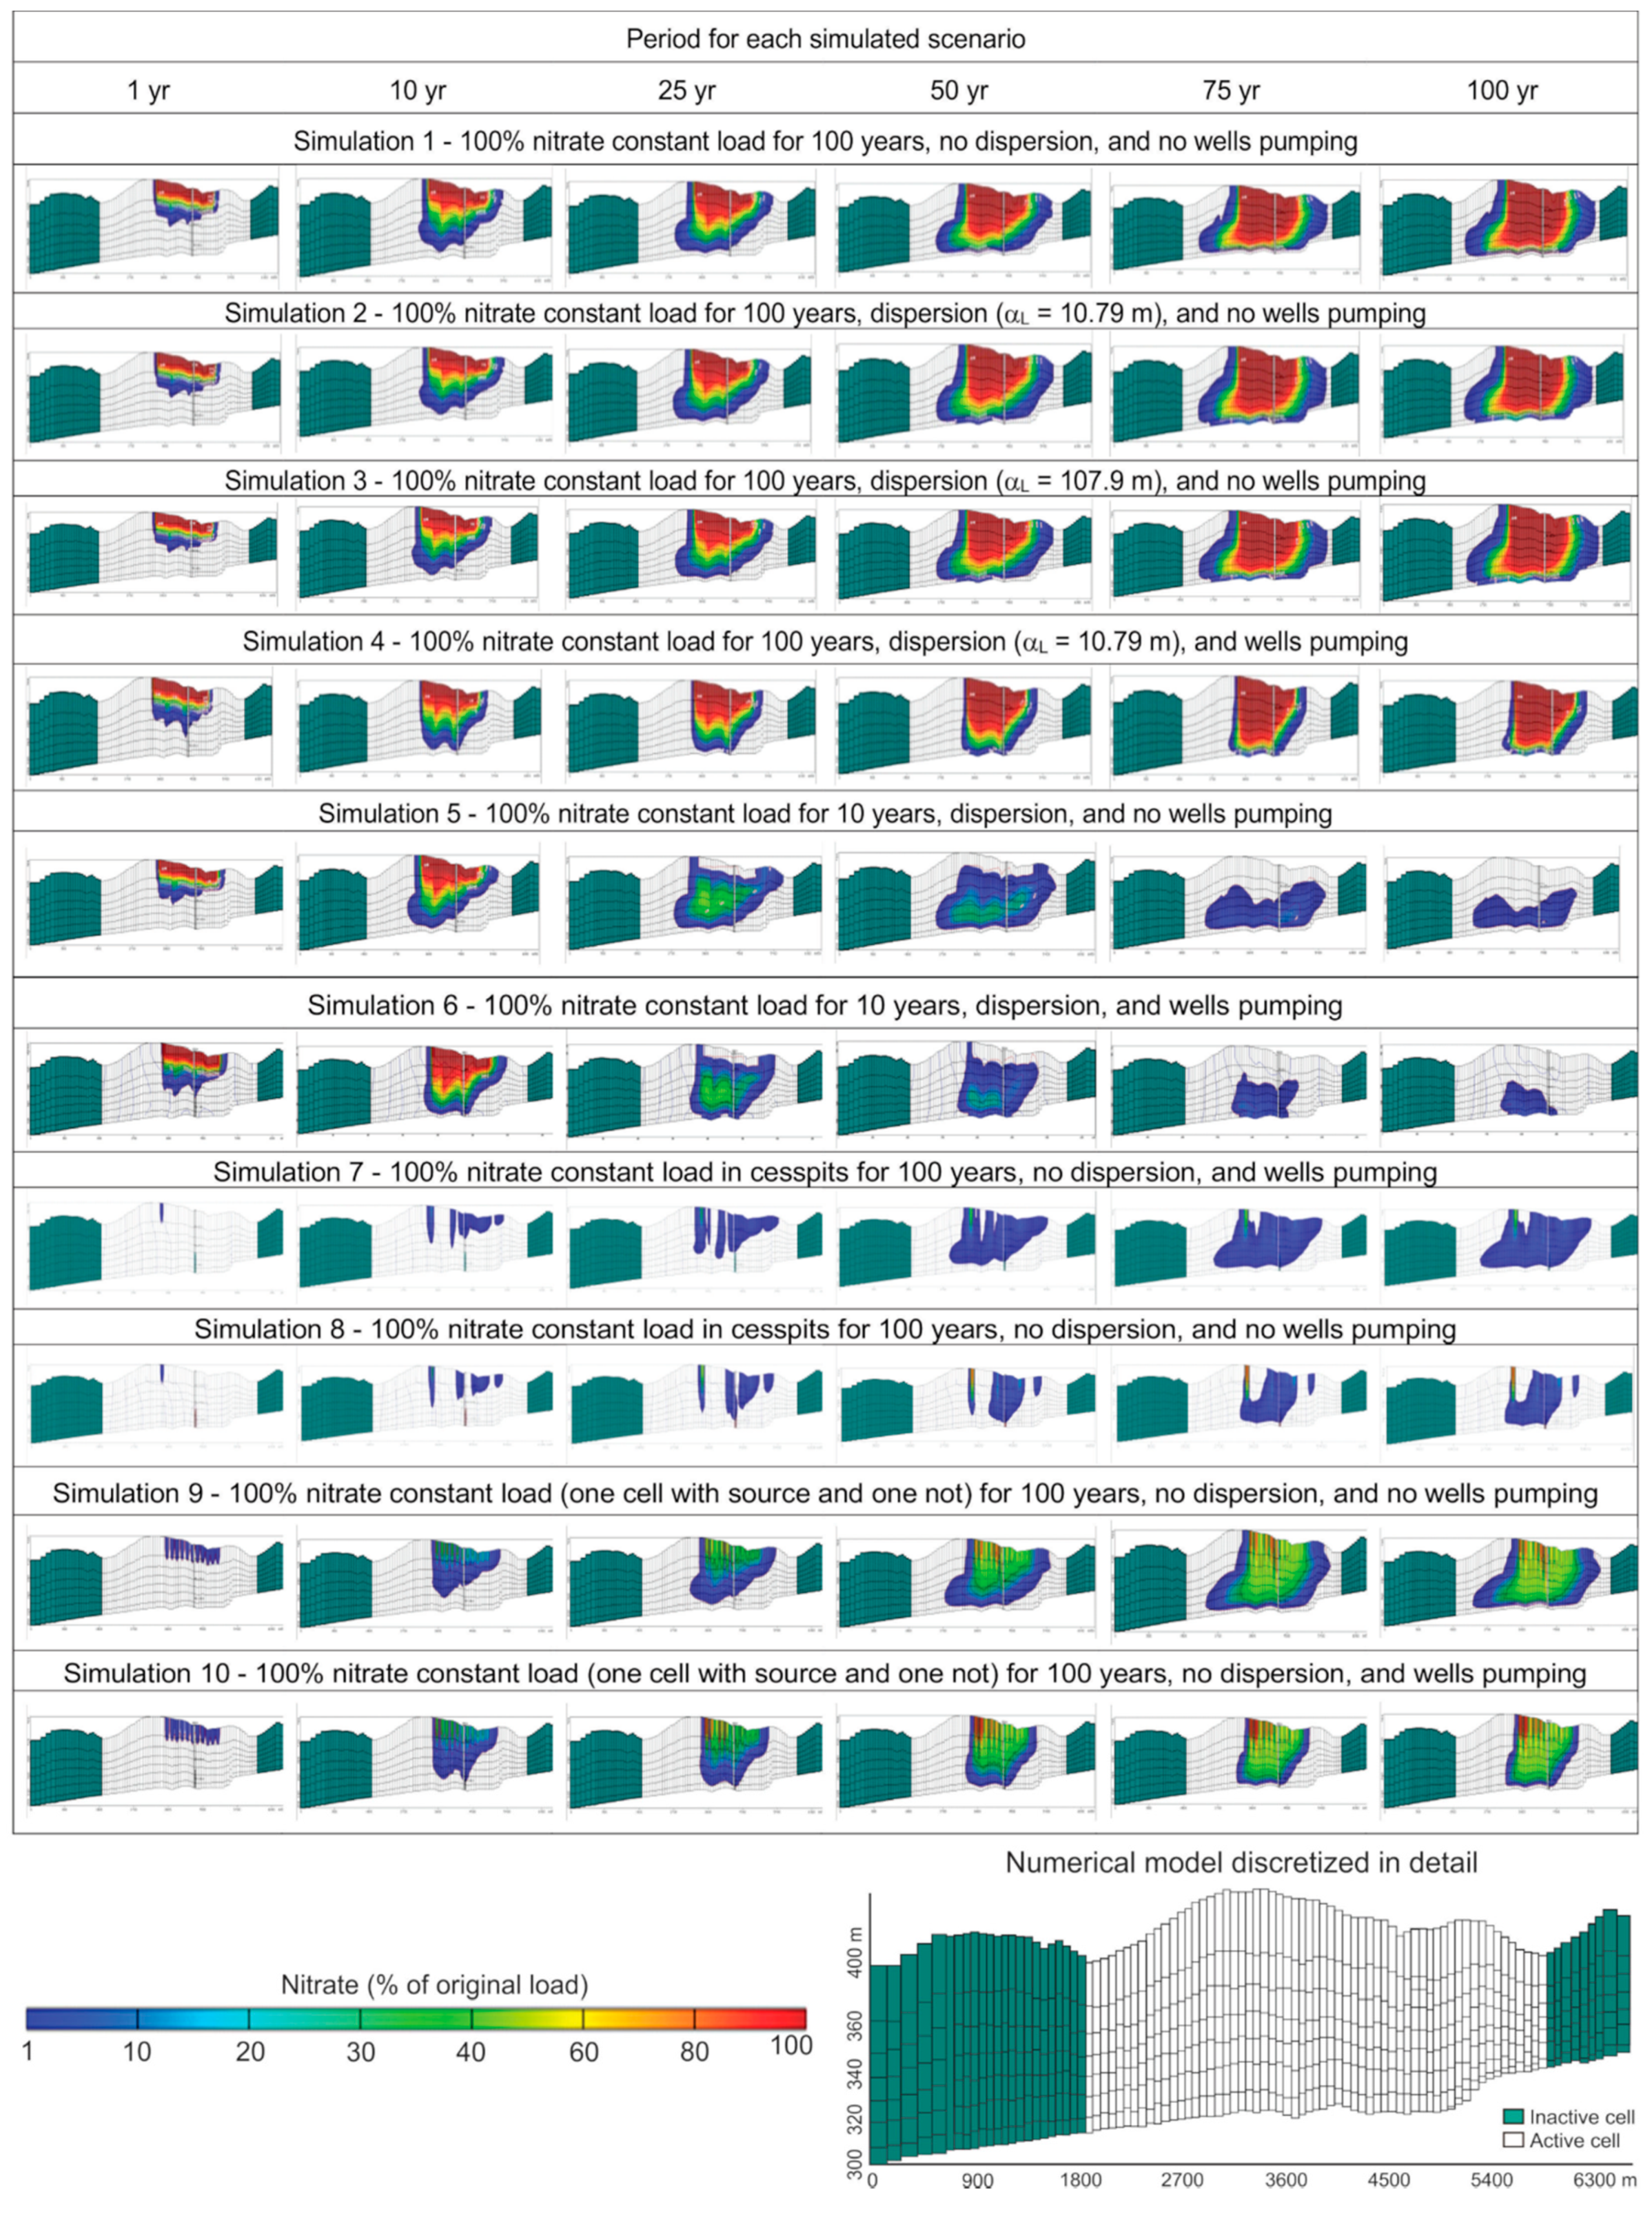
| Simulation | Nitrate Contamination | Pumping | Dispersion | Comments on the Extent of the Estimated Contamination Plume and Dispersion for Shallow Zone (SZ), Intermediate Zone (IZ), and Deep Zone (DZ) |
|---|---|---|---|---|
| 1 | 100% overall urban area for 100 years | No | No | SZ: 100% of the plume reaches in 1 year. IZ: 98% of the plume reaches in 5 year. DZ: 70% of the plume reaches in 10 year. |
| 2 | 100% overall urban area for 100 years | No | Longitudinal 10.79 m | Idem. |
| 3 | 100% overall urban area for 100 years | No | Longitudinal 107.9 m | Idem. |
| 4 | 100% overall urban area for 100 years | Yes | Longitudinal 10.79 m | SZ: 99% of the plume reaches the zone. IZ: 85% of the plume reaches the zone. DZ: 41% of the plume reaches the zone. No major impact of dispersion. |
| 5 | 100% overall urban area for 10 years only, and 100% efficient sewer network | No | Longitudinal 10.79 m | SZ: 65% of the plume in 10 years and 0% in 100 years. IZ: 27% of the plume in 23 years and 1% in 100 years. DZ: 15% of the plume in 72 years and 11% in 100 years. Significant drop in concentrations after source ceased. In 10 years, contamination problem (SZ and IZ) would be solved. |
| 6 | 100% overall urban area for 10 years only, and 100% efficient sewer network | Yes | Longitudinal 10.79 m | SZ: 84% of the plume in 10 years and 0% in 100 years. IZ: 41% of the plume in 12 years and 1% in 100 years. DZ: 11% of the plume in 29 years and 1% in 100 years. Significant reduction in concentrations after source ceased (greater dilution and increase in the vertical gradient) |
| 7 | 100% for the cesspits registered for 100 years [7] | No | No | SZ and IZ: 13% of the plume will reach these areas. DZ: 6% of the plume will reach the zone. No increase in nitrate concentrations in the aquifer in a fraction greater than 13% of the initial contamination. |
| 8 | 100% for the cesspits registered for 100 years [7] | Yes | No | SZ: 5% IZ: 6% DZ: 4% |
| 9 | 100% (one cell with source and one not) for 100 years | No | No | SZ: 44% IZ: 48% DZ: 31% |
| 10 | 100% (one cell with source and one not) for 100 years | Yes | No | SZ: 44% IZ: 47% DZ: 25% |
© 2020 by the authors. Licensee MDPI, Basel, Switzerland. This article is an open access article distributed under the terms and conditions of the Creative Commons Attribution (CC BY) license (http://creativecommons.org/licenses/by/4.0/).
Share and Cite
Hirata, R.; Cagnon, F.; Bernice, A.; Maldaner, C.H.; Galvão, P.; Marques, C.; Terada, R.; Varnier, C.; Ryan, M.C.; Bertolo, R. Nitrate Contamination in Brazilian Urban Aquifers: A Tenacious Problem. Water 2020, 12, 2709. https://doi.org/10.3390/w12102709
Hirata R, Cagnon F, Bernice A, Maldaner CH, Galvão P, Marques C, Terada R, Varnier C, Ryan MC, Bertolo R. Nitrate Contamination in Brazilian Urban Aquifers: A Tenacious Problem. Water. 2020; 12(10):2709. https://doi.org/10.3390/w12102709
Chicago/Turabian StyleHirata, Ricardo, Fabiana Cagnon, Aline Bernice, Carlos Henrique Maldaner, Paulo Galvão, Carlos Marques, Rafael Terada, Claudia Varnier, M. Cathryn Ryan, and Reginaldo Bertolo. 2020. "Nitrate Contamination in Brazilian Urban Aquifers: A Tenacious Problem" Water 12, no. 10: 2709. https://doi.org/10.3390/w12102709