Quality Assessments of Shallow Groundwaters for Drinking and Irrigation Purposes: Insights from a Case Study (Jinta Basin, Heihe Drainage Area, Northwest China)


Abstract
:1. Introduction
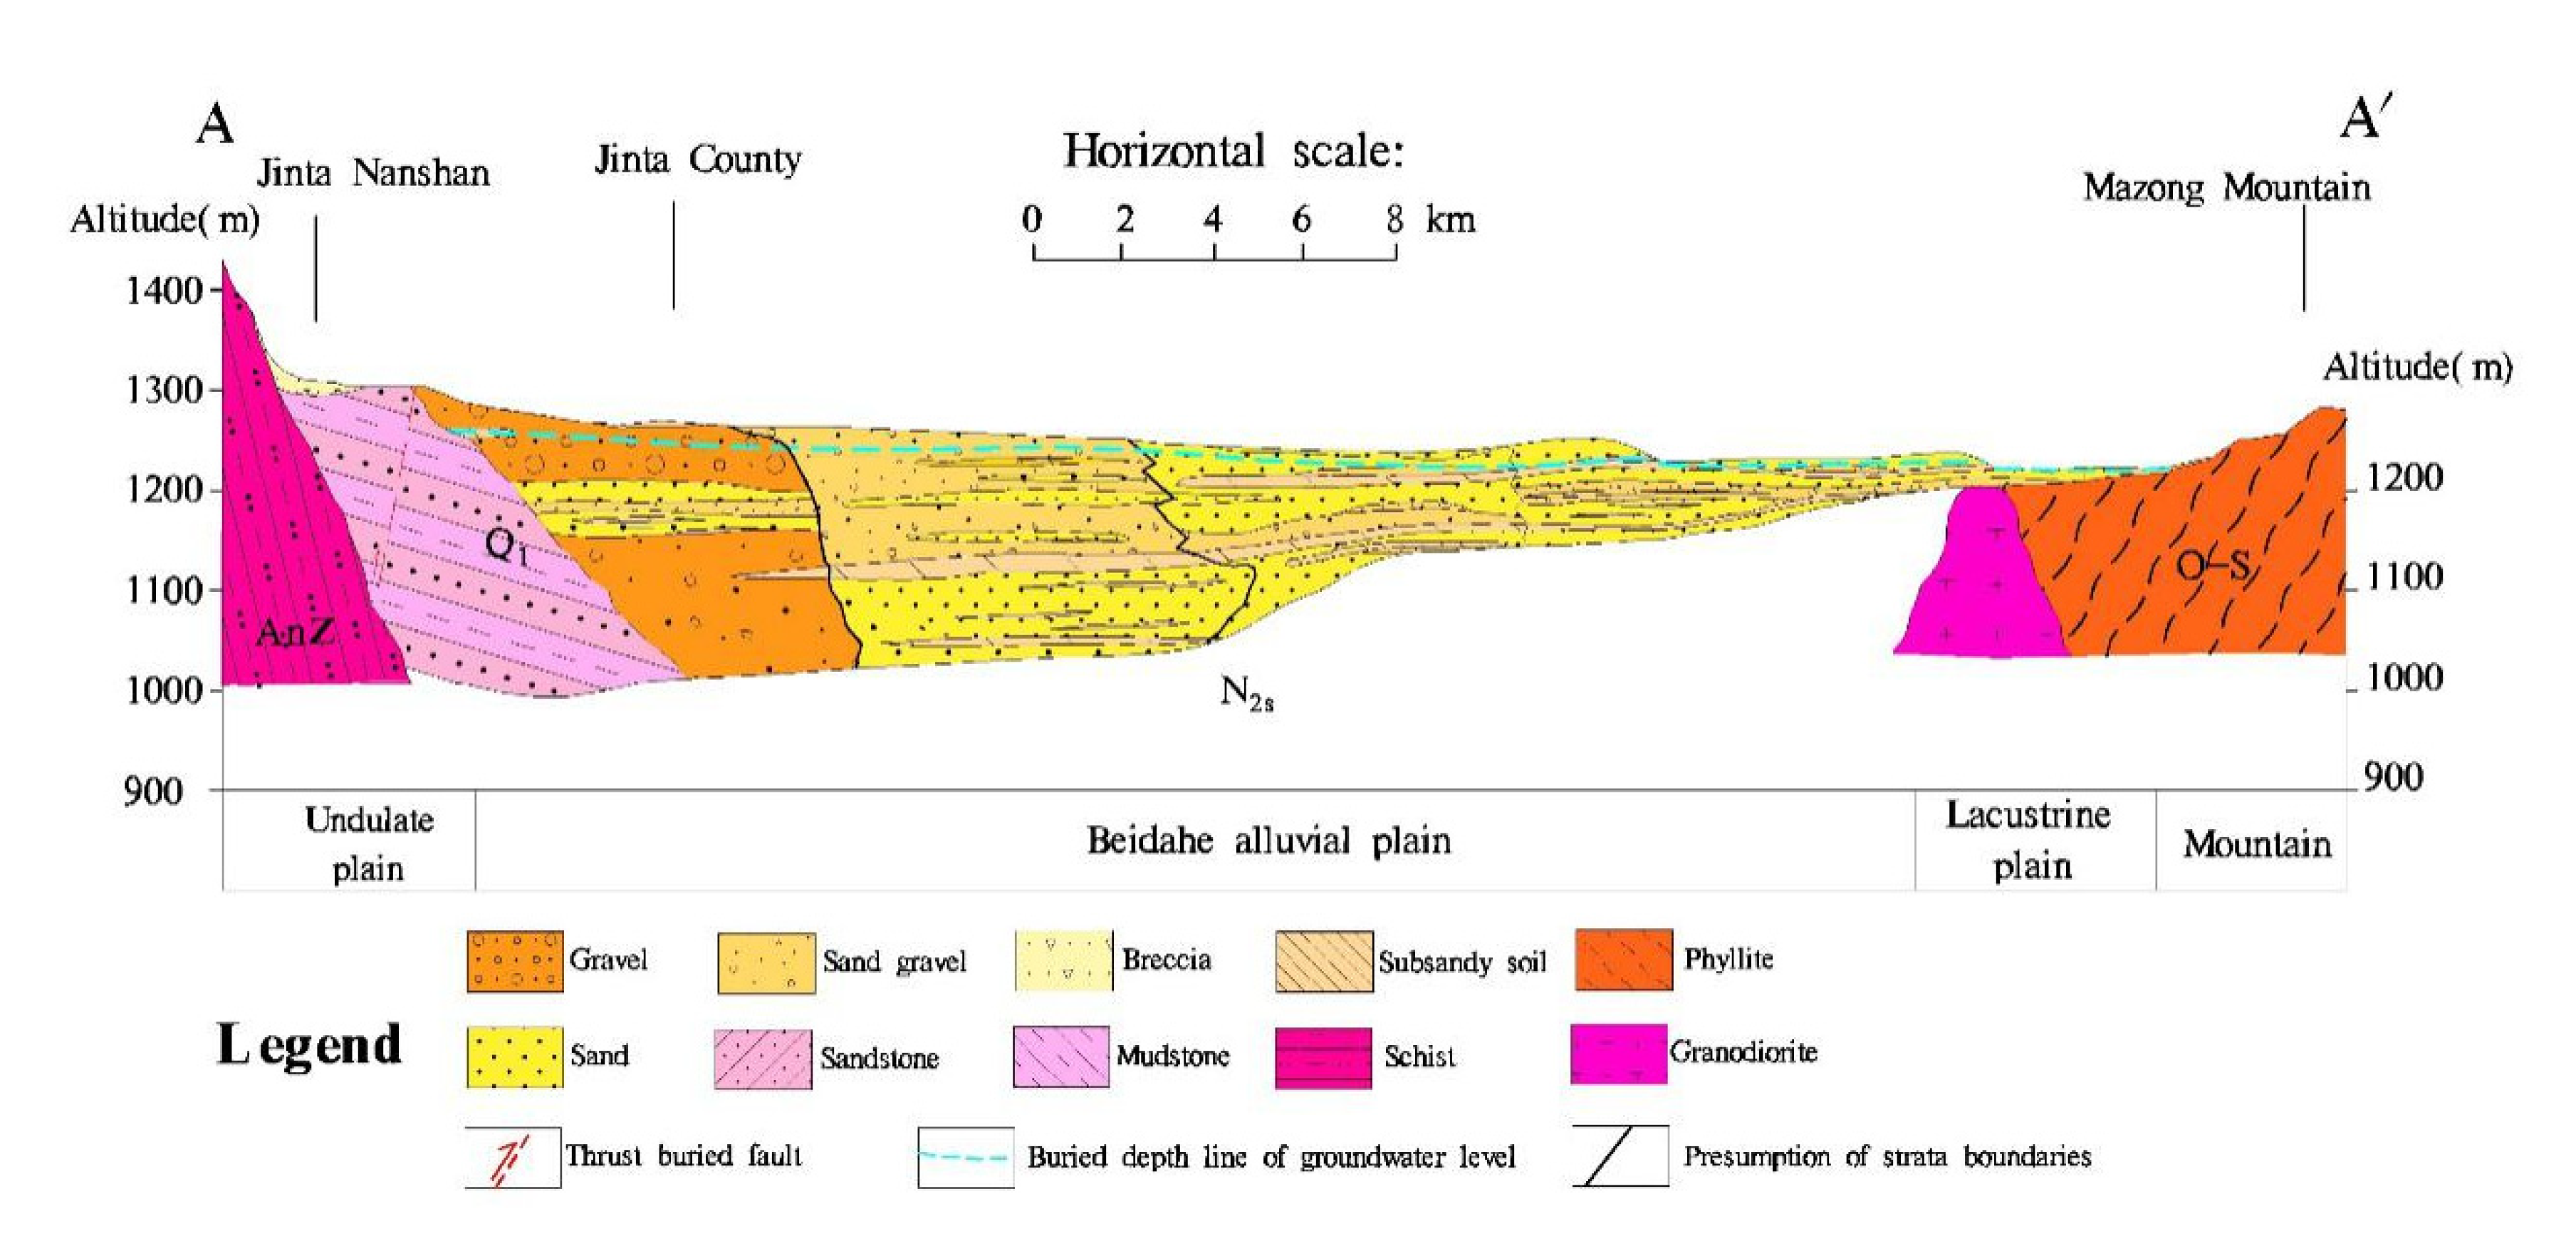
2. Study Area
3. Methods and Materials
3.1. Sampling and Analysis
3.2. Analysis of Hydrogeochemical Processes
3.3. Method Used in the Assessment of Groundwater Quality
3.3.1. Drinking Water Quality Assessment
3.3.2. Assessment of the Quality of Groundwater Samples for Use in Agricultural Irrigation
Sodium Adsorption Ratio (SAR)
Sodium Percentage (Na%)
Kelly’s Ratio (KR)
Permeability Index (PI)
4. Results and Discussion
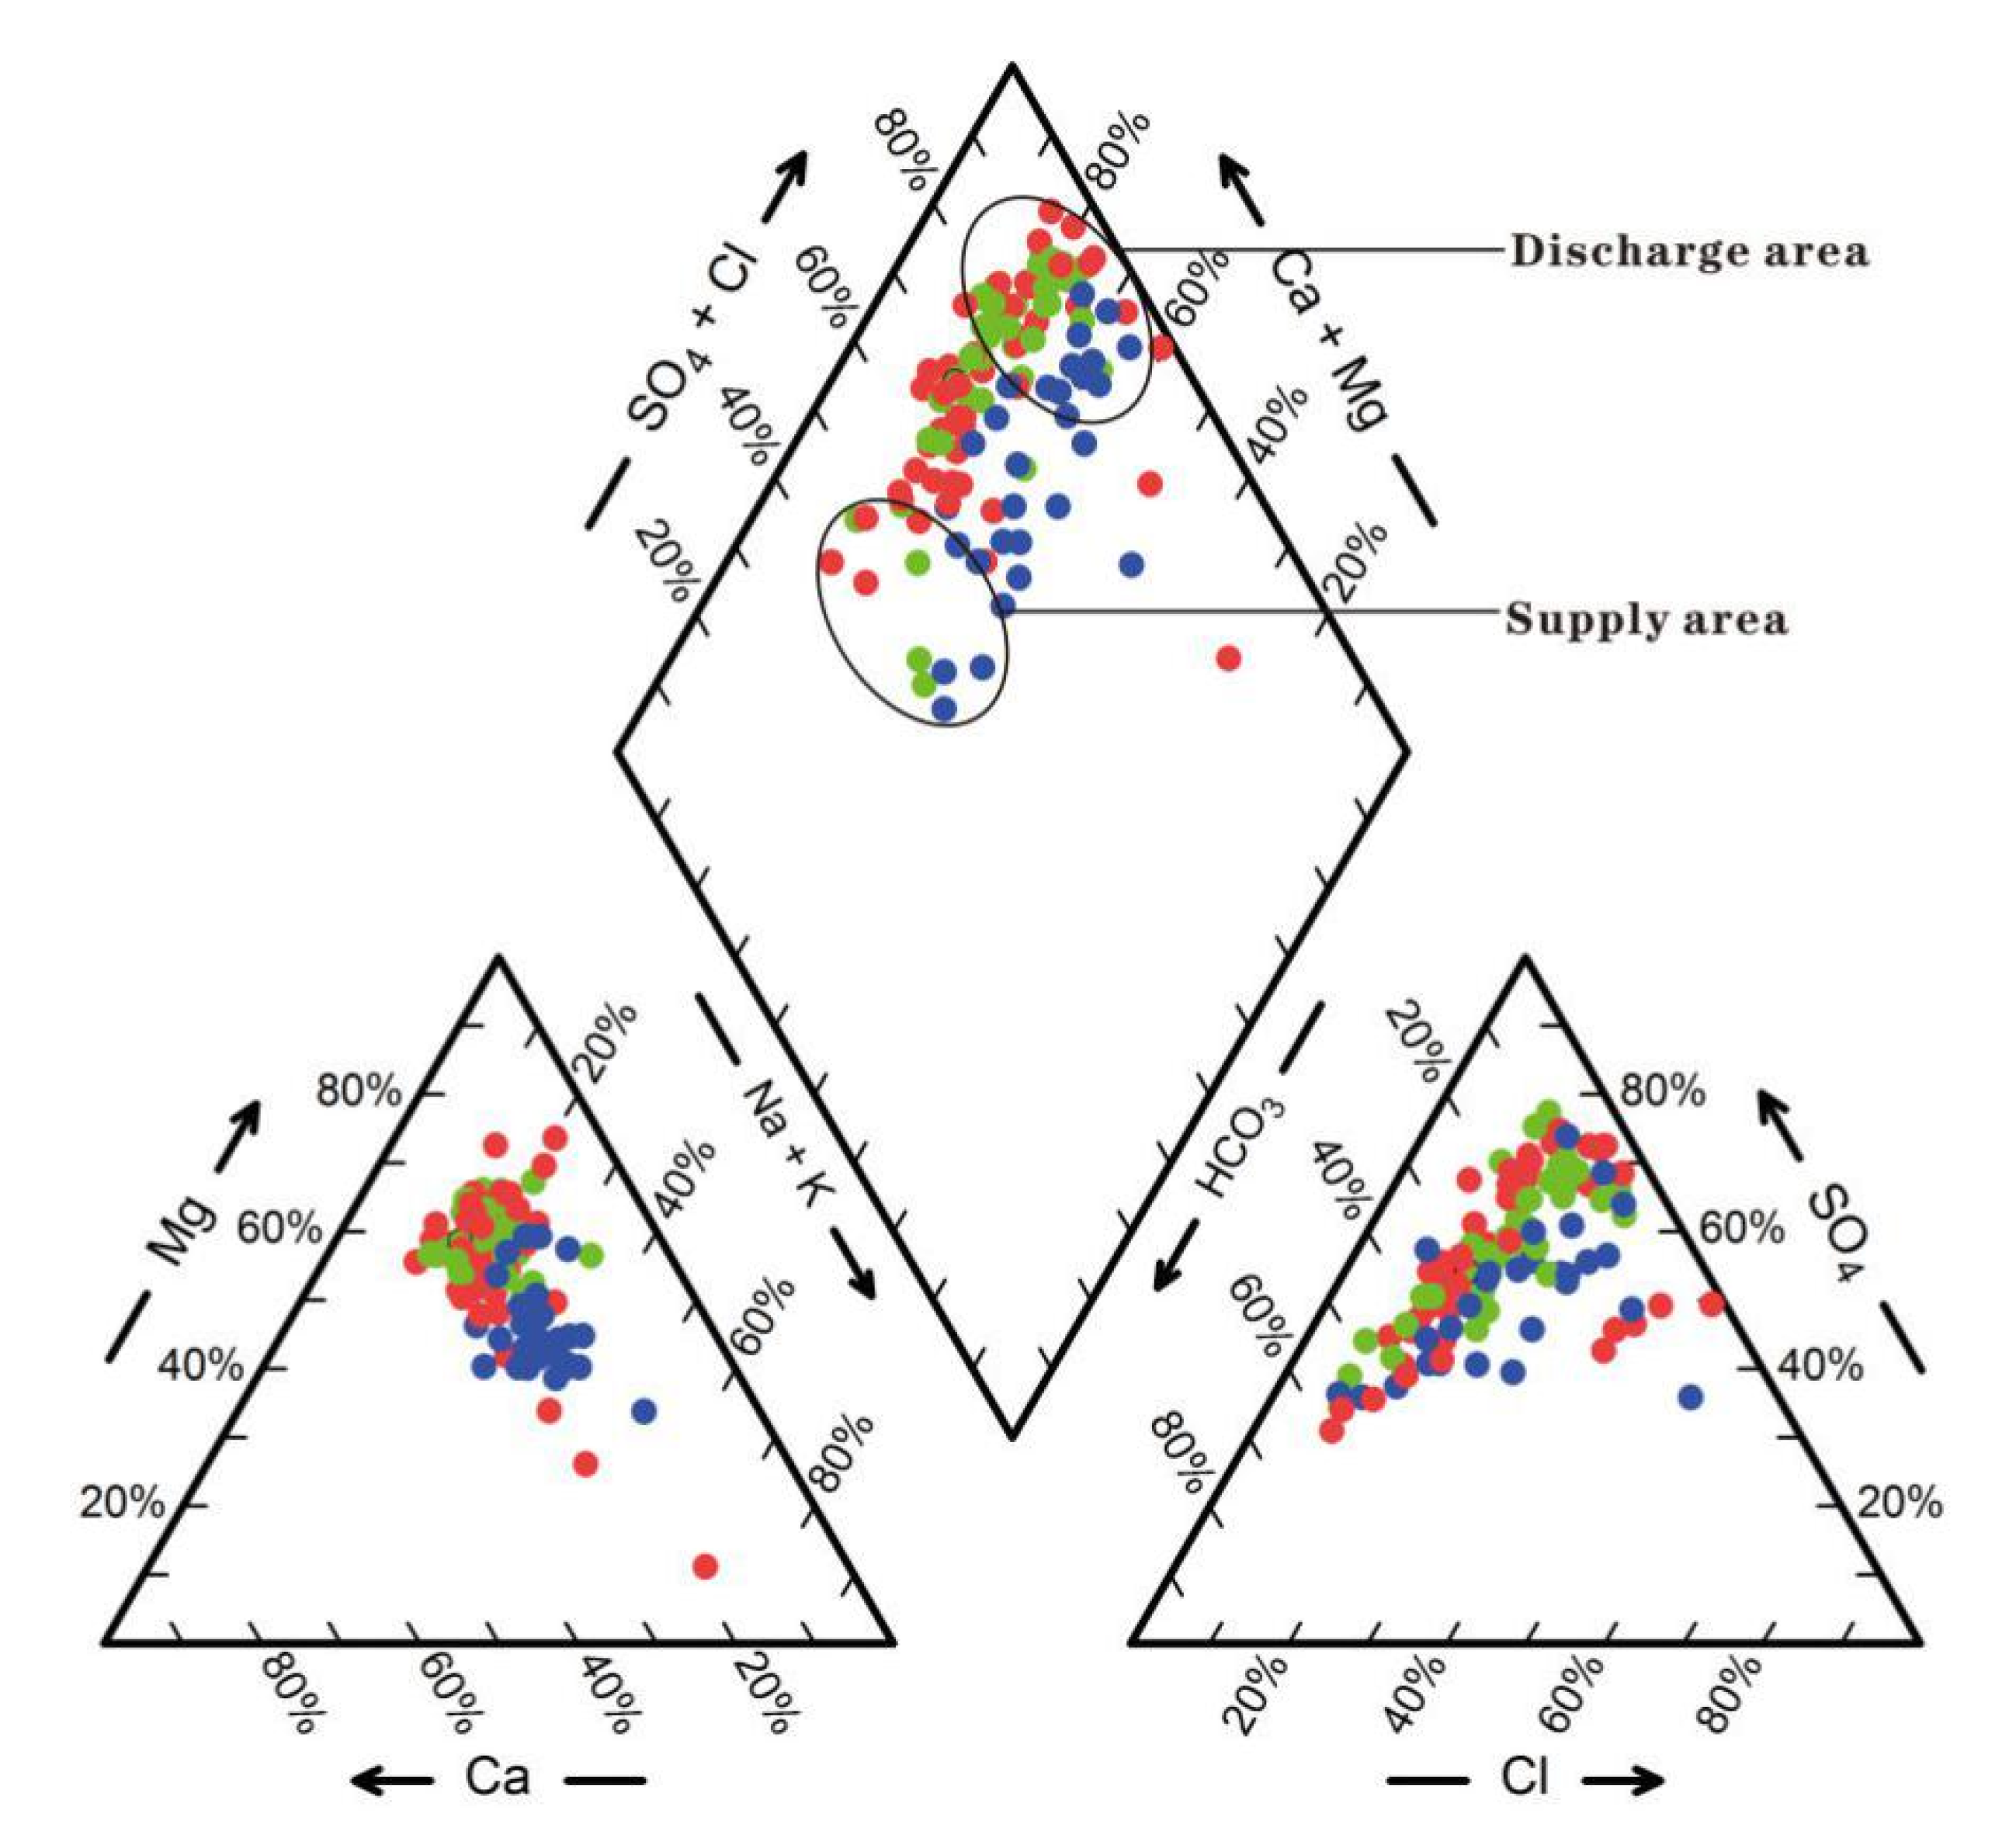
4.1. Hydrochemical Composition of Groundwater Samples
4.1.1. Characteristics of Major Ions
4.1.2. Correlation Analysis
4.1.3. Factor Analysis
4.2. Analysis of Hydrochemical Genesis Types
4.2.1. Analysis of Hydrochemical Characteristics
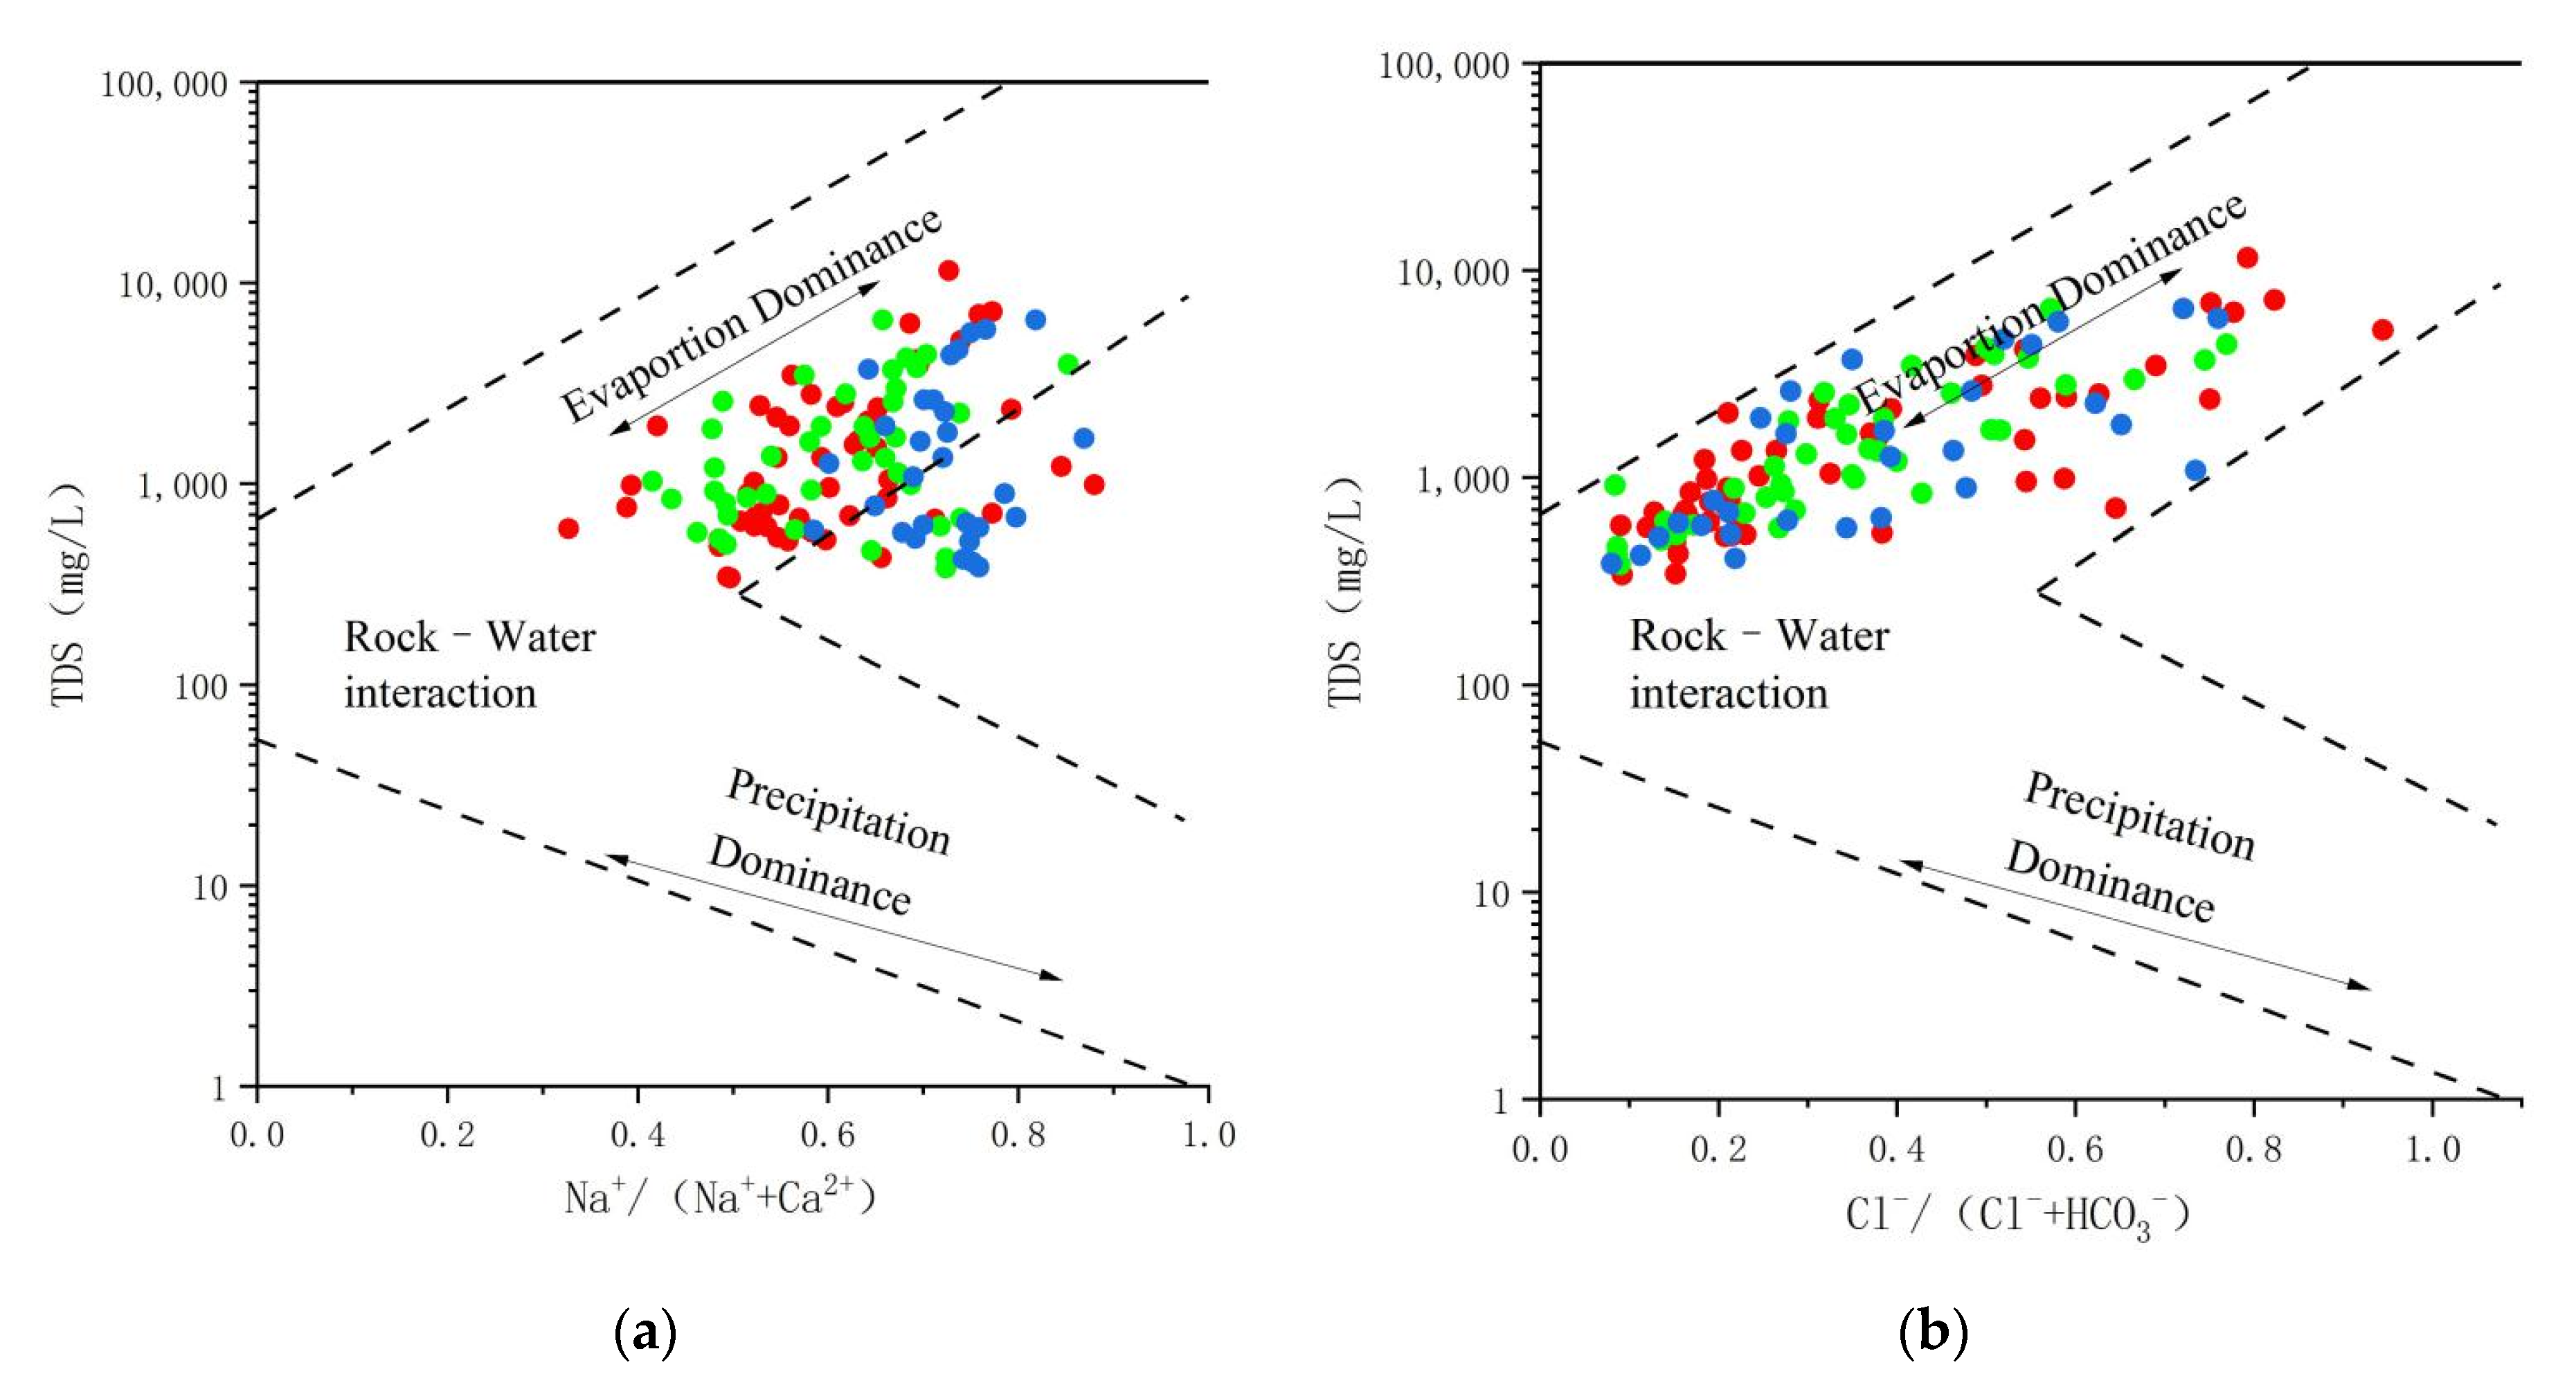
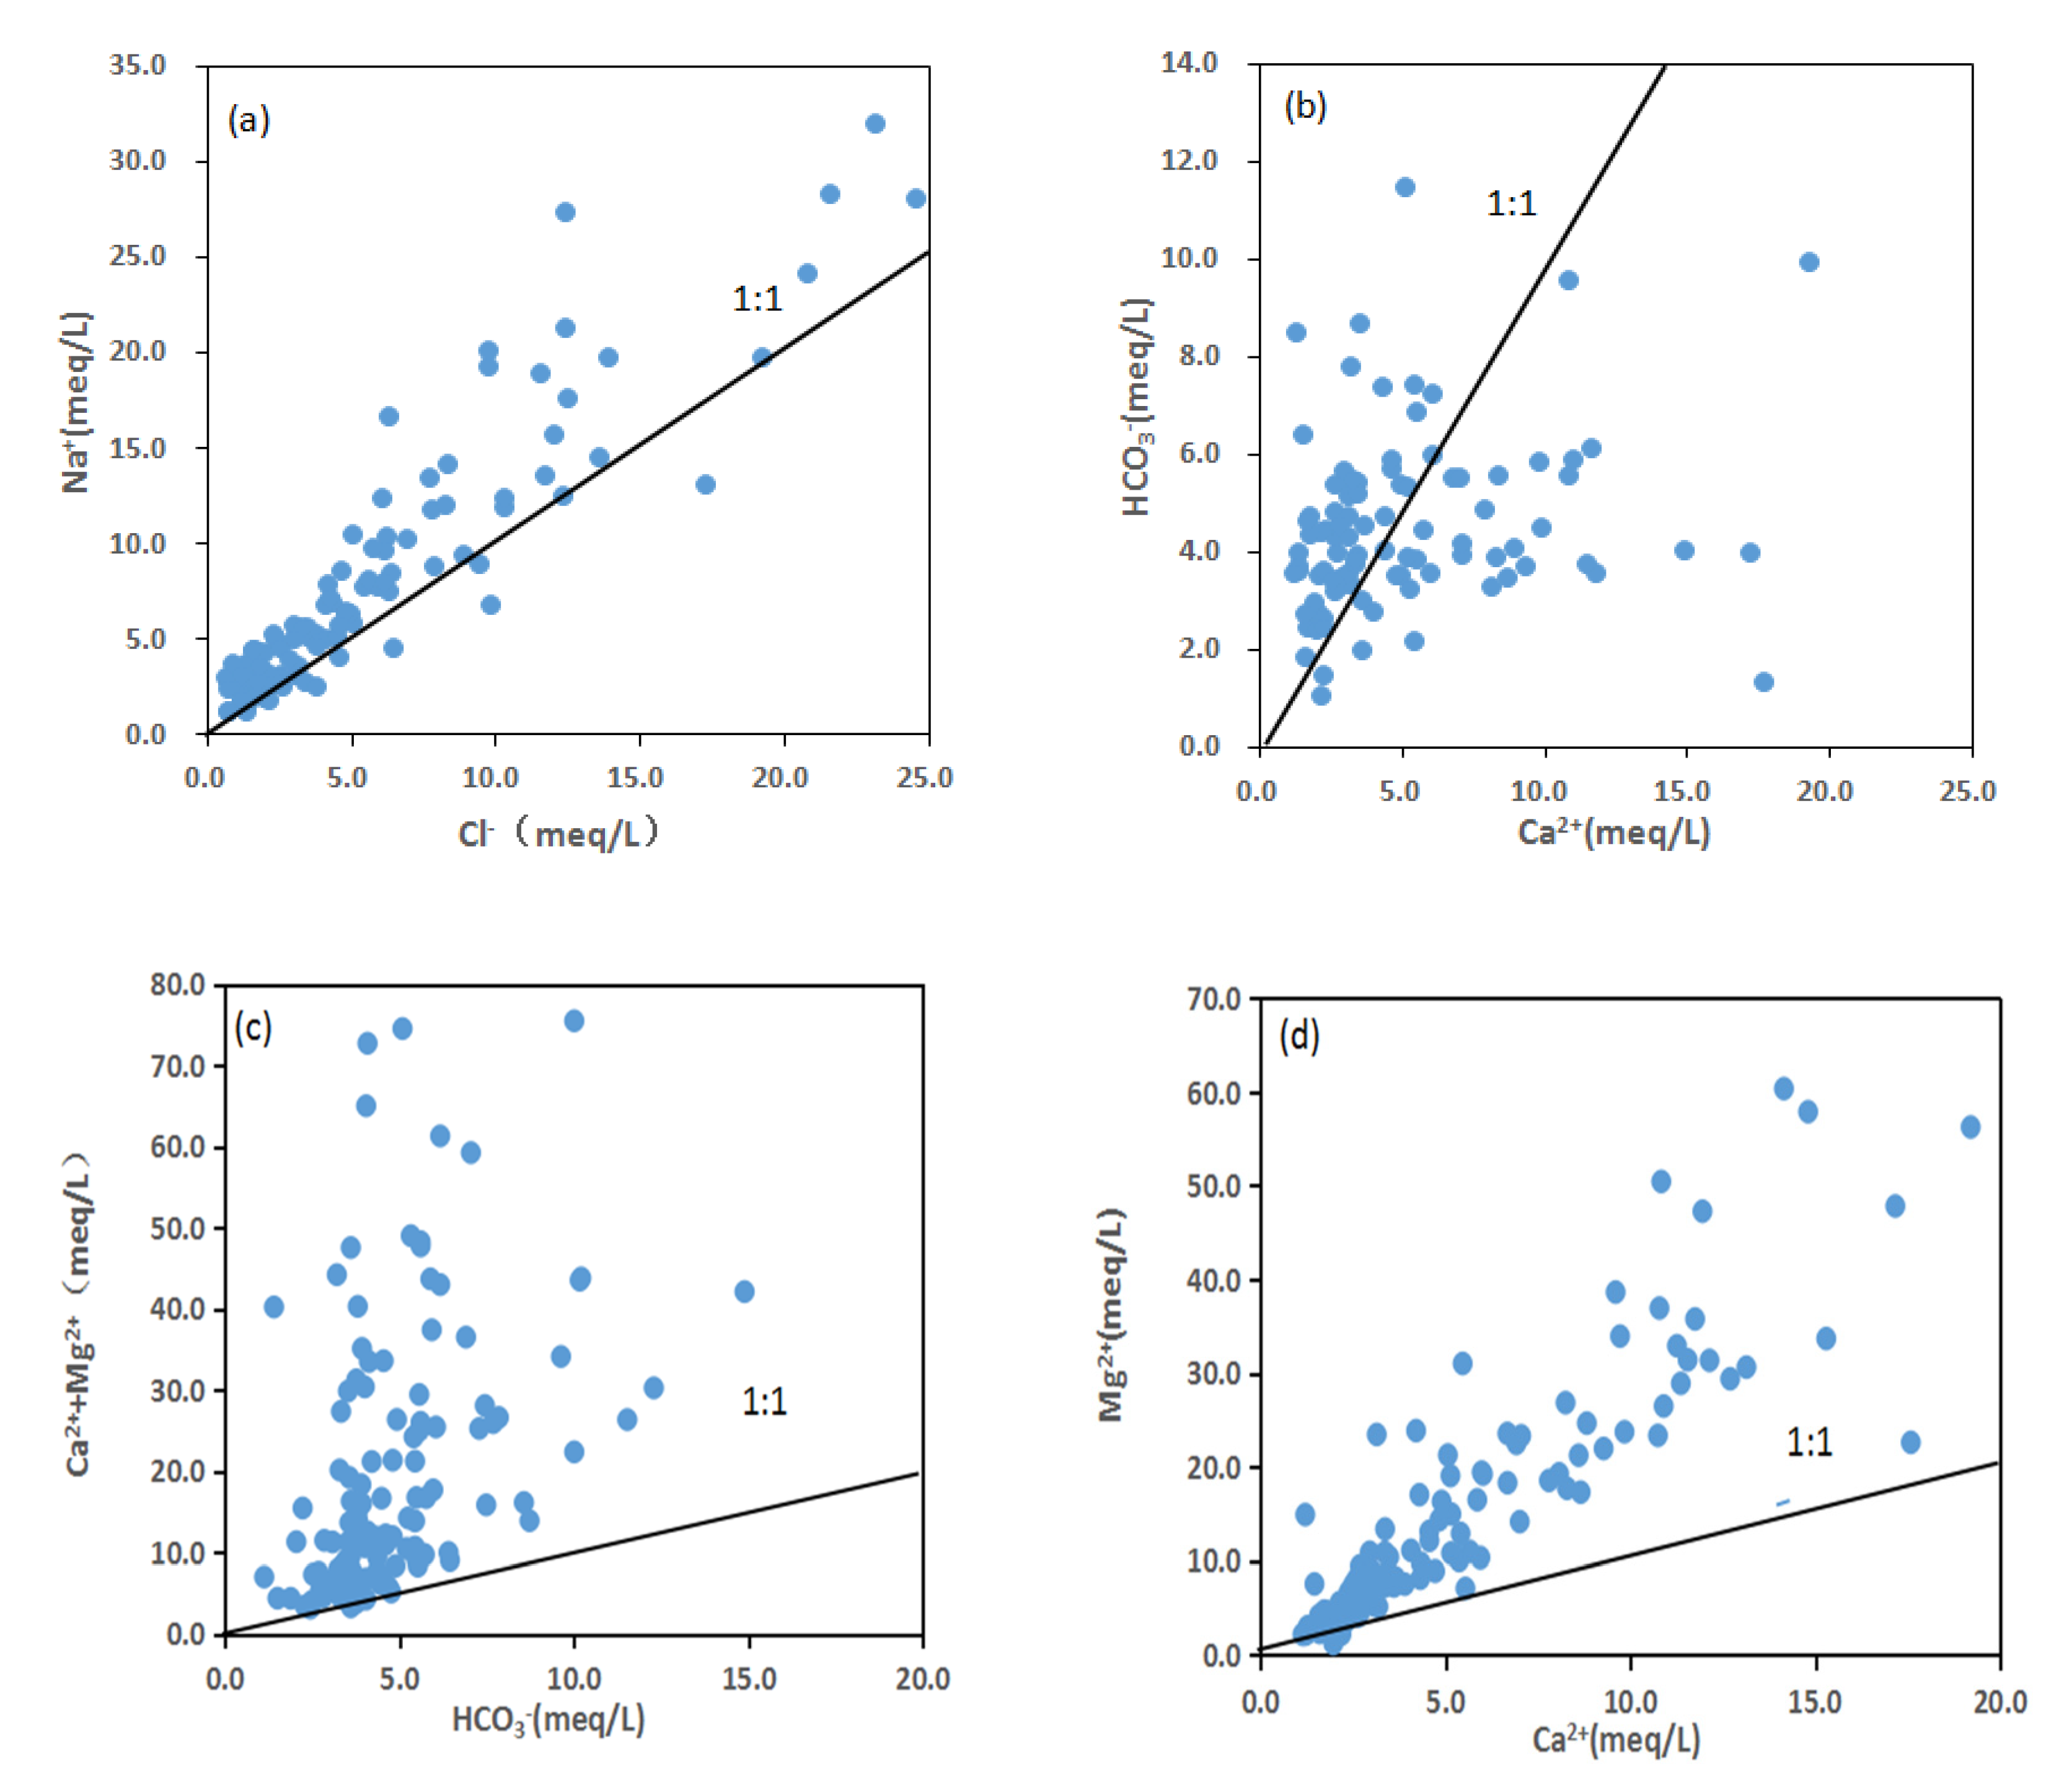
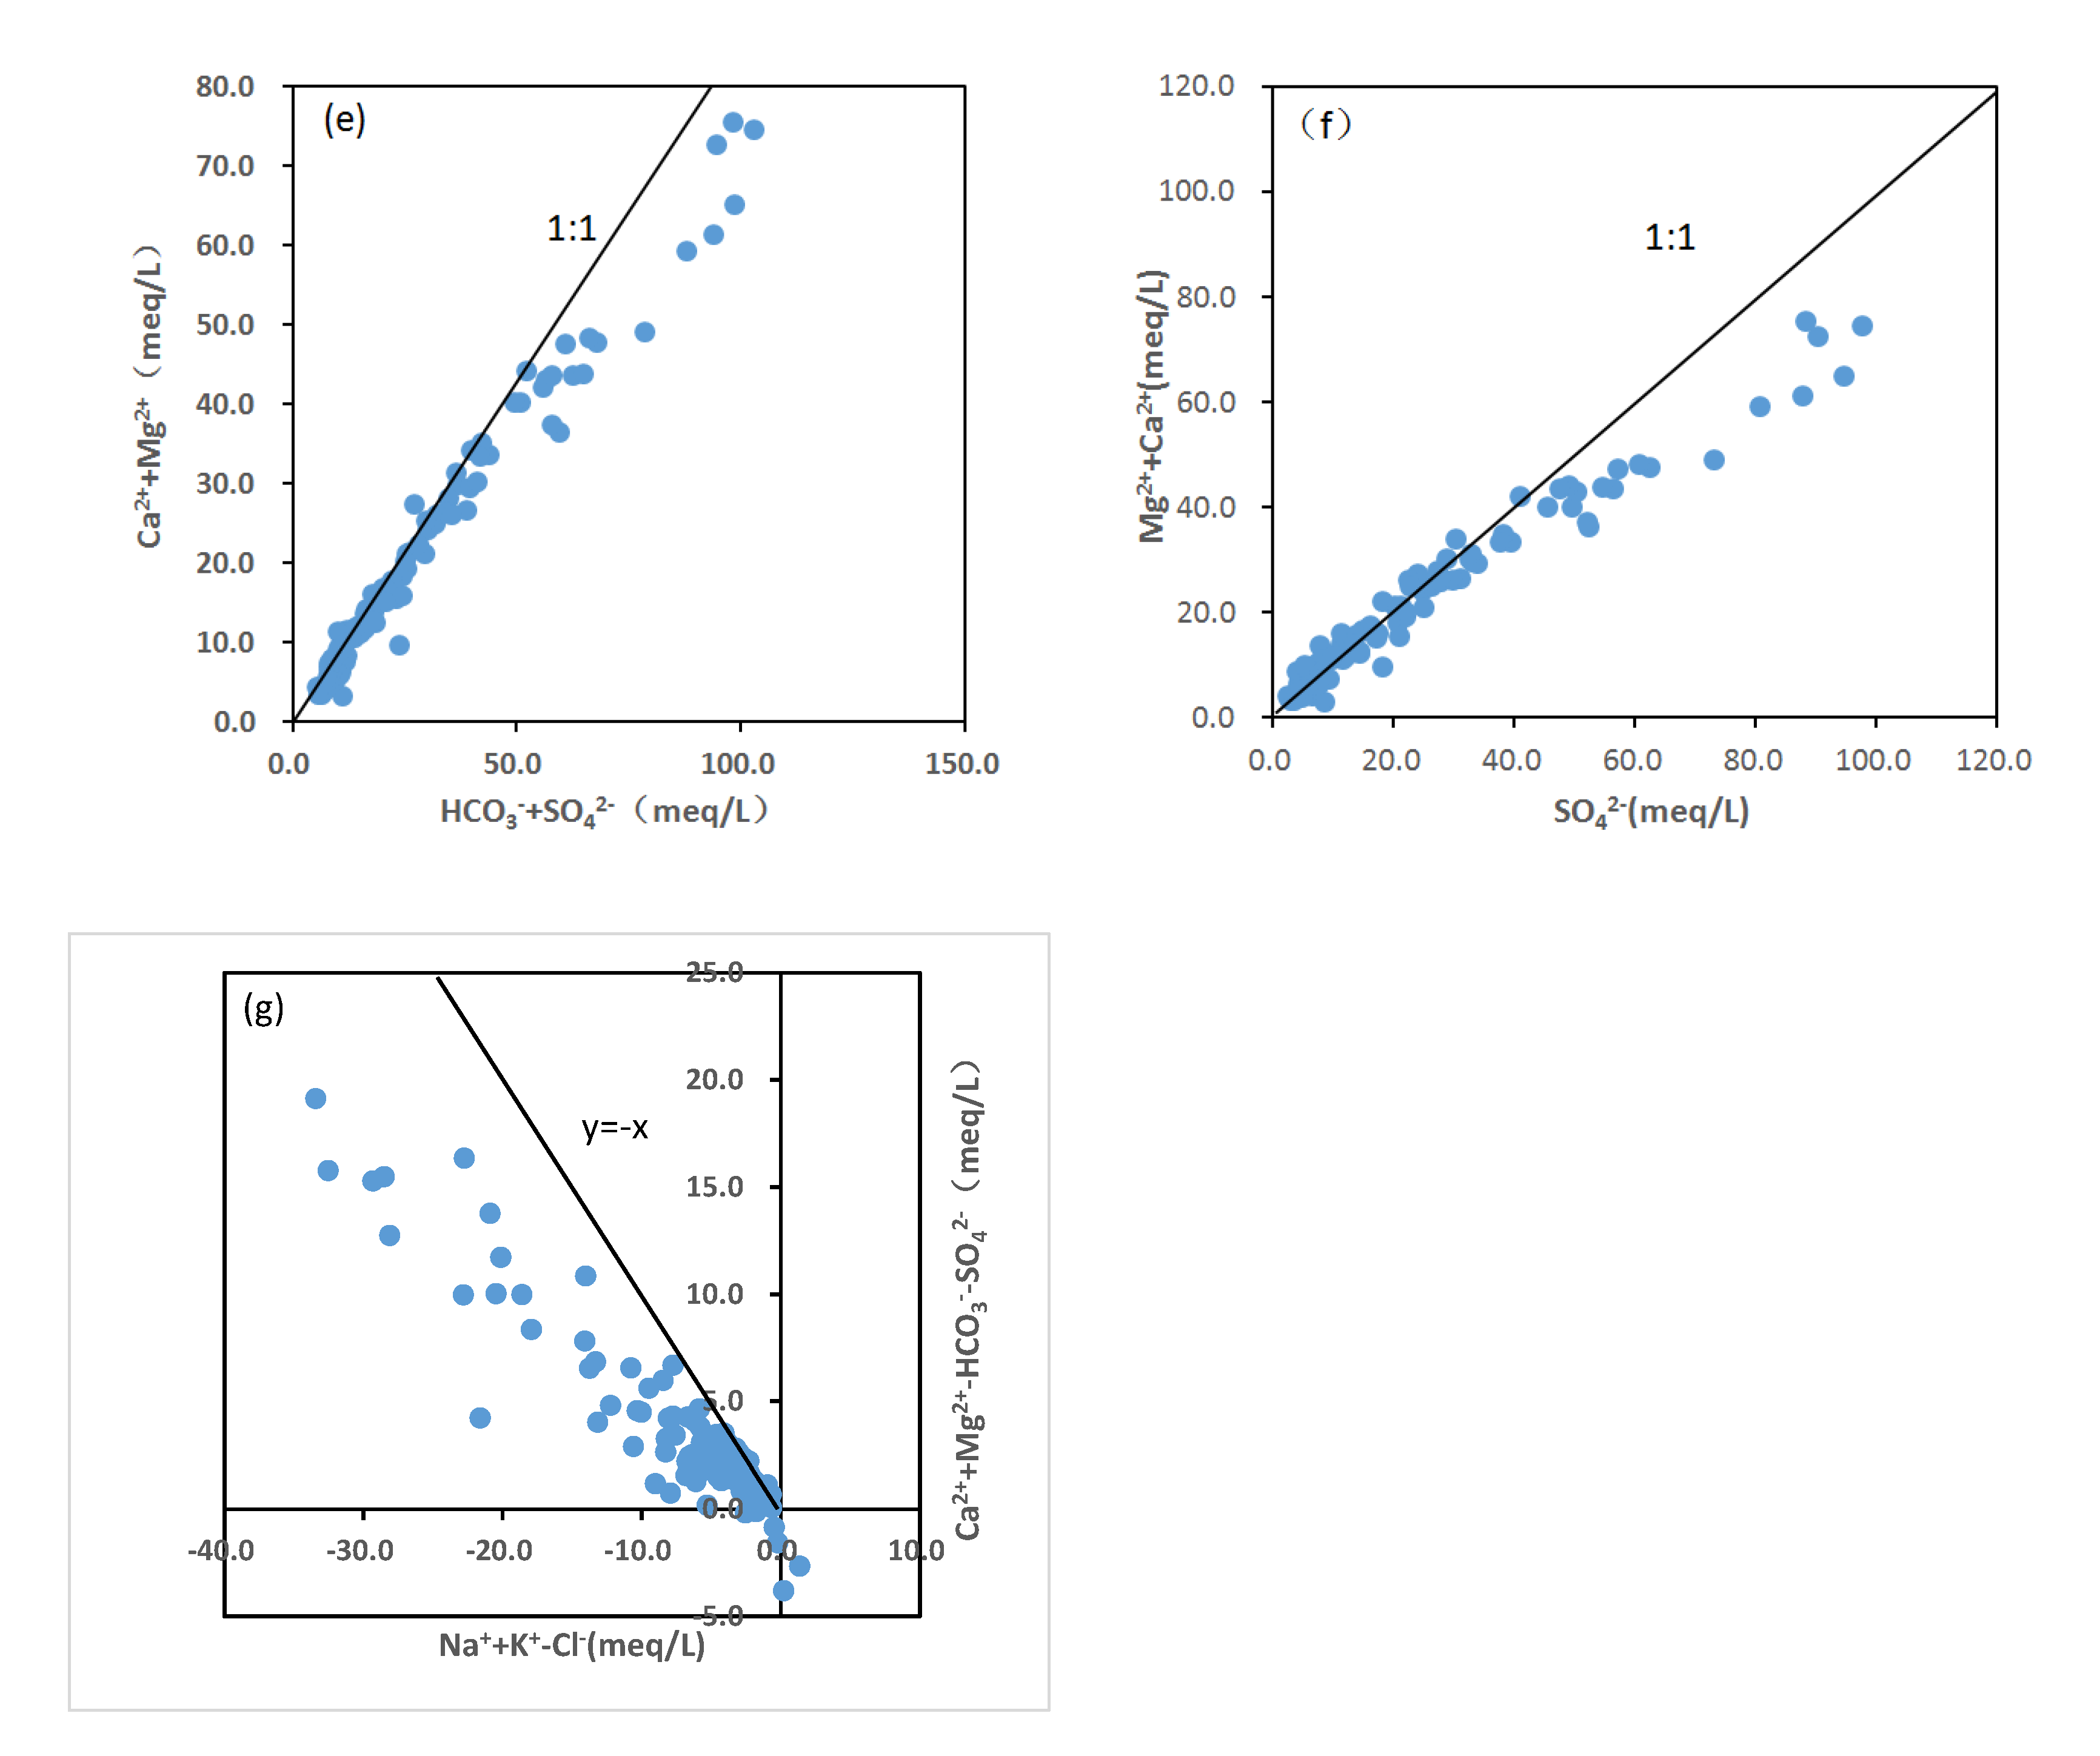
4.2.2. Water–Rock Model Analysis
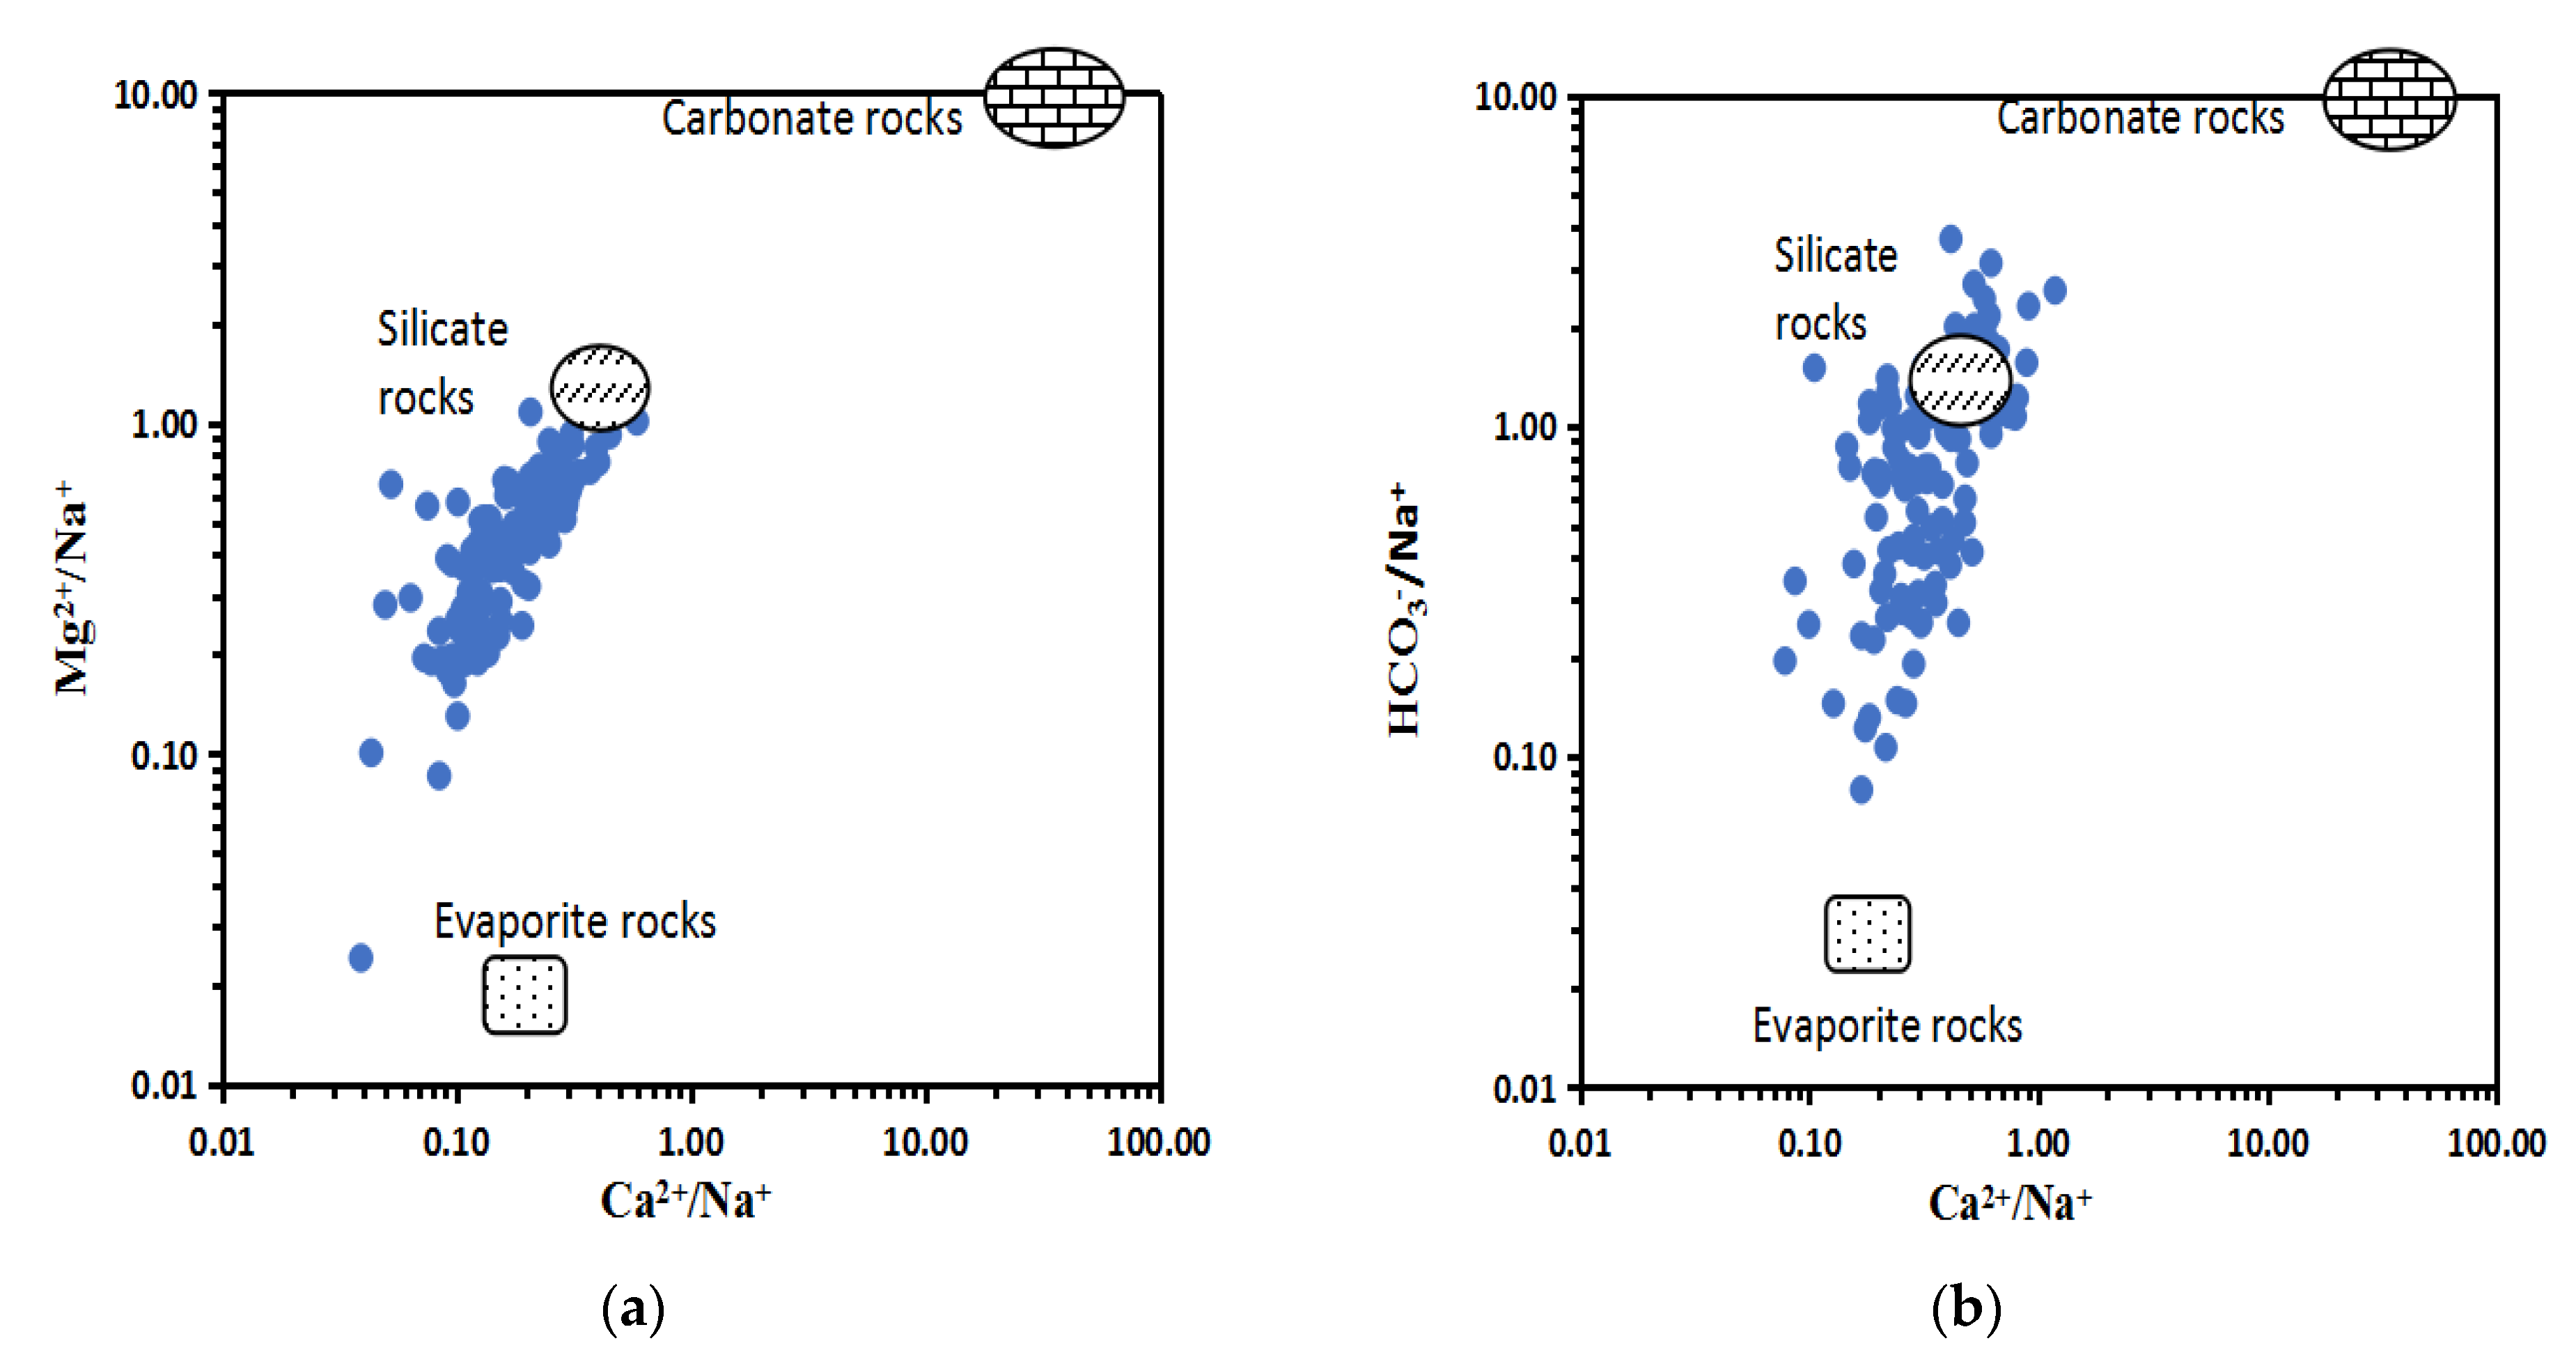
4.2.3. The Major Weathering and Hydrogeochemical Processes Affecting Groundwater Hydrochemistry
4.3. Groundwater Quality Assessment
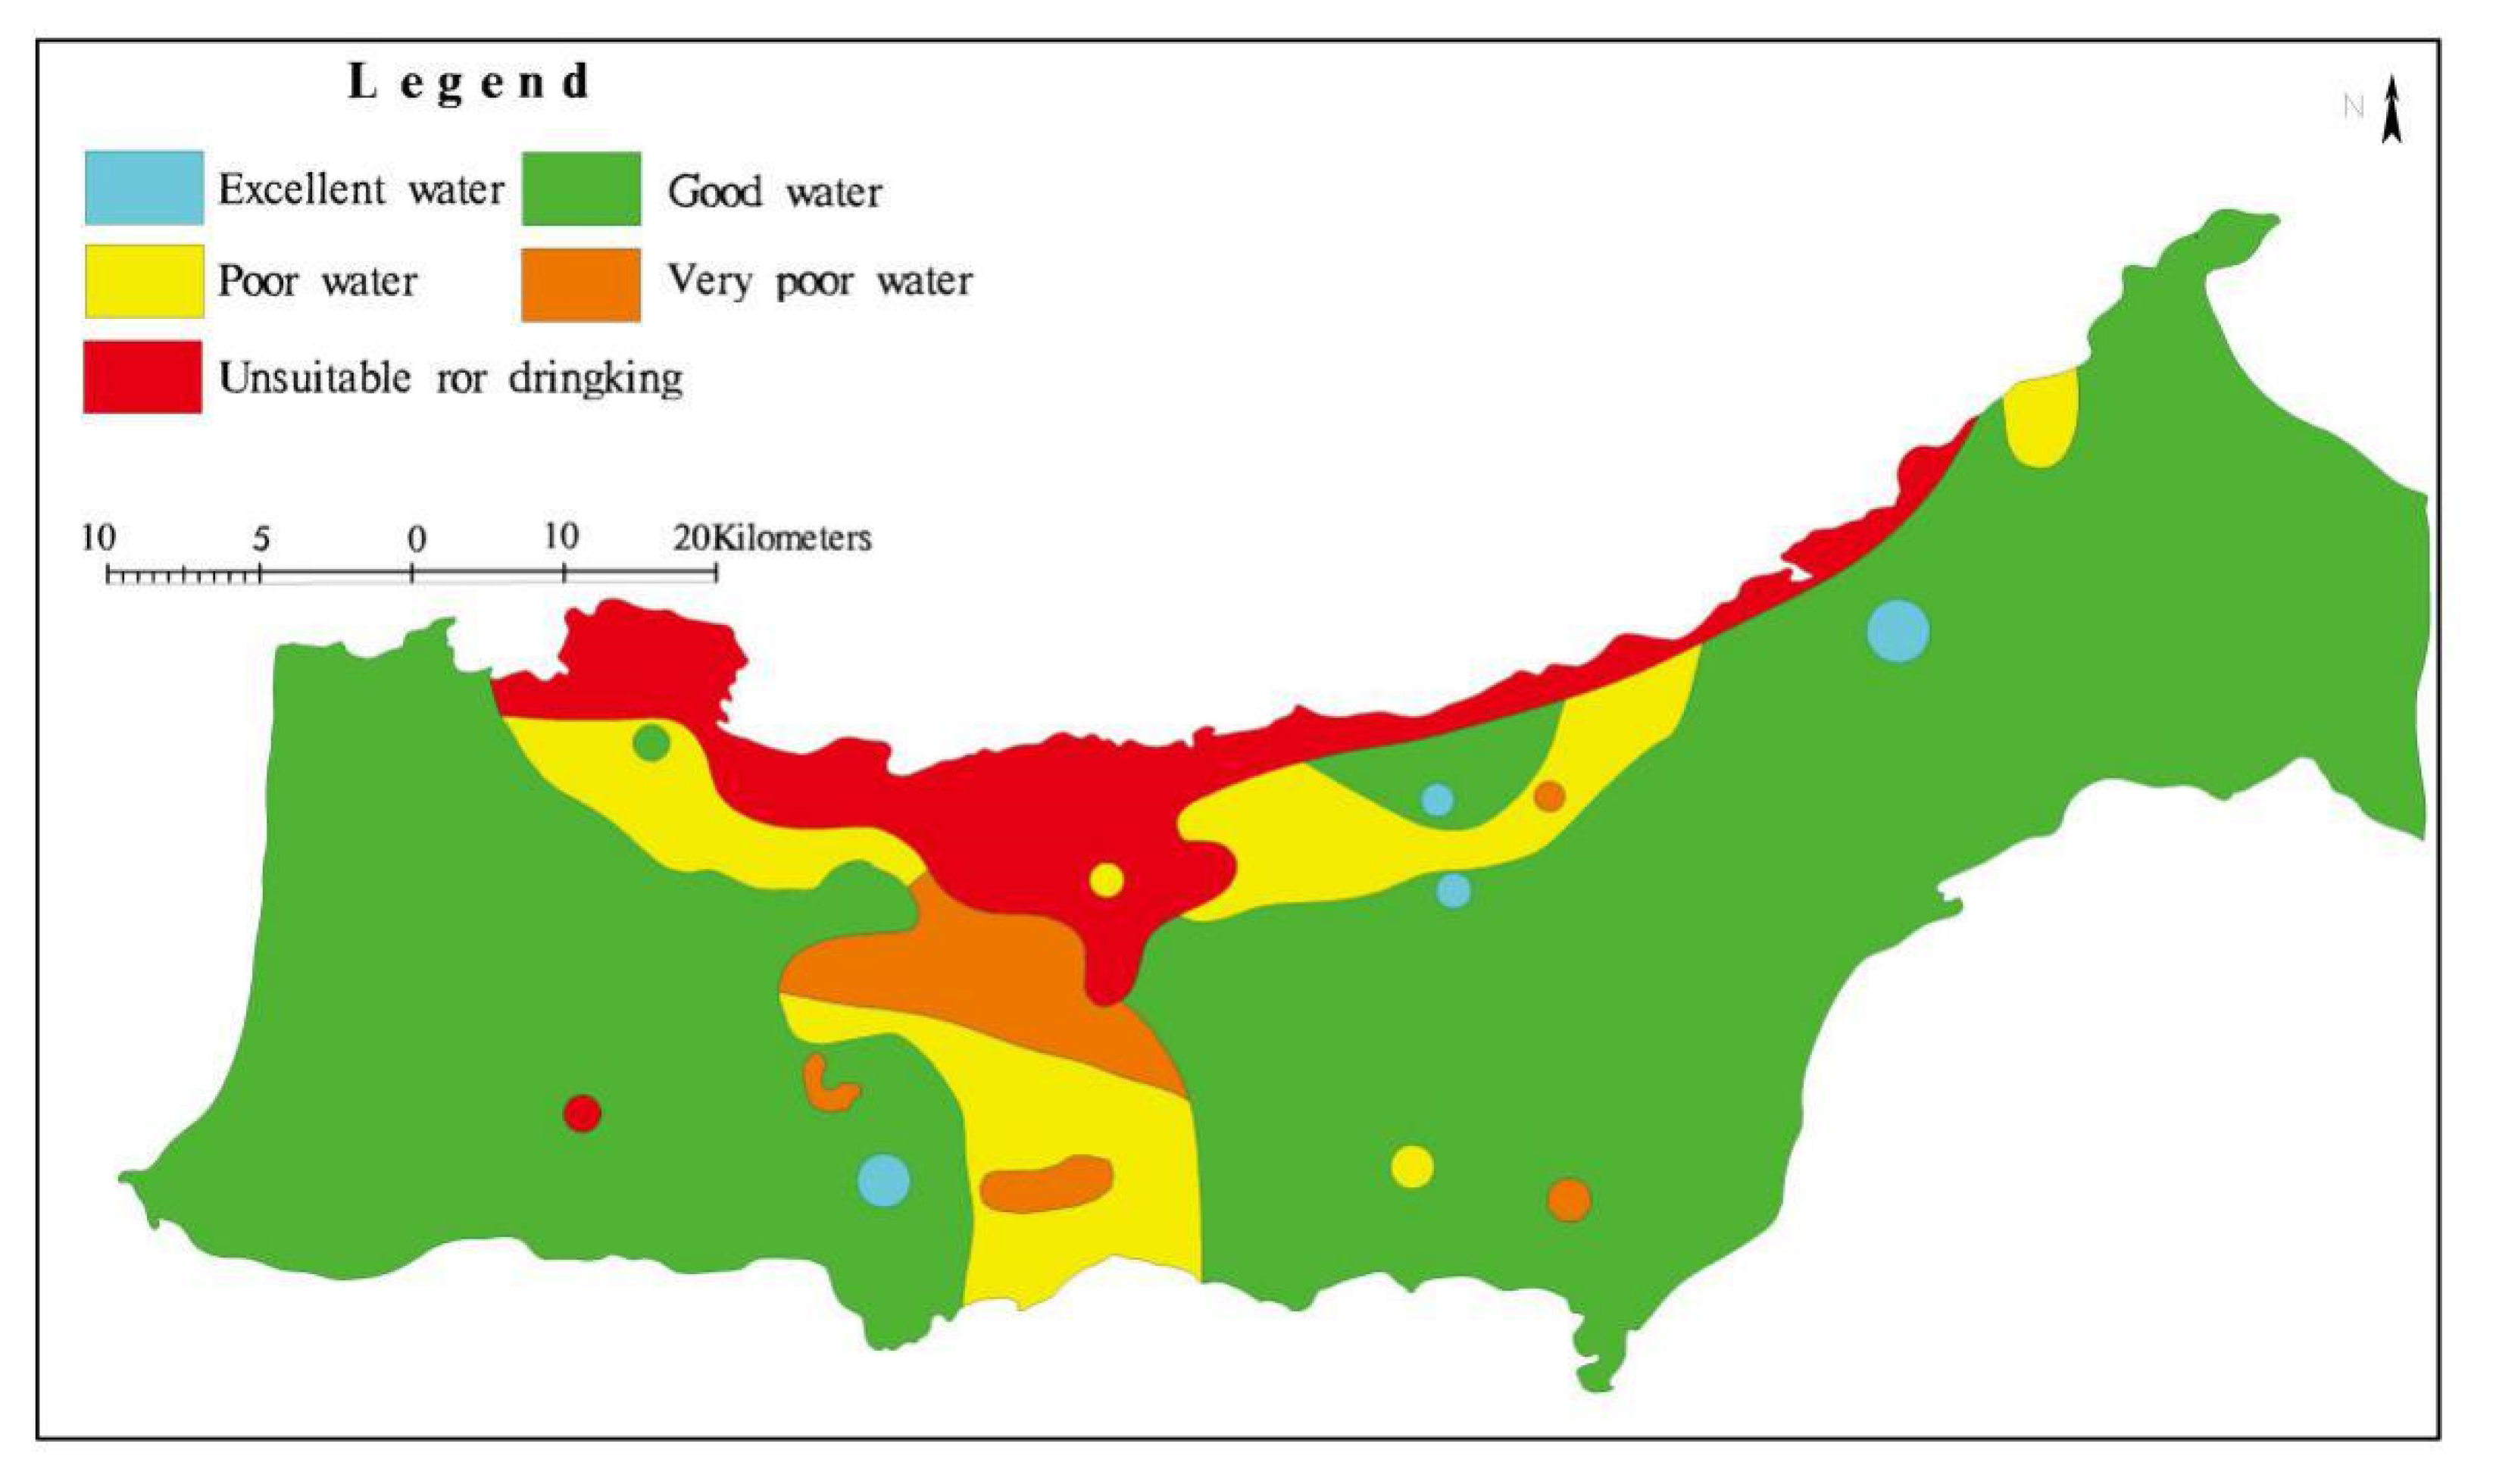
4.3.1. Evaluation of Groundwater Samples According to Drinking Water Standards
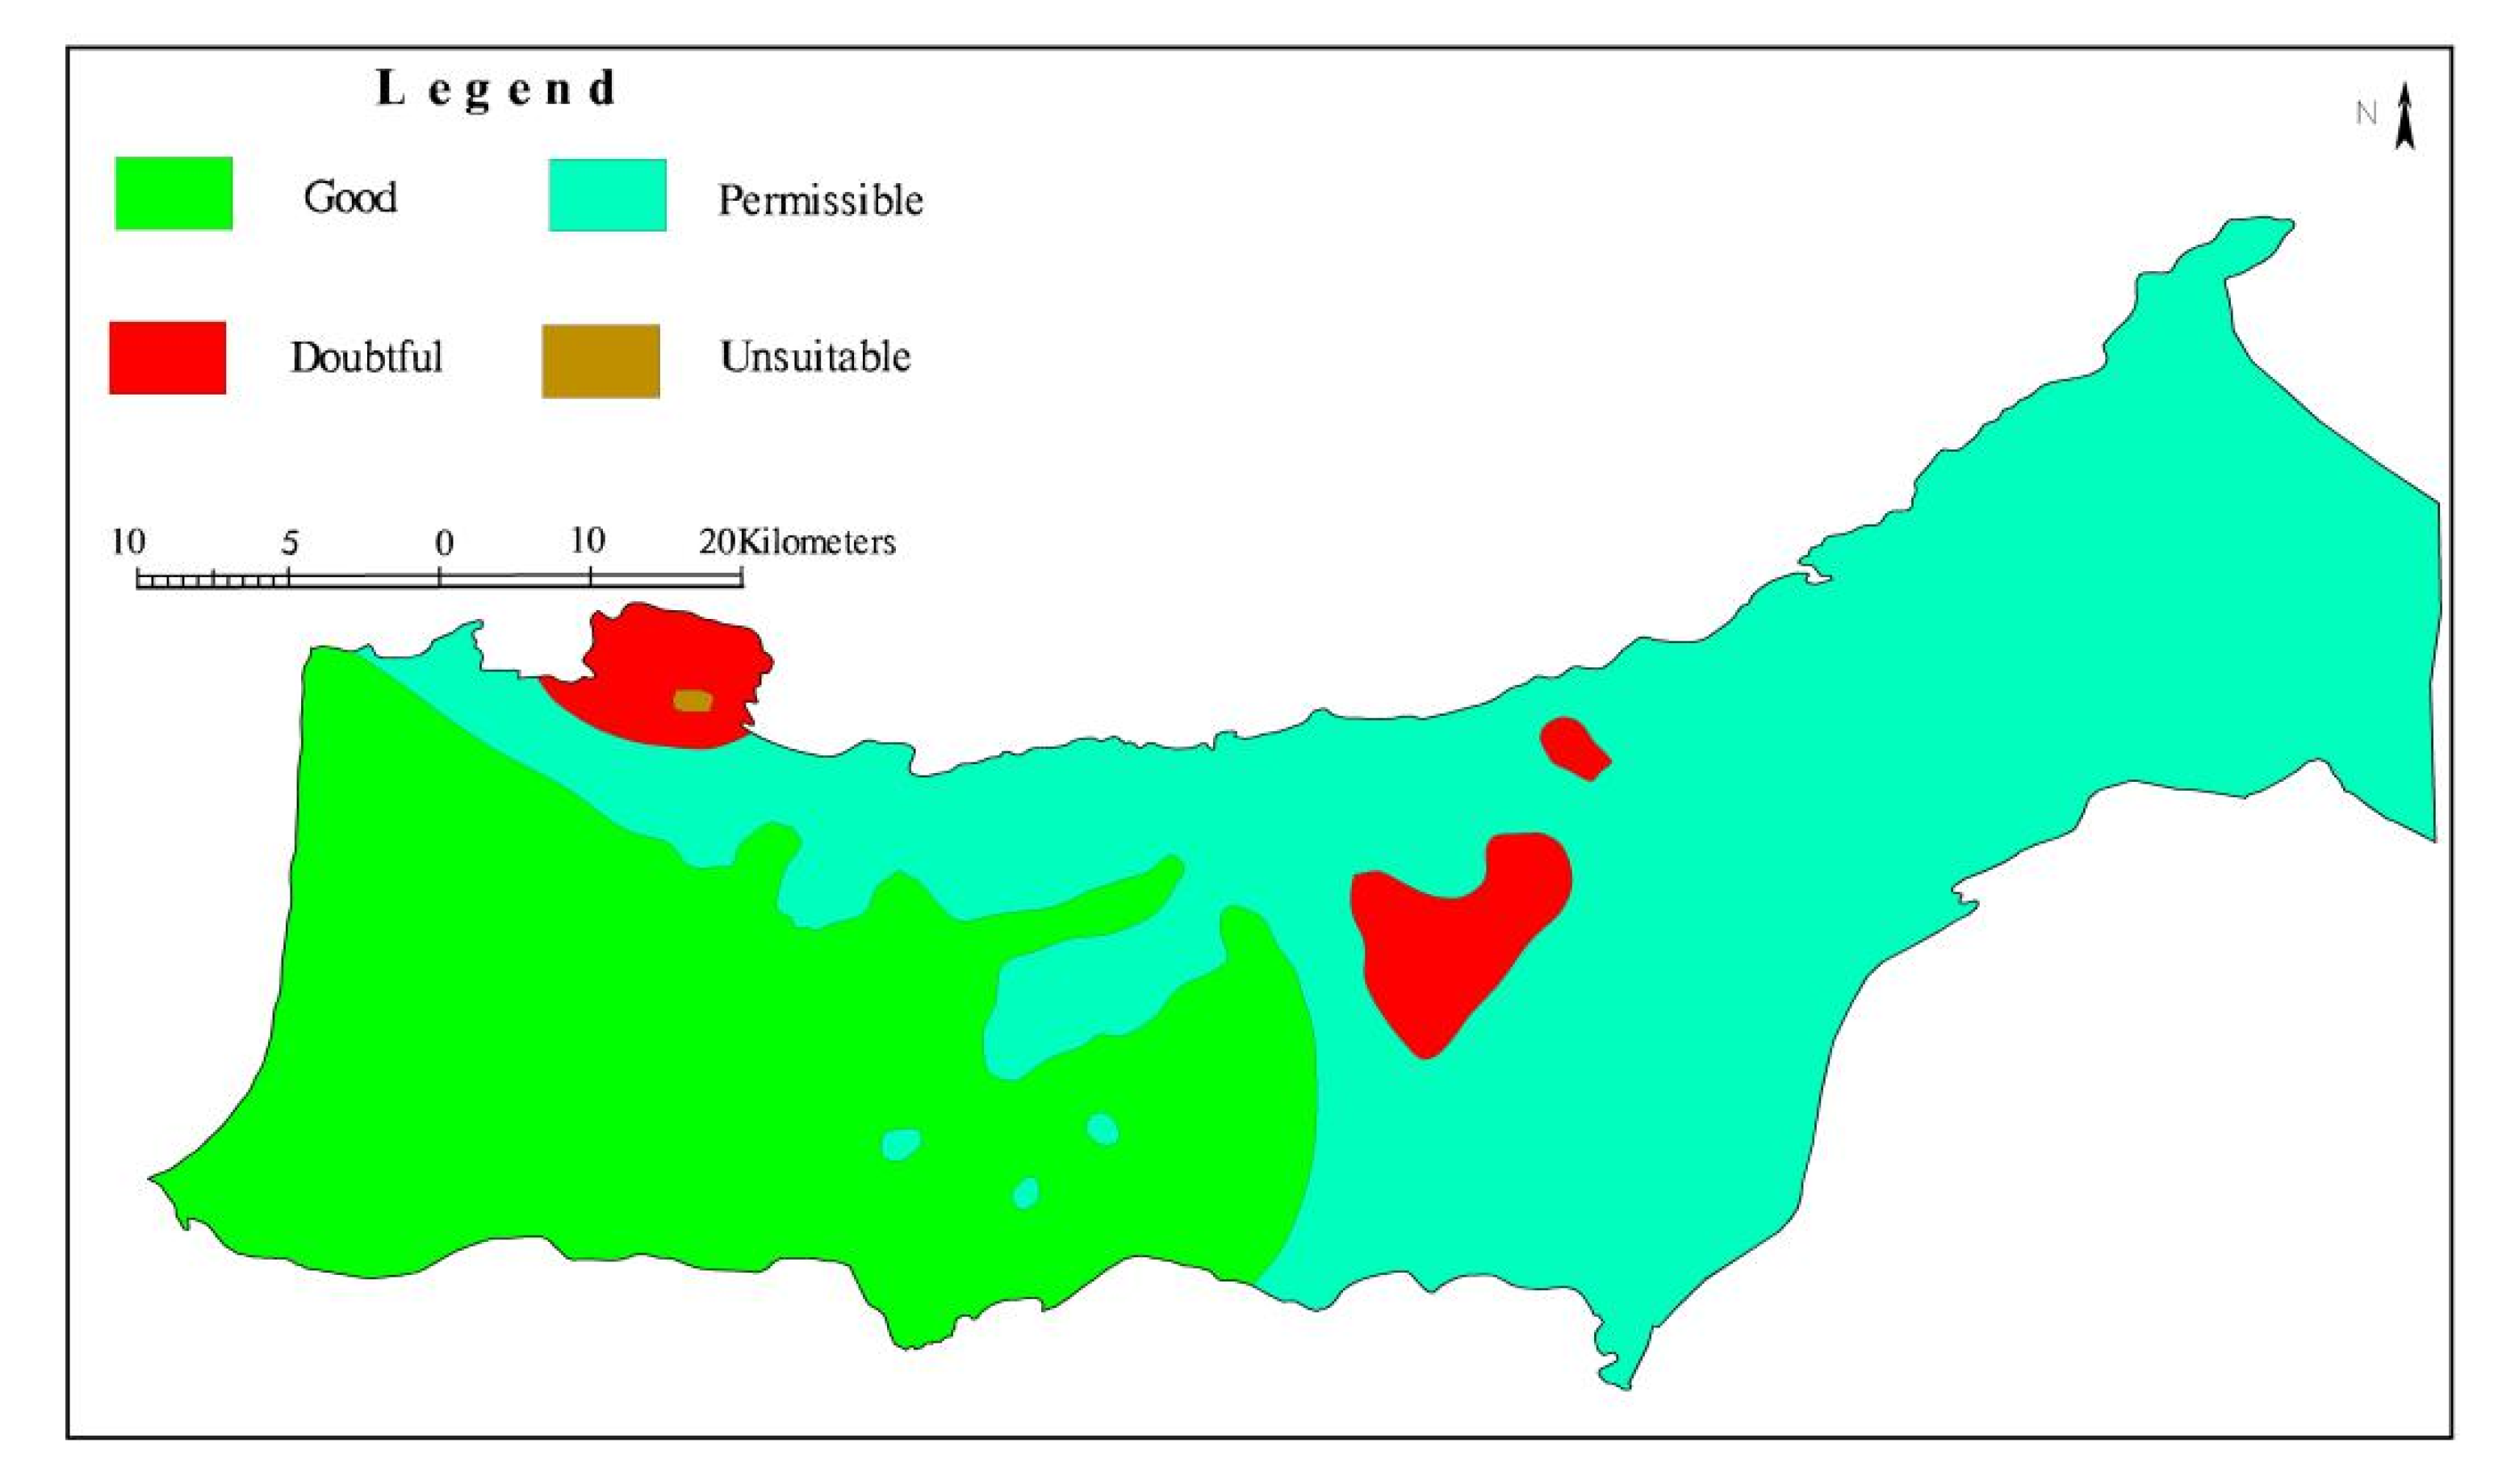
4.3.2. Evaluation of Groundwater Samples According to Agricultural Irrigation Water Standards
Sodium Adsorption Ratio (SAR)
Sodium Percentage (Na%)
Kelly’s Ratio (KR)
Permeability Index (PI)
5. Conclusions
Author Contributions
Funding
Conflicts of Interest
References
- Todd, D.K. Groundwater Hydrology, 2nd ed.; Wiley: Hoboken, NJ, USA, 1980. [Google Scholar]
- Fetter, C.W. Applied Hydrogeology, 3rd ed.; Macmillan College Publication: New York, NY, USA, 1994. [Google Scholar]
- Srinivas, Y.; Oliver, D.H.; Raj, A.S.; Chandrasekar, N. Quality assessment and hydrogeochemical characteristics of groundwater in Agastheeswaram taluk, Kanyakumari district, Tamil Nadu, India. Chin. J. Geochem. 2014, 33, 221–235. [Google Scholar] [CrossRef]
- Wang, S.; Guo, H.Y.; Hu, L.L.; Wang, B. The Relationship between Hydrological Characteristics of Jinta Heihe River Basin and Precipitation. Hubei Agric. Sci. 2017, 56, 3863–3869. [Google Scholar]
- Lu, A.X.; Chen, X.Z.; Wang, J.; Wang, L.H.; Wu, L.Z. Monitoring the Ecology and Environment in the Middle Reaches of the Heihe River Using Remote Sensing. J. Glaciol. Geocryol. 2002, 24, 73–78. [Google Scholar]
- Cui, Z.J.; Xu, Y.Q.; Gao, J.H.; Sun, P.; Gong, J. Land use change and its ecosystem service value evaluation in oasia of Jiuquan-Jinta basin. Bull. Soil Water Conserv. 2014, 34, 252–257, 272. [Google Scholar]
- Li, S. Study on Water Resources Carrying Capacity and Regulation Model in Jinta Basin. Master’s Thesis, Lanzhou University, Lanzhou, China, 2017. [Google Scholar]
- Ma, L.T. Water Chemistry Characteristics of Groundwater in Heihe River Basin. Master’s Thesis, Northwest University, Xi’an, China, 2019. [Google Scholar]
- Chen, J. Hydrochemical Characteristics and Its Evolution Modeling of Groundwater in Jinta Basin, Gansu. Master’s Thesis, Lanzhou University, Lanzhou, China, 2019. [Google Scholar]
- Papazotos, P.; Koumantakis, I.; Vasileiou, E. Hydrogeochemical assessment and suitability of groundwater in a typical Mediterranean coastal area: A case study of the Marathon basin, NE Attica, Greece. HydroResearch 2019, 2, 49–59. [Google Scholar] [CrossRef]
- Alexakis, D. Meta-Evaluation of Water Quality Indices. Application into Groundwater Resources. Water 2020, 12, 1890. [Google Scholar] [CrossRef]
- Gu, X.M.; Xiao, Y.; Yin, S.Y.; Hao, Q.C.; Liu, H.L.; Hao, Z.Y.; Meng, G.P.; Pei, Q.M.; Yan, H.J. Hydrogeochemical Characterization and Quality Assessment of Groundwater in a Long-Term Reclaimed Water Irrigation Area, North China Plain. Water 2018, 10, 1209. [Google Scholar] [CrossRef] [Green Version]
- Abbasnia, A.; Yousefi, N.; Mahvi, A.H.; Nabizadeh, R.; Radfard, M.; Yousefi, M.; Alimohammadi, M. Evaluation of groundwater quality using water quality index and its suitability for assessing water for drinking and irrigation purposes: Case study of Sistan and Baluchistan province (Iran). Hum. Ecol. Risk Assess. 2019, 25, 988–1005. [Google Scholar] [CrossRef]
- Karim, A.; Cruz, M.G.; Hernandez, E.A.; Uddameri, V. A GIS-Based Fit for the Purpose Assessment of Brackish Groundwater Formations as an Alternative to Freshwater Aquifers. Water 2020, 12, 2299. [Google Scholar] [CrossRef]
- Chitsazan, M.; Aghazadeh, N.; Mirzaee, Y.; Golestan, Y. Hydrochemical characteristics and the impact of anthropogenic activity on groundwater quality in suburban area of Urmia city, Iran. Environ. Dev. Sustain. 2019, 21, 331–351. [Google Scholar] [CrossRef]
- Abhisheka, V.R.; Kumar, R.B.B. Groundwater quality assessment for domestic and irrigational suitability in Kallada River Basin, South Kerala, India. Nat. Environ. Pollut. Technol. 2018, 17, 153–159. [Google Scholar]
- Shahab, A.; Qi, S.H.; Zaheer, M.; Rashid, A.; Talib, M.A.; Ashraf, U. Hydrochemical characteristics and water quality assessment for drinking and agricultural purposes in District Jacobabad, Lower Indus Plain, Pakistan. Int. J. Agric. Biol. Eng. 2018, 11, 115–121. [Google Scholar] [CrossRef]
- Sunitha, V.; Reddy, Y.S. Hydrogeochemical evaluation of groundwater in and around Lakkireddipalli and Ramapuram, Y.S.R District, Andhra Pradesh, India. HydroResearch 2019, 2, 85–96. [Google Scholar] [CrossRef]
- Brindha, K.; Kavitha, R. Hydrochemical assessment of surface water and groundwater quality along Uyyakondan channel, south India. Environ. Earth Sci. 2015, 73, 5383–5393. [Google Scholar] [CrossRef]
- Kelley, W.P.; Brown, S.M.; Liebig, G.F.J. Chemical effects of saline irrigation water on soils. Soil Sci. 1940, 49, 95–108. [Google Scholar] [CrossRef]
- Doneen, L.D. Notes on water quality in agriculture. In Water Science and Engineering Paper 4001; Department of Water Sciences and Engineering, University of California: Oakland, CA, USA, 1964. [Google Scholar]
- Koffi, K.V.; Obuobie, E.; Banning, A.; Wohnlich, S. Hydrochemical characteristics of groundwater and surface water for domestic and irrigation purposes in Vea catchment, Northern Ghana. Environ. Earth Sci. 2017, 76, 185. [Google Scholar] [CrossRef]
- Yang, Q.C.; Li, Z.J.; Ma, H.Y.; Wang, L.C.; Martin, J.D. Identification of the hydrogeochemical processes and assessment of groundwater quality using classic integrated geochemical methods in the Southeastern part of Ordos basin, China. Environ. Pollut. 2016, 218, 879–888. [Google Scholar] [CrossRef]
- Zhou, P.P.; Wang, Z.M.; Zhang, J.Y.; Yang, Z.X.; Li, X.L. Study on the hydrochemical characteristics of groundwater along the Taklimakan Desert Highway. Environ. Earth Sci. 2016, 75, 1378. [Google Scholar] [CrossRef]
- Paul, R.; Brindha, K.; Gowrisankar, G.; Tan, M.L.; Singh, M.K. Identification of hydrogeochemical processes controlling groundwater quality in Tripura, Northeast India using evaluation indices, GIS, and multivariate statistical methods. Environ. Earth Sci. 2019, 78, 470. [Google Scholar] [CrossRef]
- Brindha, K.; Pavelic, P.; Sotoukee, T.; Douangsavanh, S.; Elango, L. Geochemical Characteristics and Groundwater Quality in the Vientiane Plain, Laos. Expo. Health 2016, 9, 89–104. [Google Scholar] [CrossRef]
- Liu, J.T.; Gao, Z.J.; Wang, Z.Y.; Xu, X.Y.; Su, Q.; Wang, S.; Qu, W.L.; Xing, T.J. Hydrogeochemical processes and suitability assessment of groundwater in the Jiaodong Peninsula, China. Environ. Monit. Assess. 2020, 192, 384. [Google Scholar] [CrossRef] [PubMed]
- Piper, A.M. A graphic procedure in the geochemical interpretation of water-analysis. Trans. Am. Geophys. Union 1944, 25, 914–923. [Google Scholar] [CrossRef]
- Gibbs, R.J. Mechanisms controlling world water chemistry. Science 1970, 170, 1088–1099. [Google Scholar] [CrossRef] [PubMed]
- Gaillardet, J.; Dupré, B.; Louvat, P.; Allègre, C.J. Global silicate weathering and CO2 consumption rates deduced from the chemistry of large rivers. Chem. Geol. 1999, 159, 3–30. [Google Scholar] [CrossRef]
- Liu, J.T.; Gao, Z.J.; Wang, M.; Li, Y.Z.; Shi, M.J.; Zhang, H.Y.; Ma, Y.Y. Hydrochemical characteristics and possible controls in the groundwater of the Yarlung Zangbo River Valley, China. Environ. Earth Sci. 2019, 78. [Google Scholar] [CrossRef]
- Nematollahi, M.J.; Ebrahimi, P.; Razmara, M.; Ghasemi, A. Hydrogeochemical investigations and groundwater quality assessment of Torbat-Zaveh plain, Khorasan Razavi, Iran. Environ. Monit. Assess. 2016, 2, 188. [Google Scholar] [CrossRef]


| Parameter | WHO Standards (mg L−1, Except pH) | Weight (wi) | Relative Weights (Wi) |
|---|---|---|---|
| pH | 8.5 | 3 | 0.083 |
| TDS | 500 | 5 | 0.139 |
| Ca2+ | 75 | 3 | 0.083 |
| Mg2+ | 50 | 3 | 0.083 |
| Na+ | 200 | 4 | 0.111 |
| K+ | 12 | 2 | 0.056 |
| HCO3− | 120 | 1 | 0.028 |
| Cl− | 250 | 5 | 0.139 |
| SO42− | 250 | 5 | 0.139 |
| NO3− | 11 | 5 | 0.139 |
| ∑ | -- | -- | 1 |
| Range | Type of Groundwater | Number of Samples | Percentage of Samples (%) |
|---|---|---|---|
| 50 | Excellent water | 4 | 3.25 |
| 50–99.99 | Good water | 45 | 36.59 |
| 100–199.99 | Poor water | 30 | 24.39 |
| 200–299.99 | Very poor water | 19 | 15.45 |
| ≥300 | Unsuitable for drinking purposes | 25 | 20.32 |
| Parameters | pH | TDS | Ca2+ | Mg2+ | Na+ | K+ | HCO3− | Cl− | SO42− | NO3− |
|---|---|---|---|---|---|---|---|---|---|---|
| Maximum | 8.91 | 11,513.00 | 550.90 | 1124.00 | 1468.00 | 46.60 | 907.90 | 1592.00 | 6519.00 | 127.34 |
| Minimum | 7.19 | 339.00 | 22.50 | 14.50 | 29.40 | 3.60 | 68.30 | 19.10 | 96.50 | 0.50 |
| Average | 7.85 | 1864.67 | 109.18 | 183.00 | 227.99 | 12.97 | 295.02 | 240.43 | 915.92 | 10.75 |
| Standard Deviation | 0.39 | 1816.02 | 89.48 | 176.06 | 255.90 | 9.20 | 136.04 | 286.76 | 1017.32 | 16.75 |
| Coefficient of Variation | 0.05 | 0.97 | 0.82 | 0.96 | 1.12 | 0.71 | 0.46 | 1.19 | 1.11 | 1.56 |
| Index | pH | TDS | Ca2+ | Mg2+ | Na+ | K+ | HCO3− | Cl− | SO42− | NO3− |
|---|---|---|---|---|---|---|---|---|---|---|
| pH | 1 | |||||||||
| TDS | −0.266 | 1 | ||||||||
| Ca2+ | −0.297 | 0.952 | 1 | |||||||
| Mg2+ | −0.289 | 0.973 | 0.917 | 1 | ||||||
| Na+ | −0.214 | 0.959 | 0.895 | 0.874 | 1 | |||||
| K+ | −0.401 | 0.727 | 0.671 | 0.757 | 0.644 | 1 | ||||
| HCO3− | −0.593 | 0.365 | 0.353 | 0.415 | 0.298 | 0.565 | 1 | |||
| Cl− | −0.179 | 0.936 | 0.917 | 0.855 | 0.963 | 0.564 | 0.221 | 1 | ||
| SO42− | −0.247 | 0.992 | 0.935 | 0.984 | 0.929 | 0.733 | 0.330 | 0.895 | 1 | |
| NO3− | −0.360 | 0.258 | 0.272 | 0.238 | 0.264 | 0.377 | 0.542 | 0.221 | 0.208 | 1 |
| Index | Factor | |
|---|---|---|
| First Factor | Second Factor | |
| TDS | 0.98 | 0.14 |
| pH | −0.39 | 0.69 |
| Ca2+ | 0.95 | −0.11 |
| Mg2+ | 0.97 | −0.12 |
| Na+ | 0.94 | −0.16 |
| K+ | 0.84 | 0.18 |
| SO42− | 0.97 | −0.19 |
| Cl− | 0.94 | −0.20 |
| HCO3− | 0.57 | 0.67 |
| NO3− | 0.26 | 0.86 |
| Characteristic value | 6.59 | 1.747 |
| Contribution rate (%) | 65.93 | 17.466 |
| Cumulative contribution (%) | 65.93 | 83.391 |
| Parameters | Range | Water Class | Number of Samples | Percentage of Samples (%) |
|---|---|---|---|---|
| SAR | 0–9.99 | Excellent | 123 | 100 |
| 10–17.99 | Good | 0 | 0 | |
| 18–26 | Doubtful | 0 | 0 | |
| >26 | Unsuitable | 0 | 0 | |
| Na% | <20 | Excellent | 0 | 0 |
| 20–39.99 | Good | 52 | 42.28 | |
| 40–59.99 | Permissible | 61 | 49.59 | |
| 60–80 | Doubtful | 9 | 7.32 | |
| >80 | Unsuitable | 1 | 0.81 | |
| KR | <1 | Suitable | 119 | 96.75 |
| 1–2 | Marginally suitable | 4 | 3.25 | |
| >2 | Unsuitable | 0 | 0 | |
| PI | <80 | Good | 122 | 99.19 |
| 80–100 | Moderate | 1 | 0.81 | |
| 100–120 | Poor | 0 | 0 |
© 2020 by the authors. Licensee MDPI, Basel, Switzerland. This article is an open access article distributed under the terms and conditions of the Creative Commons Attribution (CC BY) license (http://creativecommons.org/licenses/by/4.0/).
Share and Cite
Feng, J.; Sun, H.; He, M.; Gao, Z.; Liu, J.; Wu, X.; An, Y. Quality Assessments of Shallow Groundwaters for Drinking and Irrigation Purposes: Insights from a Case Study (Jinta Basin, Heihe Drainage Area, Northwest China). Water 2020, 12, 2704. https://doi.org/10.3390/w12102704
Feng J, Sun H, He M, Gao Z, Liu J, Wu X, An Y. Quality Assessments of Shallow Groundwaters for Drinking and Irrigation Purposes: Insights from a Case Study (Jinta Basin, Heihe Drainage Area, Northwest China). Water. 2020; 12(10):2704. https://doi.org/10.3390/w12102704
Chicago/Turabian StyleFeng, Jianguo, Hao Sun, Minghao He, Zongjun Gao, Jiutan Liu, Xi Wu, and Yonghui An. 2020. "Quality Assessments of Shallow Groundwaters for Drinking and Irrigation Purposes: Insights from a Case Study (Jinta Basin, Heihe Drainage Area, Northwest China)" Water 12, no. 10: 2704. https://doi.org/10.3390/w12102704