


Cardiovascular diseases (CVDs) are the most important causes of death worldwide and have received increasing attention, not only in high-income but also in many middle-income countries, due to their rising prevalence (Raji et al., Reference Raji, Mabayoje and Taslim2015; Tefera et al., Reference Tefera, Abegaz, Abebe and Mekuria2017). Abdominal obesity, hypertension, hyperlipidemia, glucose intolerance, and uric acid (UA), reflecting the cardiometabolic risk profile, are well-known metabolic risk factors for CVD. These factors develop early in life and track from childhood through adolescence and adulthood (Graves et al., Reference Graves, Garnett, Cowell, Baur, Ness, Sattar and Lawlor2014; Umer et al., Reference Umer, Kelley, Cottrell, Giacobbi, Innes and Lilly2017). Moreover, they show mutual correlations, and this clustering has been found to be stable from childhood into adulthood (Andersen et al., Reference Andersen, Wedderkopp, Hansen, Cooper and Froberg2003; Díez-Fernández et al., Reference Díez-Fernández, Sánchez-López, Gulías-González, Notario-Pacheco, Cañete García-Prieto, Arias-Palencia and Martínez-Vizcaíno2015; Umer et al., Reference Umer, Kelley, Cottrell, Giacobbi, Innes and Lilly2017). Therefore, early treatment of adiposity in childhood and adolescence is recommended as the first-line approach to reducing CVD risk. Hotchkiss et al. (Reference Hotchkiss, Davies, Dundas, Hawkins, Jhund, Scholes and Capewell2014) reported that from the 43% decline in coronary heart disease mortality rates between 2000 and 2010, 39% was attributed to improvement in these risk factors. Meta-analyses of pediatric lifestyle intervention studies have also revealed that dietary modification and increased physical activity reduce weight and improve CVD risk factors such as dyslipidemia and hypertension; and interventions that improve one condition are likely to ameliorate the others. However, the mechanisms linking these conditions are not fully understood. Whether these associations are the consequences of a shared genetic factor or environmental factor underlying these CVD risk factors remains controversial.
Epidemiologic studies have found that men have a higher risk of cardiovascular mortality compared to women and have a higher risk of developing CVD at earlier onset (Leutner et al., Reference Leutner, Göbl, Wielandner, Howorka, Prünner, Bozkurt and Kautzky-Willer2016). Previous twin studies on common CVD risk factors have also established that genetic and environmental factors contributing to them often differ by sex, age, and ethnicity (Li et al., Reference Li, Kyvik, Duan, Zhang, Pang, Hjelmborg and Dalgård2016; Liao et al., Reference Liao, Gao, Cao, Lv, Yu, Wang and Li2017; Poveda et al., Reference Poveda, Atabaki-Pasdar, Ahmad, Hallmans, Renström and Franks2017; Silventoinen, Jelenkovic et al., Reference Silventoinen, Jelenkovic, Sund, Yokoyama, Hur, Cozen and Kaprio2017; Song et al., Reference Song, Lee and Sung2015; Tanaka et al., Reference Tanaka, Ogata, Tanaka, Omura, Honda and Hayakawa2015). For example, a review of twin and family studies reported that heritability estimates range from .25 to .70 for body mass index (BMI); from .25 to .60 for triglycerides (TGs); from .50 to .60 for total cholesterol (TC); from .20 to .70 for resting systolic blood pressure (SBP); and from .10 to .50 for diastolic blood pressure (DBP; Rankinen et al., Reference Rankinen, Sarzynski, Ghosh and Bouchard2015). Most studies reported heritability estimates of about 0.4 for UA (Kleber et al., Reference Kleber, Delgado, Grammer, Silbernagel, Huang, Krämer and März2015). Moreover, latent or unidentified genes and DNA sequence variants exerting pleiotropic influences on multiple CVD risk factors have been found by several twin and family studies. Furthermore, recent research in male adult twins suggested that some CVD risk factors, such as adiposity, lipids, and insulin resistance, shared one latent genetic factor by using multivariate biometrical modeling analyses (Panizzon et al., Reference Panizzon, Hauger, Sailors, Lyons, Jacobson, Murray McKenzie and Franz2015). However, a limitation is that most of the studies have been conducted in Caucasian populations following a Westernized lifestyle, leaving it open whether the results can be generalized to other populations.
We have previously reported, using data from the Chinese Qingdao Twin Registry of children and adolescents that genetics and environment contributed to eight CVD risk factors, including BMI, waist circumference (WC), waist-to-hip ratio (WHR), SBP, DBP, TC, TG, and UA, and there was different heritability for those CVD risk factors by sex (Ji et al., Reference Ji, Ning, Duan, Kaprio, Zhang, Zhang and Silventoinen2014). There has been recent interest in the use of a multivariate modeling approach to explore the genetic architecture underlying these CVD metabolic risk factors and to clarify whether there are age, sex, and ethnic differences in genetic pleiotropy on multiple CVD risk factors. To our knowledge, this issue has not been addressed in the Chinese population. Given the above, the aims of the present study were to:
-
1. Quantify genetic and environmental influences on seven CVD metabolic risk factors (BMI, WC, SBP, DBP, TC, TG, and UA) in boys and girls aged 8−17.
-
2. Investigate the common metabolic pathophysiological underlying the clustering of CVD metabolic risk factors in boys and girls aged 8−17.
-
3. Examine whether there are different combinations of these CVD metabolic risk factors sharing genetic or environmental pathways in boys and girls aged 8−17.
Methods
Participants
The Qingdao Twin Study was initiated in 1998 as part of the National Twin Study in China, which is described in detail elsewhere (Duan et al., Reference Duan, Ning, Zhang, Wang, Zhang, Tan, Tian and Pang2013). The participants, aged 8−17, consisting of monozygotic (MZ) and dizygotic (DZ) twins, were screened from May to August in 2006. The participants were reimbursed for travel expenses for their participation in the project. Written informed consent was obtained from the parents and verbal consent from their twin children. A questionnaire, anthropometric measurements, and a fasting blood sample collection were included in the survey, which is described elsewhere (Ji et al., Reference Ji, Ning, Duan, Kaprio, Zhang, Zhang and Silventoinen2014). The protocols were approved by the Institutional Review Board at the Qingdao Center for Disease Control and Prevention. The current analyses are based on the 1016 participants who were free of major medical conditions and had complete data for the used variables.
Metabolic Trait Measures
BMI was calculated as body weight divided by squared body height (kg/m2), where body weight and height were measured in lightweight clothes and without shoes. Body weight was rounded to the nearest 0.1 kg and height to the nearest centimeter. WC was measured in the midpoint between the rib cage and the iliac crest and rounded to the nearest 0.1 cm SBP and DBP were measured in the right arm by a standard procedure using mercurial table stand model sphygmomanometer. Three measurements were taken and the average of them was used in the analysis. Biomedical measurements (TC, TG, and UA) assay methods and zygosity examination have been reported elsewhere (Ji et al., Reference Ji, Ning, Duan, Kaprio, Zhang, Zhang and Silventoinen2014).
Statistical Analysis
Descriptive statistics were calculated using R statistical software. To obtain normal or near-normal distributions, BMI and TG were log transformed and then multiplied by 100 to increase the variance, which facilitated the model fitting. The outliers for WC > 40 cm, TC > 6.5 mmol/L, TG > 2.8 mmol/L, UA > 600 μmol/L, SBP > 140 mmHg, and DBP > 100 mmHg were removed.
Genetic analyses were performed using the OpenMx (Boker et al., Reference Boker, Neale, Maes, Wilde, Spiegel, Brick and Fox2011) package of R software. OpenMx estimates parameters using maximum likelihood method and computes goodness-of-fit statistics based on minus twice the natural logarithm of the likelihood (−2lnL). Likelihood ratio tests (LRTs) are used to test hypotheses as a better balance between goodness-of-fit and parsimony; Akaike’s Information Criterion (AIC) also served as an indicator of model fit, where lowest values imply the best model.
We started the multivariate modeling by fitting Cholesky decomposition, which allows partitioning the phenotypic covariance into additive genetic (A), common environment (C), and unique environment (E) components and thus estimating genetic and environmental correlations between pairs of traits. The Cholesky decomposition provides the full saturated solution without making assumptions on the underlying genetic architecture. Thus, it can supply a base model for comparison with more parsimonious models. In a trivariate Cholesky decomposition, we selected three phenotypic traits, including obesity-related traits (BMI and WC), blood pressure traits (SBP and DBP), and metabolites (TC, TG, and UA). In order to determine the genetic and environmental factor architecture, a series of multilevel independent and common pathways models were fitted to the data in boys and girls separately. Measurement error is largely restricted to the first level of variables in these models.
We first fit a single-factor common pathway model to estimate the genetic and environmental covariance within a latent phenotype. Then, we fit a three-correlated-factor common pathway model to estimate the phenotypic, genetic, and environmental covariance within a latent phenotype. The higher-order common pathway model (Figure 1a) assumes that the covariance between the three factors is accounted for by a single, higher-order latent phenotype and that the genetic and environmental covariance between the variables is accounted for by genetic and environmental influences operating through that phenotype. The higher-order independent pathway model (Figure 1b) assumes that the covariance between the three factors is accounted for by independent, higher-order genetic, and environmental factors. The model does not require an overarching latent phenotype; it can account for the covariance via separate genetic and environmental factors that are independent of one another, and whose loadings do not have to be collinear. The model also allows for genetic and environmental factor structure to be tested separately from one another, thus remaining agnostic as to whether genetic and environmental influences adhere to the same covariance structure.

Fig. 1(a). Higher-order common pathway models of the clustering of metabolic risk traits. Rectangles represent observed variables, ellipses represent latent factor, and circles represent latent genetic and environmental influences for the higher-order factor are designated by the subscript ‘L’; genetic and environmental influences for the three factors have numerical subscripts.

Fig. 1(b). Higher-order independent pathway models of the clustering of metabolic risk traits. Rectangles represent observed variables, ellipses represent latent factors, and circles represent latent genetic and environmental influences for the higher-order factor are designated by the subscript ‘L’; genetic and environmental influences for the three factors have numerical subscripts.
Results
Descriptive Analyses
The basic characteristics of the study cohort are presented in Table 1. The means of all metabolic factors, except for TC and TG, were slightly higher in boys than in girls. Significant sex differences were observed (p < .001) except for DBP.
Table 1. Baseline characteristics of phenotypes in boys and girls

Note: SD, standard deviation; BMI, body mass index; DBP, diastolic blood pressure; SBP, systolic blood pressure; TC, total cholesterol; TG, triglyceride; UA, uric acid; WC, waist circumference; p = z-test for sex difference in means.
Table 2 shows the phenotypic correlations between the traits in boys and girls. WC-BMI and SBP-DBP displayed the highest correlation in boys and girls, ranging from .77 to .70 and from .68 to .61, respectively. Obesity-related measures (WC and BMI) showed moderate correlations with SBP and UA in both sexes with the exception of UA in girls. However, TC showed no correlation with obesity measures and BP measures in either sex. Weak but still significant correlations were found for TC with TG and UA (r = .18 for TG-TC in boys and 0.17 in girls, r = .27 for TC-UA in girls) except for TC-UA in boys.
Table 2. Phenotypic correlations among the observed variables in boys and girls with 95% confidence intervals

Note: BMI, body mass index; DBP, diastolic blood pressure; SBP, systolic blood pressure; TC, total cholesterol; TG, triglyceride; UA, uric acid; WC, waist circumference. Results are derived from the multivariate ACE Cholesky model.
Table 3 presents the relative influences of genetic and environmental factors on the metabolic traits based on the full ACE Cholesky decomposition. All traits were influenced by genetic factors with the heritability estimates ranging from .63 for BMI to .22 for WC in boys; the only exception was no significant genetic influences for DBP. In girls, the heritability estimates vary from .69 for TC to .38 for WC with an exception of no significant genetic influences for SBP. In addition, common environmental influences and unique environmental influences were all significant for all measures (c2 = .63−.26, e2 = .36−.15 in boys and c2 = .52−.19, e2 = .42−.10 in girls) in both sexes with some notable exceptions, namely, common environmental factors showed no significant influence for TC in boys, and for DBP, TC as well as TG in girls.
Table 3. Genetic and environmental influences on observed variables in boys and girls with 95% confidence intervals

Note: BMI, body mass index; DBP, diastolic blood pressure; SBP, systolic blood pressure; TC, total cholesterol; TG, triglyceride; UA, uric acid; WC, waist circumference. Results are derived from the multivariate ACE Cholesky model.
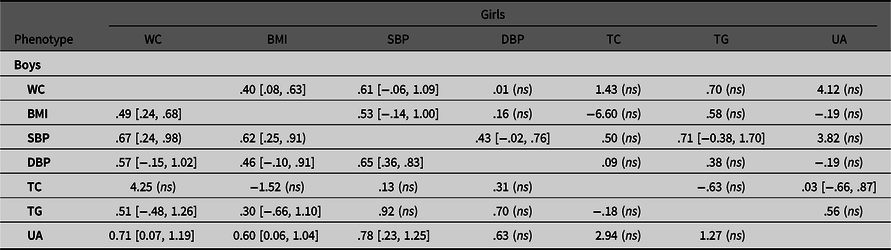
Tables 4.1.−4.3 show the genetic and environmental correlations between each pair of traits based on Cholesky decomposition in boys and girls. For obesity-SBP, the common environmental correlations were higher than the additive genetic correlations in boys (r C = .62−.67 vs. r A = .35−.39). The same circumstance was observed for obesity-UA in boys. Most of the genetic and environmental correlations were not significant in girls, with the exception of WC-BMI, SBP-DBP, and TC-UA.
Multivariate Modeling Analyses
Table 5 summarizes the goodness-of-fit indexes of the four multivariate models, that is, single-indicator model, three-correlated indicator model, higher-order independent pathway ACE model, and higher-order common pathway ACE model in boys and girls when compared to the full Cholesky decompositions. The higher-order common pathway ACE model showed a better fit than full ACE Cholesky decomposition and other multivariate models (Bayesian information criterion [BIC] = −8092.19 in boys, BIC = −8862.57 in girls), indicating that observed measures covariance are modeled by three correlated indicators, which are referred to as obesity (WC and BMI), blood pressure (SBP and DBP), and metabolite factors (TC, TG, and UA), with different factor loadings, and three correlated indicators that are then unified into single common latent factor. The final model is presented separately for boys (Figure 2a) and for girls (Figure 2b).
Table 4.1. Additive genetic correlations of observed variable pairs in boys and girls with 95% confidence intervals

Note: BMI, body mass index; DBP, diastolic blood pressure; SBP, systolic blood pressure; TC, total cholesterol; TG, triglyceride; UA, uric acid; WC, waist circumference. Results are derived from the multivariate ACE Cholesky model.
Table 4.2. Common environmental correlations of observed variable pairs in boys and girls with 95% confidence intervals
Note: BMI, body mass index; DBP, diastolic blood pressure; SBP, systolic blood pressure; TC, total cholesterol; TG, triglyceride; UA, uric acid; WC, waist circumference. Results are derived from the multivariate ACE Cholesky model.
Table 4.3. Unique environmental correlations of observed variable pairs in boys and girls with 95% confidence intervals
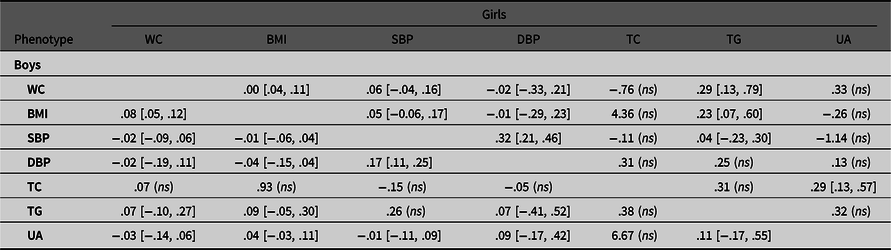
Note: BMI, body mass index; DBP, diastolic blood pressure; SBP, systolic blood pressure; TC, total cholesterol; TG, triglyceride; UA= uric acid; WC, waist circumference. Results are derived from the multivariate ACE Cholesky model.
Table 5. Multivariate model-fitting results in boys and girls

Note: −2LL, −2log likelihood; df, degrees of freedom; AIC, Akaike’s information criterion; BIC, Bayesian information criterion; LRT, likelihood ratio test; Δdf, change in degree of freedom; p, significance of LRT; CP, common pathway model; IP, independent pathway model; A, additive genetic influences; C, common environmental influences; E, unique environmental influences; *indicates best-fitting model. Through model 2 to model 5, the fit is tested relative to model 1.

Fig. 2(a). Higher-order CP ACE model in boys with 95% CIs. As, Cs, and Es are the additive genetic, common, and unique environmental influences on the measured variable.
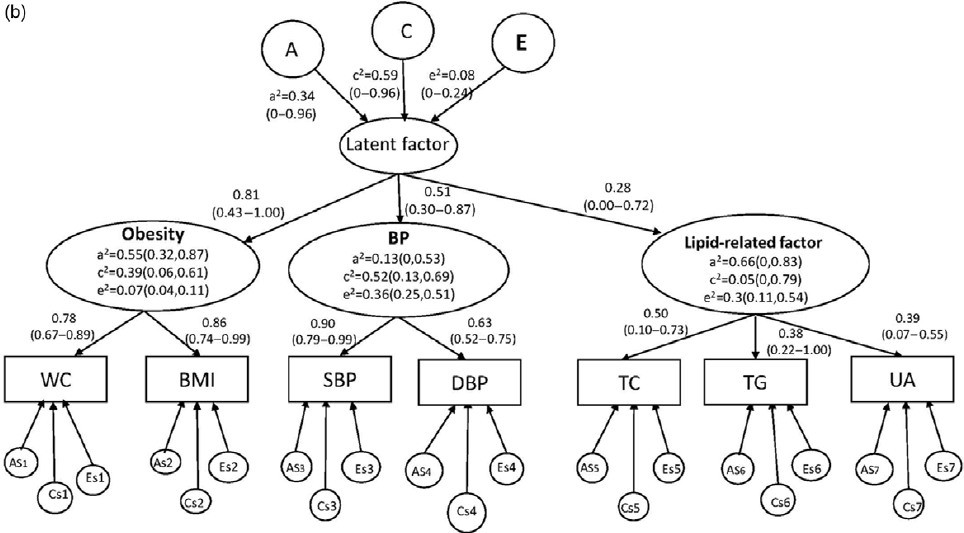
Fig. 2(b). Higher-order CP ACE model in girls with 95% CIs. As, Cs, and Es are the additive genetic, common, and unique environmental influences on the measured variable.
As shown in Figure 2a, for boys, factor loadings on the single common latent factor were higher for metabolite factor (.89, 95% CI [0.59, 1.00]) and obesity (.75, 95% CI [.60, 0.92]) than BP (.65, 95% CI [0.49, 0.81]). Furthermore, heritability for each latent indicator was statistically significant, with estimates of .51 (95% CI [0.26, 0.76]) for obesity, .20 (95% CI [0.04, 0.51]) for BP, and .28 (95% CI [0.05, 0.76]) for metabolite factor. The genetic and environmental factors account for the coherence of the three latent indicators by one common latent factor with moderate heritability (a2 = .35, 95% CI 0.06 to 0.76; c2 = .63, 95% CI [0.24, 0.90]; e2 = .01, 95% CI [0, 0.05]).
However, as shown in Figure 2b, for girls, factor loadings on the single common latent factor were lower for metabolite factor (.28, 95% CI [0, 0.72]) than obesity (.81, 95% CI [0.43, 1.00]) or blood pressure (.51, 95% CI [0.30, 0.87]). At the first higher-order common pathway level, only obesity was statistically significant for heritability, with the estimates of .55 (95% CI [0.32, 0.87]), common environmental influences and unique environmental influences on BP (c2 = .52, 95% CI [0.13, 0.69]; e2 = .36, 95% CI [0.25, 0.51]); and unique environmental influences on metabolic-related factor (e2 = .30, 95% CI [0.11, 0.54]) were statistically significant. At the second higher-order common pathway level, the effects of the genetic and environmental factors on the single common latent factor were not statistically significant.
Discussion
We examined the genetic architecture on seven metabolic CVD metabolic risk factors in boys and girls using a multivariate modeling approach. Among boys, we found three heritable factors behind the seven metabolic CVD risk factors: obesity (BMI and WC), blood pressure (SBP and DBP), and metabolite factors (TC, TG, and UA). Obesity, blood pressure, and metabolite factors were united by a higher-order common factor, which was influenced by latent genetic and environmental factors. In contrast, for girls, one heritable factor was found with an estimate of .55 for obesity. These results help to further elucidate the physiologic mechanisms underlying the clustering of CVD risk factors and explain the strategies to prevent these CVD risk factors during childhood and adolescence. Furthermore, our findings indicate that there are differences between boys and girls in the genetic and environmental influences on these seven metabolic factors. However, it may be expected that CVD risk in adults will decrease if there are more common interventions on CVD risk factors during childhood and adolescence for boys and girls.
It is well known that metabolic CVD risk factors are correlated, and obesity is usually behind the clustering of metabolic factors in children and adolescents (Silventoinen, Gouveia et al., Reference Silventoinen, Gouveia, Jelenkovic, Maia, Antunes, Pinheiro de Carvalho and Freitas2017). Our findings were not only consistent with the previous twin studies but also showed evidence for sex-specific phenotypic correlations, which was much larger in boys than in girls, such as BMI relating to WC with the range from .77 to .70 and SBP relating to DBP with the range from .69 to .62. In particular, in boys, we observed a significant moderate association between UA and other CVD risk traits except for TGs. In girls, UA only presented significant associations with TC and TGs. Recently, Luciano et al. (Reference Luciano, Shashaj, Spreghini, Del Fattore, Rustico, Wietrzykowska Sforza and Manco2017) investigated age- and sex-specific percentiles of serum UA in overweight/obese children and adolescents in Italy. The authors reported that higher serum UA was associated with an increased risk of high TGs and atherogenic profile in children and adolescents, and further confirmed that serum UA would act as a marker of impaired adipogenesis, which was reported by Matsuura et al. (Reference Matsuura, Yamashita, Nakamura, Nishida, Nozaki, Funahashi and Matsuzawa1998). Thus, we took TC, TG, and UA as one unified factor when we explored the genetic background of this clustering of metabolic factors in our analysis to support our hypothesis that it is latent genetic and environmental factors indirectly impacting on three factors, namely obesity (BMI and WC), BP (SBP and DBP), and metabolites (TC, TG, and UA) through one single latent factor. This factor resembles the metabolic syndrome (MetS), which is conceived as a clustering of metabolic risk factors, including visceral obesity, insulin resistance, hyperglycemia, high blood pressure, and dyslipidemia; MetS increases the risk for both CVD and type II diabetes(Shen et al., Reference Shen, Todaro, Niaura, McCaffery, Zhang, Spiro and Ward2003). To our knowledge, although UA is a CVD risk factor independent of insulin resistance (Facchini et al., Reference Facchini, Chen, Hollenbeck and Reaven1991), the definition of MetS does not include UA. Our study was the first to examine the genetic background of the clustering of metabolic traits, including uric acid. Hence, our novel results would provide the opportunity to determine whether UA is one of the components of MetS.
Compared to a similar study in adult male twins (Panizzon et al., Reference Panizzon, Hauger, Sailors, Lyons, Jacobson, Murray McKenzie and Franz2015), our results demonstrated that using the higher-order common pathway ACE model as the final model for our data — that is, three separate factors formed by seven metabolic CVD risk variables — tended to aggregate together into a single latent factor in both sex groups, especially in boys, with significant genetic and environmental influences. We further detected these genetic and environmental influences on the common latent factor. Despite the sex-specific differences in genetic and environmental contributions to these metabolic traits, such that the female group had a higher heritability of WC, DBP, TC, and UA with a range from .69 to .38, and that the heritability of BMI and TG was higher in boys than in girls, the hypothesized three-factor common pathway ACE model was shown to be stable across sex groups.
Varying different degrees of systematic correlation between three factors stemming from the higher-order common pathway ACE model were observed; in boys, lipid-related factors (TC, TG, and UA) and obesity appeared to the main essential features of the clustering of these CVD risk factors; while in girls, obesity and blood pressure were. However, in both sex groups, the mechanisms linking obesity, blood pressure and lipid-related factor (TC, TG, and UA) can both be explained by genetic, common environmental, and unique environmental factors, although genetic and environmental influences did not achieve statistical significance in girls. Genome-wide association studies (GWAS) studies have revealed pleiotropic effects on CVD risk factors (MacArthur et al., Reference MacArthur, Bowler, Cerezo, Gil, Hall, Hastings and Parkinson2017). Kleber et al. (Reference Kleber, Delgado, Grammer, Silbernagel, Huang, Krämer and März2015) studied pleiotropic effects of UA single-nucleotide polymorphisms (SNPs) and other CVD risk factors, and identified that two SNPs were associated with TC (rs675209 and rs17050272), one SNP was associated with TG (rs1260326), three SNPs were associated with BMI (rs2231142, rs10480300, and rs3741414), five SNPs were associated with SBP (rs17632159, rs1165151, rs10480300, rs1171614, and rs2078267), and five SNPs were associated with DBP (rs17632159, rs1165151, rs10480300, rs1171614, and rs675209). Thus, our results will provide the support to find pleiotropic genes affecting CVD risk factors in the Chinese young population.
Interestingly, in our study, it was shown that common environmental influences such as diet and lifestyle played an important role in the underlying association between these metabolic traits, especially in girls. This finding is supported by previous studies in adult populations (Recchioni et al., Reference Recchioni, Marcheselli, Antonicelli, Mensà, Lazzarini, Procopio and Olivieri2017). Ambrosini et al. (Reference Ambrosini, Oddy, Huang, Mori, Beilin and Jebb2013) reported that increased sugar-sweetened beverage intake is associated with CVD in young people. CVD has long been recognized as lifestyle-related disease, and physical inactivity is regarded as a major factor that is related to CVD. It suggests that we should focus on this age group because it is a critical period for physical and behavioral development.
In summary, this study is one of the few studies to examine genetic architecture on several metabolic risk factors on CVD, especially in a non-Caucasian population. We identified three heritable factors, that is, obesity, blood pressure, and metabolites (TC, TG, and UA), which were united as one single phenotype in both sex groups, and the genetic and environmental factors that indirectly impact on them. These findings suggest that it would be helpful to implement considerable interventions in CVD risk factor management as early as childhood and adolescence. In addition, further research investigating the impact of specific genes and environmental factors on CVD risk factors will continue to provide insight into the most successful CVD therapies. Current health recommendations need to be adjusted accordingly.
Funding
This study was supported by the EFSD/CDS/Lilly Research Fellowship 2009 and the Natural Science Foundation of Shandong Province (# ZR2009CM111).


