Ecological Risk Assessment of Heavy Metals in the Soil at a Former Painting Industry Facility
 Milena Radomirović1
  Željko Ćirović1 Danijela Maksin2
  Tamara Bakić1 Jelena Lukić1
  Slavka Stanković3
  Antonije Onjia3*
- 1The Innovation Center of the Faculty of Technology and Metallurgy, University of Belgrade, Belgrade, Serbia
- 2The Vinca Institute of Nuclear Sciences, University of Belgrade, Belgrade, Serbia
- 3Faculty of Technology and Metallurgy, University of Belgrade, Belgrade, Serbia
Soil samples from the site of the former largest paint and varnish factory in ex-Yugoslavia were analyzed for arsenic and eight heavy metals (Pb, Cd, Zn, Cr, Ni, Cu, Fe, and Hg). Several additional soil properties (pH, sulfur, nitrogen, phosphorus, and water content) were also measured. Multivariate analysis showed strong correlations between Pb and Zn; and a moderate correlation between Cu and Ni. There was no correlation between heavy metals and any of the analyzed soil properties parameters. A factor analysis grouped most heavy metals, except Cd, which showed different behavior, and Fe and As, which associated with soil properties. The soil samples were clustered into two distinctive groups. Positive matrix factorization receptor modeling clearly identified Zn and Pb as belonging to the traffic vehicle factor. The second factor dominating arsenic was industrial chemical emissions, while the third factor containing most of the heavy metals was attributed to natural background variation. The last non-metallic factor, dominated by sulfur, was the result of past activities in the paint facility. The average enrichment factor values were for the metals analyzed were: 0.73; 0.71; 2.4; 0.58; 2.3; 0.87; 1.6; and 0.76; for Cr, Cd, Pb, Ni, Zn, Cu, As, and Hg, respectively. Only moderate soil enrichment by Pb and Zn was found. The geoaccumulation index values showed a moderately polluted soil with Pb and Zn, but most contributing to the ecological risk were Cd with 63% and Hg with 19%. These two metals are of major concern in this case study due to their high toxicity, even though they are present at very low concentrations. Generally, a moderate ecological risk was estimated for most soil samples, except for a small number of high-risk samples. Spatial distribution mapped three severely polluted sub-areas. In general, the paint and varnish industry moderately contributes to the contamination of soil. The main ecological risk from metal contamination is not related to the paint technological production process itself, but from other activities at the site that deposit of heavy metals into the soil.
Introduction
Over the last few decades, many industrial plants throughout Central and Eastern Europe have ceased operations, and the land has been converted for other purposes. Many of these facilities were located in an attractive urban area, so the new use of land is often intended for housing, commerce, and city parks. Knowledge of the potential ecological risk of soil pollution is, therefore, of great importance for the management of such a site. Before re-purposing an abandoned industrial site, it should be inspected to determine whether there is any pollution originating from the previous activities. In such cases, the pollutants that are often a problem are heavy metals (Wcisło et al., 2016; Harvey et al., 2017; Khademi et al., 2019). The contamination of industrial soils is predominantly dependent on the type of industrial activity (Liang et al., 2017; Spahić et al., 2019; Li et al., 2020), but, the soil characteristics and other influences, such as urbanization (Xie et al., 2019), traffic (Chen et al., 2020), geographical factors (Dragović et al., 2014), should also be taken into account.
Duga d.o.o. Company, located in Belgrade, the capital of Serbia, was the largest paint and varnish factory in the former Yugoslavia, but it ceased operations a decade ago. There is no possibility or intention to start production at the factory again, therefore, the plant will be dismantled, and the factory site repurposed. It was founded in 1895 and operated for over a century at the same location. At the time of its establishment, the site was located out of town, while today, due to the expansion of the city, this location is part of the wider city center. Accordingly, this location can now be considered both industrial and urban. Recently, numerous studies on heavy metal contamination of urban and industrial soils have been carried out (Khademi et al., 2019; Roy et al., 2019; Xie et al., 2019; Yadav et al., 2019; Adimalla et al., 2020; Chen et al., 2020; Egbueri et al., 2020; Li et al., 2020).
Khademi et al. (2019) demonstrated that concentrations of heavy metals in soils of urban areas are higher than the background values, due to industrial activities; however, industrialization does not appear to significantly affect the level of most soil elements. Heavy metals in soils near factories generally enter the soil from industrial activities (Li et al., 2020), and the type of heavy metal contamination depends on the type of industry. For example, increased concentrations of Fe and Zn have been found in soil samples near a welding factory (Spahić et al., 2019); high levels of Pb contamination have been found in the topsoil around a lead-smelter (Li et al., 2020); soil samples near a tannery contain a high level of Cr (Dheeba and Sampathkumar, 2012); and soil highly polluted by Hg from a chlor-alkali plant has been reported (Relić et al., 2019).
The painting industry can contaminate soil with metals that make up the components of raw materials and the finished products. In addition to the production process, other activities, such as site traffic and mechanical services, can also leach metals into the soil. Jolly et al. (2012) measured the metal content in soil and plants in the vicinity of a paint factory and found that the concentrations of heavy metals in the agricultural soil were only slightly higher than those in unpolluted soil. Inobeme et al. (2014) also found moderate contamination in a number of soil samples collected from the vicinity of an industrial paint site. In this industry, the waste storage area could be contaminated with heavy metals (Yan et al., 2008). Nwajei et al. (2012) reported that metal contamination was not attributed to the activity from a paint factory, but to other anthropogenic factors. However, soil samples from the paint factory showed higher metal concentrations than those samples located a few hundred meters away. Heavy metal contamination may originate from industrial accidents (such as pouring alkali-based colors into the soil, Dobroshi et al., 2019), or via the discharge of wastes containing metal pigments (Udosen et al., 2016).
To accurately explain the relationship between the heavy metals in soil in large and complex experimental datasets, it is necessary to reduce dimensionality and classify the data. Multivariate methods of the data evaluation, such as principal component analysis (PCA) and hierarchical cluster analysis (HCA), have been extensively used to identify and apportion the sources of heavy metal contamination (Slavković et al., 2004; Relić et al., 2019; Egbueri et al., 2020). This allows for pattern recognition, and classification of the experimental data on analytes, as well as the samples. Data processed in this way, together with the knowledge of the tracer analytes, may be used to estimate potential contamination sources.
Positive matrix factorization (PMF) is a source apportionment method capable of dealing with missing data, error estimate, and the contribution rate of each source at each sampling site (Paatero and Tapper, 1994). This method is widely used nowadays (Cheng et al., 2020; Jiang et al., 2020; Jin and Lv, 2020; Li et al., 2020) and pinpoints soil metal sources, based on their composition fingerprints. The PMF approach is based on the chemical mass balance equations, using a factor analysis (FA) method with a weighted least-squares algorithm, and non-negative constraints on the factors. The uncertainties for individual data results (U) may be estimated using the following equation (Liang et al., 2017; Cheng et al., 2020; Jin and Lv, 2020):
where c is the concentration of individual metal, MDL is the method detection limit, and error fraction is a percentage of the measurement uncertainty. If samples are below the MDL, the U value is estimated as 5/6 of the MDL.
A visualization of the spatial distribution of the trace metal contamination over the studied area is helpful in contamination tracking. By using geostatistical interpolation it is possible to get information, even for an area that is not sampled. Spatial visualization has been used extensively in risk assessment studies of heavy metals in soils (Dragović et al., 2014; Škrbić et al., 2018; Zhao et al., 2019; Cheng et al., 2020; Jiang et al., 2020; Jin and Lv, 2020).
Of the utmost importance in evaluating the site and deciding how to approach soil management is quantifying the ecological risk of soil pollution. Using soil pollution indices, such as enrichment factor (EF), geoaccumulation index (Igeo) and pollution load index (PLI), gives information on the soil quality, and the degree of contamination for each sample, based on individual metals (Müller, 1969; Tomlinson et al., 1980; Men et al., 2018; Khademi et al., 2019; Adimalla et al., 2020; Egbueri et al., 2020; Monged et al., 2020). The potential ecological risk can be estimated based on the risk index (RI) for each sample. Also, the risks from individual metals, which contribute to the ecological risk, can be identified (Men et al., 2018; Gan et al., 2019; Li et al., 2020; Monged et al., 2020).
The main objectives of this study are to evaluate the heavy metal contamination in the soil; characterize the distribution of heavy metals, by combining multivariate analysis and geostatistical mapping; identify potential pollution sources using a PMF model; and estimate potential ecological risks in the area.
Materials and Methods
Study Area and Sampling
Sampling took place at the Duga paint and varnish factory in Belgrade between December 29, 2009 and January 20, 2010. Eighty surface soil samples (up to 30 cm depth) were collected and analyzed using a soil core sampler. The facility site occupies approximately 11 ha; sampling points (Figure 1) were first evenly distributed, and then additional points were selected when there was a suspicion of spillage of contaminants into the soil. The longitude and latitude coordinates of the sampling points were recorded on a Trimble TDC100 GPS instrument. The sampling area was between latitude 44°49′10.399″–44°49′16.464″ and longitude 20°28′37.693″–20°29′6.97″.
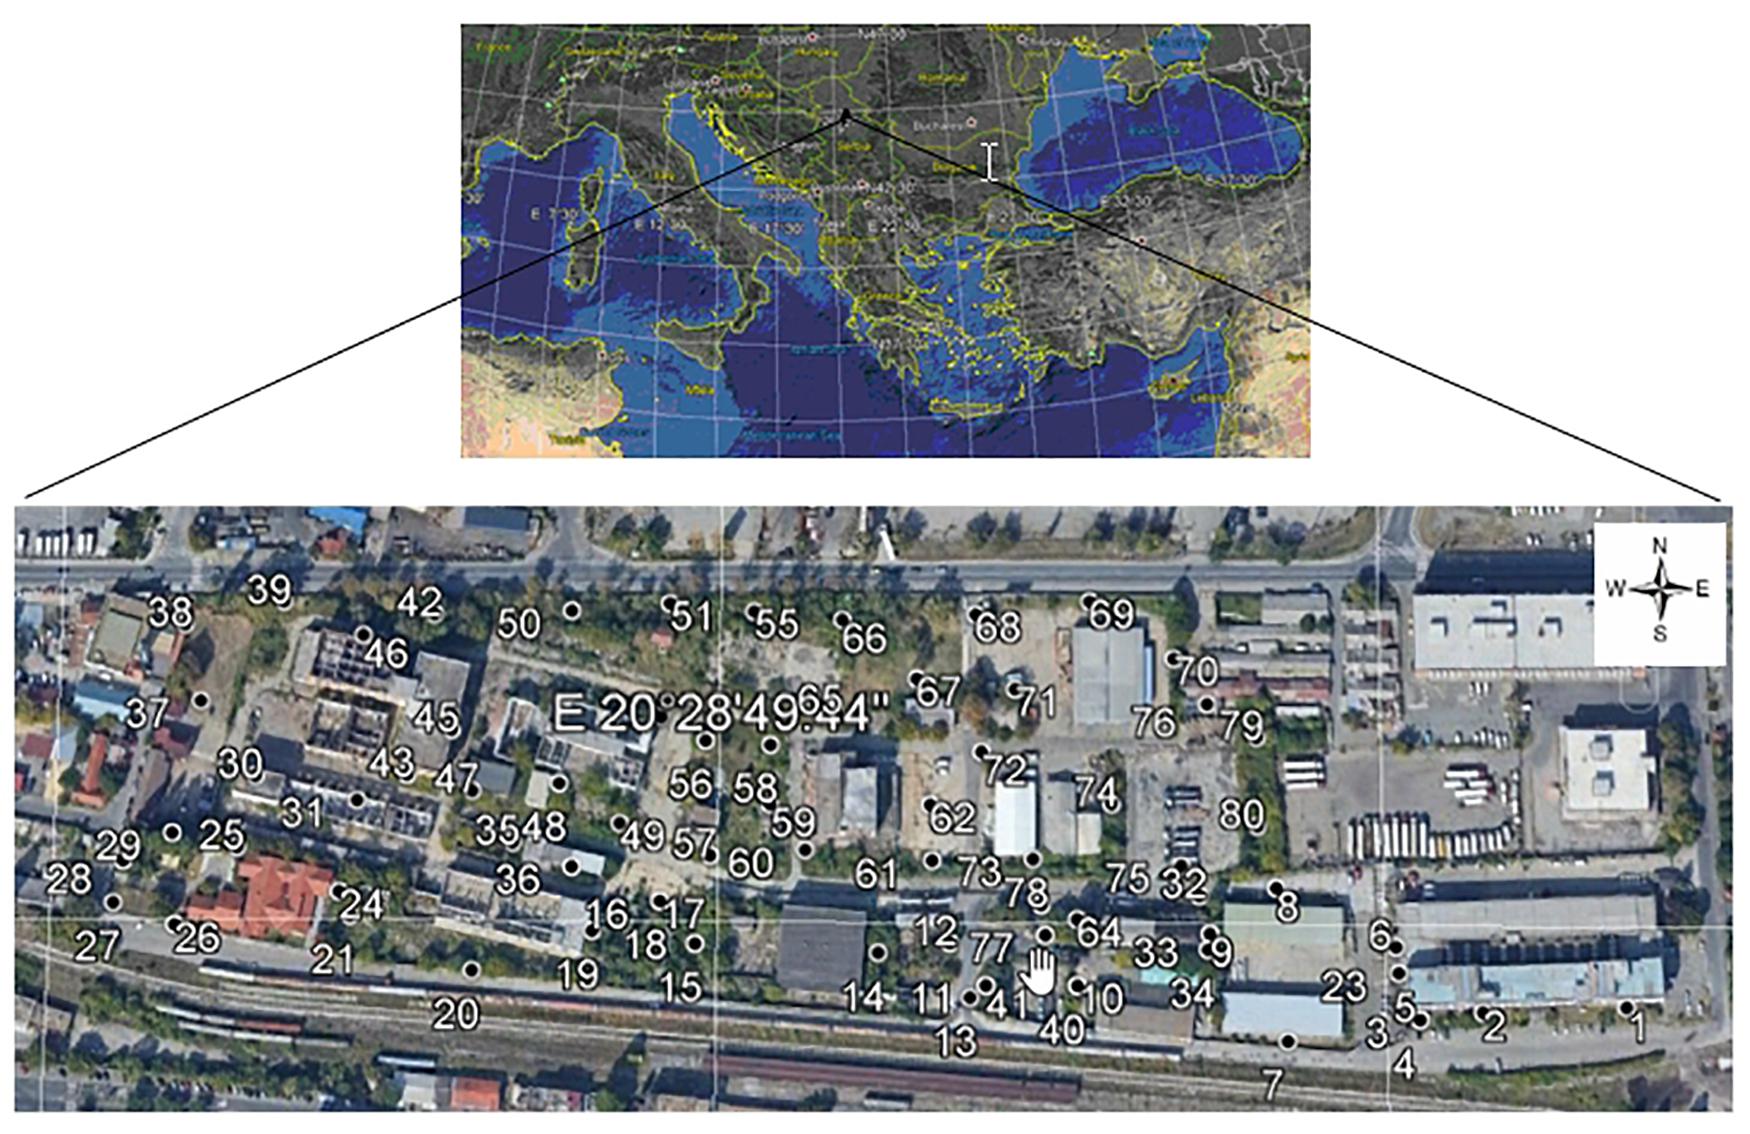
Figure 1. Map of the study area and distribution of sampling points.
Some sampling points were inside the buildings, or on areas covered by asphalt or concrete paving. To reach the soil, a core-drilling machine was used to make a hole, prior to sampling. Five subsamples were collected to make a composite soil sample (about 1 kg). After removing stones and other debris, this composite sample was divided into two to make duplicates. All samples were put into plastic jars and transported to the laboratory in a few hours.
Sample Preparation and Measurement
Soil samples were air-dried, pulverized, and passed through a 2 mm sieve, followed by pseudo-total microwave-assisted digestion using a CEM Mars 5 oven (CEM Corporation, Matthews, NC, United States Each sample (0.5 g) was digested in acid, using a 10 mL mixture of concentrated HNO3, HCl, and H2O2 (7÷2÷1). The amount of H2O2 was added slowly to prevent excessive bubbling within the tube. The microwave oven was set to the following program: ramp time 10 min and hold time 10 min, at 175°C. After digestion, sample solutions were cooled, diluted (10-fold), and filtered through a Whatman No. 41 filter. Samples were stored in 50 mL acid-washed polyethylene autosampler tubes at 4°C until analysis.
Metal concentrations (Cr, Cd, Pb, Ni, Zn, Cu, Fe) were measured by a flame atomic absorption spectrometer (AAS; Analyst 100, Perkin Elmer Inc., Waltham, MA, United States) equipped with the appropriate hollow-cathode or electrodeless discharge lamps. Deuterium background correction was used throughout. Hydride generation/cold vapor accessory was used to determine As and Hg concentrations (MHS-15, Perkin-Elmer Inc.). Reducing solutions of NaBH4 and SnCl2 were used in the accessory to generate a gaseous form of As and Hg, respectively. Working standard solutions of each heavy metal were made by dilution of stock solutions (1000 mg/L; Merck KGaA, Darmstadt, Germany).
A gravimetric method was used to measure the soil water content. The difference in the mass of soil before and after drying to a constant mass at 105 ± 5°C was used to estimate the water content on a mass basis.
A Thermo Orion model 3 star pH-meter was used for the pH-value measurement. Soil pH was measured using a glass electrode in a 1:5 (v/v) suspension of soil in water. The measurement of the pH in the suspension was made at 20 ± 2°C whilst being stirred to achieve a reasonably homogeneous suspension of soil particles avoiding entrainment of air bubbles.
The content of phosphorus, which is soluble in NaHCO3 solution, was determined by adding a 0.5 mol/L NaHCO3 solution to the soil sample at pH 8.5, to reduce the concentration of Ca, Al, and Fe ions by precipitation and to release phosphate ions into the solution. The clear extract is analyzed for P content at 880 nm wavelength on a UV/VIS spectrometer Perkin-Elmer model Lambda 40, after forming an antimony-phosphate-molybdate complex at room temperature.
The total nitrogen content determination was based on the Kjeldahl digestion using a TiO2 catalyst. After distillation, the nitrogen content in distillate was titrated with sulfuric acid.
The sulfur in the soil was analyzed by oxidation to the sulfate form by fusion. The soil sample is ignited at 550°C with NaHCO3 in the presence of Ag2O catalyst, and the melt is dissolved in CH3COOH. The total sulfur was determined as sulfate (SO42–) by the titration with a BaCl2 solution.
Quality Assurance/Quality Control
Quality assurance/quality control (QA/QC) ensured that all 80 samples and their duplicates and blanks were sampled, prepared, and analyzed in the laboratory. Certified reference material NIST SRM 2711a – Montana II soil from the National Institute of Standards and Technology (NIST) was used as the standard soil sample for quality control of metal analyses. The recovery study was used for the validation of the sample preparation procedure. The following mean recoveries (±relative standard deviation) were obtained: Cr: 104 ± 3.1%; Cd: 91 ± 3.2%; Pb: 93 ± 2.9%; Ni: 95 ± 2.4%; Zn: 98 ± 2.1%; Cu: 97 ± 2.5%; As: 90 ± 3.6%; Fe: 92 ± 3.8%; and Hg: 83 ± 11.7%. The MDL for the studied metals were: Cr: 1.3 mg/kg; Cd: 0.4 mg/kg; Pb: 2.1 mg/kg; Ni: 1.5 mg/kg; Zn: 0.07 mg/kg; Cu: 0.6 mg/kg; As: 0.04 mg/kg; Fe: 1.8 mg/kg; and Hg: 0.03 mg/kg. All calibration lines were linear, with a correlation coefficient higher than 0.995. The AAS sequence included a QC sample and a blank after 10 soil samples. A second identical sequence was run with the duplicate samples.
Data Analysis
Descriptive analysis (mean, median, skewness, kurtosis, standard deviation, maximum, minimum), Grubb’s outlier tests, and pollution indices (EF, Igeo, PLI, RI) were performed in Microsoft Excel. The soil pollution indices and their equations used for risk assessment methods were presented in Table 1. For an adequate understanding of the methodologies, the criteria and references are also included. Symbols in Table 1 denotes: Cx, Cn, Cis is the measured concentration of individual metal in the soil, R is the concentration of the reference element in the unpolluted soil, Bn is the background concentration or reference value of the metal n, N is the number of metals tested, Cin denotes the background concentration of metals in uncontaminated soil; Tir denotes the toxic response factor of heavy metals. These factors for: Pb; Cd; As; Zn; Cr; Ni; Cu; and Hg have values: 5; 30; 10; 1; 2; 5; 5; and 40; respectively (Hakanson, 1980; Men et al., 2018; Gan et al., 2019; Li et al., 2020; Monged et al., 2020).
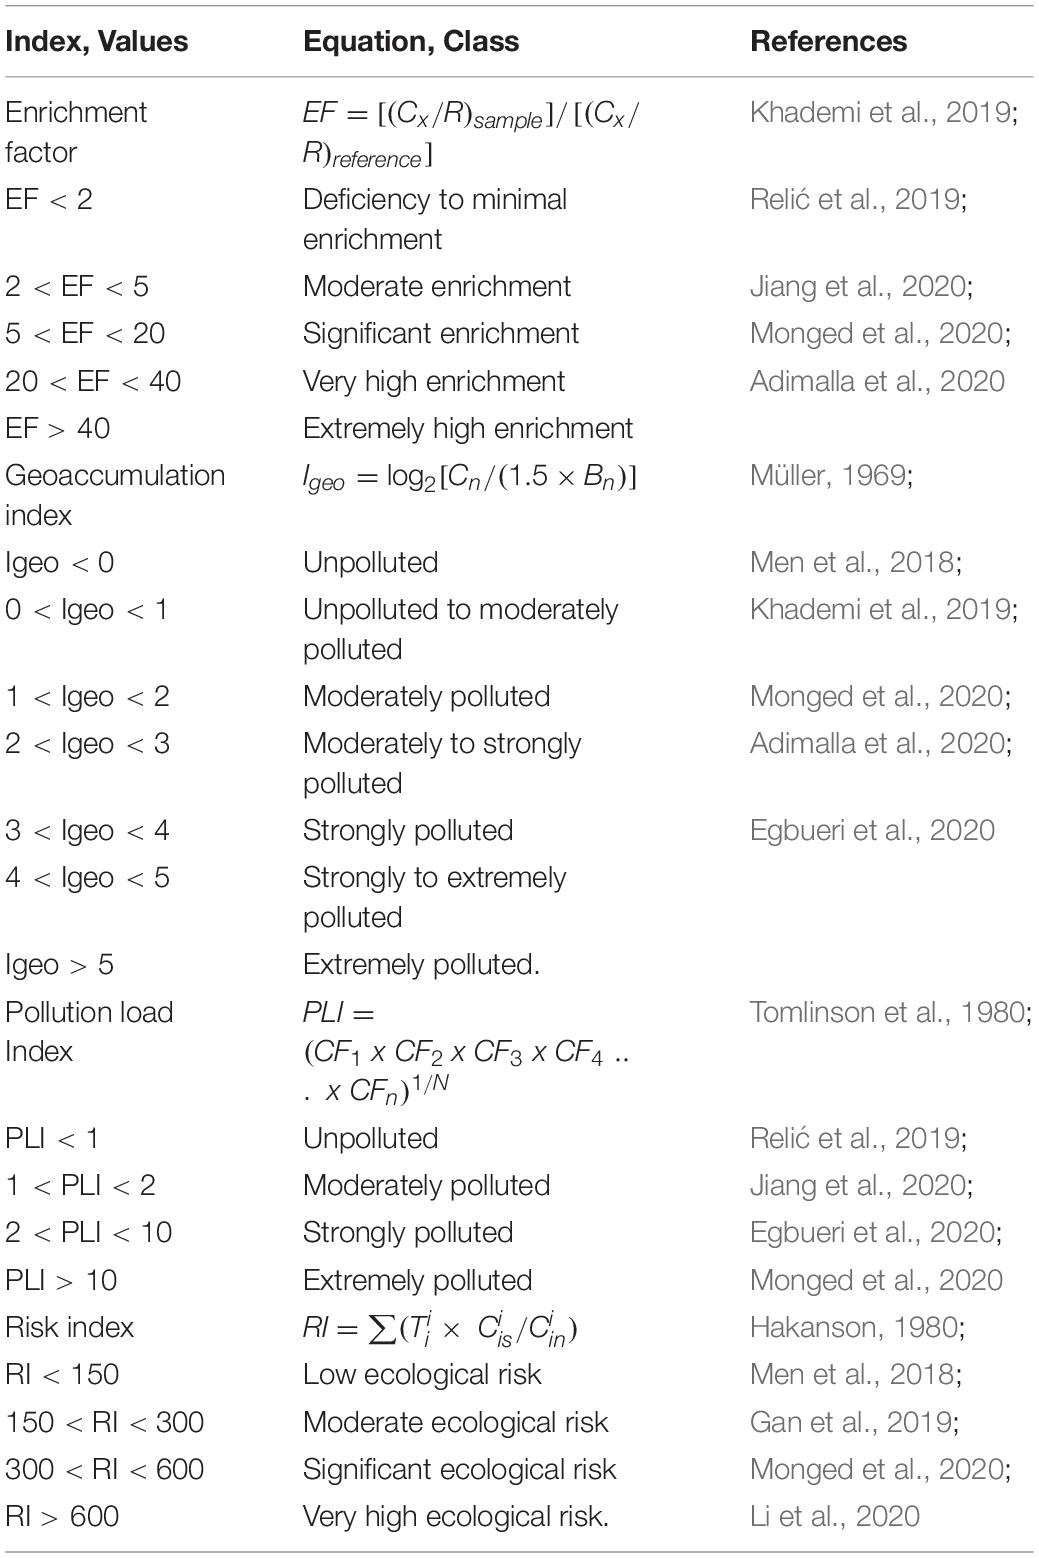
Table 1. Criteria for soil classification using pollution indices.
Minitab software package was used to perform multivariate (Pearson correlation, PCA, HCA) data analyses. Details on the multivariate procedures are described in Onjia (2016). The spatial distribution of toxic metal concentration was mapped using Golden Software Surfer. EPA PMF 5.0 software (Norris et al., 2014) was employed for the PMF data evaluation.
Results and Discussion
Physiochemical Properties and Trace Elements Distribution
Soil Physicochemical Properties
The characteristics of heavy metals content in soils are related to both the physical and chemical properties of soils. Therefore, the concentrations of heavy metals (Cr, Cd, Pb, Ni, Zn, Cu, Hg, As, and Fe) together with some basic soil properties (pH, phosphorus, sulfur, nitrogen, and water content) were analyzed in all samples. Supplementary Table 1 shows the experimental results for all analytes tested in the soil samples. According to the average pH values, the soil is slightly alkaline, although, there is a maximum of pH 9.9, which classifies that soil sample as very alkaline. This indicates that there have been alkaline chemical leaks. In general, soil of this pH is not suitable for metal bioavailability, since most heavy metals are more mobile and available at a lower pH (Kim et al., 2015). Soil water content varied significantly: this is expected from surface soil, as it is strongly influenced by weather conditions. The sulfur content of some samples showed increased values, while the nutrient content (nitrogen and phosphorus) was relatively low, and well within the concentrations expected in industrial soil. The soil texture was estimated to be similar to that of Novi Sad city (Serbia), which is located on a similar river bank terrace, affected with Danube fluvial activities, therefore, quite a sandy soil (Mihailović et al., 2015), not suitable for water and nutrient retention.
Descriptive Statistics
The results of the descriptive statistics are presented in Table 2. Across the study area, the concentrations of toxic metals (mg/kg dry weight) in soil samples were found in the following ranges: Cd (1.1–7.4); Pb (13–616); Ni (27–189); Zn (29–1199); Cu (16–96); Hg (<0.1–1.2); As (1.2–28); and Cr (21–89). The skewness and kurtosis of Cd, Pb, Ni, Zn, As, and Hg were found well above the one showing right-handed skewness. Based on the mean values, the metal concentrations decreased in the following order: Zn > Pb > Ni > Cr > Cu > As > Cd > Hg. The results show that besides Fe, the most abundant metals in the study area were Zn and Pb. Several studies have reported that Zn is the most abundant heavy metal in urban soil (Yadav et al., 2019; Zhao et al., 2019; Egbueri et al., 2020; Jiang et al., 2020; Jin and Lv, 2020), while in some studies, Pb is found in the highest concentration (Harvey et al., 2017; Škrbić et al., 2018; Adimalla et al., 2020). However, Chen et al. (2020) reported Cr as the most abundant toxic metal in soil. If Fe is excluded, the most abundant metal in soil is usually Mn (Men et al., 2018; Roy et al., 2019; Xie et al., 2019; Monged et al., 2020). In this study, Ni, Cr, and Cu were found in similar concentrations, while Cd and Hg were present at very low levels. Levels of Zn and Pb had high standard deviation: these metals are influenced by human activities, and their dispersion over the sampling area is less uniform.
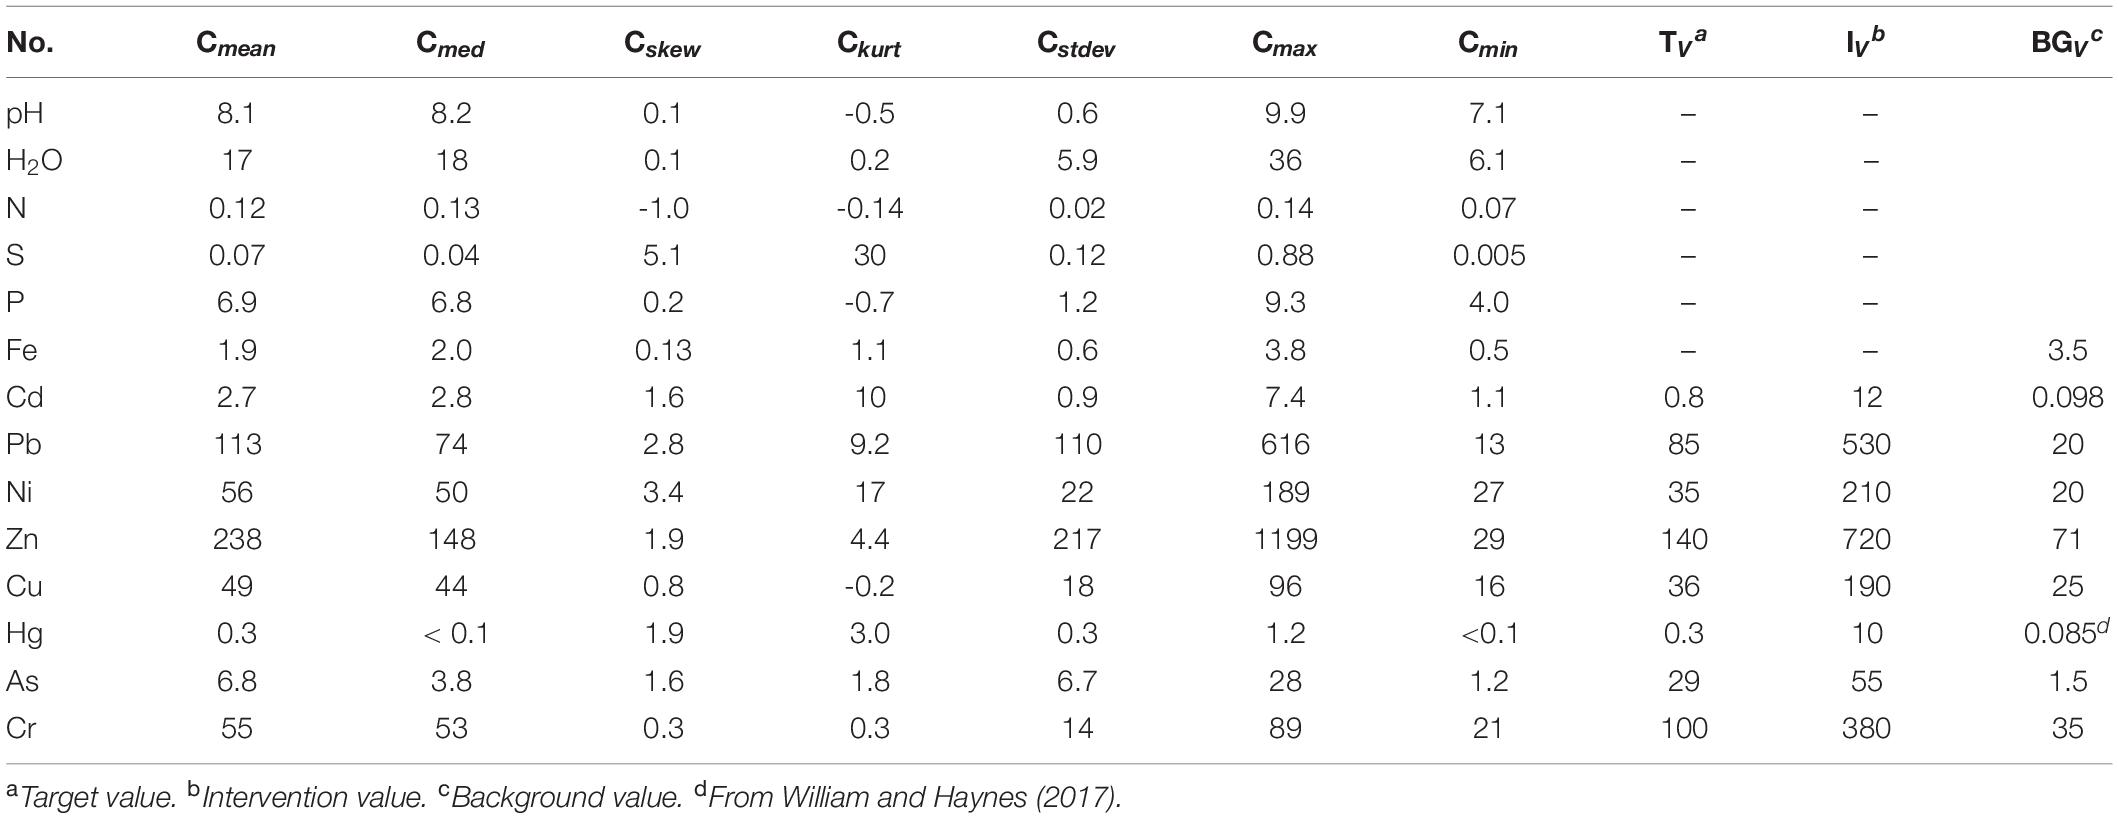
Table 2. Descriptive statistics of soil samples (n = 80) (H2O, N, S, Fe in %, and all others are in mg/kg).
Most soil samples exceeded the geochemical background values (Taylor and McLennan, 1995; Table 2). Soil pollution is not comprehensively regulated at the European level, therefore, national regulations should be considered. A comparison of the results with the Serbian limits (Official Gazette of Republic of Serbia, 2018) is shown in Table 2. The Serbian target and intervention values are identical to those from the Dutch list for soil pollution (Dutch Standards, 2000), which are widely applied globally (Gong, 2010). The target value implies that contamination is present and further investigation is required, while the intervention value implies significant contamination is present and cleanup is required to decrease the soil metal concentrations to below the target value. Table 2 shows that the average content of metals in our soil samples do not exceed the intervention values. However, for all metals, except Cr, these metals are above the target values. In the case of Pb and Zn, there are a number of individual samples with concentrations well above the intervention limits. This indicates that at certain locations there has been a leakage of materials containing these metals into the soil, or intensive traffic activity as vehicle fuel is a major source of Pb contamination in soils (Roy et al., 2019; Adimalla et al., 2020). These sites require remedial action, and the soil should be cleared before any further management decision is made.
A literature survey of soil metal concentration related to the painting industry was summarized in Table 3. At the first sign, a very high variation in the concentrations reported is notable, i.e., from below detectable levels, to >1000 mg/kg in some hot spots (Yan et al., 2008). Arsenic pollution is not a major concern because the maximum concentration of 28 mg/kg, well below the target value, was found in this study. Cooper Cr, and Ni concentrations in this study show comparable patterns, and they are highly dependent on the existence of a specific industry nearby (Nwajei et al., 2012; Ekpo et al., 2014; Spahić et al., 2019). Zinc and Pb are usually present at a higher level, therefore, they should be monitored (Yan et al., 2008; Hu et al., 2012; Dobroshi et al., 2019). Even if Cd and Hg concentrations are very low, they are of significant concern because they have very high toxicity (Hakanson, 1980). It should be noted in Table 3 that data on Hg pollution are very scarce. This could be because in order to measure it, a different configuration of the AAS instrument must be used. It is also present at very low levels, which is difficult to detect.
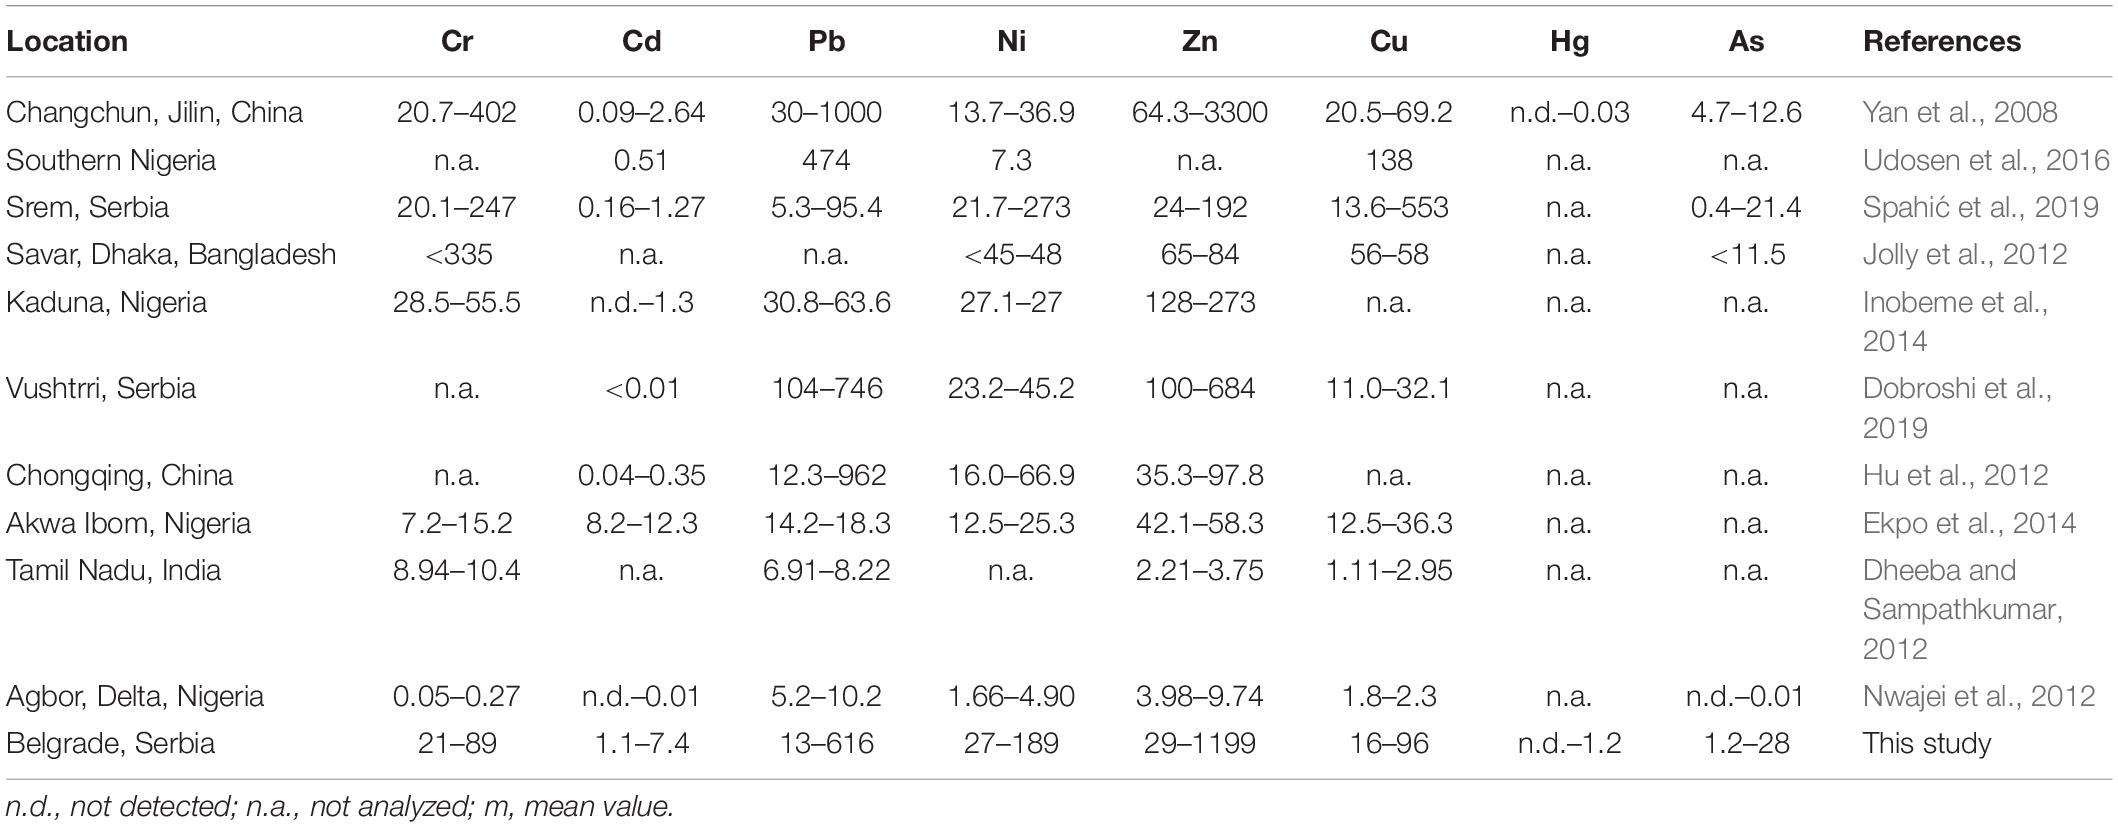
Table 3. Comparison (min-max) of the metal content (mg/kg) in soil samples with other studies from painting industry sites.
Spatial Distribution
Spatial visualization was made using geostatistical (GIS) mapping to recognize hot spots, i.e., the area with high values of toxic metals concentrations. In this study, based on the data from sampling points, a spatial interpolation using ordinary kriging enables an evaluation even for the unsampled area. This GIS approach has been used in numerous soil pollution studies (Dragović et al., 2014; Liang et al., 2017; Cheng et al., 2020; Jin and Lv, 2020). Soils concentration patterns of the studied metals are presented in Figure 2. Nickel, Cr, and Cu, show similar spatial distribution patterns, while the other patterns are quite varied. These maps are a worthwhile tool for identifying hot spots with high metal pollution and demarcating the safe and unsafe areas. Hot spots in this site are located in the vicinity of the car mechanic workshop, the waste store building, and the raw materials store.
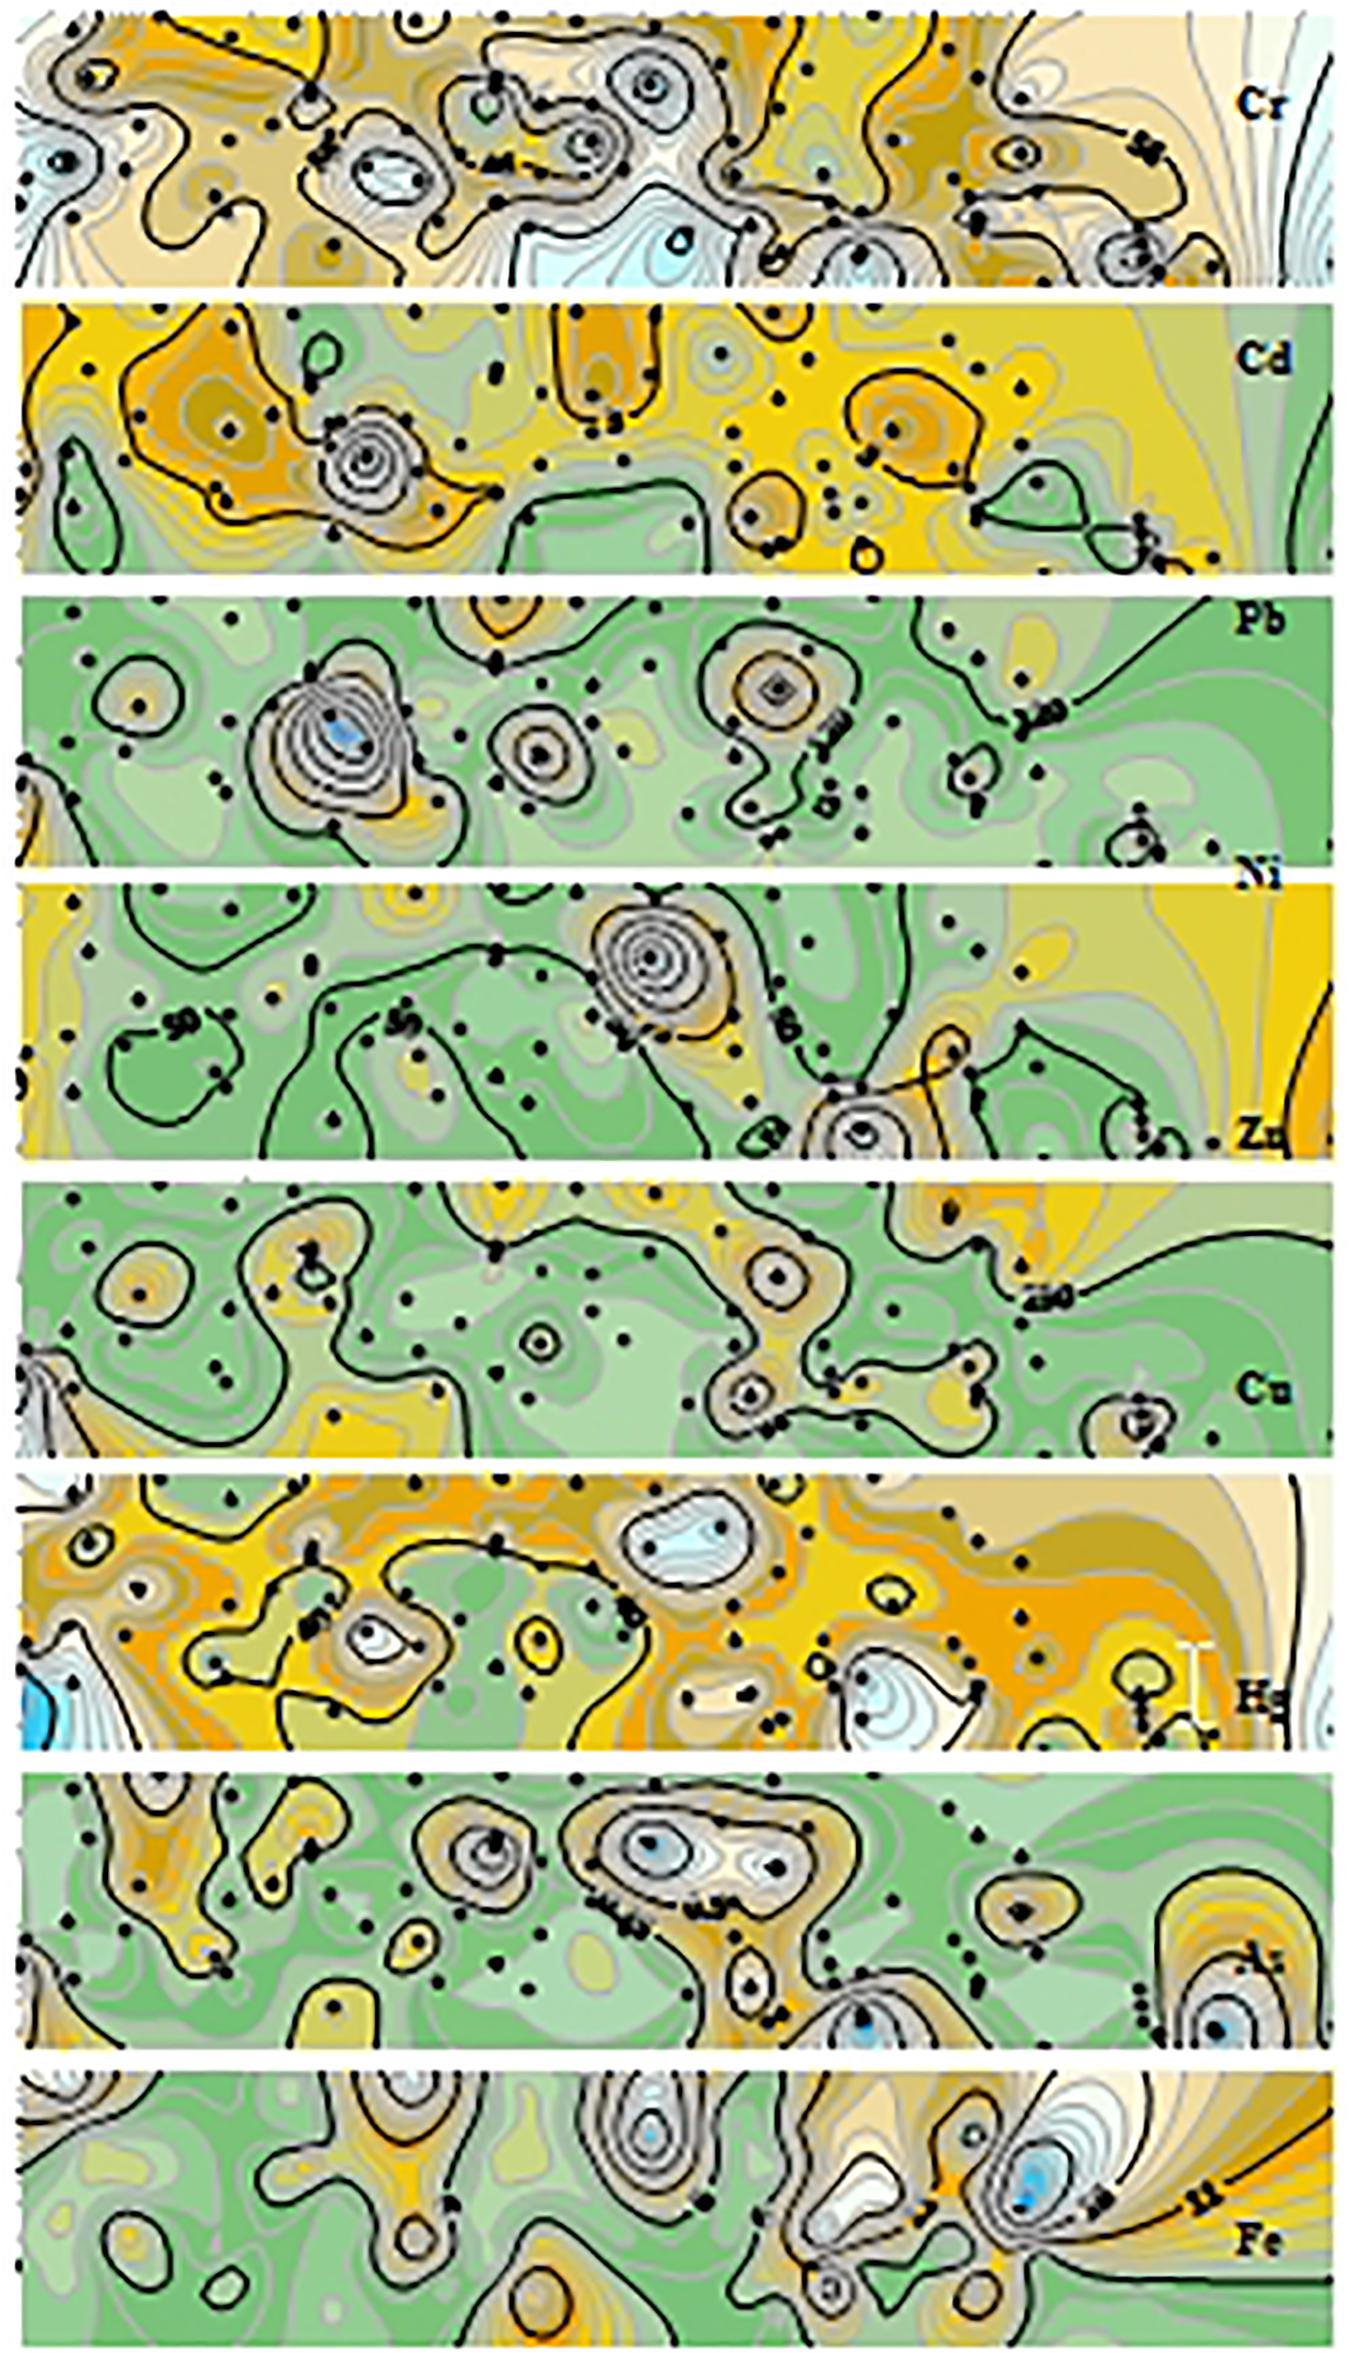
Figure 2. Spatial distribution of Cr, Cd, Pb, Ni, Zn, Cu, As, and Hg, in soil across the study area.
Multivariate Analysis
Correlation Matrix
Prior to multivariate analysis, a Pearson correlation matrix was made to measure the strength of the relationships between analyte pairs within the samples. Correlation analysis may provide information about the same origin or a similar pathway. Pearson’s correlation is to be performed in a normal distribution, therefore, the normality test was first made. The Ryan-Joiner test showed that Pb, Ni, Zn, and As were not normally distributed, so log-transformed data was used for further multivariate processing. The Pearson correlation coefficient matrix for metals and other soil parameters is presented in Table 4. Strong, moderate and weak correlations are considered as those with correlation coefficients of >0.7; 0.5 < r < 0.7; and <0.5, respectively (Egbueri et al., 2020).

Table 4. Pearson correlation coefficient matrix for metals and other soil parameters (n = 80).
Lead and Zn have a strong significant positive correlation, indicating that the method by which they reach the soil at this location is similar. The second pair of heavy metals with moderate correlation are Ni and Cu. The correlation coefficient values >0.5 are shown in bold. The Pearson correlation analysis showed that pH, soil water content, sulfur, and nutrients (nitrogen and phosphorus) did not affect the retention of metals in surface soil samples.
Principal Component and Factor Analysis
Principal component analysis and FA are common multivariate statistical methods used to reduce the dimensions of the dataset. In this paper, Varimax rotation was applied to maximize the variation of factor loadings. From this analysis, four PCs were retained that had Eugen values above one. In most cases, PCA and FA methods make a distinction between natural and anthropogenic sources from which contaminants originate (Slavković et al., 2004; Egbueri et al., 2020). Figure 3 presents the factor loading values for the analytes studied. Most metals are classified into one group, except Cd, which is classified by itself, and As and Fe, which are classified together with the water content, P, and pH, S and N, respectively. This shows that As and Fe do not originate from the same source as the other metals.
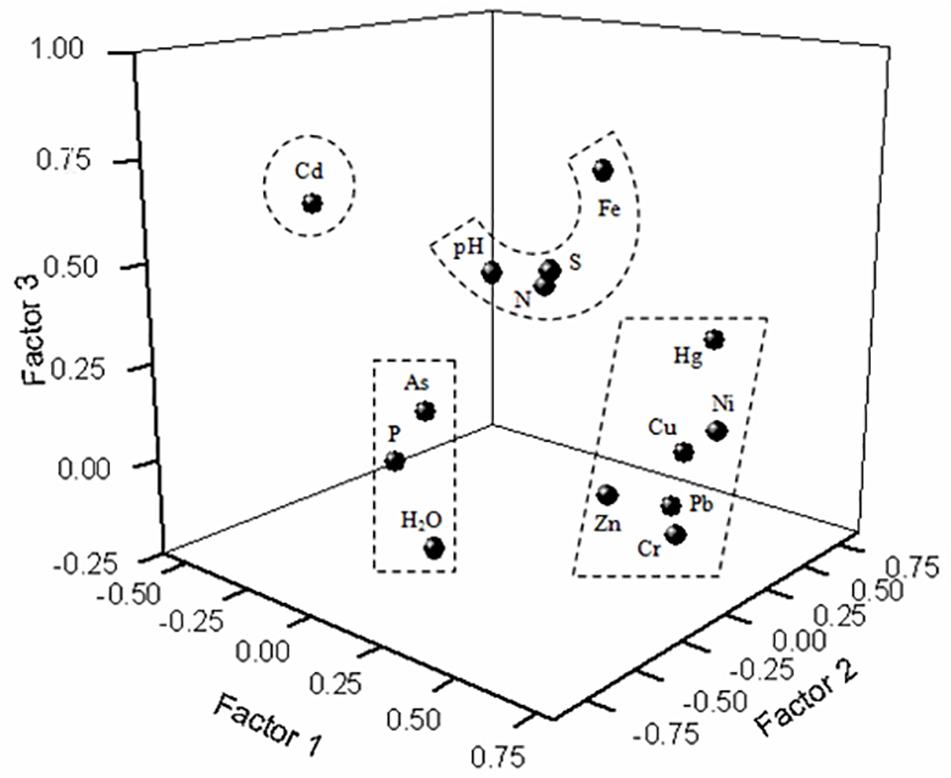
Figure 3. Factor analysis plot loadings.
Hierarchical Cluster Analysis
The similarities of metals sources in soil samples were analyzed by HCA. This method differentiates the components of different sources and classifies them into several groups. For this dataset, a Ward amalgamation rule with a squared Euclidean distance was used. Hierarchical cluster analysis results are shown in the dendrogram (Figure 4). The soil samples were classified into two distinctive groups, which were further divided into two sub-groups. The samples with a similar pattern are presented in one class. Hierarchical cluster analysis evaluation indicates that the metals Pb and Zn may originate from the same source, likely from human activity. The left-hand group of samples in Figure 4 is characterized by a high level of Pb and Zn. The cluster membership for all samples was given in Supplementary Table 2.

Figure 4. Dendrogram of soil samples at the former painting production facility.
Positive Matrix Factorization
In this study, the input data for the PMF model were the concentrations of all analytes, and uncertainty data associated with these concentrations. The number of factors run in the base PMF model were set to two, three, four, and five. The start seed number was chosen randomly, and the number of runs was set to 20. The Q value was shown to be the smallest and most stable when the number of source factors was set to four. In this way, most of the values in the residual matrix E were within ± five. The correlation indices between the estimated and measured concentrations ranged from 0.707 (Ni) to 0.989 (As), except for Cd (0.457) and Hg (0.346). This suggests that the PMF model apportioned metals appropriately. Four sources were identified by PMF and they agreed with the previous FA results. The source profiles of metals, together with the soil characteristics of the four factors are shown in Figure 5.
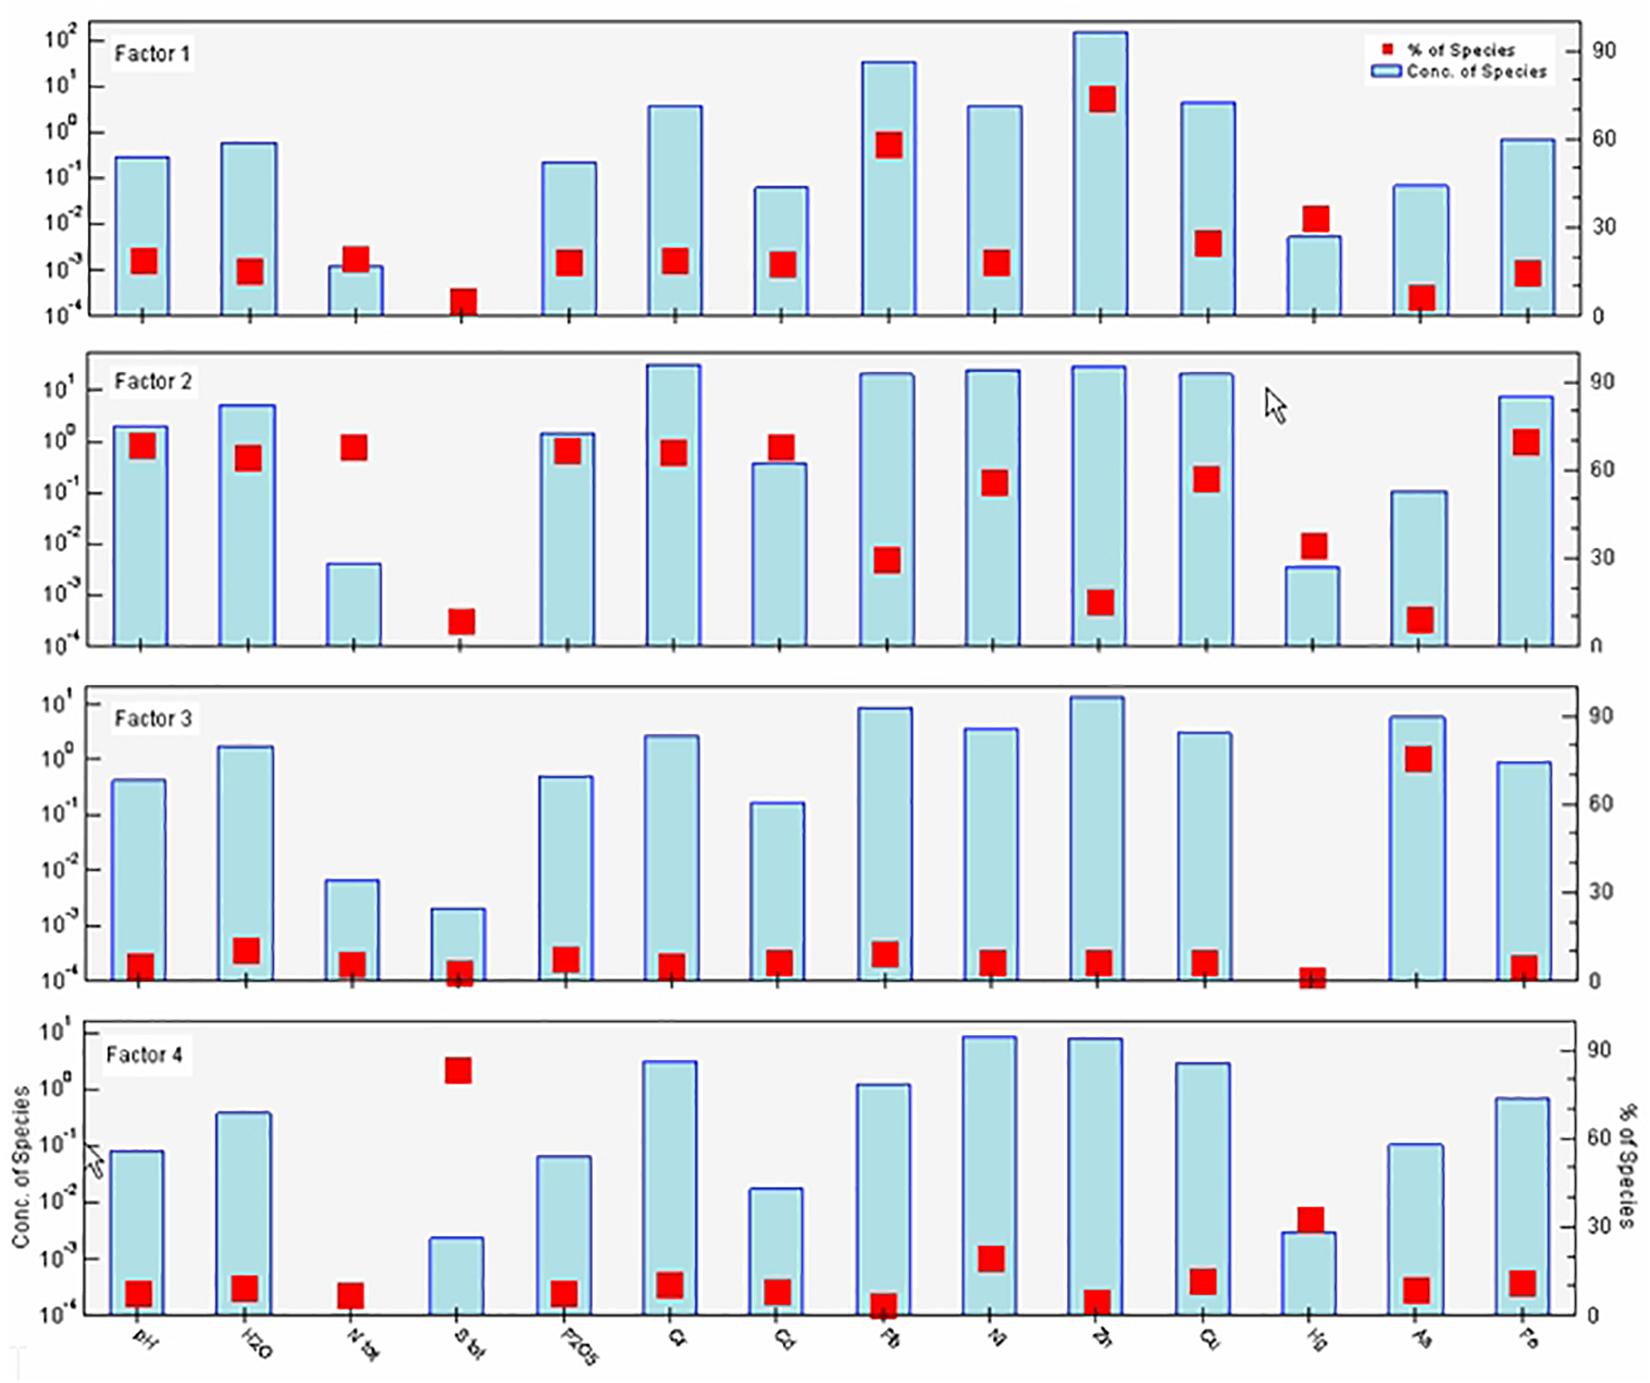
Figure 5. Source profiles of metals and other analytes and source contribution percentages from the PMF model.
As seen in Figure 5, Fe, As, Cu, Zn, Ni, Pb, and Cr contributed to all factors by more than 50% of their total amounts. The soil pH, water content, and phosphorus content show similar behavior. The contribution of nitrogen to Factor 4, Hg to Factor 3, and sulfur to Factors 1 and 2, is negligible. The factor fingerprints of metals resulting from the PMF model are shown in Figure 6, while the factor contributions to the heavy metals are given in Supplementary Figure 1.
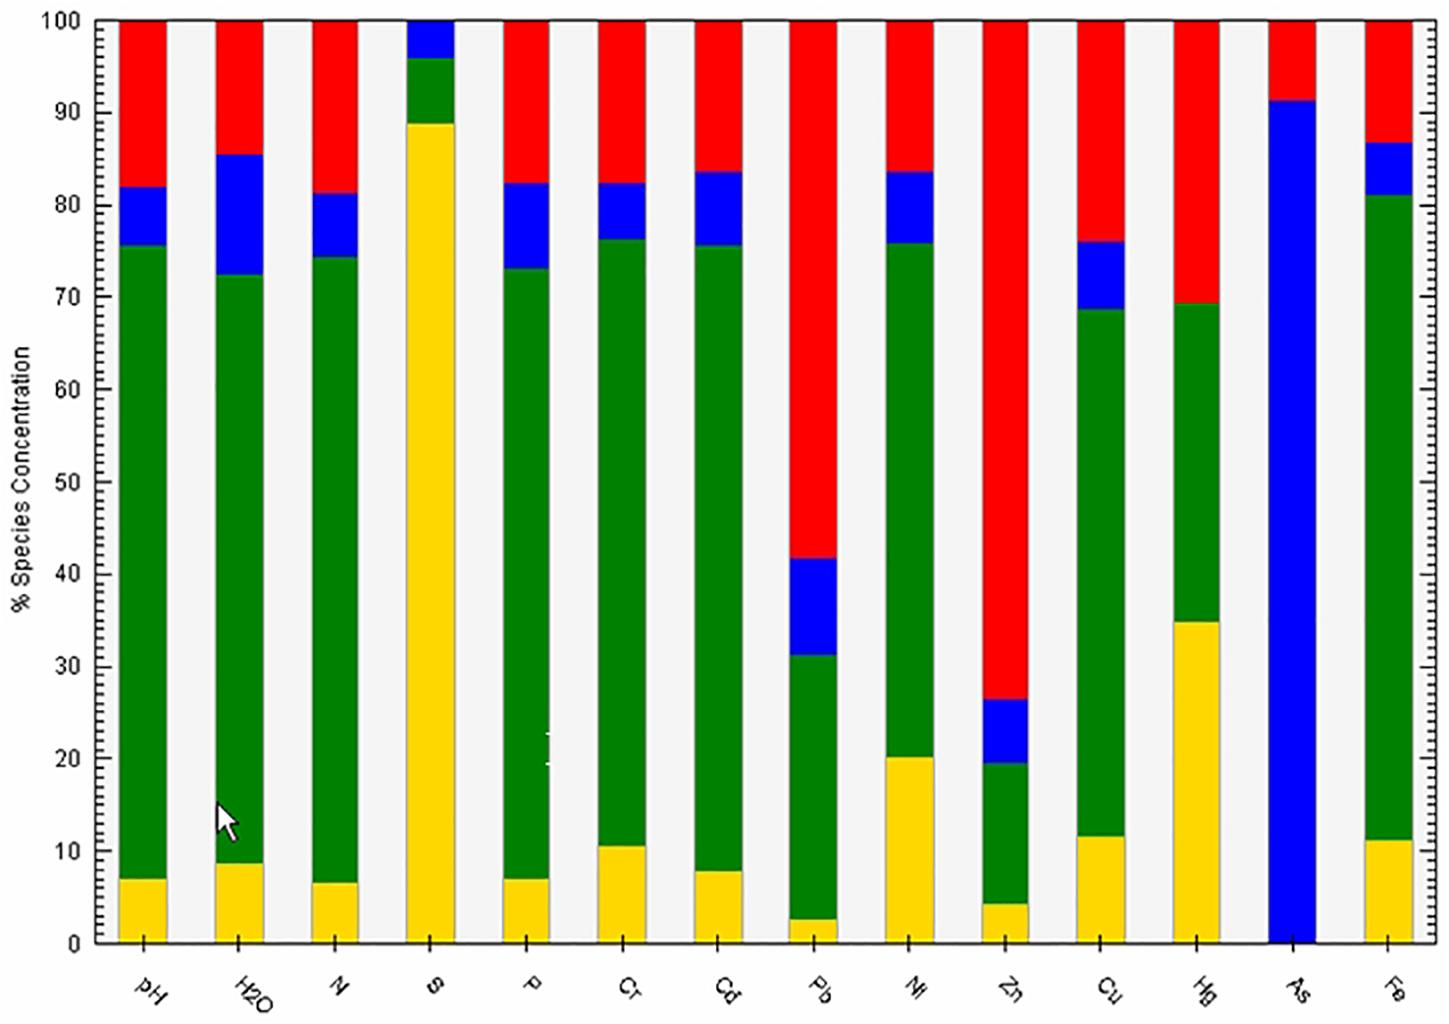
Figure 6. Factor fingerprints of metals resulting from the PMF model. Factor 1 (red color); Factor 2 (blue color); Factor 3 (green color); Factor 4 (yellow color).
The first factor presented high loadings of Pb (58.2%) and Zn (73.6%). Most of the sample sites showed obvious Zn and Pb pollution, with Zn in particular reaching a level of severe contamination. Anthropogenic activities were the primary source of these two heavy metals. Traffic vehicle emission is generally considered to be the most important source of Pb and Zn (Men et al., 2018; Adimalla et al., 2020; Chen et al., 2020), although the accumulation of Pb and Zn in urban soils could, to some extent, be dependent on atmospheric deposition (Xie et al., 2019). It has also been reported that most of the risk from road dust, which is resuspended and deposited in the area, could be attributed to Pb (Roy et al., 2019). According to Harvey et al. (2017), road dust is the most significant contaminant of urban soil. The spatial variation of Zn and Pb content was similar, and some of their high-value areas coincided in the study area. As mentioned above, this location is currently part of the city center and surrounded by streets with heavy traffic. Besides vehicle exhaust emissions, this factor includes possible spillage of vehicle-related mineral oil or gasoline. Automobile tyres also release a large amount of Zn (Jiang et al., 2020).
The second factor accounted for 91.3% of the As contribution. This high factor load may be connected with the use of chemicals containing high levels of As (Nriagu et al., 2007). The measured concentration level of As in these soil samples is far below the target value, and does not pose a pollution threat. These changes in the soil levels of As are probably caused by industrial emission from several other industrial facilities, including a chemical manufacturing factory located northeast of the study area: spatial distribution revealed that the As high values spots were mostly in the northeast of the study area. Factor 2 was considered as an anthropogenic component, owing to the industrial As emissions.
Factor 3 was defined by Fe (69.8%), Cu (57.1%), Ni (55.8%), Cd (67.9%), Cr (65.8%), Hg (34.6%), along with P (66.1%), N (67.7%), pH (68.6%), and water content (63.9%). Copper, Ni, and Cr have been demonstrated to be the indicators of a natural origin in a soil study by Jiang et al. (2020). Nickel has also been identified as being from natural sources (Cheng et al., 2020). Chromium and Fe by Liang et al., 2017, Cr and Ni by Jin and Lv (2020). Hence, factor 3 was identified as a natural source.
The last factor was shown to be a non-metallic one, accounting for 88.9% of the sulfur contribution, the dominant analyte in this factor. This factor is attributed to the facility operation process during its lifetime. Sulfur is present in petroleum products and can reach the soil by hydrocarbon spillages, however, as sulfur is not correlated with Pb and Zn, this is not it’s primary route to the soil. Atmospheric deposition may also occur, in the form of acid rain, as well as spillages of sulfuric acid. However, the measured pH values do not show soil acidity; therefore, sulfuric acid deposition is assumed to be negligible. The use of sulfur to make paints, for example in the process of sulfonation, and the addition of sulfur, as an additive, to asphalt and concrete (Saylak and Conger, 1982) which could leach into the soil, are the most likely reasons for the sulfur variations measured in our samples. Therefore, factor 4 was determined as a non-metallic historical factor.
A metal that appears to comes from several different sources is Hg. This metal equally contributes to factors 1 (30.6%), 3 (34.6%), and 4 (34.8%). Thus, Hg could be of natural origin and, to some extent, released from the production of chemicals and medical devices (Men et al., 2018).
Ecological Risk Assessment
Enrichment Factor
The difference between the presence of individual metals derived from anthropogenic activities, and those of natural origin or derived from a mixed source of heavy metals can be estimated using the EF. The unpolluted Earth’s crust is used as the reference for element content in the calculation of EF, commonly using Fe (Khademi et al., 2019; Monged et al., 2020), Al (Relić et al., 2019; Adimalla et al., 2020), Ti (Jiang et al., 2020), Mn (Yadav et al., 2019), or soil organic matter content (Gan et al., 2019). In any case, it is mandatory that the reference element selected is not of anthropogenic origin in the study area.
Based on the factor analysis (section“Principal Component and Factor Analysis”), it was established that the source of Fe was different from the source of the other metals. Furthermore, the Fe content in the upper continental crust is high, compared with the inputs of anthropogenic sources. Therefore, Fe can be used as the reference element in EF estimation for the trace metal data geochemical normalization. A surface soil sample from a rural area, not far from the study site (6 km southeast, GPS: 44°49′00.5″N; 20°33′25.4″E) was used to establish the background reference concentrations (in mg/kg; Cr = 28; Cd = 1,4; Pb = 17; Ni = 36; Zn = 39; Cu = 21; Hg = 0,13; As = 1.6; Fe = 6700). The EF results are presented in Table 5.
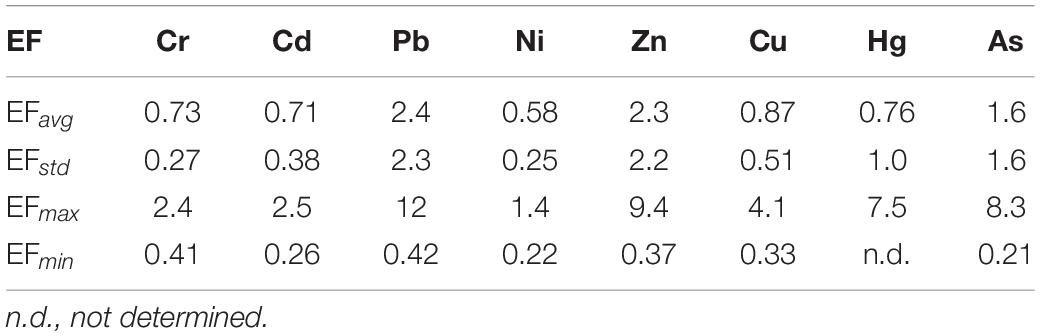
Table 5. The enrichment factor for studied metals in soil samples.
Five categories of soil contamination are recognized based on the EF classification (see Table 1). The average EF values for Zn and Pb are much higher than the others, and in terms of these metals, it can be said that most soil samples are moderately enriched in Zn and Pb. In the case of Ni, there was a lack of any significant enrichment, even in the soil sample with the maximum concentration. As discussed above, PMF identified Cr, Cd, Ni, and Cu as belonging to natural sources. It should be emphasized that an EF value less than 1.0 suggests that the heavy metal in question originates entirely from the Earth’s crust, or natural weathering processes (Adimalla et al., 2020).
Geoaccumulation Index
Assessment of soil pollution can also be done by comparing current metal concentrations with pre-industrial concentration levels. This approach was proposed by Müller (1969) to identify and define metal pollution in soil and sediments, for which the Igeo was introduced. The same rural sample used in EF formula was used for the Igeo estimation. Factor 1.5 in the Igeo equation is used due to of possible variations in the background values of a particular metal in the environment, i.e., lithogenic effect as well as due to possible minimal anthropogenic effects (Müller, 1969; Egbueri et al., 2020; Monged et al., 2020).
Seven classes of soil, based on Igeo, are defined in Table 1. The average values obtained for Igeo were Cr, 1.9 ± 0.4; Cd, 1.8 ± 0.5; Pb, 3.3 ± 1.0; Ni, 1.6 ± 0.4; Zn, 3.2 ± 1.1; Cu, 2.1 ± 0.5; Hg, 1.4 ± 1.2; and As, 2.5 ± 0.6. Maximum Igeo values for the same metals are 2.7; 3.3; 6.2; 3.4; 6.0; 3.2; 4.2; and 5.1, respectively. Based on the average values, it can be concluded that, in terms of Cr, Cd, Ni, and Hg, the soil belongs to the class “moderately polluted.” Based on the As and Cu concentrations, the soil is classified as “moderately to strongly polluted.” The presence of Pb and Zn in the soil samples assign these samples to the class “strongly polluted.” In terms of maximum values of Pb, Zn, and As, the Igeo, in some cases, classifies the soil as “extremely polluted.”
Contamination Factor and Pollution Load Index
Using the model defined by Tomlinson et al. (1980), the contamination factor (CF) was determined as the ratio of the metal concentration in the analyzed soil, to the target concentration. According to Serbian regulations, the target values for analyzed metals are (in mg/kg): 85 for Pb; 100 for Cr; 0.8 for Cd; 140 for Zn; 35 for Ni; 140 for Zn; 29 for As; and 0.3 for Hg. As the regulatory values sometimes vary from country to country, CF values may be different, even if the metal concentrations are identical.
From the CF values, the PLI was derived to assess the metal pollution, the status of the soil, and the decision on the necessary actions to be taken. PLI > 1 indicates the presence of pollution. In the majority of soil samples, the analyzed PLI is below 1 (Figure 7), although there are those with PLIs well above one.
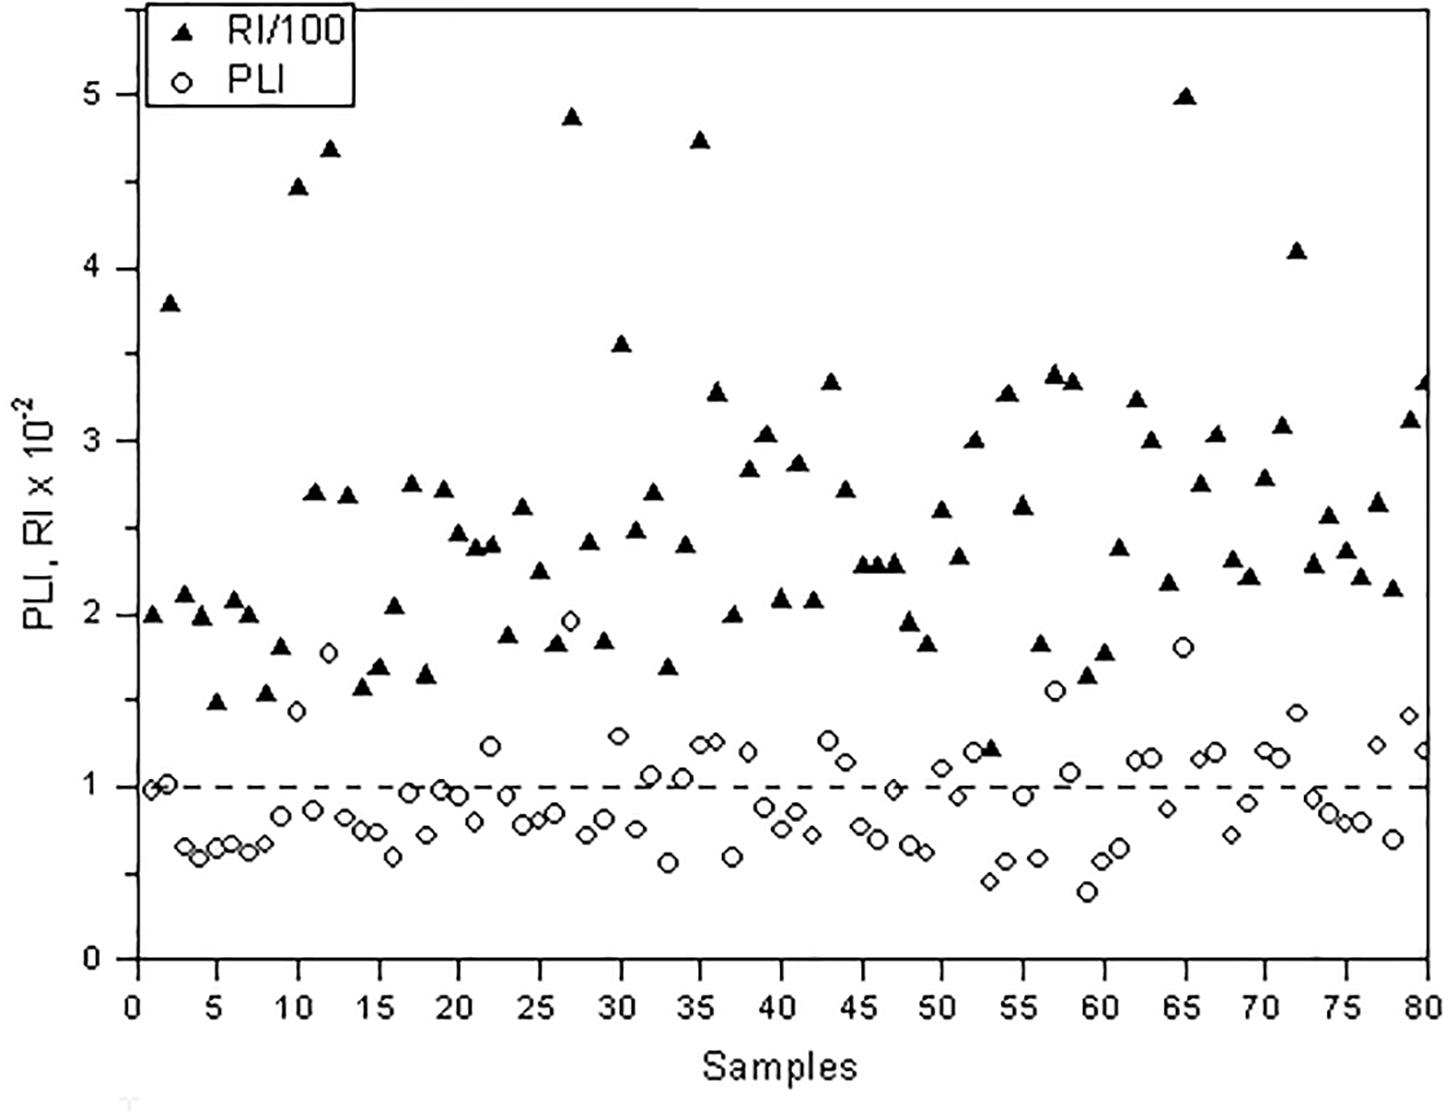
Figure 7. PLI and RI values in the studied area at the former painting production facility.
Potential Ecological Risk
The ecological risk was quantified using the RI, taking into account the concentrations of heavy metals, ecological factors and toxic response factors. This index stands for the potential ecological risk factor of all metals tested together. The RI values of pollutant metals were estimated for each sample (Figure 7). From these results and criteria, some soil samples show a very high ecological risk. The maximum RI is 349, and the lowest ecological RI is 77. The average value of the potential ecological RI is 164, indicating moderate pollution. The average contribution of individual metals to RI (Figure 8) is as follows: 63% Cd; 19% Hg; 5% Ni; 5% Cu; 4% Pb; 2% Zn; 2% As; and 1% Cr. This study reveals that Cd is the metal that poses the highest ecological threat. This metal has also been at the top of the risk list of heavy metals in recently published ecological risk assessment studies (Men et al., 2018; Gan et al., 2019; Zhao et al., 2019; Egbueri et al., 2020).
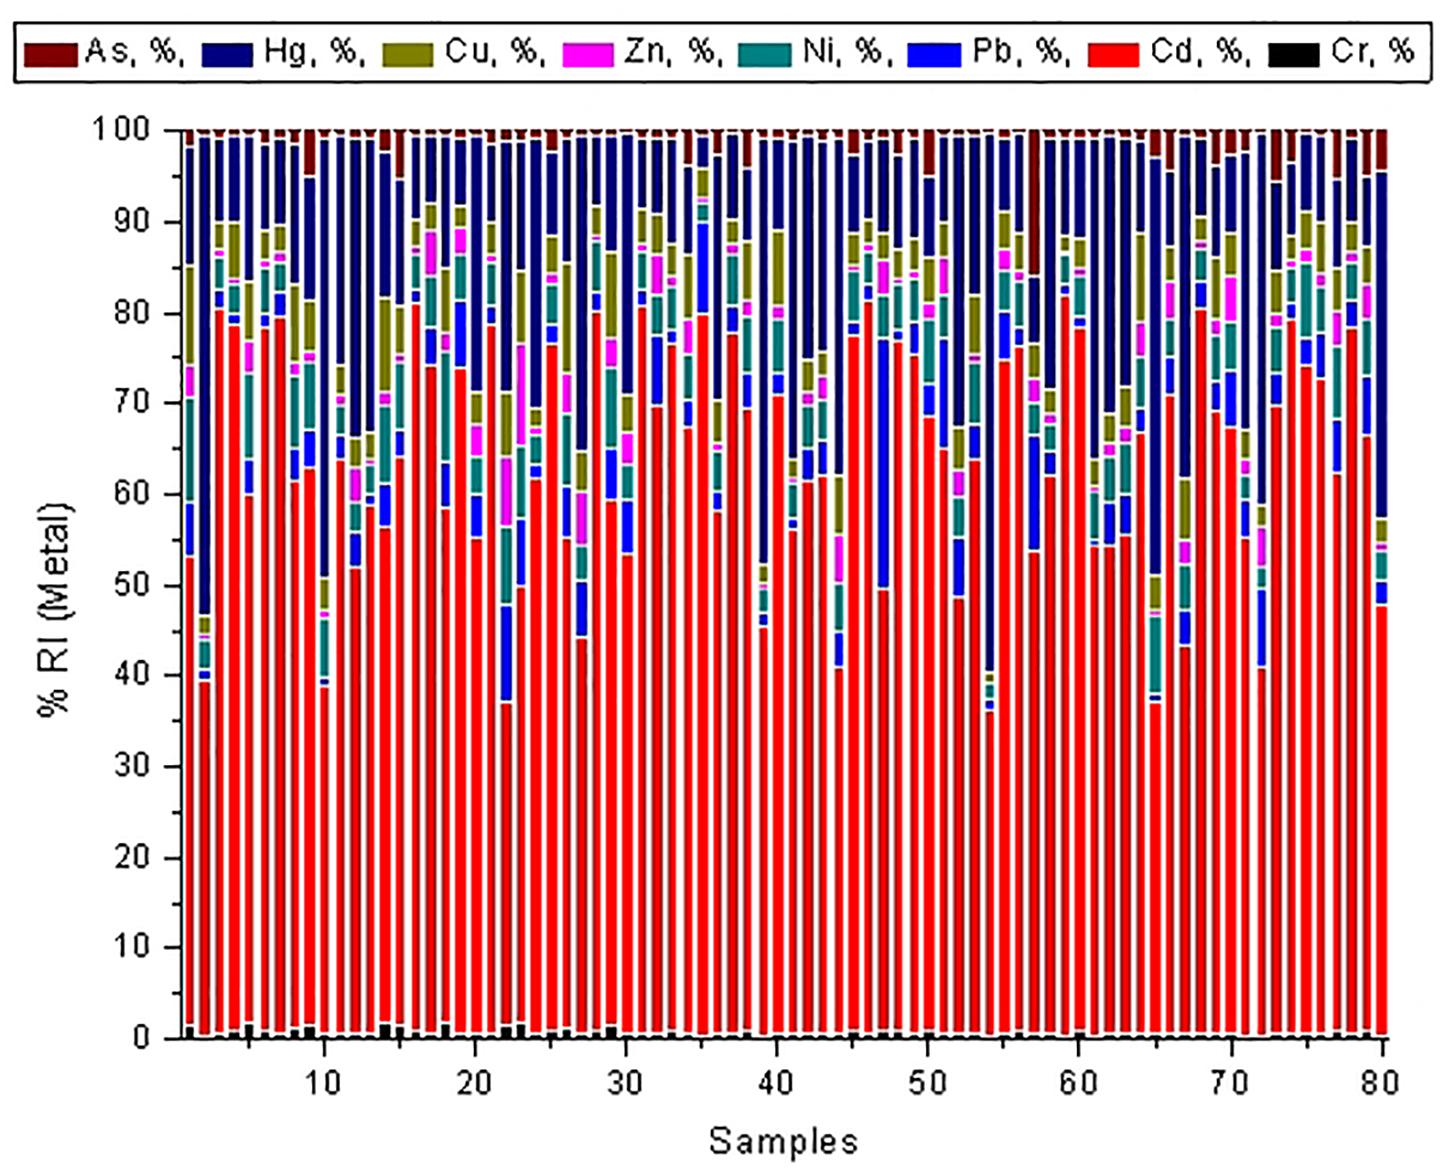
Figure 8. The individual contribution of metals to RI in the studied soil samples.
The spatial distribution patterns of ecological RI values in the surface soils indicate that samples with significant risk exist in some locations (Figure 9). Three large spots (A, B, C) and four smaller spots (D, E, F, G) stood out. It should be pointed out that some of these spots (C, F, G) are at the edge of the study area. Except for three low ecological risk areas, most of the studied area is generally at moderate risk.
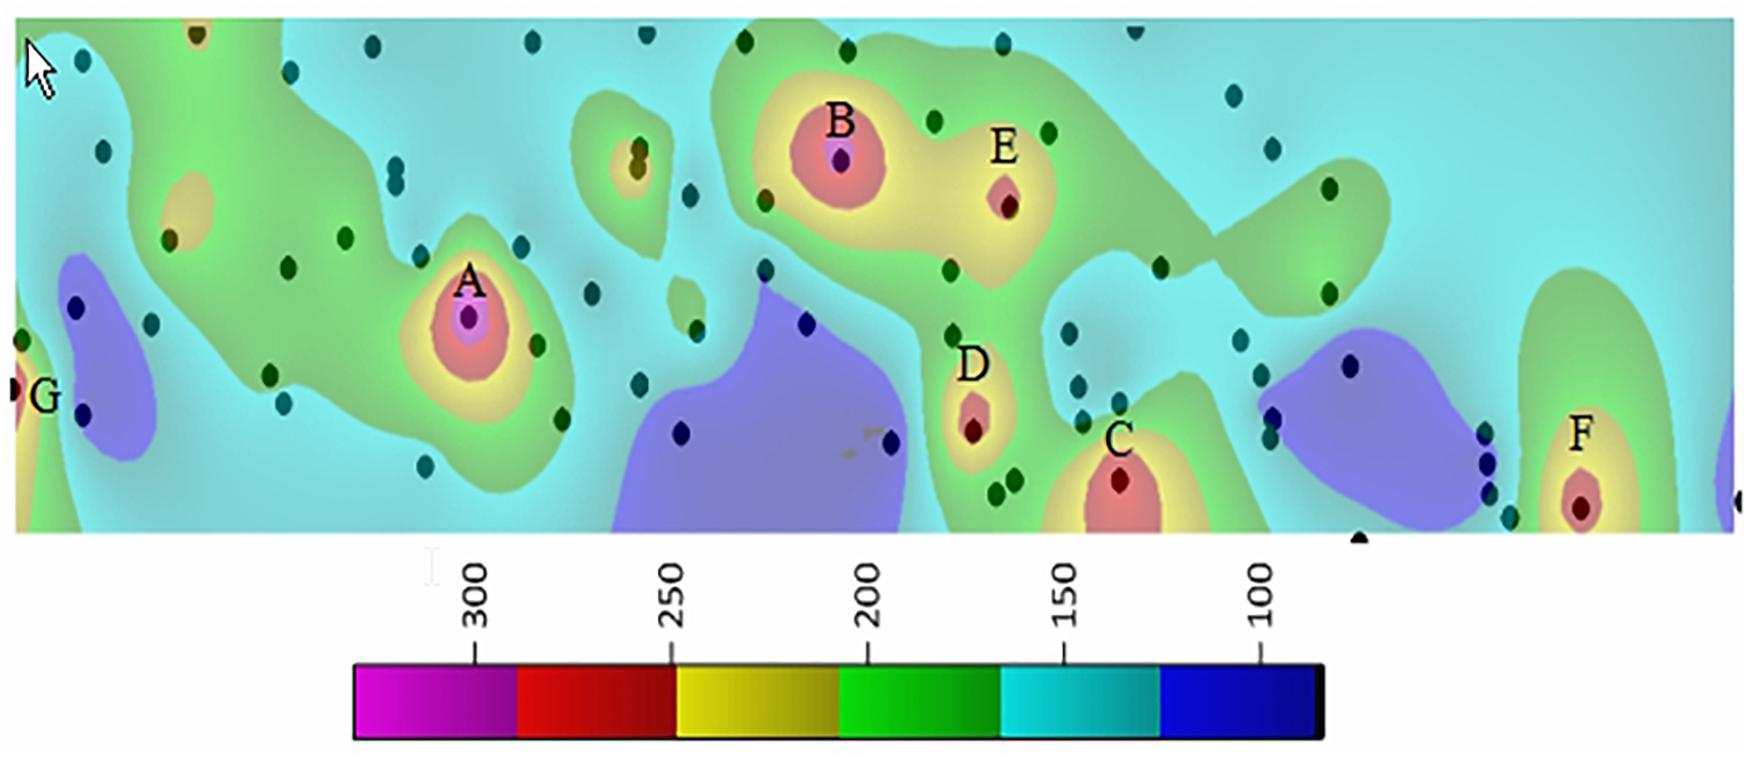
Figure 9. Spatial distribution map of RI of soil at the former painting production facility.
Comparison of Ecological Risk Indices
A comparison of ecological risk indices is shown in Table 6. It is evident that there is a zero contamination with As and Cr, but there are three and five soil samples, which are highly contaminated with Pb and Zn, respectively. The soil is most frequently enriched with Zn. Geoaccumulation is highest for Pb and Zn. In addition, the geoaccumulation of As is significant. Although individual metal contribution rarely exceeds an RI of 150, i.e., only 2% samples for Cd and 1% samples for Hg, the total RI percentage distribution is 47% (RI < 150), 49% (150 < RI < 300), 4% (300 < RI < 600) and 0% (RI > 600). This means that nearly half of the samples have either low or moderate ecological risk, while in a small number of samples the ecological risk is significant.
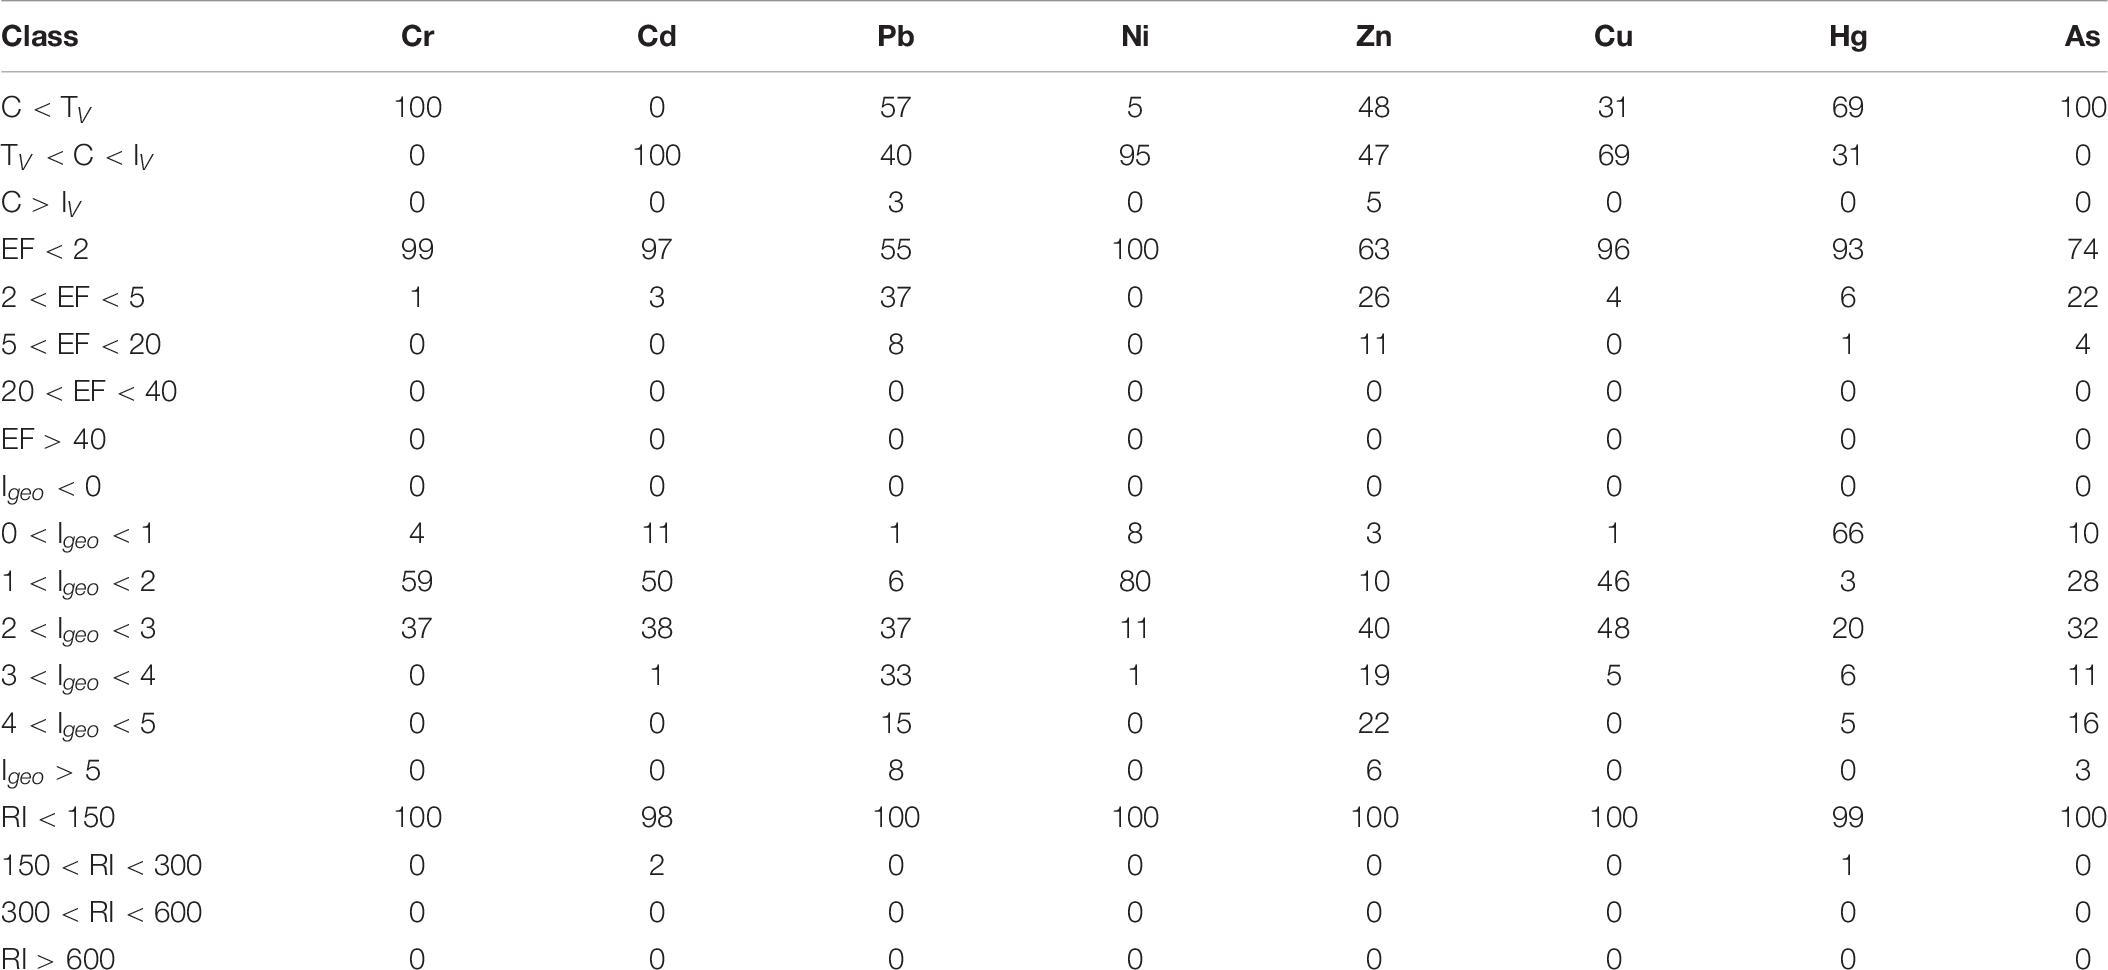
Table 6. Percentage of pollution class distribution of individual metals.
Conclusion
The average individual metal content in the studied soil samples is ordered, from high to low, as follows: Fe > Zn > Pb > Ni > Cr > Cu > As > Cd > Hg. Pearson’s correlation coefficient analysis, PCA, FA, and HCA identified the relationship between heavy metals in soil samples and their probable origins. A heavy metals group consisting of Pb, Cr, Cu, Ni, Zn, and Hg was separated from the other analytes, as well as from Cd. No correlation between metals and other soil physicochemical parameters was found. The PMF receptor modeling used to apportion the pollution source in the studied area, derived four factors, including the traffic vehicle factor (Zn, Pb), the natural background variation (most metals and physicochemical parameters), industrial chemicals emissions (As), and a non-metallic historical factor (S).
From the evaluation of the soil pollution indices, EF, CF, Igeo, PLI, and RI, it can be seen that the studied soil samples in most cases, are either not contaminated or are slightly contaminated. However, there are a considerable number of samples with severe contamination by heavy metals. Even though the concentrations of Zn and Pb are the highest, the highest potential ecological risk is attributed to Cd and Hg, the concentrations of which are the lowest. The geostatistical technique, using spatial distribution by ordinary kriging, mapped several high-risk sub-areas, as well as uncontaminated sub-areas.
These findings are relevant for environmental agencies and land use management. In general, moderate soil pollution by heavy metals could be expected at the site of a former painting and varnish facility, provided that no metallic paints had been produced.
Data Availability Statement
The raw data supporting the of this article will be made available by the authors, without undue reservation.
Author Contributions
MR wrote the draft manuscript. ŽĆ performed the soil sampling in the field. DM did the data processing and interpretation of multivariate analysis results. TB performed the sample pretreatment, microwave digestion of soil samples, and pH and moisture determination. JL did the measurements of the concentrations by an atomic absorption and UV/VIS spectrometer. SS worked on data processing and interpretation of results for the Geoaccumulation Index, the Pollution Load Index and the Potential Ecological Risk Index. AO defined the scope of research and wrote parts of the discussion and processing of results. All authors contributed to the article and approved the submitted version.
Funding
This work was supported by the Ministry of Education, Science and Technological Development of the Republic of Serbia (Contract No. 451-03-68/2020-14/200135).
Conflict of Interest
The authors declare that the research was conducted in the absence of any commercial or financial relationships that could be construed as a potential conflict of interest.
Supplementary Material
The Supplementary Material for this article can be found online at: https://www.frontiersin.org/articles/10.3389/fenvs.2020.560415/full#supplementary-material
References
Adimalla, N., Chen, J., and Qian, H. (2020). Spatial characteristics of heavy metal contamination and potential human health risk assessment of urban soils: A case study from an urban region of South India. Ecotoxicol. Environ. Saf. 194:110406. doi: 10.1016/j.ecoenv.2020.110406
Chen, B., Liu, K., Liu, Y., Qin, J., and Peng, Z. (2020). Source identification, spatial distribution pattern, risk assessment and influencing factors for soil heavy metal pollution in a high-tech industrial development zone in Central China. Hum. Ecol. Risk Assess. Int. J 49, 1–15. doi: 10.1080/10807039.2020.1739510
Cheng, W., Lei, S., Bian, Z., Zhao, Y., Li, Y., and Gan, Y. (2020). Geographic distribution of heavy metals and identification of their sources in soils near large, open-pit coal mines using positive matrix factorization. J. Hazard. Mater. 387:121666. doi: 10.1016/j.jhazmat.2019.121666
Dheeba, B., and Sampathkumar, P. (2012). Evaluation of heavy metal contamination in surface soil around industrial area, Tamil Nadu, India. Int. J. ChemTech Res. 4, 1229–1240.
Dobroshi, F., Mazrreku, A., Malollari, I., Dobroshi, K., and Maloku, F. (2019). Determination of heavy metals in the “ExtraColors” paint factory. Eur. J. Engin. Technol. 7, 28–33.
Dragović, R., Gajić, B., Dragović, S., Dordević, M., Dordević, M., Mihailović, N., et al. (2014). Assessment of the impact of geographical factors on the spatial distribution of heavy metals in soils around the steel production facility in Smederevo (Serbia). J. Clean. Prod. 84, 550–562. doi: 10.1016/j.jclepro.2014.03.060
Dutch Standards. (2000). The Circular on Target Values and Intervention Values for Soil Remediation. Netherlands: Ministry of Housing.
Egbueri, J. C., Ukah, B. U., Ubido, O. E., and Unigwe, C. O. (2020). A chemometric approach to source apportionment, ecological and health risk assessment of heavy metals in industrial soils from southwestern Nigeria. Int. J. Environ. Anal. Chem 98, 1–19. doi: 10.1080/03067319.2020.1769615
Ekpo, F. E., Ukpong, E. J., and Udoumoh, I. D. J. (2014). Bioaccumulations of Heavy Metals on Soil and Arable Crops Grown in Abandoned Peacock Paint Industry in Ikot Ekan, Etinan Local Government Area, Akwa Ibom State, Nigeria. Univers. J. Environ. Res. Technol. 4, 39–45.
Gan, Y., Huang, X., Li, S., Liu, N., Li, Y. C., Freidenreich, A., et al. (2019). Source quantification and potential risk of mercury, cadmium, arsenic, lead, and chromium in farmland soils of Yellow River Delta. J. Clean. Prod. 221, 98–107. doi: 10.1016/j.jclepro.2019.02.157
Gong, Y. (2010). “International experience in policy and regulatory frameworks for brownfield site management,” in Discussion Papers 57890, (Washington: The World Bank).
Hakanson, L. (1980). An ecological risk index for aquatic pollution control. A Sedimentol. Appr. Water Res. 14, 975–1001. doi: 10.1016/0043-1354(80)90143-8
Harvey, P. J., Rouillon, M., Dong, C., Ettler, V., Handley, H. K., Taylor, M. P., et al. (2017). Geochemical sources, forms and phases of soil contamination in an industrial city. Sci. Total Environ. 58, 505–514. doi: 10.1016/j.scitotenv.2017.01.053
Hu, H., Feng, Y. Z., Yang, Y., Wang, S. G., and Li, C. L. (2012). Vertical distribution and pollution characteristics of soil heavy metals in a relocation paint factory. Adv. Mater. Res. 610-613, 1718–1721. doi: 10.4028/www.scientific.net/AMR.610-613.1718
Inobeme, A., Ajai, A. I., Iyaka, Y. A., Ndamitso, M., and Uwem, B. (2014). Determination of physicochemical and heavy metal content of soil around paint industries in Kaduna. Int. J. Sci. Eng. Technol. 3, 221–225.
Jiang, H.-H., Cai, L.-M., Wen, H.-H., Hu, G.-C., Chen, L.-G., and Luo, J. (2020). An integrated approach to quantifying ecological and human health risks from different sources of soil heavy metals. Sci. Total Environ. 701:134466. doi: 10.1016/j.scitotenv.2019.134466
Jin, Z., and Lv, J. (2020). Integrated receptor models and multivariate geostatistical simulation for source apportionment of potentially toxic elements in soils. Catena 194, 104638. doi: 10.1016/j.catena.2020.104638
Jolly, Y. N., Hossain, A., Sattar, A., and Islam, A. (2012). Impact of heavy metals on water and soil environment of a paint industry. J. Bangladesh Chem. Soc. 25, 159–165. doi: 10.3329/jbcs.v25i2.15068
Khademi, H., Gabarrón, M., Abbaspour, A., Martínez-Martínez, S., Faz, A., and Acosta, J. A. (2019). Environmental impact assessment of industrial activities on heavy metals distribution in street dust and soil. Chemosphere 217, 695–705. doi: 10.1016/j.chemosphere.2018.11.045
Kim, R. Y., Yoon, J. K., Kim, T. S., Yang, J. E., Owens, G., and Kim, K. R. (2015). Bioavailability of heavy metals in soils, definitions and practical implementation - a critical review. Environ. Geochem. Hlth. 37, 1041–1061. doi: 10.1007/s10653-015-9695-y
Li, J., Wang, G., Liu, F., Cui, L., and Jiao, Y. (2020). Source Apportionment and Ecological-Health Risks Assessment of Heavy Metals in Topsoil Near a Factory, Central China. Berlin: Springer
Liang, J., Feng, C., Zeng, G., Gao, X., and Zhong, M. (2017). Spatial distribution and source identification of heavy metals in surface soils in a typical coal mine city. Lianyuan China. Environ. Pollut. 225, 681–690. doi: 10.1016/j.envpol.2017.03.057
Men, C., Liu, R., Xu, F., Wang, Q., Guo, L., and Shen, Z. (2018). Pollution characteristics, risk assessment, and source apportionment of heavy metals in road dust in Beijing. China. Sci. Total Environ. 612, 138–147. doi: 10.1016/j.scitotenv.2017.08.123
Mihailović, A., Budinski-Petković, L., Popov, S., Ninkov, J., Vasin, J., Ralević, N. M., et al. (2015). Spatial distribution of metals in urban soil of Novi Sad, Serbia, GIS based approach. J. Geochem. Explor. 150, 104–114. doi: 10.1016/j.gexplo.2014.12.017
Monged, M. H. E., Hassan, H. B., and El-Sayed, S. A. (2020). Spatial Distribution and Ecological Risk Assessment of Natural Radionuclides and Trace Elements in Agricultural Soil of Northeastern Nile Valley, Egypt. Water. Air. Soil Pollut 231:338. doi: 10.1007/s11270-020-04678-9
Norris, G. A., Duvall, R., Brown, S. G., and Bai, S. (2014). EPA/600/R-14/108 EPA Positive Matrix Factorization (PMF) 5.0 Fundamentals and User Guide. Washington: U.S. Environmental Protection Agency.
Nriagu, J. O., Bhattacharya, P., Mukherjee, A. B., Bundschuh, J., Zevenhoven, R., and Loeppert, R. H. (2007). Arsenic in soil and groundwater, an overview. Trace Met. Other Contam. Environ. 9, 3–60. doi: 10.1016/S1875-1121(06)09001-8
Nwajei, G. E., Okwagi, P., Nwajei, R. I., and Obi-Iyeke, G. E. (2012). Analytical Assessment of Trace Elements in Soils, Tomato Leaves and Fruits in the Vicinity of Paint Industry, Nigeria, Res. J. Recent Sci. 1, 22–26.
Official Gazette of Republic of Serbia. (2018). Rulebook on limit values of pollutants, harmful and hazardous substances in soil, Official Gazette of Republic of Serbia, No. 30/2018. New Delhi: Gazette of India.
Onjia, A. (2016). Chemometric approach to the experiment optimization and data evaluation in analytical chemistry. Serbia: Belgrade University, 143.
Paatero, P., and Tapper, U. (1994). Positive matrix factorization, A non-egative factor model with optimal utilization of error estimates of data values. Environmetrics 5, 111–126. doi: 10.1002/env.3170050203
Relić, D., Sakan, S., Andelković, I., Popović, A., and Dordević, D. (2019). Pollution and health risk assessments of potentially toxic elements in soil and sediment samples in a petrochemical industry and surrounding area. Molecules 24:2139. doi: 10.3390/molecules24112139
Roy, S., Gupta, S. K., Prakash, J., Habib, G., Baudh, K., and Nasr, M. (2019). Ecological and human health risk assessment of heavy metal contamination in road dust in the National Capital Territory (NCT) of Delhi. India. Environ. Sci. Pollut. Res. 26, 30413–30425. doi: 10.1007/s11356-019-06216-5
Saylak, D., and Conger, W. E. (1982). A Review of the State of the Art of Sulfur Asphalt Paving Technology. ACS Symp. Ser. 183, 155–193. doi: 10.1021/bk-1982-0183.ch011
Škrbić, B., Buljovèić, M., Jovanović, G., and Antić, I. (2018). Seasonal, spatial variations and risk assessment of heavy elements in street dust from Novi Sad. Serbia. Chemosp. 205, 452–462. doi: 10.1016/j.chemosphere.2018.04.124
Slavković, L., Škrbić, B., Miljević, N., and Onjia, A. (2004). Principal component analysis of trace elements in industrial soils. Environ. Chem. Lett. 2, 105–108. doi: 10.1007/s10311-004-007378
Spahić, M. P., Manojlović, D., Tanèić, P., Cvetković, Ž, Nikić, Z., Kovaèević, R., et al. (2019). Environmental impact of industrial and agricultural activities to the trace element content in soil of Srem (Serbia). Environ. Monit. Assess 191, 1–22. doi: 10.1007/s10661-019-7268-8
Taylor, S. R., and McLennan, S. M. (1995). The geochemical evolution of the continental crust. Rev. Geophys. 33, 241–265.
Tomlinson, D. L., Wilson, J. G., Harris, C. R., and Jeffrey, D. W. (1980). Problems in the assessment of heavy metal level in eastuaries and the formation of a pollution index. Helol. Mees. 33, 566–575. doi: 10.1007/BF02414780
Udosen, E., Akpan, E., and Sam, S. (2016). Levels of some heavy Metals in Cocoyam (Colocasia esculentum) grown on soil receiving Effluent from a Paint Industry. J. Appl. Sci. Environ. Manag. 20:215. doi: 10.4314/jasem.v20i1.26
Wcisło, E., Bronder, J., Bubak, A., Rodríguez-Valdés, E., and Gallego, J. L. R. (2016). Human health risk assessment in restoring safe and productive use of abandoned contaminated sites. Environ. Int. 94, 436–448. doi: 10.1016/j.envint.2016.05.028
William, M., and Haynes. (2017). CRC Handbook of Chemistry, and Physics, 97th edition (2016-2017)Abundance of elements in the earth’s crust and in the sea. Florida: CRC Press, 14–17.
Xie, T., Wang, M., Chen, W., and Uwizeyimana, H. (2019). Impacts of urbanization and landscape patterns on the accumulation of heavy metals in soils in residential areas in Beijing. J. Soils Sedim. 19, 148–158. doi: 10.1007/s11368-018-2011-6
Yadav, I. C., Devi, N. L., Singh, V. K., Li, J., and Zhang, G. (2019). Spatial distribution, source analysis, and health risk assessment of heavy metals contamination in house dust and surface soil from four major cities of Nepal. Chemosphere 218, 1100–1113. doi: 10.1016/j.chemosphere.2018.11.202
Yan, F., Yan, J., Wang, Y., and Chen, D. (2008). Site environmental assessment to an old paint factory in China. Environ. Monit. Assess. 139, 93–106. doi: 10.1007/s10661-007-9818-8
Keywords: trace elements, enrichment, geoaccumulation, PCA, GIS, PMF
Citation: Radomirović M, Ćirović Ž, Maksin D, Bakić T, Lukić J, Stanković S and Onjia A (2020) Ecological Risk Assessment of Heavy Metals in the Soil at a Former Painting Industry Facility. Front. Environ. Sci. 8:560415. doi: 10.3389/fenvs.2020.560415
Received: 08 May 2020; Accepted: 04 September 2020;
Published: 25 September 2020.
Edited by:
Bernardo Duarte, Center for Marine and Environmental Sciences (MARE), PortugalReviewed by:
Lucienne R. D. Human, South African Environmental Observation Network, South AfricaMiguel Caetano, Portuguese Institute of Ocean and Atmosphere (IPMA), Portugal
Copyright © 2020 Radomirović, Ćirović, Maksin, Bakić, Lukić, Stanković and Onjia. This is an open-access article distributed under the terms of the Creative Commons Attribution License (CC BY). The use, distribution or reproduction in other forums is permitted, provided the original author(s) and the copyright owner(s) are credited and that the original publication in this journal is cited, in accordance with accepted academic practice. No use, distribution or reproduction is permitted which does not comply with these terms.
*Correspondence: Antonije Onjia, onjia@tmf.bg.ac.rs