
Abstract
The crisis caused by the COVID-19 virus has far-reaching effects in the field of education, as schools were closed in March 2020 in many countries around the world. In this article, we present and discuss the School Barometer, a fast survey (in terms of reaction time, time to answer and dissemination time) that was conducted in Germany, Austria and Switzerland during the early weeks of the school lockdown to assess and evaluate the current school situation caused by COVID-19. Later, the School Barometer was extended to an international survey, and some countries conducted the survey in their own languages. In Germany, Austria and Switzerland, 7116 persons participated in the German language version: 2222 parents, 2152 students, 1949 school staff, 655 school leaders, 58 school authority and 80 members of the school support system. The aim was to gather, analyse and present data in an exploratory way to inform policy, practice and further research. In this article, we present some exemplary first results and possible implications for policy, practice and research. Furthermore, we reflect on the strengths and limitations of the School Barometer and fast surveys as well as the methodological options for data collection and analysis when using a short monitoring survey approach. Specifically, we discuss the methodological challenges associated with survey data of this kind, including challenges related to hypothesis testing, the testing of causal effects and approaches to ensure reliability and validity. By doing this, we reflect on issues of assessment, evaluation and accountability in times of crisis.
1 Introduction
The crisis caused by the COVID-19 virus has far-reaching effects in nearly all social areas, including education. Indeed, schools were closed in March 2020 in nearly all countries in the world. In Germany, Austria and Switzerland, they were closed in mid-March. Due to the type of federal governance of education in Germany and Switzerland, different states or regions have proceeded quite differently (e.g. regarding holiday regulations, different ways of tutoring/caring, the presence of staff at schools and instructional arrangements). However, there are also common measures in all three countries. For example, in the first phase of the school lockdown, educators were allowed only to repeat content that had already been taught. Teaching of new content was not intended. During the course of the school lockdown, however, this has changed and new curriculum content has been delivered.
In the context of this new and challenging situation of digital learning caused by the COVID-19 school lockdown, information must be provided instantly to inform education policy and practice. Some countries have had natural catastrophes (e.g. earthquakes or floods) that caused regional school lookdowns, but these did not necessarily lead to digital learning for an uncertain number of weeks. As many countries have not yet experienced a pandemic that caused a social crisis and a subsequent school lockdown, there is limited knowledge about how to deal with the current situation and the challenges that arise from digital learning in this context.
Different actors at various levels of the education system have different responsibilities. Research could and should contribute to the current debate about schooling by providing relevant information from its knowledge base and generating new knowledge where needed and when possible. Some of this information is needed quickly. There are different questions and problems at the policy and practice levels about digital learning settings, crisis management and health procedures, to name but a few issues. Various needs are linked to pre-existing knowledge that is derived from and applied to different contexts or situations. However, of course, existing knowledge needs to be translated to the current context and the actual situation, as contextual and situational features vary between countries, regions, schools and classes. Furthermore, as this is a new situation, additional and differentiated information about the current situation is needed.
New research, assessments and evaluations can generate new information about the current situation, ideally from different actors’ perspectives. Depending on the aim and design of a survey, different views on different aspects of the situation under study as well as different forms of data (i.e. qualitative and quantitative) can be collected. Moreover, different analysis strategies can be applied to extend the existing knowledge base. Different data practices help to better understand certain phenomena and consequently to better inform decision-making processes, policy development and implementation as well as practices at various levels in the school system. In line with the slogan form follows function, the design of a fast survey in times of crisis must be based on its purpose.
A review of the so-called barometer surveys reveals that many such surveys have been conducted with different aims, topics, lengths, data collection procedures, data analysis strategies and methods and scopes. In general, they tend to be shorter and follow a repeated cross-sectional approach; very few have a panel component. Examples of topics are medicine, pharmacy, economy, security, conflict and inequality (for a possible classification of surveys, see Stoop and Harrison 2012; Gideon 2012).
We define barometer surveys as having the following characteristics:
-
Social phenomenon: Barometer surveys are intended to assess and evaluate a current social phenomenon (e.g. the COVID-19 crisis) or perceptions and opinions related to the situation. Thus, they cover a specific topic; they do not necessarily assess or evaluate institutions, programmes or persons, but the conditions and practices of a specific context or situation.
-
Relevance for action: The central aim is to provide action-relevant information to specific target groups (e.g. educational policy-makers, school administrators, teachers, parents and students).
-
Fast: Information about the subject of investigation is collected and provided as quickly as possible to allow the target groups with timely options for data-informed actions.
-
Multi-perspectivity: In order to serve the heterogeneous informational needs of different target groups, the surveys should include several actor groups. Obtaining multiple perspectives on a phenomenon helps to describe the phenomenon in a more differentiated way. Since social phenomena are often of international significance, and country-comparative analyses provide important information for the central target groups (e.g. education policy), hence, international comparative barometer surveys are desirable.
The surveys we reviewed, which are referred to as barometer surveys, do not necessarily fulfil this definition. However, all surveys labelled as barometers state that the information they provide is of relevance to society.
The core purpose of this journal, EAEA (Educational Assessment, Evaluation and Accountability), is to critically discuss research on and about evaluation, assessment and accountability of all kinds (e.g. person, programme, organisation) at various levels (i.e. state, regional, local) in all fields of education, connecting research, policy-making and practice. Therefore, the journal explores and discusses theories, function, role, aims and purpose, relevance, impact, methodology, design and methods and quality issues related to evaluation, assessment and accountability. With this article, we want to contribute to these efforts by examining a fast survey that collected data in a time of crisis. This article has two aims. First, it examines how a short monitoring survey intended to gather data from multiple actors can contribute to evaluating the current school situation caused by COVID-19 and providing information for decision-making. Second, it discusses the methodological options for data collection and analysis as well as the strengths and limitations of using a short descriptive monitoring survey approach.
The structure of the article is as follows. Sections 2 and 3 are dedicated to addressing the first aim of the article to introduce the School Barometer (see Huber et al. 2020) and its exemplary findings. Section 4 focuses on the second aim to critically reflect on the School Barometer and engage in a methodological discussion of monitoring surveys in general. In Section 2, we present the aims, theoretical framework and design of the School Barometer, and in Section 3, we report selected findings from the School Barometer and derive potential implications for policy and practice for each finding. In Section 4, we comprehensively reflect on monitoring surveys in three steps: First, we discuss the advantages and limitations of the School Barometer. Second, we provide a review of other barometer surveys that focus on digital learning due to COVID-19. Third, we engage in a comprehensive methodological discussion of the limitations of barometer or monitoring surveys; in line with central questions related to data collection and analysis, we discuss where it is possible to adhere to scientific quality criteria when conducting a barometer survey, where this is not possible. Finally, in Section 5, we look ahead, presenting the potential of the School Barometer for further analyses and studies or surveys.
2 Aims and design of the school barometer
2.1 Aims
The aim of the School Barometer is to nationally and internationally monitor the current school situation in Germany, Austria and Switzerland by collecting the perspectives of various actors (i.e. parents, students, school staff, school leadership, school authority, school support system). In doing so, it aims to contribute to an evidence-based or data-informed discussion within and between persons (e.g. teachers, parents, politicians), institutions (e.g. schools, school authorities) and disciplines (e.g. education, policy).
To ensure that it engages in responsible science—described within the EU context as responsible research and innovation, which includes responsible leadership with analytic, morale, cooperative and systematic adjustment perspectives (Maak and Pless 2006; Stone-Johnson 2013; Huber 2020)—academia has a responsibility to share and generate knowledge that is of relevance to those who have to make decisions, and those who are in the midst of complex actions and, we argue, particularly in times of crisis. The task of responsible science is to translate challenges in society to research and translate or relate research to policy and practice. Today, such research can help to describe the COVID-19 crisis and analyse its consequences on schools and education. It also has the responsibility to develop conclusions and possible implications of actions by different actors, such as actions related to policy, practice and, of course, further research. As the School Barometer was planned as a fast survey, and thus the instrument was developed in 1 week, data were collected over 2 weeks and the findings were disseminated as quickly as possible, the first report already after 1 week, the third report as open-access book publication after less than 3 weeks, some kind of communication strategy to reach out to all the different groups was needed. This approach reflects a contribution to support constructive news (Haagerup 2017) in media to the public.
However, we note that this implies tensions, conflicts or dilemmas. Different systems operate with different systems of grammar, including ethics, regulations, expectations, standards and language (terminus technicus) to name but a few. The domain of research has certain standards, as does the domain of evaluation and assessment (and these standards may differ between organisations; see, e.g. https://europeanevaluation.org/resources/evaluation-standards), with professional agreement and discourse. Domains and communities of policy and practice also have certain expectations and needs for action. This raises a question: is it possible to integrate different kinds of standards and expectations from different communities? We argue that it is part of responsible science to be transparent regarding methodology and be careful to avoid oversimplification and misinterpretation of findings and to deal transparently with the dilemma between a fast survey and slow research. This is a common professional understanding in all the domains stated above, particularly research.
2.2 Theoretical framework
The School Barometer survey covers the following topicsFootnote 1:
-
Information flow and information provision from policies, school authorities, schools, school leadership and teachers
-
Reactions to the school lockdown caused by the COVID-19 crisis
-
Perceived stress due to the COVID-19 crisis
-
Students’ current situations at home
-
Care and tutoring for students during the school lockdown by parents and school staff
-
Digital teaching and learning, including demands, resources and practices
-
The role of school leadership and collaboration
-
The roles, motivations and competences of school staff
-
The demands, expectations and wishes of and for parents, students, school staff, school leadership, school authorities and the school support system
They are derived from theoretical and empirical perspectives within the disciplines of:
-
School effectiveness (Teddlie & Stringfield 2007; Calman 2010; Creemers et al. 2010; Chapman et al. 2012; Moos and Huber 2007; Huber et al. 2014),
-
School improvement (Hargreaves et al. 1998/2014; Hopkins et al. 2011; Harris et al. 2006; Huber 2018),
-
Input-throughput-output (Cronbach 1972a, b; Ditton 2002a, b),
-
Collaboration (Rosenholtz 1989; West and Hirst 2003; Muijs et al. 2010; Harris and Jones 2012; Huber and Ahlgrimm 2012; Huber 2014),
-
Education leadership (Robinson et al. 2008; Huber 2016a, b; Huber and Muijs 2010; Hallinger and Huber 2012; Huber and Spillane 2018; Tian and Huber 2019),
-
Management of crises (Weick 1988, 2010; Schneider 1995; Rosenthal and Kouzmin 1993, 1997; Pearson, Pearson et al. 2007; Johansen et al. 2012; Vardarlier 2016),
-
Health/strain/stress (Karasek 1979; Robert and Karasek 1979; Lazarus and Folkman 1984; Huber 2013) and
-
Job demands and resources (Bakker and Demerouti 2017; Huber and Robinson 2016; Huber and Spillane 2016).
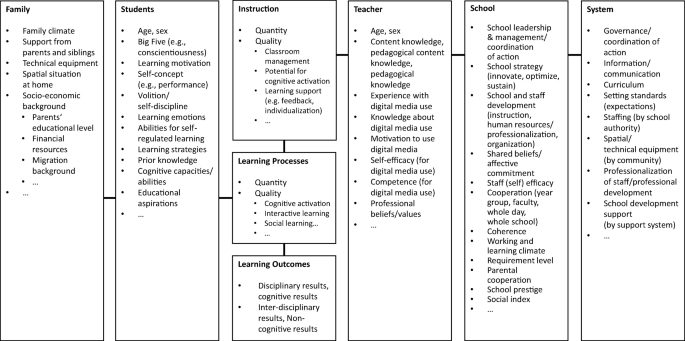
Figure 1 shows the theoretical framework of the School Barometer based on these disciplines, figure 2 shows some of the variables of the School Barometer. To illustrate how items (i.e. questions and statements) for the survey were derived from theory, we provide an example for the topic of teaching and learning/instructional quality during the school lockdown. Items assessing the teaching and learning dimension were based on common models of instructional quality (Klieme et al. 2009) and teachers’ professional competence (Baumert et al. 2010). According to the framework developed by Klieme and colleagues, instructional quality can be considered to consist of three basic dimensions: classroom management, cognitive activation and constructive learning support.
Theoretical framework
Variables in the School Barometer (not complete list; S students, P parents, ST staff, SL school leaders, A authority, Sy system)
Classroom management refers to teachers’ ability to lead learners in a way that maximises the instructional time devoted to meaningful learning. To ensure a high share of learning time, teachers may use instructional strategies that prevent student misbehaviour caused by boredom, overload, disorientation, difficulties in understanding, negative emotions and so on. Meta-analyses have repeatedly identified classroom management as one of the strongest instructional predictors of student academic achievement (e.g. Hattie 2009). COVID-19 has largely eliminated the teacher’s control over active learning time, instead bringing students’ self-regulatory, volitional and motivational abilities as well as parents’ control over learning time to the fore. For this reason, the School Barometer asked students not only about the amount of learning time they invest but also about indicators of self-regulation and volitional abilities (e.g. I find it easy to get up early and have a regular schedule; The most challenging part of school lockdown is planning my day for myself). In addition, students were asked about the extent to which their parents and teachers reviewed their completed learning tasks.
Cognitive activation is a pedagogical practice ‘that encourages students to engage in (co-) constructive and reflective higher-level thinking and thus to develop an elaborated, content-related knowledge base’ (Klieme et al. 2009, pp. 140–141). When assessing cognitive activation, a broad range of instructional strategies are usually applied by the used instruments. However, the central instructional strategies link instruction to students’ prior knowledge and engage students in reflecting solutions and the learning process, such as by providing feedback. Based on these considerations, the School Barometer included items such as Our knowledge level is taken into account in the learning/teaching tasks assigned to us by the teachers (for students), Students are provided with access to individual coaching sessions with their class teacher/counsellor on a weekly basis (for teachers) and I receive individual advice from the teachers about the tasks I have completed (for students).
Constructive learning support is defined in different ways in the literature on instructional quality. Klieme et al. (2009), for instance, define it as psychological need support, including all measures that aim to achieve a caring and motivating learning environment. In this regard, the School Barometer includes items that ask about the extent to which students have access to teachers’ individual support and whether students can come to their teachers with concerns during the school lockdown (e.g. I can always ask my teachers if I am having trouble understanding the tasks; I can express my concerns and problems with my school/my class teacher and I am taken seriously).
Since these three basic dimensions refer to school settings, further quality characteristics are relevant to digital learning due to COVID-19 too. The literature on distance and online learning (e.g. Margaryan et al. 2015; Larmuseau et al. 2019) refers to Merrill’s First Principles of Instruction for online learning environments to describe how distance learning functions: authentic problems, activation, demonstration, application and integration. These principles belong to the dimension of cognitive activation, which is presented above.
In addition, the literature emphasises the importance of technical equipment for quality online learning (Hawkes 1996) as well as the importance of acceptance and students’ self-concept regarding digital media (e.g. Artino 2008; Larmuseau et al. 2019). Based on this background, the School Barometer includes several items that ask about technical resources at both school and home (e.g. Our school has sufficient resources for digital forms of teaching and learning; I have enough opportunities to work on the computer/laptop/tablet for school). In addition, pupils’ acceptance of new learning methods was determined with items like I am looking forward to new ways of learning (e.g. e-learning).
2.3 Design
The School Barometer was constructed in the first week of the school shutdown. It initially existed in German, English and French and later in other languages, too, like Russian for example. The first results with the German version conducted in Germany, Austria and Switzerland were provided 2 weeks after the start of the school shutdown (see the timeline below).
The timeline for the implementation of the School Barometer is as follows:
-
Launch of the School Barometer: 13.03.2020
-
Development of questionnaires: 16–20.03.2020
-
Programming and piloting: 21–23.03.2020
-
Survey (first round): 24–29.03.2020
-
1st report (with data from the first round): 26.03.2020
-
Dissemination of report via systematic emails: 26.03.2020
-
Survey (second round): 30.03–05.04.2020
-
2nd report (with data from both rounds): 09.04.2020
-
Dissemination of report via systematic emails: 09.04.2020
-
3rd report with further results: 17.04.2020
-
Open-access book publication: 24.04.2020
-
Dissemination of publications via systematic emails: 25.04.2020
Depending on the group of people surveyed, the School Barometer comprises between 27 (school authorities) and 61 (students) closed questionnaire items. A number of items were administered to all surveyed groups, such as those concerning the experience of stress due to the COVID-19 situation, the digital competence and motivation of teachers and students’ enjoyment of other/new learning methods. In order to keep the length of the online survey as short as possible, the study variables were recorded with only one item each. The answer format of the items depended on the item and was chosen to achieve the best possible fit with the item’s content. In most cases, a 5-point Likert scale (strongly disagree, disagree, neither agree nor disagree, agree, strongly agree) was most appropriate.
Altogether, the School Barometer comprises around 32 open items related to the topics mentioned above. The student barometer includes 13 open items, while the school staff barometer includes 22 such items. For analysis of the qualitative data, a two-level system for categorising deductive and inductive codes was developed and applied. Quantitative analyses of the codes have not yet been conducted. As we do not present qualitative data in this article, we will not elaborate on the qualitative work. However, we want to emphasise that qualitative approaches are very important in exploratory studies; they help to provide a better understanding of the current situation, and they illuminate quantitative findings. Hence, they can be used in an explanatory and explanative mixed method approach. Moreover, through analysis, it is possible to identify further topics for investigation.
This article mostly reports descriptive results, except for the results of a multiple group analysis for which we also use logistic regression coefficients and Cohen’s d. The descriptive results take the form of the relative frequencies of participants’ chosen response options, and they are presented both in the text and in numerous illustrations. Differences between subgroups of the sample (e.g. countries) are analysed. Specifically, the effect size of Cohen’s d is reported. In addition, logistic regression was conducted to estimate the probability of belonging to certain extreme groups (e.g. students who spend a lot of time each week on school matters vs. students who spend very little time each week on school matters).
The School Barometer was launched as an online survey via the Unipark software program. Different versions were adopted for different groups of actors. A link to the questionnaire was sent via email to school leaders and school authority officials in Germany, Austria and Switzerland with a request to forward it to school staff, students and parents. Emails were also sent to teacher associations, school leadership associations and parent associations with requests to forward the link to the appropriate groups. Participation was voluntary.
The analyses conducted for this this article draw upon data collected from the 24th of March to the 5th of April 2020 in the German-speaking countries of Germany, Austria and Switzerland with the German language version of the School Barometer. As of the 5th of April, the sample comprised of 7116 participants (see Table 1). The number of participants who dropped out while answering the survey varies from 23% (school staff) to 10% (students) for different groups. There was no single item that made a particularly strong contribution to the dropout rate.
It should be noted that the sample is ad hoc in nature and cannot be regarded as a random sample of the population of any of the surveyed groups. For these reasons, it is important to elaborate on the profile of the different samples of the School Barometer as needed to interpret the first exemplary findings reported in this article:
-
Parents: Parents from cities (57%) dominate the sample. However, in contrast to the student sample, 37% of parents with children in primary and lower secondary school took part in the survey. These school levels accounted for only 5% of the sample of students.
-
Students: As 39% of students are at the secondary level and 31% of students are enrolled in vocational schools, these groups are clearly over-represented. Similarly, students aged 15–17 years (42%) and 18–20 years (26%) are also clearly overrepresented. As to the age, 13% are 6–12 years old, 32% are 13–15 years old and 55% are 16–20 years old.
-
School staff: The school staff are distributed according to school level as follows: 5% from kindergartens, 24% from primary schools, 35% from lower secondary schools, 21% from upper secondary schools, 11% from vocational schools and 5% from other schools. School staff from urban schools (55%) are much more represented than those from schools in rural areas (31%). Fourteen percent work in suburban areas. In total, 42% of the school staff come from Germany, 45% from Austria and 13% from Switzerland. In addition, 11% and 9% of the school staff indicated that they actively participate in conferences or steering groups, respectively. The school staff is composed of 86% teachers, 9% special education staff, 2% social education specialists and around 2% educators who are involved in whole-day schooling.
-
School leadership: The school leaders are distributed by school level as follows: 12% from kindergartens, 37% from primary schools, 32% from lower secondary schools, 12% from upper secondary schools, 5% from vocational schools and 4% from other schools. The proportions of school leaders from urban (46%) and rural schools (43%) are roughly equal (11% from suburban schools). In total, 44% of school leaders come from Germany, 34% come from Austria and 22% come from Switzerland. Fourteen percent stated that they also work as teachers.
3 Exemplary findings of the school barometer that inform policy, practice and research
We selected exemplary findings to demonstrate the spectrum of findings and some initial possibilities for data analysis. They highlight the potential of an exploratory survey that aims to provide initial insights into the current situation and inform the work of policy and practice as well as to develop further research. We deviate from the usual method of presenting results in two ways: First, immediately after each analysis, we present the conclusion and potential implications of the findings. Second, we report the findings of exploratory (multiple-group) analyses to evaluate how digital learning due to COVID-19 works in different groups and different countries. To this end, we explicitly follow an exploratory approach; that is, we do not have any a priori assumptions or hypotheses regarding the analyses presented. The use of quantitative data for exploratory purposes and analyses is justified by the fact that there is little extant research on digital teaching and learning due to COVID-19. We believe that this approach meets the aim of the School Barometer to serve the heterogeneous information needs of policy and practice.
3.1 Differences between students
Students’ weekly learning effort
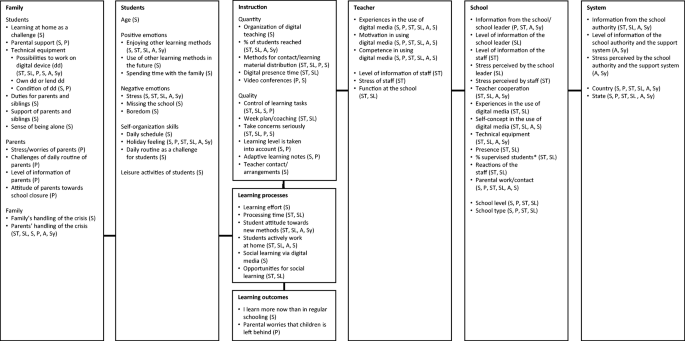
Students were asked to report the number of hours they spent each week on school matters. Eighteen percent of students reported low effort (i.e. less than 9 h per week). Assuming a study week of 5 days, this corresponds to less than 2 h a day spent on academic matters. In contrast, 31% of students reported engaging in learning tasks and work for school for 25 h or more per week (see Fig. 3).

Students’ weekly effort for school matters (N = 2.063)
To find out more about what distinguishes diligent students from less diligent students during the COVID-19 period, we investigated the following question: How do the 18% of students who report learning and doing schoolwork for nine hours or less per week differ from the 31% of students who report learning and doing schoolwork for 25 hours or more per week?
In order to compare the two extreme groups, differences in mean values were analysed (Cohen’s d). In addition, bivariate logistic regressions were calculated to determine the probabilities of students belonging to a particular group when they fully agreed or disagreed with a statement.
Table 2 shows the statements that are significantly related to the statement I currently spend … hours per week on learning and school tasks. The results show that the statement Currently, I feel like I am on vacation resulted in the greatest separation between the two groups; students who completely disagreed with this statement were almost five times more likely (80% vs. 17%) to belong to the group of students who study and do schoolwork for 25 h or more per week (Cohen’s d, 0.89) than students who completely agreed with this statement. In addition, students were more likely to belong to the group that spends 25 h or more a week on learning and school tasks if:
-
They thought that they currently learn more now than in traditional classes,
-
They felt that it is easy for them to get up early and have a regular daily routine,
-
They spent a lot of time doing sports at home,
-
They indicated that their teachers regularly monitor learning tasks and
-
They felt that it is not a challenge for them to plan the day themselves.
For example, students who reported that it is easy for them to get up in the morning were 1.73 times more likely (78% vs. 45%) to belong to the group of students who reported that they learn or do schoolwork for 25 h or more per week compared with students who reported that it is not easy for them to get up in the morning.
Conclusion
A substantial proportion of students reported a worryingly low level of learning at home during the school lockdown (2 h or less per day). In contrast, just under a third of students reported a relatively high level of learning commitment (5 h or more per day). An analysis conducted to characterise these two student groups indicates that conscientious students—who self-regulate their planning for the day, get up early, have a regular schedule, do not feel like they are on holiday and do sports regularly—are more likely to be hard-working (in terms of the weekly hours spent on academic matters). Also, it seems that, when teachers regularly control students’ work, students are more engaged in learning at home.
Potential implications for policy, practice and further research
Digital learning due to the school lockdown requires self-regulatory skills from the students. The question therefore arises as to how can the motivational and volitional competences of self-directed learning be supported and promoted? It is clear that personality traits, such as conscientiousness, and work virtues, such as diligence, are quite stable individual constructs. However, prior studies (e.g. Datu 2017; Eskreis-Winkler et al. 2014; Strayhorn 2014) have proven that a caring educational style, in which parents, peers and teachers support students’ basic psychological needs for autonomy, competence experience and social integration, is positively related to volitional competence, including persistence and perseverance. In addition, based on Bandura’s theory of self-efficacy, Strayhorn 2014, argues that volitional competences are fostered by situations in which children can observe individuals who show perseverance and persistence when problems and challenges arise. In sum, the social context seems to be important for the development of volitional competences, especially when it offers role models, contacts/networks and mentors that support students in setting challenging but realistic long-term goals (Kundu 2017). These findings, in combination with the results of the School Barometer, clearly show that a significant proportion of students may need coaching regarding lifestyle/day-to-day management. Teachers and non-teaching staff at schools have a particular responsibility for these students, independent of COVID-19. However, in addition to the physical distance and limited opportunities to reach out and connect, school staff face multiple challenges in these families (as, e.g. less motivation, competences, resources). To compensate for these deficits, schools need to put extra efforts toward those children to prevent the learning activity and achievement gap from getting bigger. Positive discrimination in time spent based on individuals’ capabilities is one solution at the individual practitioner level, while collegially supporting each other within the school seems to be crucial at the work unit or organisation level. In addition, supporting those schools with a particular burden because they have relatively more children who are disconnected or disadvantaged in this way is a professional responsibility at the levels of the school network, the district/region and state.
Policy and resource allocation need to support the practices that are desired and needed. Research can provide ideas and share knowledge as well as develop new knowledge, such as by investigating innovations that occur in practice. As we see in the qualitative data, some schools are developing specific task groups, for instance, small groups of students supported by tandems of teachers, regular online live instruction and delivery services to provide printed material to individual students who have no or insufficient technical resources, like laptops or printers.
3.2 Differences between countries
3.2.1 Technical capacities for digital instruction
To assess the technical capacities for digital teaching at a school, school leaders (N item 1/item 2 = Germany (GER), 228/231; Austria (AUT), 181/184; Switzerland (CH), 114/113) and school staff (N item 1/ item 2 = GER, 588/606; AUT, 634/651; CH, 174/190) were asked to rate the following two items: The technical capacities at the school are sufficient/appropriate for web-based formats (item 1) and Our school has sufficient/appropriate resources for digital teaching and learning (item 2).
According to reports from school leaders, significantly more resources and technical capacities for digital teaching are available in Switzerland than in Austria (item 1: d = 0.64; item 2: d = 0.40) or Germany (item 1: d = 1.29; item 2: d = 1.11). However, Austrian school leaders report significantly higher technical capacities than German school leaders (item 1: d = 0.55; item 2: d = 0.65). While the differences between Switzerland and Germany can be described as large, all other country differences are medium.
Reports from school staff confirm the findings from school leadership perspective: significantly fewer resources and technical capacities are available for digital teaching in Germany than in Austria (item 1: d = 0.77; item 2: d = 0.84) and Switzerland (item 1: d = 0.82; item 2: d = 0.77). Figure 4 illustrates country differences with regard to the first item, as reported by school staff.

Technical capacities for web-based formats by country (N = GER, 588; AUT, 634; CH, 174)
In Switzerland, according to information from school leaders, significantly more online platforms are used to provide or control tasks (81% and 82% respectively; Austria 57% and 58%, medium effects; Germany 43% and 43%, large effects).
Conclusion
Various indicators from multiple informants (school leaders and school staff) indicate that technical resources and digital lessons are less available in Germany than in Austria and Switzerland. Since we do not know the extent to which the current sample is representative of the population of school leaders and school staff in the three countries, we caution readers not to overinterpret these findings, as they might be subject to sampling bias.
Potential implications for policy, practice and further research
Schools must be provided with both financial and material resources to improve their technical equipment and personnel resources (by continuous professional development of staff to develop digital competences). Some state and federal initiatives related to this exist independent of COVID-19. However, certain administrative bureaucratic barriers do not allow easy access to these resources, even in crises like this. Thus, action is needed at all policy levels. Our results highlight ideas to prioritise. In addition, the exchange of experiences and know-how in digital teaching and learning must be supported by establishing platforms and initiating knowledge management systems. Through collaborative arrangements within schools, particularly within year and subject groups, approaches of coherent action for digital teaching and learning can be developed. Policy can support professional practice, and promising practices should be shared through human resource mechanisms. Professional development promotes quality in practice, leading to differences in short- and long-term action. Research should investigate innovative approaches and monitor where the data allows for a longitudinal design to examine what works in a certain period of time and differences in costs and impact.
3.2.2 Teacher competencies
To assess teachers’ digital competencies, school staff (N item 1/item 2 = GER, 608/602; AUT, 656/655; CH, 192/193) was asked to rate the following item: The teachers are competent in the use of digital forms of teaching and learning.
Compared with staff from Austria and Switzerland, school staff from Germany consider themselves to be significantly less competent in digital forms of teaching and learning (0.56 ≤ d ≤ 0.64). Further analyses show that school staff members’ reports on the technical capacities of their school for digital teaching are strongly linked to their self-reported competencies related to digital teaching (capacities for web-based formats: r = 0.370, p < 0.001; resources for digital teaching: r = 0.512, p < 0.001).
Conclusion
On average, school staff rated teachers’ competencies related to the use of digital instructional formats as mediocre. When looking at country differences, Swiss and Austrian teachers seem to outperform German teachers. Again, we caution against overinterpreting these differences, given the limited knowledge about the representativeness of the sample. A more interesting finding is that self-ratings of teachers’ competencies are linked to technical resources at the schools. This suggests that teachers start to engage in digital teaching when appropriate technical resources are offered and teachers are more likely to claim to have appropriate technical equipment if they are competent in the use of digital instructional formats.
Potential implications for policy, practice and further research
The professional development of staffs’ digital competences could be intensified in the long term. Learning can be sustained and well connected with pre-established instructional routines. Schools can develop strategies for professional development and professional practice in the context of minimum and regular standards for digital teaching and learning. Research can investigate strategies and practices as well as the development of competences for digital environments.
3.2.3 Feedback and individual coaching
According to school leaders (N = GER, 233; AUT, 184; CH, 113) and school staff (N = GER, 603; AUT, 666; CH, 194), students’ learning tasks are checked significantly more often in Austria than in Germany and Switzerland (0.51 ≤ d ≤ 1.16).
School leaders (N = GER, 233; AUT, 184; CH, 113) and school staff (N = GER, 603; AUT, 666; CH, 194) in Switzerland agreed significantly more often with the statement Students have individual coaching with the class teacher at least once a week compared with their Austrian (school leader: d = 0.64; school staff: d = 0.50) and German counterparts (school leader: d = 1.17; school staff: d = 1.12). Compared with Austria, the agreement in Germany was significantly lower (school leader: d = 0.53; school staff: d = 0.57).
Conclusion
Feedback on learning assignments and individual learning support is considered a central feature of instructional quality (Hattie 2009; Kunter et al. 2013). According to the statements of school leaders, school staff and students, the dimensions of instructional quality seem to be more pronounced in Switzerland and Austria than in Germany. One possible reason for this may be the diminished/missing technical infrastructure for digital learning, which was criticised by the surveyed groups, in Germany compared with the other two countries. Among teachers, for example, the reported level of technical capacities for digital teaching shows a significant positive correlation with the level of learning task control and individual coaching (capacities for web-based formats: r = 0.312 and 0.217, p < 0.001 and 0.001; resources for digital teaching: r = 0.323 and 0.235, p < 0.001 and 0.001).
Potential implications for policy, practice and further research
Feedback is important for all learning settings, and thus, it is important to implement it in digital learning settings. Students must receive feedback on homework from their teachers. Regular monitoring over the learning progress and formative feedback could be implemented by schools as a minimum standard. Research could investigate the differences in digital learning settings and how digital learning can be promoted through and with technology, such as computerised adaptive testing, further developing the existing body of research to cover the current situation.
3.3 Further results regarding collaboration and experienced stress
3.3.1 Teacher collaboration
The statement There is a high level of mutual support within the school is seen more positively by the school leaders (N = 571) than by the school staff (N = 1.656), representatives of the school authority (N = 32) and members of the school support systems (N = 98). The majority of school leaders (57%) chose the highest category (strongly agree), and 35% chose the second-highest category (agree). About one-third of the other groups chose the two highest categories.
The statements There was a professional discourse within the school in order to develop the right strategy for school and teaching operations in the next few weeks, In the school, we have jointly prepared documents for digital forms of teaching and learning and We are currently working on concepts for school development within the school were assessed very differently within all groups, particularly within the school staff group (see Fig. 5). For instance, for the first statement, the proportions of school staff were very similar for all but the category strongly agree (between 16 and 22%). The third statement was also viewed very differently by the school staff, as all categories were chosen to similar extents (15 to 24%). In the other groups, however, the distribution of responses across the answer categories is less even. For instance, with regard to the third statement, representatives of the school authority most frequently (37%) chose the category neither agree nor disagree. The most positive assessments were made by the school leaders; almost exactly half of them (strongly) agreed with the third statement, while 30% (strongly) disagreed.

Collaboration among the school staff (N = 1.613–1.656)
Conclusion
Teacher collaboration is regarded as a dimension of school quality and as vital for teacher and school development (Huber and Ahlgrimm 2012). Particularly in times of crisis, such as the COVID-19 pandemic, it can be assumed that schools with a supportive culture of collaboration will be more likely to master current challenges, like the organisation of digital instruction. Significant positive correlations between the collaboration statements and self-assessments concerning the implementation of digital forms of teaching and learning (It is easy for us to design teaching–learning arrangements/learning processes with digital media in the current situation) support this assumption (mutual support: r = 0.205, p < 0.001; professional discourse: r = 0.233, p < 0.001; jointly prepared documents: r = 0.302, p < 0.001; joint school development: r = 0.065, p < 0.050).
Potential implications for policy, practice and further research
Practice should focus on collaborative arrangements to achieve the necessary mutual support needed and described above. Different forms of collaboration, including the collaboration of teachers not only within schools but also between schools and other education and non-education institutions, have been intensively researched in the last 10 years. Collaboration seems particularly important for schools with students of low socioeconomic backgrounds. Policy and practice should focus on using all kinds of resources to benefit students. In the long term, educators can elaborate on students’ learning, and collaborative arrangements in subject and year groups can increase the probability of sustained innovation and shared innovation across teams (of year group, subject and whole school organisation). School leaders at all levels (subject, year and organisation as well as local, regional and state system) should prioritise knowledge management and sustainability.
3.3.2 Perceived stress due to the COVID-19 crisis
We assessed stress caused by the COVID-19 crisis via self and external assessments. To assess individually perceived stress, we asked the participants to rate the following item: Personally, I feel heavily stressed in the current situation. In addition, we asked parents, school leaders, school staff and school authorities to evaluate students’ stress (Students feel heavily stressed in the current situation).
Figure 6 shows the extent of the experienced stress, broken down by the surveyed groups of actors. Among school leaders (N = 655) and students (N = 2.151), the proportion who consider themselves (rather) stressed is higher (48% and 52% respectively) than among school staff (N = 1.949), school authority (N = 58), support staff (N = 141) and parents (N = 2.222) (38–41%).

Perceived stress by surveyed actor groups
External reports of students’ stress show that, among parents (N = 2.148), 44% strongly disagree (or disagree) that their children feel heavily stressed. The share of parents who strongly agree and agree is lower (24%). In contrast, the proportion of school leaders (N = 606), school staff (N = 1.784) and school authorities (N = 44) who (strongly) agree that the students feel heavily stressed is greater than the proportion who (strongly) disagrees.
What are the challenges that may lead to perceived stress? In order to answer this question, students were asked to assess the following statements: What I find particularly challenging about the school lockdown is/are:
-
To plan my day.
-
That I have many other things to do that keep me from studying.
-
The arrangements with my school/with my teachers.
-
Studying at home.
-
That my parents cannot help me.
-
That my parents control me all the time.
-
That I do not have a computer/laptop/tablet to study appropriately.
Figure 7 shows the distribution of students’ evaluations of these challenges (N = 2.059–2.078). About two-thirds of the students (strongly) agreed that there is no particular stress surrounding the fact that they have to plan their day themselves or that they have to do so much work and do not really get around to learning. Nineteen percent of students stated that these things are (rather) challenging for them.

Challenges perceived by students
At least half of the students did not see any particular challenge in all four statements. If they did, the arrangements with their teachers and learning at home seemed (strongly) challenging (26% and 25% respectively).
Around three-quarters of the students did not feel any particular stress surrounding the fact that their parents cannot help them or that their parents constantly control them. Between 12 and 14% of students stated that these things are (rather) special challenges for them.
For most students (86%), it is not a particular challenge to not have a computer/laptop/tablet to learn appropriately. However, 8% of students stated that this is a (rather) special challenge for them.
Conclusion
Among the surveyed groups of actors, students and school leaders reported the highest degree of perceived stress. Interestingly, the reports of school staff indicate less perceived stress. Given their responsibility for (digital) instruction and students’ learning, one could expect that teachers would perceive the highest degree of stress. It is possible that there are relieving factors, like teacher collaboration, that reduce the perceived degree of stress in comparison to the stress perceived by school leaders and students who may not have access to these resources.
The majority of students’ reports on the seven selected aspects of digital learning indicate that students did not face any particular challenges due to the school lockdown. However, a quarter of students felt (rather) challenged by the new way of learning. Studying at home and arrangements with school/teachers were perceived as particularly challenging. Unsurprisingly, five of the seven selected challenges were moderately related to students’ reports of perceived stress (r = 0.187/0.187/0.259/0.192/0.044/0.198/0.083; all p values < 0.050). In addition, students who experienced challenges in all the assessed items (N = 255) also reported that they received significantly less control/feedback (M = 3.55 vs. 3.93; t[1309] = 4879, p < 0.000) and differentiated guidance (M = 2.89 vs. 3.46; t[1309] = 6.374, p < 0.000) from teachers than students who perceived no significant challenges in any of the surveyed areas (N = 1.056). It should be noted that this online survey is very likely to not reach students from low socioeconomic backgrounds, who may face most unfavourable learning conditions at home. Thus, these findings might underestimate the real degree of challenges perceived by students.
Potential implications for policy, practice and further research
Improving the situation of students in precarious circumstances (e.g. those coming from socially weak families or educationally deprived families, those with low self-regulating abilities, those who face difficulties in planning their day) is a goal for policy and society as a whole. School communities, as networked systems within a region, can collaborate to compensate for the socioeconomic disadvantages of students’ families, particularly in disadvantaged areas. Teachers need non-teaching staff as support, and schools need coherent approaches with collegial support and networks with other partners within education as well as the local and regional contexts.
3.4 Further results regarding the role of family features for the learning of (disadvantaged) students
In contrast to the exploratory findings presented above, we did a confirmatory analysis on basis of the school barometer data from 8,344 students from Germany, Austria and Switzerland including data from the French School Barometer survey collected in Switzerland (Huber & Helm 2020). By means of structural equation modeling, we tested the assumptions of the so-called homework model by Trautwein et al. (2006). Results show that home resources like technical equipment and parental support play a role for student outcomes in terms of emotions, learning effort and learning success. However, students’ self-regulation skills and the quality of teaching during school lockdown are more important.
4 Critical reflections on the School Barometer and fast surveys
4.1 Advantages and limitations of the School Barometer
The School Barometer enables rapid exploratory research into a current social phenomenon, providing data for an instant and broad descriptive analysis. This allows for an initial picture of the current school situation from the perspective of parents, students, school staff, school leaders, school authorities and system support, capturing a variety of key features of the situation. The findings presented here are intended to contribute to and enrich the professional discourse, the political debate and inform the interested public. In addition, the findings can be used as suggestions for further research involving in-depth (hypothesis-testing) analyses. Thus, the survey can serve as a starting point for further exploratory and confirmatory research. Nevertheless, a critical examination of the School Barometer is important.
First, it is important to note that the sample is not random, and hence, the findings must not be overinterpreted. The School Barometer was carried out in an ad hoc manner without the possibility to facilitate a representative (at least with regard to certain demographic variables) and random sampling plan. Moreover, these procedures result in sample profiles that do not correspond to the population of the target group under investigation. For example, persons without internet access cannot participate in the survey, nor can younger students who cannot read sufficiently or who are not able to use emails and the internet independently of support of others.
In cases of non-random samples, like the ones presented here, parameter estimates (e.g. descriptive statistics of the population, regression coefficients) are biased. To obtain more accurate estimates, it could be suggested to apply statistical procedures like weighting. Weighting adjustments are commonly applied in surveys to compensate for a different deviation of participants as to the relation of the population given certain criteria. However, in order to make use of weighting adjustments, several requirements must be fulfilled, including information on the sampling probability, that is, the individuals’ probability of taking part in the study (e.g. Schnell and Noack 2017). In the case of the School Barometer, information such as the populations of school leaders, school staff, students and parents by educational level and school type is needed to calculate the sampling probability. Even if all the necessary requirements are met, it must be kept in mind that online surveys do not reach certain groups of people, and other groups of people will not be sufficiently represented in the sample.
Sampling profile analyses like the one above (see Section 2.3), as well as further critical checks for representativity and weighting procedures, are necessary to report unbiased findings. However, in our view, the examination of the overlap between the distributions of demographic variables in the data and in the population is not sufficient to claim that the study is representative. Rather, it is to be expected that the assessed constructs of the present survey are always influenced by other characteristics (e.g. personality traits). However, to add more variables leads to extension of the time needed to complete the questionnaire, and thus, it conflicts with other goals of barometer surveys (i.e. shortness and immediate provision of data). In the current short version of the School Barometer, especially with data of a follow-up study as data matching options are given, assessment of further demographic variables and personality traits could generate more knowledge about the participants of the study. One possible solution to deal with survey length is a matrix design as is often the case in large-scale studies.
Another challenge for barometer surveys is ensuring reliability and validity. With regard to reliability modelling, consideration of measurement error is challenging since many constructs are operationalised with single indicators instead of scales. Hence, latent variable modelling is not impossible but complex (see the section on methodological challenges below). In addition, individual items cannot comprehensively reflect the theoretical spectrum of the construct. Thus, the validity of the assessed construct is in question. Lower reliability and validity of assessments is the cost of the brevity and broader scope of barometer surveys. Against the background of these restrictions, the School Barometer should be rather understood as an exploratory tool that uses closed and open items to primarily generate hypotheses rather than to test hypotheses, even this is intended, too.
Taking these remarks about the School Barometer into account, it is important that open items are included in the survey, even if this results in a very time-consuming analysis, particularly when findings should be shared and distributed quickly. They provide important enrichment of the explanation and differentiation of the findings and allow openness to illuminate aspects that are not covered by closed items. They also stimulate contextuality and are context-rich (home situation, school situation, regional aspects or country context). Qualitative findings allow for formulation of further hypotheses and inform subsequent in-depth or longitudinal repeated cross-sectional research.
To sum up, we used an exploratory broad-topic single-indicator-operationalisation approach with quantitative and qualitative parts and an ad hoc sampling procedure in order to assess and evaluate the current situation of schooling due to the school lockdowns in Germany, Austria and Switzerland. The overall goal is to inform educational policy, research and practice.
4.2 Other projects to survey COVID-19 and schooling
A first internet-research-based review revealed around 20 surveys looking into the current situation of schooling, the majority of which were conducted in Germany, some in Austria; in Switzerland, we are not aware of any (at least at this moment). All were started later than the School Barometer. All might have been informed by the School Barometer, some explicitly state this or even use items of it. Only seven of them were developed by universities. Most focus on a specific group of actors; for example, the Elternkammer of Hamburg conducted a large study among 22,000 parents in Hamburg, and two studies were conducted by the University of Vienna, one surveying teachers and the other surveying students. Some focused on a specific region; for example, the project conducted by the University of Erfurt focused on teachers in Thuringia. Even singular schools started to do their own surveys in light of the shift to digital learning in order to encourage school development processes (e.g. www.kapellen-schule.de/homeschooling-umfrage). Some foundations asked polling institutions to run a short survey. None of the surveys had an international component, except for one of the studies of the University of Trier, which surveyed teachers and parents in Austria and Germany. Only the School Barometer considers all different actor groups, covers different regions and different countries and has been translated into various languages. All surveys are helpful to validate and interpret findings for different survey groups using triangulation or combination of different topics or analysis methods. Nevertheless, some (if not all) could have benefited from a more rigorous approach, and those that were conducted by associations and other non-academic institutions could have included experts for instrument development, data collection and data analysis. For various reasons, they all tried to investigate the current situation and generate knowledge as quickly as possible in order to contribute to solving pressing problems. Thus, all should be taken into account when analysing a situation like the COVID-19 pandemic. Our international review of surveys led to few results, which could be due to the fact that most studies will be conducted in the language of the country in which they are conducted and might not have a website in English. We found two surveys on parents’ roles and views related to digital learning due to COVID-19, one in the UK (conducted by Sutton Trust) and one in the USA (conducted by Gallup).
Examples of criteria to differentiate or analyse the surveys are the survey institution (academic, foundation, association, other institution, state or private), geographical scope, sampling procedure, persons surveyed, goals and aims, theoretical orientation, disciplinary field, topics, methodological approach, method of data collection, length/volume of data collection, method of data analysis and method of dissemination.
4.3 Methodological challenges of barometer surveys in general
In this section, we discuss data analysis issues that are not directly related to the findings of the School Barometer reported above but are vital in short monitoring surveys in general. First, in these surveys, the length and time needed to answer are crucial. (School) Barometer (or monitoring) surveys should be as short as possible in order to reach as many people as possible in the target group on the one hand and to avoid survey dropout on the other hand. To limit the time needed to answer, single indicators are often used to assess constructs. However, this comes at the cost of several methodological challenges related to data analysis. In this section, we discuss the central challenges and limitations of analyses of barometer survey data. In particular, we discuss the following issues:
-
1.
Testing hypotheses in barometer surveys
-
2.
Matching longitudinal data from repeated measures
-
3.
Aggregating data
-
4.
Handling measurement error using a single-indicator latent variable approach
-
5.
Multi-informant reports as a way of ensuring validity and reliability
4.3.1 Testing hypotheses in barometer surveys
As emphasised above, barometer can be exploratory in nature. Hence, comprehensive theoretical considerations not necessarily form the basis of the questionnaire and the study design. This is particularly true if barometer surveys need to be implemented very rapidly. However, a lack of theoretically sound hypotheses is problematic when attempting to test hypotheses in an orderly manner. It may be desirable to test assumptions and hypotheses in order to draw conclusions from the data. However, if the hypotheses are formed only after data collection, then there is a great danger of multiple testing. That is, statistical significance testing is arbitrarily applied to any association and group differences that cross one’s mind and were not theoretically justified in advance, thereby resulting in a multiple testing problem (i.e. an accumulation of type I errors). Moreover, barometer surveys—like many other studies—often do not meet the statistical prerequisites for hypothesis testing. That is, the sampling is non-random, and the sample may not be representative of the population for which inferences are made in reports. Moreover, if the sample size is low (this problem is most common in subgroup analyses), the sample might lack power, leading to an increased type II error rate. That is, a statistically insignificant finding may be interpreted as irrelevant (i.e. the alternative hypothesis is rejected in favour of the null hypothesis), although the results would have been statistically significant if more data would have been collected.
In cases characterised by these limitations, we encourage researchers to refrain from solely focussing on statistical hypothesis testing and to use effect size measures like r, R2 and Cohen’s d in addition to p values and confidence intervals which are sensitive to sample size.
4.3.2 Matching longitudinal data from repeated measures
If one aims to inform education policy with scientifically produced evidence, then a descriptive report of the responses to specific topics and questions/items is only the first step, and it is necessary to consider causal statements or mechanisms of action. For example, the question What can be done in the COVID-19 crisis to reduce students’ stress? calls for causal inferences about the relevant predictors of students’ stress. Hence, barometer surveys may be used to investigate longitudinal (causal) effects. One possible way to do so is to use repeated measurements with the same sample. This would mean that researchers need to match participants over time, which can be done in various ways. One option is to ask participants to voluntarily provide their email addresses, which can subsequently be used for merging datasets. Another is to use a mixture of different information that allow unique identification and anonymity. Usually, participants are asked to use their initials, the initials of their mother, the first numbers of their birthday, their place of birth and so on to generate an individual, unique code for linking data across different surveys in which they participate. In the case of the School Barometer, we tried to use the first method. Providing an email address was optional for participants, and around 80% did so. In hindsight, we would have favoured other options, maybe in addition to the one we chose.
Merging datasets from repeated measurements is necessary for studying changes in specific groups over time using various growth modelling techniques. For example, McArdle (2009) provides an introduction to the main statistical approaches for modelling latent differences and changes in longitudinal data. Popular approaches, like change score models, cross-lagged panel models and latent growth curve modelling, are explained.
4.3.3 Aggregating data
In addition to hypothesis testing, a central aim of all quantitative research is to explain patterns/structures in the data. In the case of barometer surveys, which use single indicators to cover a wide range of topics, data aggregation might be applied to bundle items to a comprehensive, cross-content topic, such as teacher professionalism or digital teaching–learning practice. In this report, we distinguish between manifest and latent aggregation.
Manifest aggregation to indices
A straightforward way to reduce the number of items assessing the same underlying construct is to simply compute the mean or sum across the items for each participant in order to obtain indices. However, while this approach is convenient, this procedure does not control for measurement error, and thus, the true values of the constructs of interest are not assessed. This may lead to substantial underestimation of associations in the data and, in the worst case, to incorrect conclusions/inferences. To avoid this issue, we recommend applying latent aggregation whenever possible.
Latent aggregation to factors
Sociological, managerial and psychological methodological research utilises two central types of factors—those involving reflective and formative factors (e.g. Bollen and Diamantopoulos 2017; MacKenzie et al. 2011; Weber 2017)—for both exploratory factor analysis (EFA) and confirmatory factor analysis (CFA).
Reflective latent factor analysis
Reflexive constructs are the most commonly used constructs in psychological and educational research. Whenever authors mention latent variables, they are usually referring to reflexive constructs. There are three assumptions related to these constructs:
-
1.
Reflexive constructs are characterised by the fact that connections between several items of a scale are explained by a single latent construct. If one controls for the latent construct, the correlations between the items disappear. If the correlations do not disappear, the model fit (in both EFA and CFA) is poor. Conversely, this means that the items must correlate with each other.
-
2.
The items are mutually interchangeable. This means that each item is a content indicator of the latent construct and that its omission does not (too greatly) reduce the content validity.
-
3.
An increase in the latent construct leads to an increase in all items.
In the case of the School Barometer, CFA and EFA are only appropriate for item sets for which these three assumptions apply.
Formative latent factor analysis
For formative constructs, the assumptions are different:
-
1.
The latent variable is explained/formed by the indicators, and not the other way around, as with reflexive constructs (leading formative constructs to also be called causal indicator constructs). That is, an increase of the indicator leads to an increase of the latent construct.
-
2.
Indicators are not interchangeable. To capture a reflexive construct, it is necessary to assess all items that are relevant to the construct. If only one is missing, the validity is questionable.
-
3.
The indicators need not correlate. If the latent construct increases with an increase of only one indicator, even if all other indicators remain unchanged, then it can be described as a formative construct.
Latent formative constructs should only be estimated for indicators that meet these assumptions. However, estimating these models may not be straightforward due to challenges in model identification (Weber 2017).
4.3.4 Handling measurement error using a single-indicator latent variable approach
In psychological and educational research, latent variable modelling (or latent aggregation, as it is called in the previous section) is an indispensable state-of-the-art technique since many study variables of interest are not directly observable but are, against the background of (classical) test theory, inferred from the participants’ responses to a set of items. In doing so, researchers want to control for measurement error, that is, the uncertainty of a measure reflected by the variation of an individual’s responses in hypothetical reassessments of the same item (i.e. construct reliability). Since it is not feasible to reassess the same item again and again in one study, the researcher must use a set of items that are assumed to address the same construct of interest. As these items vary in their content, they allow the researcher to cover a certain breadth of the latent construct (leading to construct validity). However, barometer surveys like the School Barometer face the challenge of surveying diverse aspects of a social phenomenon in a very short period of time. Hence, more often than not, assessing latent constructs with multiple indicators is not feasible. Moreover, from a statistical point of view, these analyses can be computationally intensive, particularly if they feature a high number of indicators (Su et al. 2019).
The single-indicator latent variable approach (SILVA; also known as the reliability corrected single-indicator approach) might help to overcome at least some of these challenges. While it is difficult to ensure construct validity with a single-indicator approach, as very few constructs are narrow enough to be covered by one statement/item and thus can only be addressed at an abstract/superficial level, SILVA ensures construct reliability by accounting for measurement error associated with single indicators. To this end, each latent variable is modelled by regressing the observed single indicator on a latent construct with the factor loading fixed to 1 and the unique variance fixed to 1 minus the reliability estimate (α) of the single indicator times its variance (σ2) (Coffman and MacCallum 2005):
According to Su et al. (2019), this approach is analogous to regressions that account for measurement error. In their simulation study, Su et al. (2019) show that, in terms of estimation bias, power and convergence rate, SILVA performs similar to traditional structural equation modelling with multiple indicators. In the context of barometer surveys, however, SILVA represents, at best, an approximation procedure due to the unknown reliability of the single indicators. In cases in which sample reliability and variance are unknown, Su et al. 2019 suggest obtaining reliability and variance information from original scale development studies or previous research using the same measures. In addition, they recommend using the Spearman-Brown formula to calculate the expected reliability of a single indicator based on the reliability of a multiple-indicator scale:
where n is the number of items in the original scale.
Although SILVA seems like a promising approach to account for measurement error in single-indicator studies like barometer surveys, it is not a panacea for the psychometric shortcomings of single-indicator constructs. Su et al. (2019) caution researchers against the use of single indicators when designing and planning studies for two reasons. First, applying the Spearman-Brown formula often leads to very low single-indicator reliabilities, which in turn can lead to erroneous estimates, and ‘second, to the extent that items in a scale are not equivalent and sample differences exist between current and prior research, reliability for the single indicator calculated using the above method will be inaccurate and estimates […] will be biased’ (Su et al. 2019, p. 35).
In the context of barometer surveys, there is an additional issue: as these surveys aim to quickly provide data on current and/or new situations and social phenomena, usually latent constructs are of interest when no validated instruments exist (e.g. in the case of quality of parental instruction/teaching). Hence, reliability information from previous research is missing. A possible solution might be to compare different scenarios, that is, to analyse results based on assumptions of low, middle and high single-indicator reliability and to report these assumptions.
Furthermore, it must be remembered that the idea of SILVA is based on the assumption of metric items. This assumption can be accepted as more or less given for five-level Likert items. However, SILVA should not be used for three-level Likert items.
Given the limitations of SILVA in the context of barometer surveys, researchers have to choose between reporting results from a single indicator, which are prone to measurement error, and error-corrected single-indicator constructs (SILVA), which are still somewhat biased given the challenges outlined above. However, it is likely that SILVA produces estimates that are closer to the true values than estimates based on manifest single-indicator constructs.
4.3.5 Multi-informant reports as a way of ensuring validity and reliability
While latent variable modelling using SILVA helps to control for measurement error, it does not ensure validity. To increase validity in the School Barometer survey, we adopted a multi-informant approach. Multi-informant (report) studies or assessments (also called cross-informant studies/assessments) capture the unique perspectives of different informants on the same item (i.e. a question or statement). An underlying assumption is that different informants each have unique and valid perspectives (De Los Reyes et al. 2013).
Because barometer survey data is collected and used to inform decision-making, the data should be reliable and valid (Desimone et al. 2010). However, reliability and validity might strongly depend on who is asked to rate a certain statement or feature. This raises the question of how strongly reports of the same construct from different informants differ. If large discrepancies between two or more informant groups are observed, two questions arise. First, if different informant groups do report different but unique and valid perspectives (Kunter et al. 2007; De Los Reyes et al. 2013) on the same item, which information is more appropriate and correct given a certain research question? Second, in cases of low agreement, what is the meaning of perspective-specific information?
From a theoretical point of view, several authors argue that the same construct may be perceived differently. For example, extant studies on teacher/student agreement (Cipriano et al. 2019; Kunter et al. 2008; Mitchell et al. 2010; Wettstein et al. 2016a, b; Wettstein et al. 2018a, b) draw on social cognitive theory (Bandura 2001) and social ecological theory (Bronfenbrenner 1996) to explain why informants (e.g. teacher and students) differ in their reports. Mitchell et al. (Mitchell et al. 2010, p. 272) argue that although actors in a school (e.g. students and teachers) ‘share a common objective experience, their differing roles within the school will likely lead to discrepant perceptions of the environment’. Different factors at multiple levels within the school influence their perceptions.
In addition, single-informant studies run into methodological problems like common method variance/bias (Podsakoff et al. 2003). If a single method (e.g. online questionnaires) and one source of information (e.g. school leaders) are used, it is likely that the observed associations among the study variables are, to some degree, attributable to the single method used for all items. According to Podsakoff et al. (2003, p. 887), a major cause of common method bias is assessing study variables (i.e. predictors and criteria) from the same rater or source, and ‘one way of controlling for it [common method bias] is to collect the measures of these variables from different sources’. In doing so, various biases (e.g. social desirability, lenient tendencies, implicit theories, dispositional and transient mood states) can be avoided (Podsakoff et al. 2003, p. 887).
5 Looking ahead: assumptions for further practices of assessment, evaluation and accountability
The School Barometer, as a fast and exploratory response to a current crisis, has some potential to inform policy, practice and research. Dissemination of the results in different forms and to different groups increases this potential. The results of the School Barometer were published in online reports (www.School-Barometer.net) as well as an open-access book (Huber et al. 2020). In addition, media, ministries, educational authorities, professional associations and all recipients of the newsletter of the World Education Leadership Symposium (WELS.EduLead.net) as well as all persons who filled in the survey and wanted feedback (and left their email address at the end of the survey in an open field (around 80% of the participants)) received information about the reports, publications and media reports via email. We also informed via social media posts. Different organisations informed about the School Barometer via emails, websites, newsletters, social media posts and so on.
The data collected by the School Barometer has potential beyond the exemplary findings reported in this article. First, the Geneva study represents a full population survey, and the data allow for analyses of specific subgroups for which too little data is available from the other School Barometer data. Second, data obtained from additional data collection procedures in other countries, like Russia, can be used to broaden and deepen cross-country comparative studies. Third, we can formulate various theses and hypotheses to be tested with the already established data and further data from the potential follow-up study, in particular by linking it to the data of other studies conducted at the IBB at the moment, e.g. a study in which we are investigating 300 schools as to school leadership, school development and school quality using a longitudinal mixed-method design (and collected data just before the crises started), such as the following: (i) differences in quality grow in moments of crisis, (ii) crises increase quality differences, (iii) quality differences explain different forms of compensatory effects, (iv) differences in quality aspects, like strategies, conditions and actual practices of collaboration, have a particular impact on how crises are dealt with and (v) quality differences in instruction have an impact on inclusive education as well as on digital learning environments. By doing this, we could also apply multi-level analysis to investigate different perspectives of different surveyed actor groups on different levels of the educational system (micro on classroom level: students, parents, teachers; meso on organisation unit (year group/subject group/teaching and non-teaching) and organisation level: students, parents, school staff, school leader, school features; macro on system level: region, state, country). Fourth, in a follow-up of the School Barometer, the stability of specific constructs, like perceived stress (which is assumed to decline with the decline of the pandemic and the increase in quality and the decrease in uncertainty as a result of overcoming the challenges of school lockdown), and new questions, for example about the schools reopening, can be studied. Moreover, with data of a follow-up study assessment of further demographic variables and personality traits could generate more knowledge about the participants of the study. Fifth, a review of other studies that use congruent or complementary approaches would help to validate the findings from different barometer studies on digital learning due to COVID-19.
Notes
The full online questionnaire can be accessed at www.School-Barometer.net and Huber et al. (2020).
References
Artino, A. R. (2008). Motivational beliefs and perceptions of instructional quality: Predicting satisfaction with online training. Journal of Computer Assisted Learning, 24(3), 260–270. https://doi.org/10.1111/j.1365-2729.2007.00258.x.
Bakker, A. B., & Demerouti, E. (2017). Job demands–resources theory: Taking stock and looking forward. Journal of Occupational Health Psychology, 22(3), 273–285.
Bandura, A. (2001). Social cognitive theory: An Agentic perspective. Annual Review of Psychology, 52, 1–26. https://doi.org/10.1146/annurev.psych.52.1.1.
Baumert, J., Kunter, M., Blum, W., Brunner, M., Voss, T., Jordan, A., et al. (2010). Teachers’ mathematical knowledge, cognitive activation in the classroom, and student progress. American Educational Research Journal, 47(1), 133–180. https://doi.org/10.3102/0002831209345157.
Bollen, K. A., & Diamantopoulos, A. (2017). In defense of causal-formative indicators: A minority report. Psychological Methods, 22(3), 581–596. https://doi.org/10.1037/met0000056.
Bronfenbrenner, U. (1996). The ecology of human development. Experiments by nature and design (9th ed.). Cambridge: Harvard University Press. https://doi.org/10.1080/00131728109336000.
Calman, R. C. (2010). Exploring the underlying traits of high-performing schools. Education Quality and Accountability Office EQAO.
Chapman, C., Armstrong, P., Harris, A., Muijs, D., Reynolds, D., & Sammons, P. (2012). School effectiveness and improvement. Research, policy and practice. Challenging the Orthodoxy? London: Routledge.
Cipriano, C., Barnes, T. N., Pieloch, K. A., Rivers, S. E., & Brackett, M. (2019). A multilevel approach to understanding student and teacher perceptions of classroom support during early adolescence. Learning Environments Research, 22(2), 209–228. https://doi.org/10.1007/s10984-018-9274-0.
Coffman, D. L., & MacCallum, R. C. (2005). Using parcels to convert path analysis models into latent variable models. Multivariate Behavioral Research, 40(2), 235–259. https://doi.org/10.1207/s15327906mbr4002_4.
Creemers, B., Kyriakides, L., & Sammons, P. (2010). Methodological advances in educational effectiveness research. London: Routledge.
Cronbach, L. J. (1972a). Evaluation zur Verbesserung von Curricula. In C. Wulf (Ed.), Evaluation. Beschreibung und Bewertung von Unterricht, Curricula und Schulversuchen (pp. 41–59). München.
Cronbach, L. J. (1972b). Evaluation zur Verbesserung von curricula. [Evaluation to improve curricula.]. In C. Wulf (Ed.), Evaluation. Beschreibung und Bewertung von Unterricht, Curricula und Schulversuchen [Evaluation. Description and evaluation of teaching, curricula and school experiments] (pp. 41–59). Munich: Piper & co.
Datu, J. A. D. (2017). Sense of relatedness is linked to higher grit in a collectivist setting. Personality and Individual Differences, 105, 135–138. https://doi.org/10.1016/j.paid.2016.09.039.
De Los Reyes, A., Thomas, S. A., Goodman, K. L., & Kundey, S. M. A. (2013). Principles underlying the use of multiple informants’ reports. Annual Review of Clinical Psychology, 9, 123–149. https://doi.org/10.1146/annurev-clinpsy-050212-185617.
Desimone, L. M., Smith, T. M., & Frisvold, D. E. (2010). Survey measures of classroom instruction. Educational Policy, 24(2), 267–329. https://doi.org/10.1177/0895904808330173.
Ditton, H. (2002a). Evaluation und Qualitätssicherung. [Evaluation and quality assurance.]. In R. Tippelt (Ed.), Handbuch Bildungsforschung [Handbook on Educational Research] (pp. 775–790). Opladen: Leske + Budrich.
Ditton, H. (2002b). Evaluation und Qualitätssicherung. In R. Tippelt (Ed.), Handbuch Bildungsforschung (pp. 775–790). Opladen: Leske + Budrich.
Eskreis-Winkler, L., Shulman, E. P., Beal, S. A., & Duckworth, A. L. (2014). The grit effect: Predicting retention in the military, the workplace, school and marriage. Frontiers in Psychology, 5(36), 1–12. https://doi.org/10.3389/fpsyg.2014.00036.
Gideon, L. (Ed.). (2012). Handbook of Survey Methodology for the Social Sciences. New York: Springer.
Haagerup, U. (2017). Constructive news. Copenhagen: Aarhus University Press.
Hallinger, P., & Huber, S. G. (2012). School leadership that makes a difference: International perspectives. School Effectiveness and School Improvement, 23(4), 1–9. https://doi.org/10.1080/09243453.2012.681508.
Hargreaves, A., Lieberman, A., Fullan, M., & Hopkins, D. W. (1998). International handbook of educational change. Dordrecht: Springer.
Harris, A., & Jones, M. (2012). Professional learning communities and system improvement. Improving Schools, 13(2), 172–181. https://doi.org/10.1177/1365480210376487.
Harris, A., Chapman, C., Muijs, D., Russ, J., & Stoll, L. (2006). Improving schools in challenging circumstances: Exploring the possible. School Effectiveness and School Improvement, 17, 409–424. https://doi.org/10.1080/09243450600743483.
Hattie, J. (2009). Visible learning. New York: Routledge.
Hawkes, M. (1996). Criteria for evaluating school-based distance education programs. NASSP Bulletin, 80(581), 45–52. https://doi.org/10.1177/019263659608058115.
Hopkins, D., Harris, A., Stoll, L., & Mackay, T. (2011). School and school improvement: State of the art review. In Keynote presentation prepared for the 24th international congress of school effectiveness and school improvement. Limassol: Cyprus.
Huber, S.G. (2013). Forschung zu Belastung und Beanspruchung von Schulleitung. [Research on strain and stress of school leaders.] In S.G. Huber (Ed.), Jahrbuch Schulleitung 2013. Befunde und Impulse zu den Handlungsfeldern des Schulmanagements [Yearbook School Leadership 2013. Impulses from research and practice] (pp. 222-240). Köln: Wolters Kluwer Deutschland.
Huber, S.G. (2014). Kooperative Bildungslandschaften. Netzwerke(n) im und mit System. [Cooperative education landscapes. Networking systematically in the system.] Neuwied/Kronach/München: LinkLuchterhand/WoltersKluwer.
Huber, S. G. (2016a). Germany: The school leadership research base in Germany. In H. Ärlestig, C. Day, & O. Johansson (Eds.), A decade of research on school principals (pp. 375–401). Dordrecht: Springer.
Huber, S. G. (2016b). Switzerland: The school leadership research base in Switzerland. In H. Ärlestig, C. Day, & O. Johansson (Eds.), A decade of research on school principals (pp. 421–442). Dordrecht: Springer.
Huber, S. G. (2018). No simple fixes for schools in challenging circumstances. Contextualization for Germany. In C. Meyers & M. Darwin (Eds.), International perspectives on leading low-performing schools (pp. 243–266). Charlotte: Information Age Publishing.
Huber, S.G. (2020). Responsible leaders entwickeln Schule in der balance von Bewahren, Optimieren, Innovieren. [Responsible leaders develop schools keeping the balance between maintaining, optimizing, innovating.] In S.G. Huber (Ed.), Jahrbuch Schulleitung 2020. Impulse aus Wissenschaft und Praxis. [Yearbook School Leadership 2020. Impulses from research and practice (pp. 3-14).] Köln: Wolters Kluwer Deutschland.
Huber, S.G. & Ahlgrimm, F. (2012). Kooperation: Aktuelle Forschung zur Kooperation in und zwischen Schulen sowie mit anderen Partnern. [Cooperation. Current research on collaboration in and among schools as well as with external partners.] Münster u.a.: Waxmann.
Huber, S. G., & Muijs, D. (2010). School leadership effectiveness. The growing insight in the importance of school leadership for the quality and development of schools and their pupils. In S. G. Huber (Ed.), School leadership - international perspectives (pp. 57–78). Dordrecht: Springer.
Huber, S.G. & Robinson, V. (2016). World school leadership study: practices and resilience. Symposium at the Meeting of the World Education Research Association (WERA) in conjunction with the Annual Meeting of the American Educational Research Association (AERA), 8.-12. April 2016 in Washington D.C.
Huber, S. & Spillane, J. (2016). World school leadership study – concept and design. Symposium at the European Congress on Educational Research of the European Educational Research Association, 23.-26. August 2016 in Dublin, Irland.
Huber, S.G. & Spillane, J. (2018). Mapping the field of research on education leadership administration and management: methodological, thematical and regional perspective. Symposium at the European Congress on Educational Research of the European Educational Research Association. 3.-4. September 2018 in Bozen, Italy.
Huber, S.G., Hader-Popp, S. & Schneider, N. (2014). Qualität und Entwicklung von Schule: Basiswissen Schulmanagement. [Quality and development of schools. Basic knowledge school management.] Reihe »BildungsWissen Lehramt«. [Series education knowledge for the teaching profession.] Weinheim und Basel: Beltz Verlag.
Huber, S. G. & Helm, C. (2020). Lernen in Zeiten der Corona-Pandemie. Die Rolle familiärer Merkmale für das Lernen von Schüler*innen: Befunde vom Schul-Barometer in Deutschland, Österreich und der Schweiz. [Learning in Times of the Corona Pandemic. The Role of Family Features for the Learning of Students.] Die Deutsche Schule, 16, 11-34. https://doi.org/10.31244/9783830992318.02.
Huber, S. G., Günther, P. S., Schneider, N., Helm, C., Schwander, M., Schneider, J. A., & Pruitt, J. (2020). COVID-19 – aktuelle Herausforderungen in Schule und Bildung. In Erste Befunde des Schul-Barometers in Deutschland, Österreich und der Schweiz. Münster: Waxmann. Retrieved May 26, 2020, from www.School-Barometer.net.
Johansen, W., Aggerholm, H. K., & Frandsen, F. (2012). Entering new territory: A study of internal crisis management and crisis communication in organizations. Public Relations Review, 38(2), 270–279. https://doi.org/10.1016/j.pubrev.2011.11.008.
Karasek, R. A. (1979). Job Demands, Job Decision Latitude, and Mental Strain: Implications for Job Redesign. Administrative Science Quarterly. Vol. 2(24), 285–308. https://doi.org/10.2307/2392498, JSTOR 2392498.
Klieme, E., Pauli, C., & Reusser, K. (2009). The Pythagoras study: Investigating effects of teaching and learning in Swiss and German mathematics classrooms. In T. Janik & T. Seidel (Eds.), The power of video studies in investigating teaching and learning in the classroom (pp. 137–160). Münster u.a.: Waxmann. Retrieved from http://www.ciando.com/ebook/bid-40151
Kundu, A. (2017). Grit and agency: A framework for helping students in poverty to achieve academic greatness. National Youth-At-Risk Journal, 2(2), 69–80. https://doi.org/10.20429/nyarj.2017.020205.
Kunter, M., Baumert, J., & Köller, O. (2007). Effective classroom management and the development of subject-related interest. Learning and Instruction, 17(5), 494–509. https://doi.org/10.1016/j.learninstruc.2007.09.002.
Kunter, M., Tsai, Y.-M., Klusmann, U., Brunner, M., Krauss, S., & Baumert, J. (2008). Students’ and mathematics teachers’ perceptions of teacher enthusiasm and instruction. Learning and Instruction, 18(5), 468–482. https://doi.org/10.1016/j.learninstruc.2008.06.008.
Kunter, M., Baumert, J., Blum, W., Klusmann, U., Krauss, S., & Neubrand, M. (Eds.). (2013). Cognitive activation in the mathematics classroom and professional competence of teachers. Results from the COACTIV project. New York: Springer. https://doi.org/10.1007/978-1-4614-5149-5.
Larmuseau, C., Desmet, P., & Depaepe, F. (2019). Perceptions of instructional quality: Impact on acceptance and use of an online learning environment. Interactive Learning Environments, 27(7), 953–964. https://doi.org/10.1080/10494820.2018.1509874.
Lazarus, R. S., & Folkman, S. (1984). Stress, appraisal, and coping. New York: Springer.
Maak, T., & Pless, N. M. (2006). Responsible leadership. London: Routledge.
MacKenzie, S. B., Podsakoff, P. M., & Podsakoff, N. P. (2011). Construct measurement and validation procedures in MIS and behavioral research: Integrating new and existing techniques. MIS Quarterly, 35(2), 293–334. https://doi.org/10.2307/23044045.
Margaryan, A., Bianco, M., & Littlejohn, A. (2015). Instructional quality of Massive Open Online Courses (MOOCs). Computers & Education, 80, 77–83. https://doi.org/10.1016/j.compedu.2014.08.005.
McArdle, J. J. (2009). Latent variable modeling of differences and changes with longitudinal data. Annual Review of Psychology, 60, 577–605. https://doi.org/10.1146/annurev.psych.60.110707.163612.
Mitchell, M. M., Bradshaw, C. P., & Leaf, P. J. (2010). Student and teacher perceptions of school climate: A multilevel exploration of patterns of discrepancy. Journal of School Health, 80(6), 271–279. https://doi.org/10.1111/j.1746-1561.2010.00501.x.
Moos, L., & Huber, S. G. (2007). School leadership, school effectiveness and school improvement: Democratic and integrative leadership. In T. Townsend (Ed.), International handbook of school effectiveness and improvement (pp. 579–596). Dordrecht: Springer.
Muijs, D., West, M., & Ainscow, M. (2010). Why network? Theoretical perspectives on networking. School Effectiveness and School Improvement, 21(1), 5–26. https://doi.org/10.1080/09243450903569692.
Pearson, C. M., Roux-Dufort, C., & Clair, J. A. (2007). International handbook of organizational crises management. Thousand Oaks: Sage.
Podsakoff, P. M., MacKenzie, S. B., Lee, J.-Y., & Podsakoff, N. P. (2003). Common method biases in behavioral research. A critical review of the literature and recommended remedies. Journal of Applied Psychology, 88(5), 879–903. https://doi.org/10.1037/0021-9010.88.5.879.
Robert, A., & Karasek, J. (1979). Job demands, job decision latitude, and mental strain. Implications for Job Redesign. Administrative Science Quarterly, 24(2), 285–308. https://doi.org/10.2307/2392498.
Robinson, V. M., Lloyd, C. A., & Rowe, K. J. (2008). The impact of leadership on student outcomes: An analysis of the differential effects of leadership types. Educational Administration Quarterly, 44(5), 635–674. https://doi.org/10.1177/0013161X08321509.
Rosenholtz, S. J. (1989). Teachers’ workplace. The social organization of schools. New York: Longman.
Rosenthal, U., & Kouzmin, A. (1993). Globalizing an agenda for contingencies and crisis management: An editorial statement. Journal of Contingencies & Crisis Management, 1, 1–12. https://doi.org/10.1111/j.1468-5973.1993.tb00001.x.
Rosenthal, U., & Kouzmin, A. (1997). Crises and crisis management: Towards comprehensive government decision making. Journal of Public Administration Research and Thoery, 7, 277–304. https://doi.org/10.1093/oxfordjournals.jpart.a024349.
Schneider, S. (1995). Flirting with disaster. Public management in crisis situations. New York: M.E. Sharpe.
Schnell, R., & Noack, M. (2017). Sampling, non-response and weighting methods for victimisation surveys. In N. Leitgöb-Guzy, C. Birkel, & R. Mischkowitz (Eds.), Victimisation surveys in Germany (pp. 82–85). Wiesbaden: Bundeskriminalamt.
Stone-Johnson, C. (2013). Responsible leadership. Educational Administration Quarterly, 50(4), 645–674. https://doi.org/10.1177/0013161X13510004.
Stoop, I., & Harrison, E. (2012). Classification of Surveys. In L. Gideon (Ed.), Handbook of Survey Methodology for the Social Sciences, pp. 7–21. New York: Springer. https://doi.org/10.1007/978-1-4614-3876-2_2.
Strayhorn, T. L. (2014). What role does grit play in the academic success of black male collegians at predominantly white institutions? Journal of African American Studies, 18(1), 1–10. https://doi.org/10.1007/s12111-012-9243-0.
Su, R., Zhang, Q., Liu, Y., & Tay, L. (2019). Modeling congruence in organizational research with latent moderated structural equations. Journal of Applied Psychology, 104(11), 1404–1433. https://doi.org/10.1037/apl0000411.
Teddlie, C. & Stringfield, S. (2007). A History of School Effectiveness and Improvement Research in the USA focusing on the Past Quarter Century. In T. Townsend (Ed.), International Handbook of School Effectiveness and Improvement, p. 131–166. Dordrecht: Springer. https://doi.org/10.1007/978-1-4020-5747-2.
Tian, M., & Huber, S. G. (2019). Mapping educational leadership, administration and management research 2007–2016: Thematic strands and the changing landscape. Journal of Educational Administration, 58(2), 129–150. https://doi.org/10.1108/JEA-12-2018-0234.
Trautwein, U., Lüdtke, O., Schnyder, I., & Niggli, A. (2006). Predicting homework effort: Support for a domain-specific, multilevel homework model. Journal of Educational Psychology, 98(2), 438–456. https://doi.org/10.1037/0022-0663.98.2.438.
Vardarlier, P. (2016). Strategic approach to human resources management during crisis. Procedia - Social and Behavioral Sciences, 235, 463–472. https://doi.org/10.1016/j.sbspro.2016.11.057.
Weber, C. (2017). Problems in the validation of cluster level constructs measured by individual level ratings. Presentation at the 23rd Workshop Applied Classification Analysis (Nov., 2017).
Weick, K. E. (1988). Enacted sensemaking in crisis situation. Journal of Management Studies, 25(4), 305–317. https://doi.org/10.1111/j.1467-6486.1988.tb00039.x.
Weick, K. E. (2010). Reflection on enacted sensemaking in the Bhopal disaster. Journal of Management Studies, 47, 537–550. https://doi.org/10.1111/j.1467-6486.2010.00900.x.
West, M. A., & Hirst, G. (2003). Cooperation and teamwork for innovation. In M. A. West, D. Tjosvold, & K. G. Smith (Eds.), International handbook of teamwork and cooperative working (pp. 297–321). New York: Wiley.
Wettstein, A., Ramseier, E., Scherzinger, M., & Gasser, L. (2016a). Unterrichtsstörungen aus Lehrer- und Schülersicht. Zeitschrift für Entwicklungspsychologie und Pädagogische Psychologie, 48(4), 171–183. https://doi.org/10.1026/0049-8637/a000159.
Wettstein, A., Ramseier, E., Scherzinger, M., & Gasser, L. (2016b). Unterrichtsstörungen aus Lehrer- und Schülersicht. [Class disorders from the teacher and student perspective.]. Zeitschrift für Entwicklungspsychologie und Pädagogische Psychologie [Journal for Developmental and Educational Psychology], 48(4), 171–183. https://doi.org/10.1026/0049-8637/a000159.
Wettstein, A., Scherzinger, M., & Ramseier, E. (2018a). Empirische Arbeit: Unterrichtsstörungen, Beziehung und Klassenführung aus Lehrer-, Schüler- und Beobachterperspektive. Psychologie in Erziehung und Unterricht, 65(1), 58–74. https://doi.org/10.2378/peu2018.art04d.
Wettstein, A., Scherzinger, M., & Ramseier, E. (2018b). Empirische Arbeit: Unterrichtsstörungen, Beziehung und Klassenführung aus Lehrer-, Schüler- und Beobachterperspektive. [Empirical work: Class disorders, relationship and classroom management from the teacher, student and observer perspective.]. Psychologie in Erziehung und Unterricht [Psychology in education and teaching], 65(1), 58–74. https://doi.org/10.2378/peu2018.art04d.
Acknowledgements
First, many thanks to Springer Nature for their interest in this article and the rigorous process to make it possible. Many thanks to the peer reviewers for their summative evaluation and the further reviewers for their formative evaluation; all the feedback helped to improve the article and developed the ideas for further ones. Second, many thanks to the participants of the survey in times of crises, particularly to the elaborated answers to the open questions which we present in other publications, and all representatives of different organisations who helped to review and disseminate the survey with such short notice and disseminate reports of our findings. Third, many thanks to the research team of the Institute for the Management and Economics of Education at the University of Teacher Education Zug who showed an engaged and rigorous approach in conducting the School Barometer, in particular to Paula Sophie Günter, Nadine Schneider, Marius Schwander, Julia Schneider and Jane Pruitt.
Author information
Authors and Affiliations
Corresponding author
Additional information
Publisher’s note
Springer Nature remains neutral with regard to jurisdictional claims in published maps and institutional affiliations.
Rights and permissions
About this article

Cite this article
Huber, S.G., Helm, C. COVID-19 and schooling: evaluation, assessment and accountability in times of crises—reacting quickly to explore key issues for policy, practice and research with the school barometer. Educ Asse Eval Acc 32, 237–270 (2020). https://doi.org/10.1007/s11092-020-09322-y
Published:
Issue Date:
DOI: https://doi.org/10.1007/s11092-020-09322-y