the Creative Commons Attribution 4.0 License.
the Creative Commons Attribution 4.0 License.
 | 06 Aug 2019
Evaluating the carbon sequestration potential of volcanic soils in southern Iceland after birch afforestation
Matthias Hunziker
Olafur Arnalds
Nikolaus J. Kuhn
Afforestation is a strategy to sequester atmospheric carbon in the terrestrial system and to enhance ecosystem services. Iceland's large areas of formerly vegetated and now degraded ecosystems therefore have a high potential to act as carbon sinks. Consequently, the ecological restoration of these landscape systems is part of climate mitigation programmes supported by the Icelandic government. The aim of this study was to explore the change in the soil organic carbon (SOC) pools and to estimate the SOC sequestration potential during the re-establishment of birch forest on severely degraded land. Differently aged afforested mountain birch sites (15, 20, 25 and 50 years) were compared to sites of severely degraded land, naturally growing remnants of mountain birch woodland and grasslands which were re-vegetated using fertilizer and grass seeds 50 years ago. The soil was sampled to estimate the SOC stocks and for physical fractionation to characterize the quality of the SOC. The results of our study show that the severely degraded soils can potentially sequester an additional 20 t C ha−1 (0–30 cm) to reach the SOC stock of naturally growing birch woodlands. After 50 years of birch growth, the SOC stock is significantly lower than that of a naturally growing birch woodland, suggesting that afforested stands could sequester additional SOC beyond 50 years of growth. The SOC fractionation revealed that at all the tested sites most of the carbon was stored in the <63 µm fraction. However, after 50 years of birch growth on severely degraded soils the particulate organic matter (POM) fraction was significantly enriched most (+12 t POM-C ha−1) in the top 30 cm. The study also found a doubling of the dissolved organic carbon (DOC) concentration after 50 years of birch growth. Therefore and due to the absence of any increase in the tested mineral-associated SOC fractions, we assume that the afforestation process evokes a carbon deposition in the labile SOC pools. Consequently, parts of this plant-derived, labile SOC may be partly released into the atmosphere during the process of stabilization with the mineral soil phases in the future. Our results are limited in their scope since the selected sites do not fully reflect the heterogeneity of landscape evolution and the range of soil degradation conditions. As an alternative, we suggest using repeated plot measurements instead of space-for-time substitution approaches for testing C changes in severely degraded volcanic soils. Our findings clearly show that detailed measurements on the SOC quality are needed to estimate the SOC sequestration potential of restoration activities on severely degraded volcanic soils, rather than only measuring SOC concentration and SOC stocks.
- Article
(1009 KB) - Full-text XML
- BibTeX
- EndNote


1.1 Iceland's soil carbon sequestration potential by land restoration
The Icelandic government approved activities including revegetation and afforestation in the 1990s to increase the terrestrial carbon sequestration from the atmosphere (Sigurdsson and Snorrason, 2000; Aradottir and Arnalds, 2001; Ministry for the Environment, 2007). In effect, land reclamation has been carried out for over 100 years in order to halt land degradation and soil erosion events (Crofts, 2011) caused by human activities since the island's settlement about 1100 years ago (Aradottir and Arnalds, 2001), as well as natural stress factors such as volcanic eruptions or the harsh climate.
Woodlands and species-rich heathlands form the undisturbed ecosystem type on drylands at lower elevation (<400 m a.s.l.) (Aradòttir et al., 1992). Fertile Brown Andosol is the typical soil type of these ecosystems and it is found across 13 360 km2 (Óskarsson et al., 2004). Andosols have a tendency to accumulate higher quantities of SOC than other soil types, due to the cover of soil organic carbon (SOC) enriched surface horizons by volcanic ejecta and the andic properties resulting from the formation of organo-mineral complexes (Dahlgren et al., 2004; McDaniel et al., 2012; Delmelle et al., 2015; Arnalds, 2015a). Hence, the average SOC stock of the Brown Andosols is estimated at 227 t C ha−1 (Óskarsson et al., 2004). During the last centuries, about 43 000 km2 of Iceland (∼40 %) has been affected by severe extreme soil erosion (Arnalds et al., 2016). Consequently, about 120–500 Mt of SOC has been lost in the past (Óskarsson et al., 2004). Presently, approximately 45 000 km2 (∼45 %) of the land area is covered by sparsely vegetated areas which range to barren deserts, in addition to disturbed areas with reduced carbon levels (Arnalds, 2015b). These landscapes are characterized by limited vegetation cover on vitric soil types (Arnalds et al., 2013) with low biomass production and low SOC stocks (Óskarsson et al., 2004). Vitrisols (Vitric Andosols and Leptosols), which are the typical soil types of the deserts, contain less than 45 t C ha−1 on average (Óskarsson et al., 2004).
Based on these differences, the potential of the severely degraded soils to sequester high amounts of carbon has been demonstrated (Arnalds et al., 2000; Ágústsdóttir, 2004). An important aspect of reclaiming degraded land is the recovery of ecosystem services including rehabilitation of farm land, protection against soil erosion or public recreation (Aradóttir et al., 2013). For example, the large-scale project called Hekluskógar was established in southern Iceland in 2007 with the aim of restoring resilient birch woodlands on about 900 km2 in the vicinity of Mount Hekla in order to reduce the effect of volcanic hazards (Aradóttir, 2007).
1.2 Assessment of SOC change in Iceland
The Icelandic carbon stocks have been reported in a national inventory for the UNFCCC (Hellsing et al., 2016). The Icelandic National Inventory Report uses a country-specific soil carbon sequestration factor of 0.51 t C ha−1 yr−1 for soils during the conversion of severely degraded land (“Other Land”) to forest land or grassland (Hellsing et al., 2016). This is based on Icelandic field studies which found an increase in the SOC stock and therefore assigned a positive soil carbon sequestration effect to the reclamation (Aradóttir et al., 2000; Snorrason et al., 2002; Ritter, 2007; Bjarnadottir, 2009; Kolka-Jónsson, 2011; Arnalds et al., 2013). In addition, the Icelandic Soil Conservation Service continuously reviews this value by ongoing C sequestration monitoring (Hellsing et al., 2016). The establishment of a vegetation community passes through different development stages; consequently, the sequestration rate, as a function of SOC change over time, is not linear until the new SOC stock equilibrium is reached (Smith et al., 1997; Six et al., 2002; Stewart et al., 2007). Hence, the development of the SOC stock and the SOC sequestration rates need to be recorded with a high temporal resolution instead of using the data of only two inventories (e.g. t0 and t1 or initial and developed vegetation type).
Monitoring the total C stock is not sufficient to characterize the overall potential for removal of atmospheric C by afforestation since soil organic matter (SOM) consists of a heterogeneous mixture with respect its physical protection and chemical structure (Schmidt et al., 2011). This leads to dynamic patterns of SOC stocks, composition of SOC, decomposability and turnover rates of SOC during land-use changes (von Lützow et al., 2008; Poeplau and Don, 2013). Recent studies show that the labile SOC pool, which is composed mainly of particulate organic matter (POM), increases simultaneously with the total SOC in the mineral soil during the establishment of vegetation systems with a higher net primary production rate (Guidi et al., 2014; Gabarrón-Galeote et al., 2015; Trigalet et al., 2016; Hunziker et al., 2017). To date, however, soil studies in Iceland have not focused on such changes in SOC fractions during the establishment of woody vegetation systems.
In Iceland, the conversion of vegetation cover is currently driven by revegetation of severely degraded land (Aradóttir et al., 2000; Arnalds et al., 2013), natural succession following glacier retreat (Vilmundardóttir et al., 2015) and afforestation of different types of tree species on heathland (Ritter, 2007), as well as on grazed land (Snorrason et al., 2002). However, there is limited information concerning carbon sequestration in soils associated with the afforestation of severely degraded landscapes by the only native forest tree species, Betula pubescens Ehrh. ssp. czerepanovii.
The present study was part of the CarbBirch project (Halldórsson et al., 2011) which was launched in 2008 and involved two of the five CarbBirch study areas. The main goal of CarbBirch was to study the ecological impact of the restoration activities in Hekluskógar. The present study aims at characterizing the long-term carbon sequestration potential of afforestation efforts with mountain birch on severely degraded soils. For this, we compared the SOC patterns in mountain birch stands of different ages to those of severely degraded and barren areas, reclaimed grasslands and natural old growth birch woodlands. The article first introduces the commonly used SOC parameters, SOC concentration and the SOC stocks (0–30 cm), and then discusses the vertical distribution of SOC, SOC quality and the interaction between the SOC and the volcanic clay minerals.
2.1 Study approach
The study area is in the vicinity of the Mount Hekla volcano (Fig. 1a). Due to the unsustainable land use and volcanic activity, most of this area has been affected by erosion. The resulting landscape is characterized by sandy deserts (Arnalds et al., 2016), which often leads to the formation of important sandstorms (Crofts, 2011; Arnalds et al., 2016), and, in consequence, reclamation activities have been carried out over the last decades (Halldórsson et al., 2011). The soil parent material generally consists of lava field material, glacial till, aeolian deposits or buried soil materials (Dugmore et al., 2009; Thorarinsdottir and Arnalds, 2012).
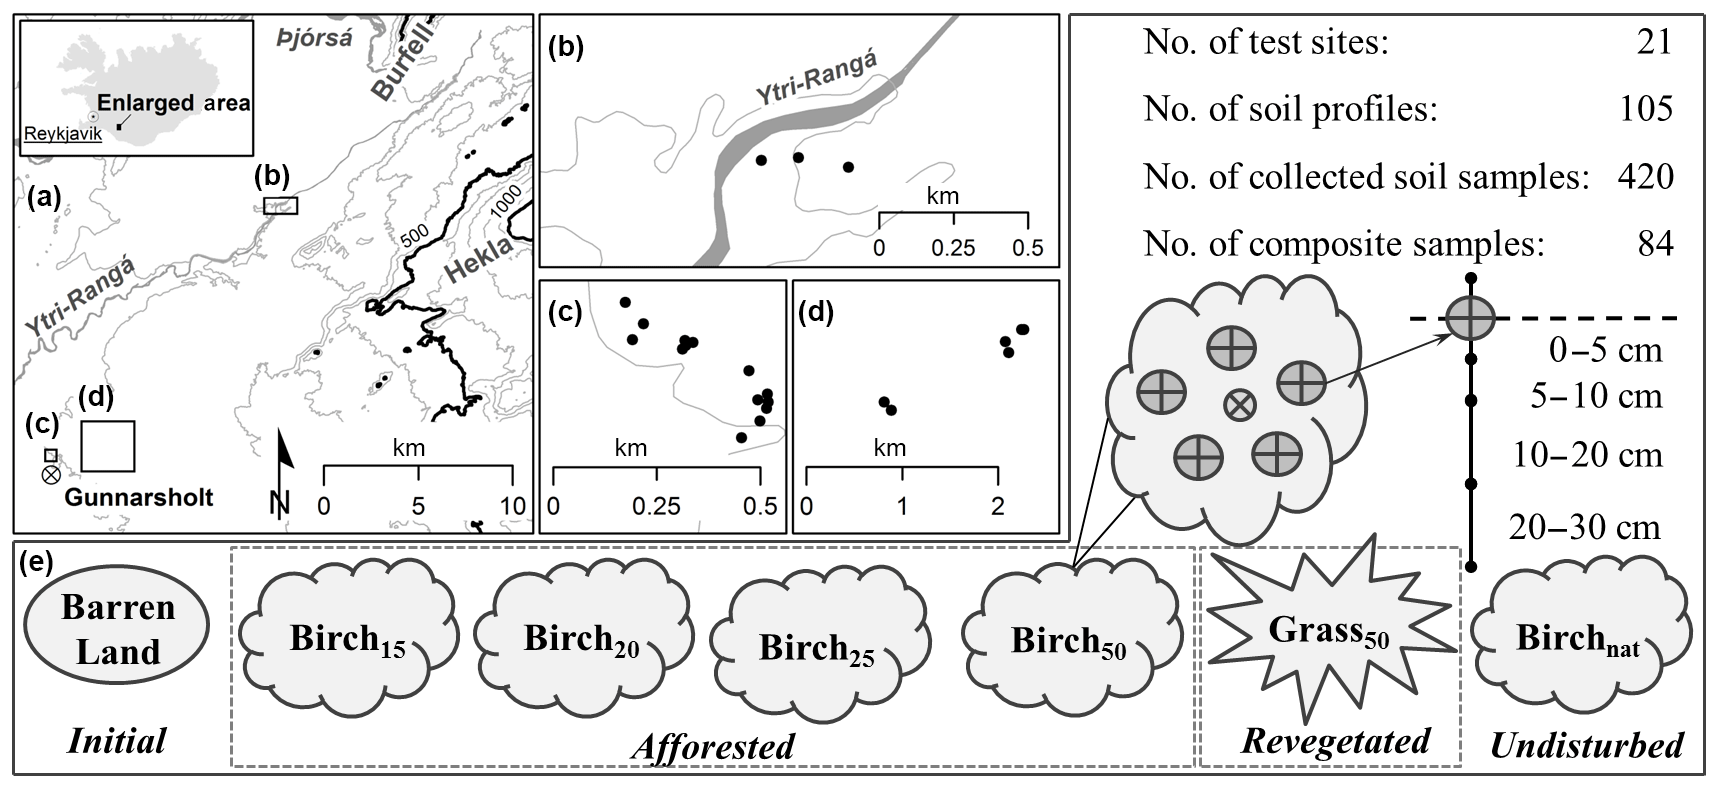
Figure 1The topological map (equidistance = 100 m) showing the study area between the Ytri-Rangá River, Mount Burfell, Mount Hekla and Gunnarsholt (crossed cycle) in the south of Iceland (a). The locations of the naturally growing birch woodland (b; asterisks) and the afforested (c; B15: circles; B20: triangles; B25: pentagons; B50: diamonds) and degraded (crosses) as well as revegetated (stars) test sites (d) are shown in more detail. The sampling scheme illustrates the age and vegetation characteristics of the different study sites and the applied soil sampling setup (e).
The afforested woodland area “Gunnlaugsskógur” is located approximately 1 km north of the Icelandic Soil Conservation Service Headquarters at Gunnarsholt (Fig. 1c). In 1926, the eroded area was excluded from sheep grazing by fencing. After the stabilization of the ground surface and the fertilization of the soil, birch was seeded on small plots in 1939 and 1945. In 1945, birch seedlings resulting from the activity in 1939 were transplanted on a nearby lava field, although most of the present birch area at Gunnlaugsskógur has naturally regenerated through seed production of the previously planted birches (Aradóttir, 1991; Aradottir and Arnalds, 2001). The age of the afforested birch sites was determined by dendrochronology as part of the CarbBirch project. The mean ages of the sampled afforested birch plots were 15, 20, 25, and 50 years (Birch15, Birch20, Birch25, and Birch50), respectively.
In addition to the birch plots, soil samples were taken from three severely degraded sites with barren surfaces and from three revegetated sites with grass vegetation north of Gunnlaugsskógur (Fig. 1d). In the present study, the severely degraded and eroded sites (Barren Land) represent the stage before any restoration activity has begun. The Barren Land sites were selected at 4 km distance from Gunnlaugsskógur, as barren areas were not available near the afforested birch sites, and it was assumed that the geologic and pedologic characteristics were comparable to those at the birch sites. The grassland sites (Grass50) were located next to the severely degraded sites; these were protected against sheep grazing by fencing and then revegetated by using fertilizers and grass seeds about 50 years ago and at present are not used for hay production. The topsoil at these sites has been found to be degraded, while horizons buried by wind deposits may contain some carbon (Arnalds, 2010; Arnalds et al., 2013). This has to be considered when assessing carbon sequestration by actual restoration programmes because parts of the found SOC may result from earlier vegetation. Due to the same age of Birch50 and Grass50, the two different reclamation types can be compared directly.
The differently aged birch sites were further compared to a naturally growing birch woodland located at Hraunteigur (Fig. 1b). This area was protected against sand encroachment by two streams, but was subjected to deposition of large amounts of dust and periodic tephra fallout. Thus, it represents the original mountain birch woodlands (Birchnat) which covered large areas in the vicinity of Mount Hekla in the past (Árnason, 1958). As the vegetation cover is subject to large-scale sediment deposition, the area has accumulated soils with depths of more than 2 m (Kolka-Jónsson, 2011).
Field sampling was carried out in summer 2011. Each of the tested categories (e.g. Barren Land, Birch15, Birchnat) described above was represented by three test sites (three replicates) (Fig. 1e). After removing the litter layer, the top 30 cm of the mineral soil was sampled. This sampling depth interval represents the common depth for SOC stock inventories (Aalde et al., 2006; Snorrason, 2010), and in addition, the top 30 cm of the mineral soil contains most of the belowground living root biomass at grassland and birch sites (Snorrason et al., 2002; Bjarnadottir et al., 2007; Hunziker et al., 2014). Thus, the dominant belowground organic carbon source deriving from plant growth is located between 0 and 30 cm soil depth.
At each site, five soil pits were randomly placed. At the woody sites, sampling occurred within one-half of the crown diameter of a dominant mountain birch (Betula pubescens Ehrh. ssp. czerepanovii) tree. The soil was sampled with a cylindric metal core (Eijkelkamp Soil & Water, Giesbeek) of 100 cm3 volume and 5 cm in diameter at given soil intervals (0–5, 5–10, 10–20 and 20–30 cm). The five sub-samples per depth interval were immediately mixed in order to form one composite sample. Thus, each depth interval per category was represented by 3 composite samples (3 replicates per depth interval) (Fig. 1), resulting in a dataset of a total of 84 composite samples.
2.2 Laboratory soil treatments
2.2.1 Determining common properties for volcanic soils
All 84 composite soil samples were dried at 40 ∘C until a constant weight was reached. The weight (g), the volume (cm3) and the bulk density (g cm−3) of the fine earth (<2 mm) were determined by dry sieving and water displacement of the coarse material (>2 mm). Soil reaction (pH value, (–)) was determined in water (1:2.5) and potassium chloride (1 : 2.5 0.01 M KCl) to determine the protons in the actual and potential liquid soil phase (FAL, 1996). Acid ammonium oxalate extractable Al, Fe and Si and pyrophosphate extractable Al and Fe were measured with an ICP device following the method of Blakemore et al. (1987). The concentrations of the volcanic clay minerals allophane and ferrihydrite were estimated by multiplying the Siox concentration by 6 and the Feox concentration by 1.7, respectively (Parfitt and Childs, 1988; Parfitt, 1990). The allophane and ferrihydrite contents were then summed up to determine the clay content (%) deriving from the oxalate extraction which is a typical measure for texture analysis in volcanic soils (Arnalds, 2015a).
2.2.2 Soil and soil organic carbon fractionation
A commonly used method for SOC fractionation is the one developed by Zimmermann et al. (2007) which produces four different functional carbon groups due to the expected reactivity of the SOC within the groups. We slightly modified the separation procedure, limiting the analysis to disaggregation, the particle size separation and the density fractionation to separate the SOC. The applied physical fractionation technique is suited to investigating the responses of SOC stability to land-use changes (Cambardella and Elliott, 1992; Six et al., 1998; Poeplau and Don, 2013; Hunziker et al., 2017).
The fractionation procedure determined the fine soil fraction (<2 mm) of the 84 composite samples. Initially, the samples were dispersed by an ultrasound treatment (22 J mL−1) in 150 mL deionized water to retrieve only primary organo-mineral complexes (Christensen, 2001). The samples were subsequently wet-sieved to 63 µm to separate the stable sand-sized aggregates and the unprotected particulate organic matter from the material <63 µm. The particulate organic material (POM) was separated from the denser organic material in the mineral-associated sand and aggregate fraction (heavy fraction; HF) by density fractionation (1.8 g cm−3, sodium polytungstate from Sometu) on the soil material (>63 µm). After separation, both fractions were washed with deionized water until the electrical conductivity of the rinse water reached <50 µS (Wagai et al., 2008).
In some cases, the pumice material around Mount Hekla has a density of about 1 g cm−3 (Arnalds, 2000), and some POM samples were contaminated with pumice material. We solved this problem by using a charged glass surface to separate the POM material from the pumice material (Kaiser et al., 2009). The electrostatically charged glass plate was set 2 to 5 cm above the stone plate on which the contaminated POM fraction was distributed and was slowly moved over the sample. The distance between the charged glass surface and soil particle surface was manually set due to the different sizes of POM and pumice material. The organic particles electrostatically attracted to the glass plate were visually checked for possible “contamination” by pumice material. In these cases, the pumice material was manually removed. The pumice material (<1.8 g cm−3) was transferred to the HF fraction.
The material which is smaller than 63 µm represents the SOC pool of the silt and clay size fraction which can also contain aggregates consisting of volcanic clay minerals. Further, after settling time, a sample of the suspension (<63 µm) was taken, filtered with a 0.45 µm filter and analysed for its dissolved organic carbon content (DOC). The value of the DOC concentration was used as an indicator of the ability of the sampled soils to leach dissolved organic carbon. Compared to Zimmermann et al. (2007), the present study did not conduct oxidation with sodium hypochlorite (NaOCl) to determine the resistant SOC pool. Hence, the present study did not measure the SOC in the NaOCl-resistant fraction (rSOC).
All samples of the bulk soil (<2 mm) and the POM, HF and <63 µm fractions were ball-milled and analysed for organic carbon content (%) by dry combustion (Leco CN 628 Elemental Determinator). The DOC content (mg L−1) was measured using a combustion analytic oxidation method (TOC-5000A, Shimadzu).
2.3 SOC stock estimation
The amount of soil organic carbon that is stored in a given soil profile is defined as the SOC stock and is given in tons per hectare. According to Ellert et al. (2008) and Rodeghiero et al. (2009), the SOC stock (SOCstock; t C ha−1) is a function of the soil's carbon content (SOCconc; mg g−1), the bulk density (BD<2 mm; g cm−3) of the fine soil fraction (<2 mm) and the investigated soil depth (d; cm). The conversion factor between the units is 100. The study calculated the amount of soil organic carbon which was stored in the fine soil fraction (<2 mm) within the top 30 cm according to the given formula:
SOC stocks stored in the SOC fractions were calculated after Poeplau and Don (2013) and Guidi et al. (2014).
3.1 Physical, chemical and morphological characteristics of the sampled soil intervals
The soil material sampled at all depth intervals was andic ( %) and therefore classified as Andosols (Table 2) (IUSS Working Group WRB, 2014). According to the Icelandic soil classification (Arnalds, 2008), freely drained soils under vegetation are termed Andosols and desert soils are classified as Vitrisols. The results of the present study confirmed that the sampled soils of the birch and grass stands are classified as Brown Andosols (1 %–12 % C and >6 % allophane) (Tables 1, 2). The calculated bulk densities of the fine earth material fractions were within the range of 0.3 to 0.8 g cm−3 of typical Icelandic Andosols (Arnalds, 2008). The severely degraded and unvegetated soils of Barren Land were classified as Vitrisols (Arnalds, 2015c) due to the relatively high pH values (>7.0; H2O). The pH values of the top 20 cm of these soils were significantly (p≤0.05) higher compared to those of the other tested categories. However, the soils of Barren Land contained more organic carbon and clay minerals than usually found in Vitrisols of Icelandic deserts (Table 1) (Óskarsson et al., 2004). At Barren Land, we found the highest concentrations of allophane and ferrihydrite clay minerals (Table 2). These high concentrations stand in contrast to the typically low concentration (2 %–5 %) found in desert Vitrisols (Arnalds, 2015d). Lilienfein et al. (2003) found an increase in allophane and ferrihydrite concentrations with increasing age of mudflow soils at Mt Shasta. Based on these findings, our results indicate that the soils at Barren Land are pedogenetically developed and the high carbon and clay contents found on Barren Land are more representative of severely degraded soils than Icelandic desert soils.
Table 1Values characterizing the vegetation types studied and sampled soil intervals for common soil properties. The median, minimum and maximum values (in parentheses) are given.
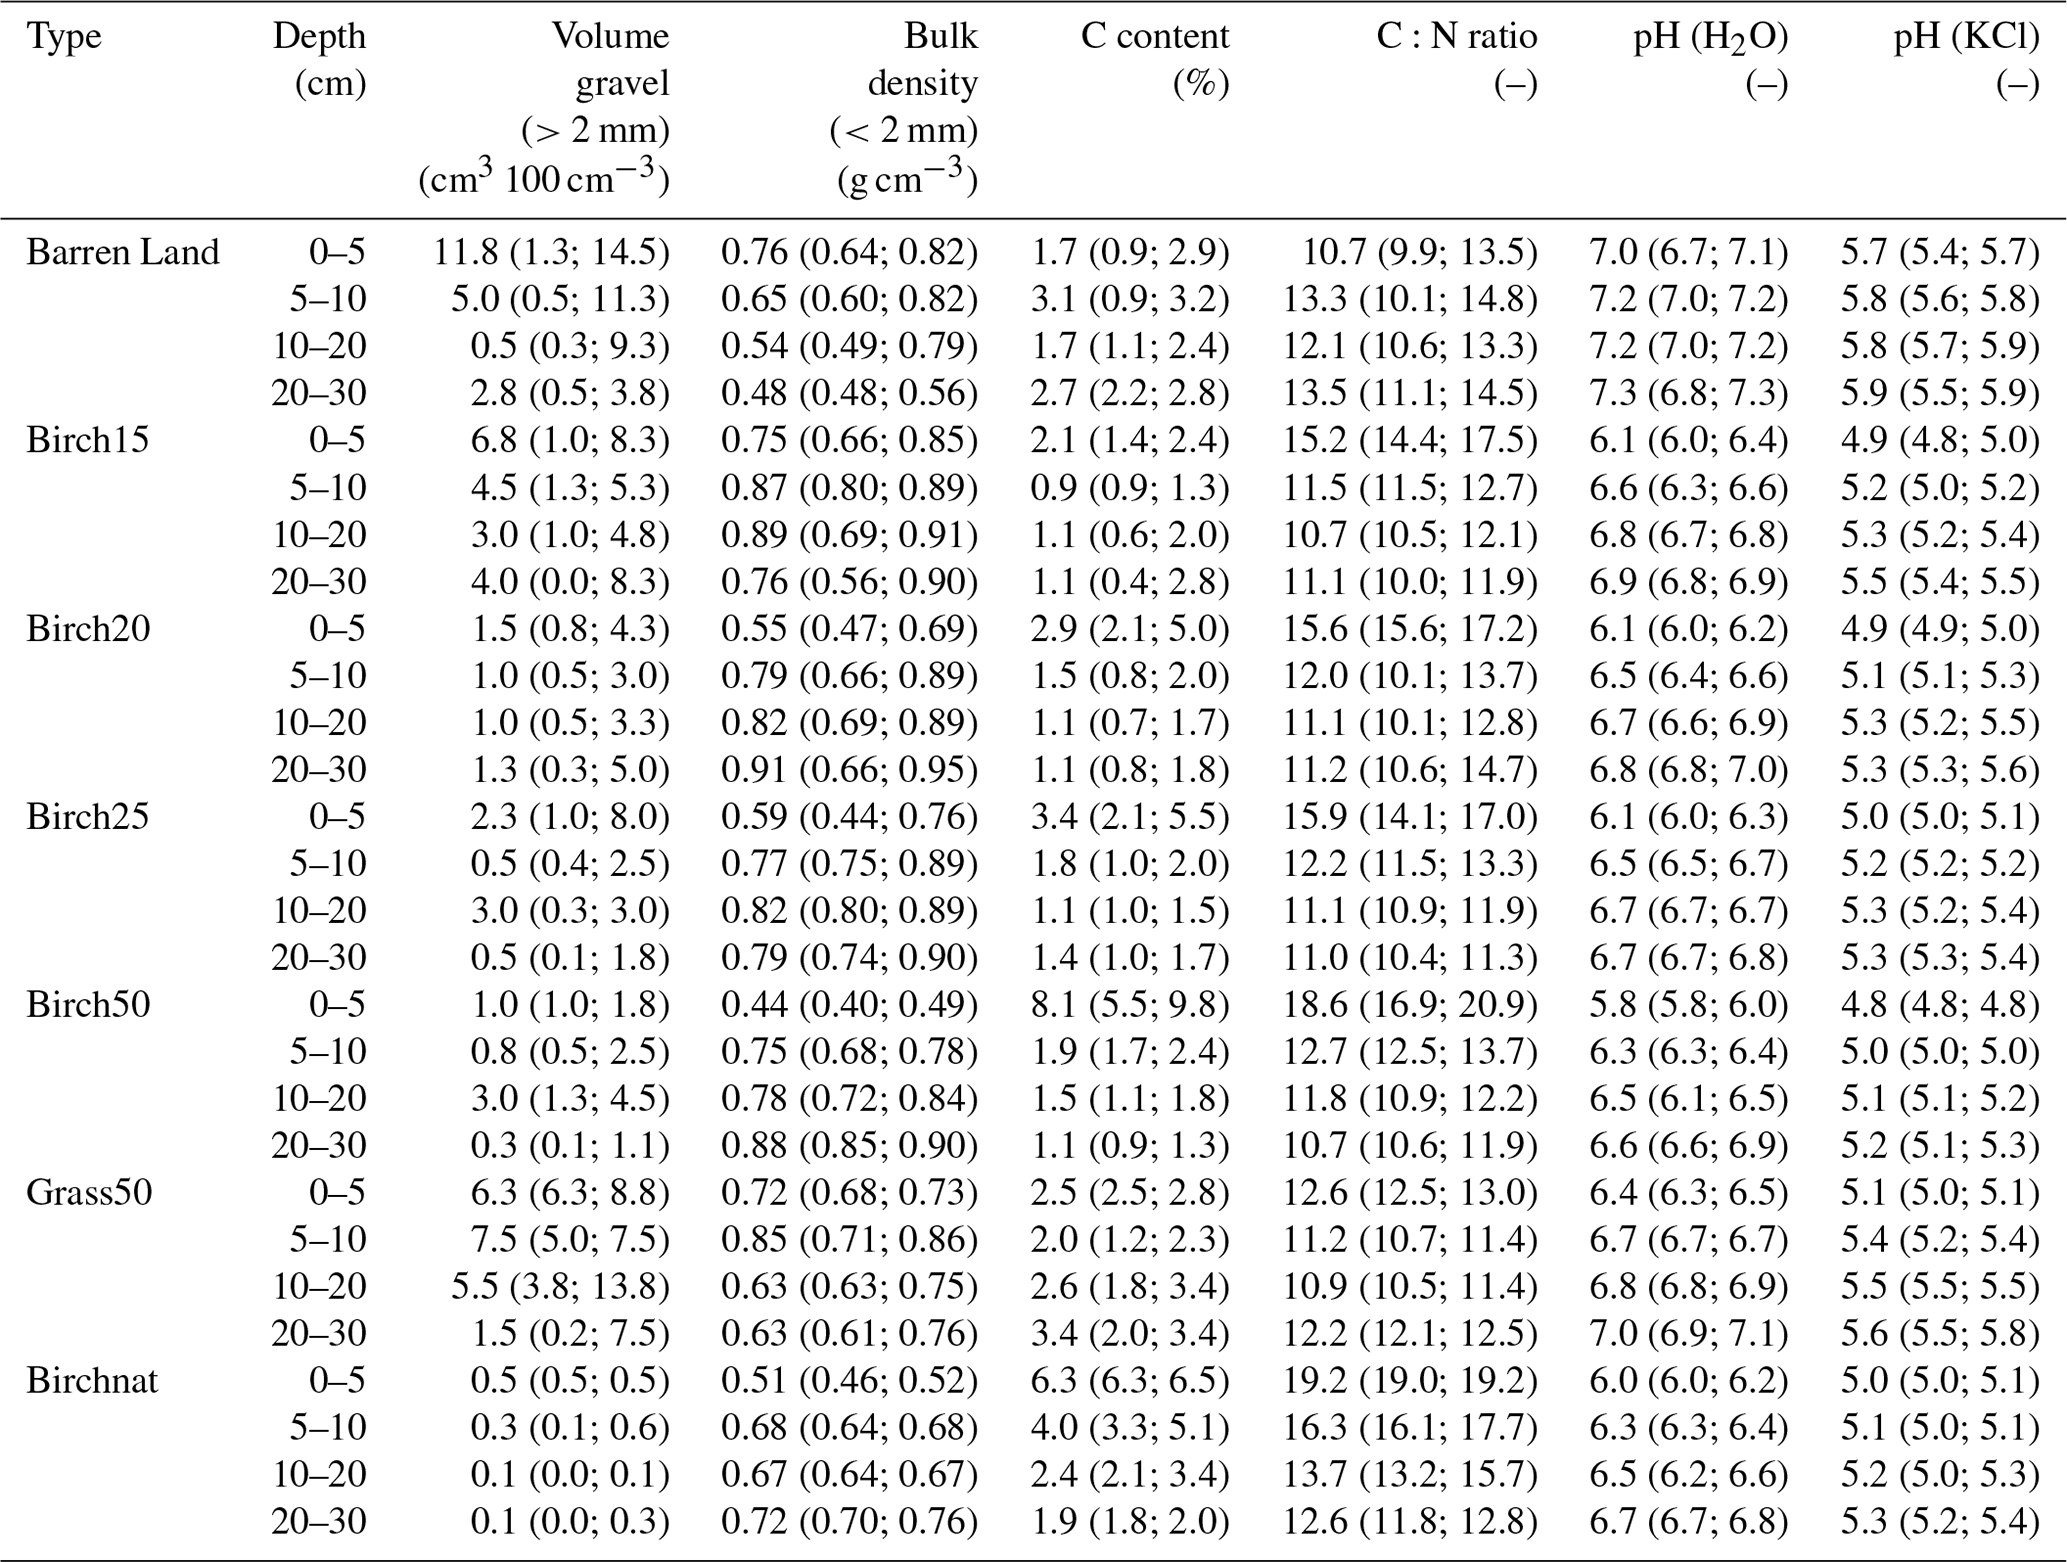
SOC concentrations varied between 0.6 % and 9.8 % within the whole dataset of the 84 samples (Table 1). Surprisingly, the lowest C contents were not found at the Barren Land sites as was expected; this is most likely due to the absent vegetation cover at the time of sampling. This finding supports the hypothesis that organic carbon was sequestered in the soil before the onset of soil erosion. Further, at the Barren Land, Grass50 and Birch15 sites, the SOC concentrations were higher in the deeper sampling intervals (5–30 cm) than at the shallow depths of 0–5 cm (Table 1). At the Barren Land, Grass50 and afforested Birch sites, the C:N ratios of the soil mostly varied between 10 and 14 (–). However, the ratio was considerably higher in the top 5 cm at Grass50 and significantly (p=0.05) higher at all tested birch categories compared to the soil at Barren Land. In deeper soil layers the differences were only significant (p=0.05) between Barren Land and Birchnat in sampling layer “5–10 cm” (Table 1). Hence, the soils at Birchnat also showed the highest C:N ratios with a maximum value of 19.2 (Table 1). These findings can be attributed to the presence of freshly deposited and less decomposed organic matter close to the surface ground at the vegetated sites. In contrast, the C:N ratio was slightly higher at deeper sampling intervals at Barren Land, which gives evidence that the carbon originates from past vegetation cover.
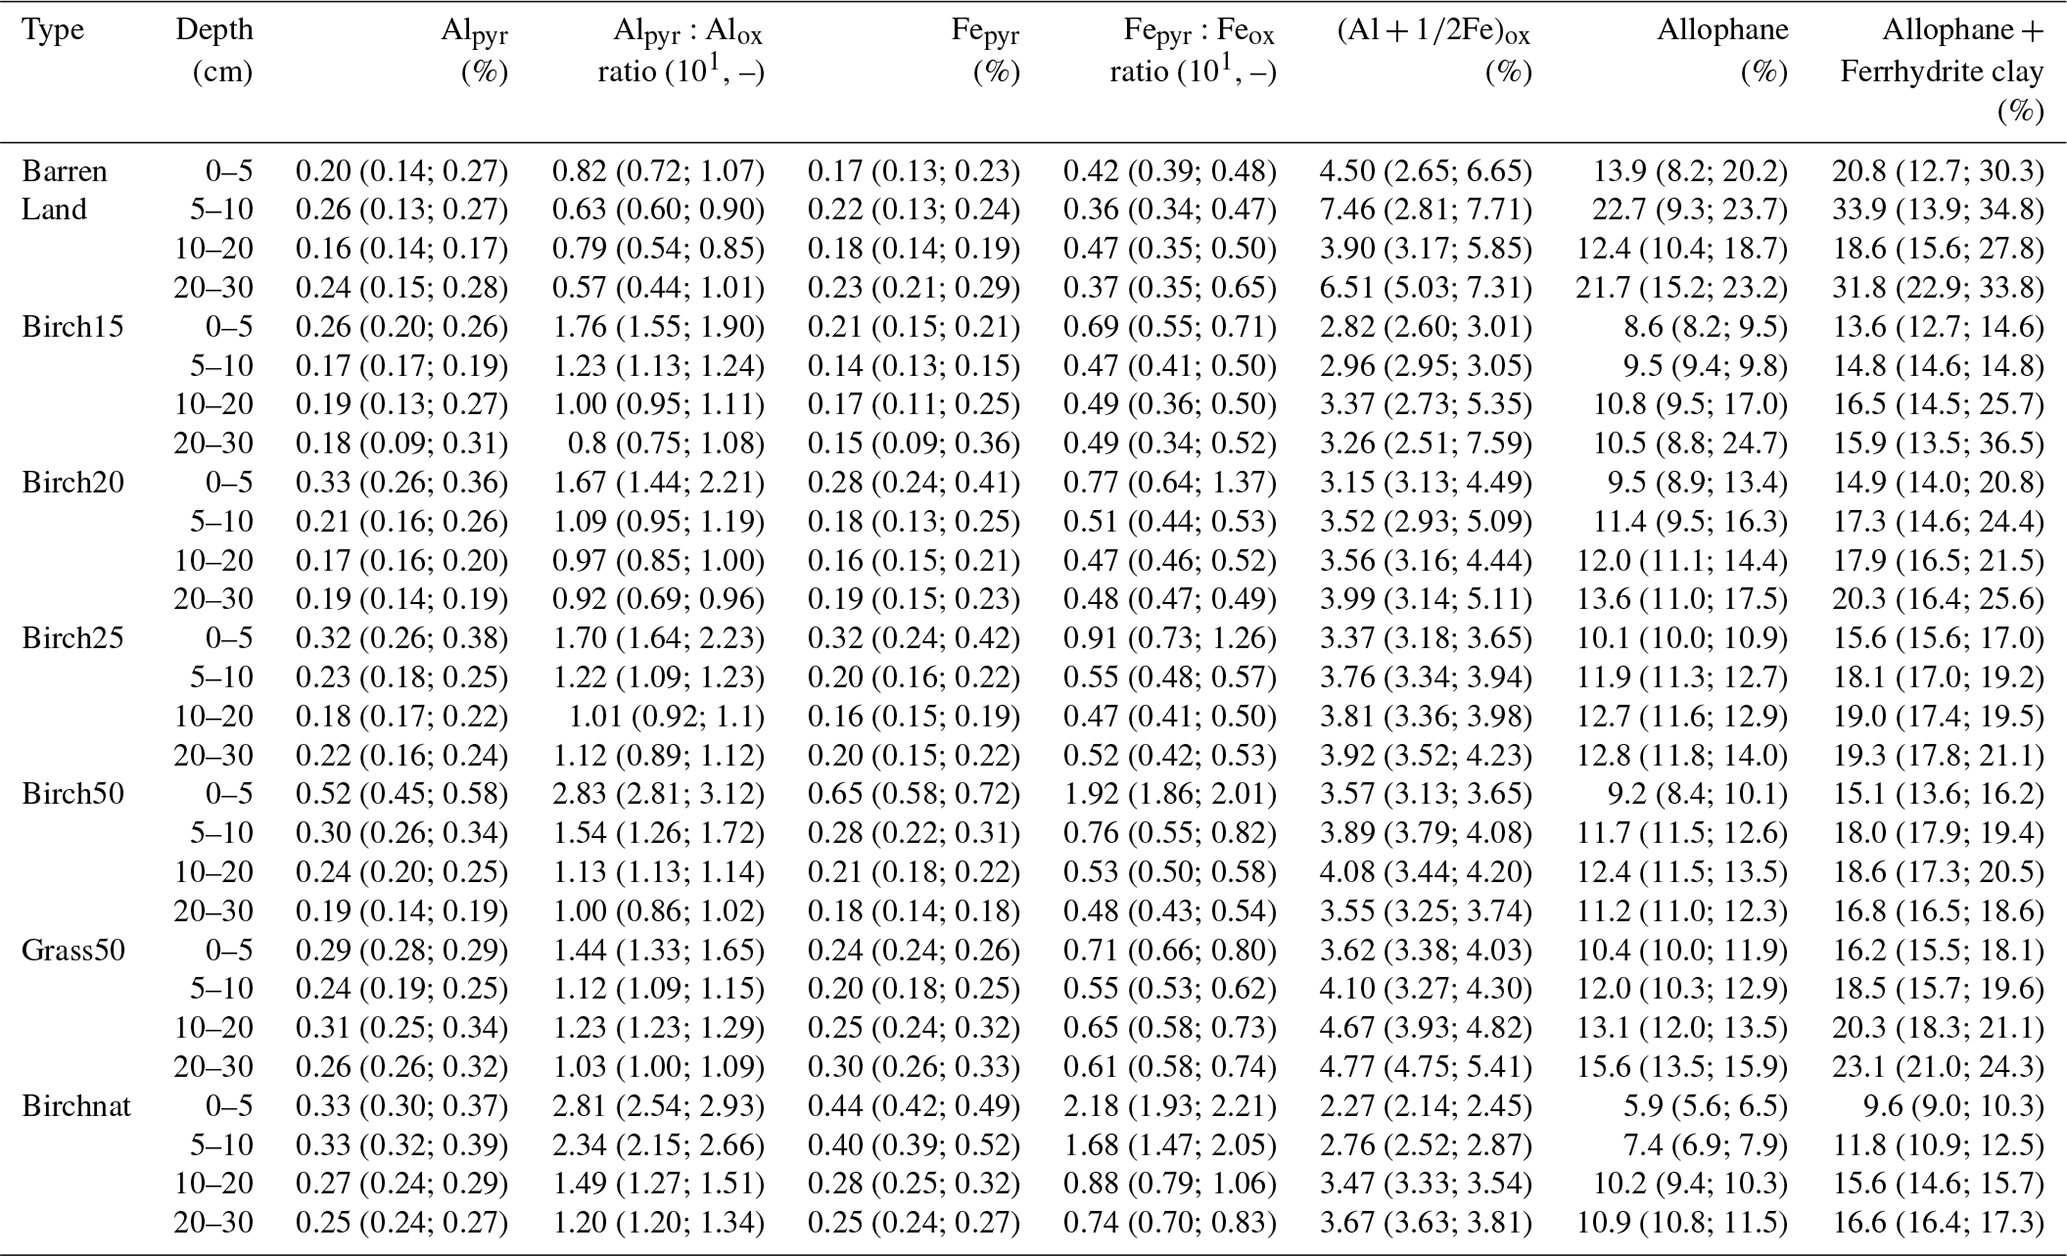
Table 2Volcanic soil properties of the studied vegetation types and sampled depth intervals. The median value and the minimum and maximum values (in parentheses) are given as above.
Based on the analysis of the C concentrations of the soil samples, the study showed that the unvegetated, severely degraded volcanic soils contained appreciable amounts of SOC. And further, afforestation with mountain birch increased the soil C concentration during the first 50 years of shrub establishment, predominantly in the top 10 cm. Further, the values of bulk density and SOC concentration are inversely proportional. Consequently, to further discuss the SOC sequestration potential of the soils studied, further detailed information on SOC stocks and SOC quality are needed, in addition to measurements of SOC concentration. Lastly, the unknown influence of the sampling depth also needs to be accounted for.
3.2 Afforestation seems to increase the SOC stock in the top 30 cm
In the present study, the initial state before afforestation starts is represented by the sites of Barren Land. The SOC stock (0–30 cm) at Barren Land (median value: 39 t C ha−1) is higher (p>0.05) than the SOC stocks at Birch15, Birch20 and Birch25. The present study found a continuous increase in the median SOC stock (0–30 cm) with birch stand age (Birch15: 31; Birch20: 33; Birch25: 36; Birch50: 46 t C ha−1) (Fig. 2). After 50 years of birch growth the SOC stock (0–30 cm) of Birch50 is significantly (p=0.05) higher than the SOC stocks of younger birch stands (Birch15, Birch20) or severely degraded soil (Barren Land) (Fig. 2). The given results of the SOC stocks (0–30 cm) might lead to the assumption that the soil acts as a C source during the first 25 years of the establishment of birch and that there is a carbon sink between after 25 years until 50 years of birch growth. This would be in accordance with Hunziker et al. (2017), who found a decline in the SOC stock (0–30 cm) during the first 40 years of green alder encroachment on former subalpine pastures. Another finding of the present study is that after 50 years of birch growth, the SOC stock was still significantly (p=0.05) lower than that of the old-growth woodlands of Birchnat (Δ15 t ha−1) (Fig. 2). This means that the soils at Birch50 can sequester additional organic carbon during the succession towards mature woodlands which reflects the equilibrium state. Overall, the results indicate that afforestation by mountain birch, and the establishment of birch woodlands, can significantly increase the SOC stock (0–30 cm) (Birch15–Birch50), which is in accordance with Icelandic studies given in the literature.

Figure 2Median soil organic carbon stocks (t C ha−1) in the mineral soil of the studied eroded (Barren Land), reclaimed (Grass50, Birch15, Birch20, Birch25 and Birch50) and old-growth (Birchnat) sites. The range of the error bars shows the minimum and maximum values. The different shadings indicate the four sampling depths (0–5 cm: diagonal lines; 5–10 cm: rectangular squares; 10–20 cm: b, w squares; 20–30 cm: vertical lines). Within a sampling depth, significant differences (Mann–Whitney U test, p≤0.05) between the age classes are indicated by different letters. Further, significant differences (Mann–Whitney U test, p≤0.05) between the total studied soil depth (0–30 cm) are shown above the stacked columns.
During the period between Birch15 and Birch50 (35 years), the sequestration rate is 0.42 t C ha−1 a−1 on average, without taking the SOC stock of Barren Land (as the status before afforestation begins) as a reference for calculation. The reason for this is given in the assumption that Barren Land contains a lot of SOC which does not originate from the revegetation process. The rate is lower than the given removal factor of 0.51 t C ha−1 a−1 for afforestation activities (Hellsing et al., 2016).
A literature review revealed that the succession of already vegetated heathland to birch woodland in eastern Iceland shows no change in C stocks (Ritter, 2007). The SOC stocks were about 40 t C ha−1 (0–20 cm) for 26- and 97-year old birch stands. Snorrason et al. (2002) found a higher SOC stock (0–30 cm) in a 54-year old birch stand (65 t C ha−1) compared to that of grassland (54 t C ha−1) at Gunnarsholt, which leads to the assumption that the effect of afforestation is more effective than that of revegetation concerning SOC sequestration. However, Snorrason et al. (2002) and Ritter (2007) did not report the initial SOC stock before the ecosystem change began. Soil development and natural vegetation succession on moraine till after glacial retreat are other typical processes of land-cover change in Iceland. Vilmundardóttir et al. (2015) found a SOC accumulation within the top 20 cm from 0.9 (initial status) and 13.5 t C ha−1 at sites with a maximum age of 120 years, thereby demonstrating that the process of vegetation succession on moraine till leads to an increase in soil carbon stock. Our results indicate that the change in SOC stocks during afforestation with mountain birch on severely degraded soils (Fig. 2) is comparable with those given for shrub encroachment in the cited literature.
Restoration by revegetation is another process of land-cover change in Iceland (Aradóttir et al., 2000; Arnalds et al., 2013). The present study compared the effects of afforestation and revegetation. Within 50 years, the revegetated sites (Grass50), which were restored by fertilizer and grass seeds, showed a median SOC stock 9 t C ha−1 higher compared to the soils of Birch50. This leads to the assumption that revegetation of severely degraded soils enhances the SOC stock (0–30 cm) more effectively than afforestation (Fig. 2). Aradóttir et al. (2000) and Snorrason et al. (2002) also studied revegetated grassland sites near Gunnarsholt showing a site history comparable to the grassland sites of the present study. Accordingly, Snorrason et al. (2002) reported a SOC stock (0–30 cm) of 54 t C ha−1, which is comparable with the SOC stocks of the present study. However, Aradóttir et al. (2000) found 28 t C ha−1 (0–20 cm) for a 46-year old grassland site, compared to the median value of 34 t C ha−1 (0–20 cm) for the present grassland sites.
The results of the SOC stocks within the commonly used soil depths of 30 cm of the tested categories indicate that the SOC pool decreases between Barren Land and 15-year old birch stands. It then increases during birch establishment to reach the level of naturally grown birch woodlands (Fig. 2). This pattern is comparable with other field studies (e.g. Goulden et al., 2011; Hunziker et al., 2017). However, the analysis of mineral SOC dynamics in such a temporally dynamic landscape, which results in unequal SOC and volcanic clay concentration patterns across the tested categories, calls for more detailed and alternative methods (Tables 1, 2). Thus, the present study further focused on the vertical distribution of the SOC and its quality to verify whether afforestation results in the soil becoming a C source and whether more C is sequestered during revegetation than afforestation.
3.3 SOC fractionation enhances our understanding of afforestation processes
3.3.1 Vertical resolution of SOC stocks
The vertical distribution of SOC concentrations (Table 1) and SOC stock at Grass50 with the sampled soil intervals showed clearly that the highest SOC stock (∼38 t C ha−1) is located between 10 and 30 cm (Fig. 2). The same patterns were found at Barren Land, which shows the unexpected but high importance of the SOC stock in deeper sampling intervals such as “10–20” and “20–30 cm”. Hence, two-thirds of the calculated SOC stock was found to be deeper than 10 cm at Grass50. This is not in accordance with the commonly observed vertical decrease in the SOC concentration (Jobbágy and Jackson, 2000). However, this is a typical pattern of volcanic soils which are also characterized by biologically active soil layers buried by ash from volcanic eruptions. Arnalds and Kimble (2001) observed similar patterns for soils with lag-gravel surfaces, which developed through intense frost heave of coarse material and aeolian deposition. Strachan et al. (1998), Snorrason et al. (2002) and Kolka-Jónsson (2011) confirm this inverse vertical SOC pattern in disturbed and undisturbed soil pedons in the same region as the present study. Therefore, this inversion of the SOC stock with depth seems to be a common feature of sandy soils in southern Iceland, and is the result of high volcanic activity, geomorphic processes and anthropogenic disturbances (Dugmore et al., 2009; Kolka-Jónsson, 2011; Arnalds, 2015e). Hence, Andosols generally consist of chronologically layered soil horizons with various amounts of organic carbon as well as different densities of gravel and fine earth material which substantially influence the vertical patterns of the SOC stock. Restoration activities and carbon accumulation derived from plant growth can start on such soil pedons in Iceland.
Icelandic desert soils and severely degraded soils generally contain a SOC stock ranging from 1 to 45 t C ha−1 before the application of any restoration activities (Óskarsson et al., 2004; Arnalds et al., 2013). The present study calculated a median SOC stock of 40 t C ha−1 (Fig. 2) for severely degraded soils, which is comparable with the higher SOC stock values given in the cited literature. This implies that the soils of Barren Land contain a certain amount of SOC due to earlier soil formation processes prior to disturbance and SOC accumulation, and which occurred before the soil profile was truncated by soil erosion processes. Nonetheless, the SOC stocks (0–30 cm) of Barren Land are significantly (p=0.05) lower than in soils under well-established and non-degraded ecosystems (Birchnat) (Fig. 2). The subdivision of the studied soil columns of 30 cm into four sampling intervals explains the higher SOC stocks at Barren Land and Grass50. This is due to the higher values in the intervals “10–20 cm” and “20–30 cm” compared to the afforested birch sites (Birch15–Birch50), which constitute older buried soils (Table 1, Fig. 2). The subdivision further characterizes the patterns found of SOC stock (0–30 cm) (Sect. 3.2), with the high SOC stocks (0–30 cm) at Barren Land and Grass50 being caused by the carbon pool located deeper than 10 cm soil depth. Under the given site conditions, it is questionable to apply the commonly used soil depth of 30 cm for SOC stock monitoring (Aalde et al., 2006) to sample SOC that originates from buried soils, as it distorts the effects of restoration activities in the results of SOC concentration and SOC stock. Based on this understanding, the SOC stocks (0–30 cm) do not reveal that afforestation caused a C loss during the first 25 years of mountain birch establishment at such severely degraded sites and that the effects of revegetation are more effective than those of afforestation by mountain birch within the first 50 years.
The analysis of C vertical distribution shows further that C concentration continuously increases in the top 10 cm during the establishment of birch woodland (Table 1) (Birch15–Birch50). Hence, the SOC stock increases by 10 t C ha−1 (p=0.05) and 3.5 t C ha−1 in the sampling intervals “0–5 cm” and “5–10 cm” during the same time interval, respectively (Fig. 2). Thus, afforestation by mountain birch on severely degraded volcanic soils is most distinct in the top 10 cm, which is comparable with the findings of Bárcena et al. (2014). However, the SOC stock (0–10 cm) of 50-year old birch woodlands is still lower (Δ5 t C ha−1; 16 %, p>0.05) than the stocks identified at the Birchnat sites. The SOC stocks (5–30 cm) of Birch50 significantly (p=0.05) differ from the SOC stocks of Birchnat (Fig. 2). This indicates that afforested stands can additionally accumulate SOC between 5 and 30 cm soil depth during their development to mature mountain birch stands after 50 years of birch growth. Major SOC sources are the incorporation of aboveground litter material into the soil phases and the root system of establishing and old-growth birch trees which is mostly situated in the top 30 cm (Hunziker et al., 2014).
The results indicate that spatial variability must be taken into account when analysing SOC of volcanic soils, especially when deeper than 10 cm, between the sampled sites and the tested categories (barren, birch, etc.). This is even more relevant in landscapes with past or recent erosion processes as soil-forming processes. Thus, the equality or comparability of the sites, except for the studied variable, is not ensured for space-for-time substitution sampling approaches under such circumstances as performed in the present study (Walker et al., 2010). Hence, it is misleading to use the selected Barren Land sites, which were selected at 4 km distance from the afforested sites (Birch15, Birch20, Birch25 and Birch50) and 15 km from Birchnat, as the initial status (t0) for discussing the effect of afforestation and calculating any SOC sequestration rates. Accordingly, the authors suggest using permanent plots and the application of long-term monitoring (Arnalds et al., 2013; Thorsson, 2019) or cumulative coordinate approaches (Rovira et al., 2015), which seem more appropriate for assessing changes in SOC characteristics on severely degraded soils.
3.3.2 Analysis of soil organic carbon quality
The net primary production (NPP) of a landscape is increased during afforestation. Hence, the supply of organic material to the soil is higher at shrubby sites compared to barren areas (e.g. Bjarnadottir et al., 2007). The mass of POM material can be taken as an indicator for this supply. In the present study, the change in the material supply leads to a significant (p=0.05) increase in the median mass of POM material (>63 µm and <1.8 g cm−3) in the top 30 cm of the soil, which was measured at Barren Land: 5; Birch15: 43; Birch20: 53; Birch25: 51; Birch50: 174 mg POM per gram soil. The sites at Birchnat contained 95 mg POM g−1 soil. The lower value at Birchnat (95 mg POM g−1 soil) compared to Birch50 (174 mg POM g−1 soil) can be explained by the lower productivity of Birchnat due to the already undergone self-thinning process during the forest development at Birchnat. Further, the revegetation to grassland (Grass50) showed distinctly lower median POM mass (24 mg g−1 soil) than Birch50. Significant (p=0.05) differences between the POM masses of Birch50 and Grass50 were found in the top three sampling layers. According to these results, it is hypothesized firstly that afforestation is a more effective restoration process than revegetation with grasses in terms of supplying organic material and hence carbon to the soil phases, and secondly, this supply increases exponentially during the establishment of afforested birch woodlands. However, this observation is inconsistent with the results of the unfractionated SOC stocks (0–30 cm) comparison (Sect. 3.2), which suggests that the conversion of eroded land into grassland is a more effective restoration approach. Thus, further explanations are needed to explain the characteristics of these high SOC pools.
Physical fractionation of the SOC further revealed that the SOC stocks at Grass50 consist mostly of carbon found in the “<63 µm” (73 %) and HF (16 %) fractions, respectively (Table 3). Only a minor part of the SOC stock originated from the POM fraction (3 t C ha−1). Our findings are confirmed by the results of Sollins et al. (1983), who studied C dynamics at four mudflow chronosequences at Mt Shasta in California and hence stated that the heavy fraction is an important C sink (37 %–72 % of the total C). The vertical resolution showed further that the amount of carbon stored in the “<63 µm” fraction became more dominant at deeper sampling intervals at Grass 50. Hence, the SOC stocks in the 10–20 and 20–30 cm layers were fed by SOC found in the “<63 µm” fraction (Figs. 2, 3); results of Barren Land showed the same pattern. At these sites, the SOC stock (Fig. 2) consisted mostly of carbon which was stored in the “<63 µm” (65 %) and HF (28 %) fractions, respectively (Table 3), which is in accordance with Sollins et al. (1983). This more detailed analysis of the depth-resolution SOC quality indicates that at Barren Land and Grass50 the SOC measured in deeper sampling intervals was sequestered in horizons during soil development historically. Later, these C-rich horizons of the palaeosoils were buried by aeolian transported material and then again exposed by soil erosion. This assumption of sampling material of palaeosoils is underlined by the highest allophane and ferrihydrite contents at Barren Land and Grass50 (Table 2) as a result of the weathering of soil minerals.
Table 3The SOC stocks (t C ha−1) at the 0–30 cm interval, explained by SOC fractions. The median value and the minimum and maximum values (in parentheses) are given.
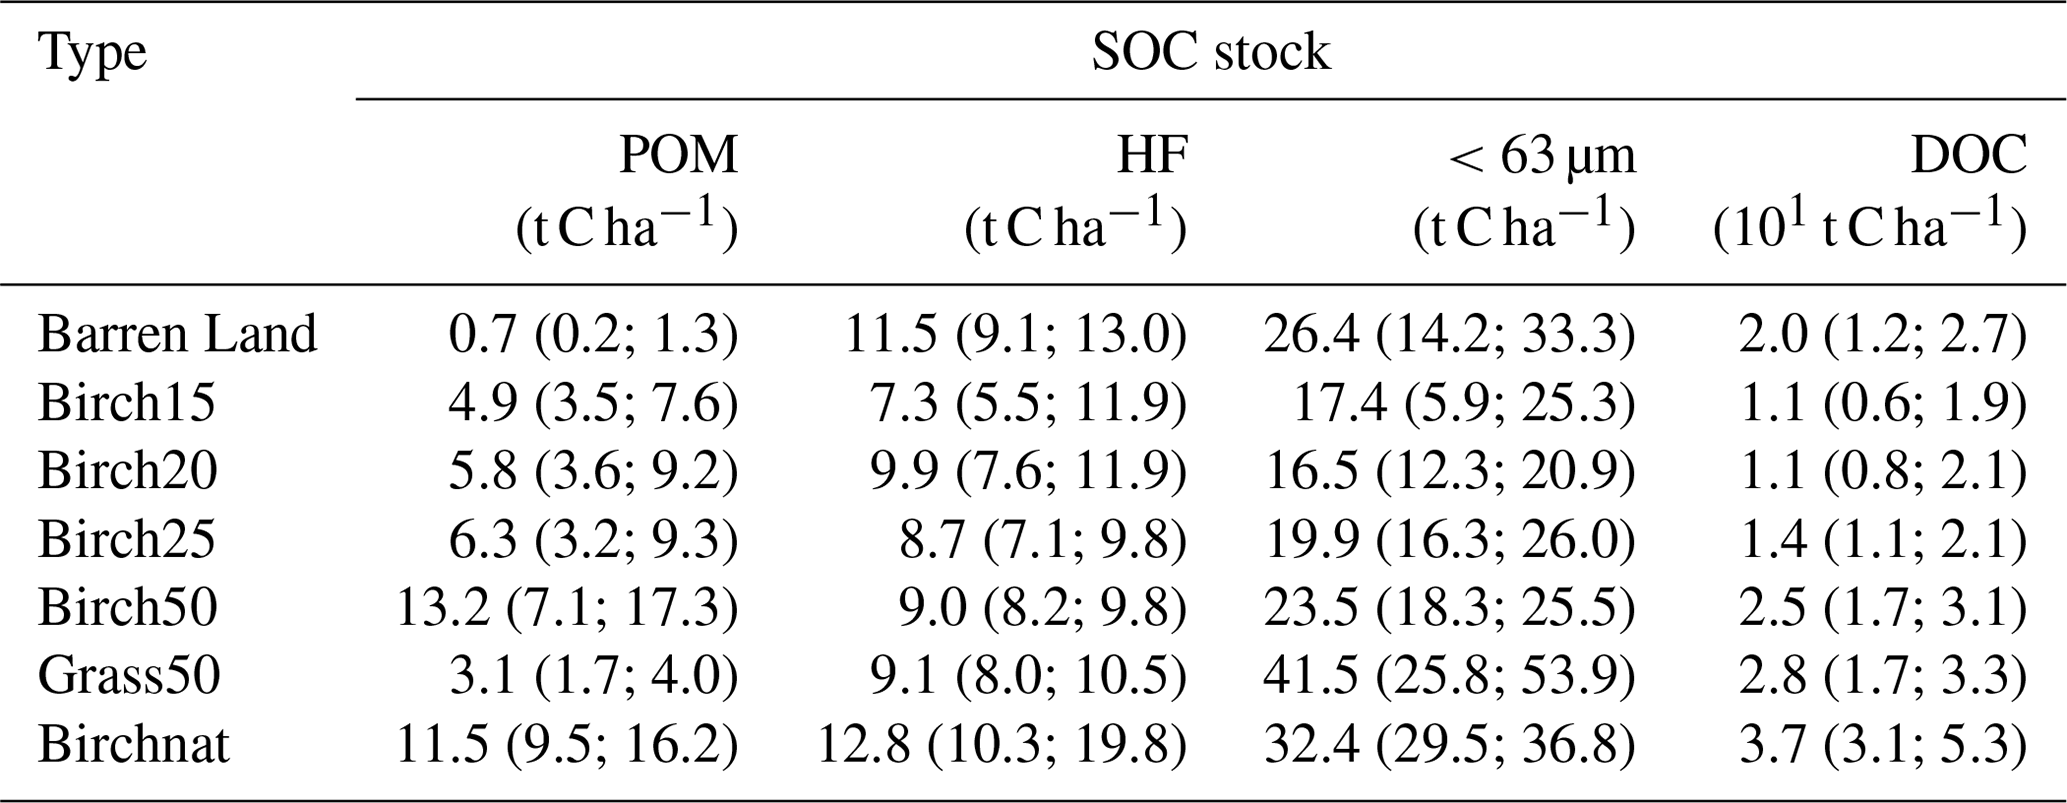

Figure 3SOC concentration (mg g−1) of the fraction POM (a, e, i, m), HF (b, f, j, n), “<63 µm” (c, g, k, o) and DOC (d, h, l, p) divided into the sampled soil depths (0–5, 5–10, 10–20 and 20–30 cm) for the reclaimed (Birch15, Birch20, Birch25, Birch50 and Grass50), eroded (Barren Land) and old-growth (Birchnat) sites. The boxes show the minimum, median and maximum values. Note the variable scale of the y axis.
The combination of a vertically divided soil sampling technique and the physical SOC fractionation showed that most of the SOC at Barren Land originated in soil material which was smaller than 63 µm at a soil depth deeper than 10 cm. Hence, the SOC which is found at severely degraded soils (Óskarsson et al., 2004; Arnalds et al., 2013) seems to be “old” buried SOC, or sedimented small-sized SOC, instead of deriving from the ongoing revegetation or succession process. This underlines the evidence that the SOC stocks measured deeper than 10 cm soil depth distort the SOC accumulation during restoration activities (previous section). Sites with such SOC patterns can therefore hardly be used as reference sites to explore the effect of restoration on SOC dynamics. The same assumption can be made for the SOC patterns at Grass50, which showed low values of POM mass and POM-C concentrations but high C concentrations in the “<63 µm” fraction. Thus, it is questionable whether the SOC by itself and the difference of 17 t C ha−1 between Barren Land and Grass50 are the result of the revegetation process. The physical fractionation revealed that the SOC found at Grass50 has rather originated from buried soil material than from revegetation. Based on this and the given results in the previous sections, it seems that afforestation is the more effective restoration process than revegetation, primarily due to the higher amount of POM material and POM-C found in the soils covered by mountain birch shrubs.
Turning eroded land into birch woodland led to a continuous increase in the SOC stock (0–30 cm) (Fig. 2). During afforestation, the increases between the median C stocks of the POM and “<63 µm” fractions were 8 (+163 %) (p=0.05) and 6 (+34 %) t C ha−1 between Birch15 and Birch50. These increases are explained by the increases in the “<63 µm”-C and POM-C concentrations during the afforested time span (Figs. 3, 4). During the same time span, the DOC concentration doubles. This is in accordance with Hunziker et al. (2017), who also found a doubling of the DOC concentration during the encroachment of subalpine pastures by green alder bushes. The SOC stock of the HF fraction seemed to stagnate at about 9 t C ha−1 during the same observation time (Table 3).

Figure 4Cumulated carbon concentrations (mg g−1) (0–30 cm) within the analysed SOC fractions for the reclaimed (Birch15, Birch20, Birch25, Birch50 and Grass50), eroded (Barren Land) and old-growth (Birchnat) sites. The boxes show the minimum, median and maximum values. Note the variable scale of the y axis.
According to the results of the present study (Fig. 2, Table 3, Fig. 4), afforestation by mountain birch on severely degraded soils increases the SOC stock, especially in the top 10 cm. However, this increase is accompanied by a higher SOC lability, which is indicated by the significant (p=0.05) increase in the POM concentration and the POM C stock as well as the increase in DOC concentration and the DOC stock (Table 3, Fig. 4) between Birch15 and Birch50. Our study also found a significant (p=0.05) increase in the “<63 µm”-SOC stock of 6 t C ha−1 between Birch15 and Birch50. This result can be attributed to a stabilization of the SOC due to its binding with the colloid fraction, which contains clay-sized minerals and organo-mineral complexes. However, the extraction of the material of the “<63 µm” fraction was only conducted by the physical separation technique of Zimmermann et al. (2007) due to the mineralogy of the samples. Hence, the chosen method in this study does not give information about the location of the organic matter in the “<63 µm” fraction and, consequently, the degree of the SOC stabilization.
3.4 SOC stabilization by volcanic clay minerals
Clay minerals found in volcanic soils, such as those found in Iceland, may play a key role in stabilizing soil organic carbon due to their amorphism, high degree of hydration, extensive specific surface area (200–1500 m2 g−1), and pH-dependent charge and the high reactivity (Torn et al., 1997; Basile-Doelsch et al., 2007; McDaniel et al., 2012; Arnalds, 2015a). The major stabilization mechanisms are either the formation of allophane– or ferrihydrite–humus complexes, which is favoured at pH >5.0, or the building of metal–humus complexes which are more effective at pH values lower than 5.0 (Arnalds, 2015a). The Alpyr:Alox and Fepyr:Feox ratios (Table 1) are used as an indicator of the occurrence of metal–humus complexes. The higher the ratio, the more clay minerals are bound to organic compounds, which suggests an increase in the SOC stabilization. In order to discuss stabilization processes of SOC found in the “<63 µm” fraction' with mineral clays (Sect. 3.3), we therefore considered the SOC concentration of the “<63 µm” fraction in Fig. 5.
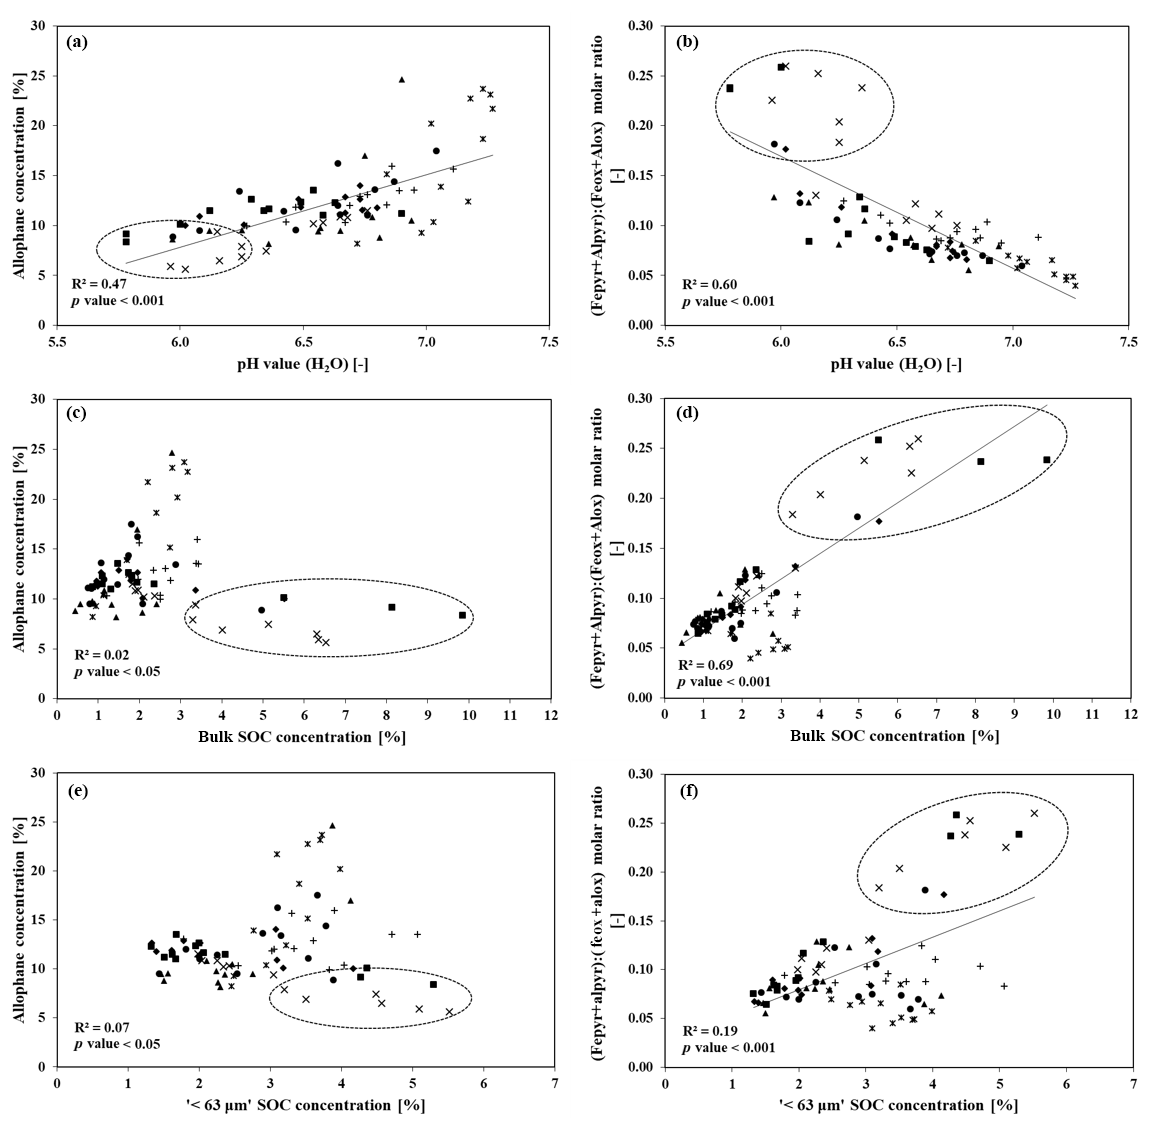
Figure 5Relationship between common properties of volcanic soils. The
charts show the allophane concentration (%) as a function of pH value
(H2O) (–) (a), unfractionated SOC concentration (%) (b) and
“<63 µm” SOC concentration (%) (c), as well as the amount
of Al and Fe, in the form of organo-mineral complexes
( molar ratio (–)), as a
function of pH value (H2O) (–) (d), unfractionated SOC concentration
(%) (e) and “<63 µm” SOC concentration (%) (f). The
observations (N=84) are labelled based on the vegetation types: Barren
Land (![]() ), Birch15 (▴), Birch20 (•), Birch25 (⧫), Birch50 (▪), Grass50 (+)
and Birchnat (×). The dotted circles
show all samples of Birchnat (0–5, 5–10 cm), all samples of Birch50 (0–5 cm) and one sample of Birch25 (0–5 cm).
), Birch15 (▴), Birch20 (•), Birch25 (⧫), Birch50 (▪), Grass50 (+)
and Birchnat (×). The dotted circles
show all samples of Birchnat (0–5, 5–10 cm), all samples of Birch50 (0–5 cm) and one sample of Birch25 (0–5 cm).
In general, the results showed a decline of the Alpyr:Alox and Fepyr:Alox ratios with soil depth for all tested categories (Table 2). Further, Birchnat and Birch50 showed the highest Alpyr:Alox and Fepyr:Feox ratios, while at Barren Land and Grass50, the lowest ratios were found (Table 2). The present study found a strong positive (r=0.68, p value < 0.001) correlation between the allophane concentration and the pH value and a strong negative (, p value < 0.001) correlation between the ratio and the pH value, respectively (Fig. 5a, b). These findings are in accordance with Arnalds (2015c). The allophane concentrations are highest in the soils which were unvegetated (Barren Land). On the other hand, the concentrations of Al and Fe bound to metal–humus complexes were highest in the top sampling intervals of sites with the longest vegetation covers (Birchnat, Birch50 and Birch25; dotted circle). Both correlations indicate a possible influence of the different stages of vegetation cover on the amounts of allophane and the ratio , respectively. This can be explained by the increase in protons resulting from vegetation processes in the soil, which leads to acidification and simultaneously a lowering of the pH value. Hence, the establishment of vegetation favours the formation of metal–humus complexes (Arnalds, 2008, 2015c).
The scatterplots comparing the allophane concentrations with the unfractionated SOC concentrations, as well as the “<63 µm” SOC concentrations, show no clear trends as most of the samples contained <4 % of unfractionated SOC or “<63 µm” SOC. The highest SOC concentrations were found in the upper sampling intervals at Birch25, Birch50 and Birchnat (dotted circles). However, the allophane content is lowest in these cases (dotted circle), which may be attributed to the fact that soil weathering and the formation of clay minerals takes longer than the allocation of soil organic carbon during birch growth. Regarding SOC sequestration during the reclamation of severely degraded land and soils, soil material of eroded and capped soil profiles most likely already passed through weathering processes and therefore contained a high amount of clay minerals. The fresh SOC originating from reclamation activities can be stabilized by the already existing clay minerals like allophane (Table 2, Fig. 5) and the carbon sequestration potential of these eroded soils may be relatively high (Arnalds et al., 2000; Ágústsdóttir, 2004).
The stabilization of the SOC in the form of metal–humus complexes seems to be hampered due to the relatively high measured pH values (Table 1), which were higher than the upper threshold value of 5.0 for the building of metal–humus complexes given in the literature (Fig. 5d, f). The pattern that the uppermost sampling intervals of the vegetated sites (dotted circle) are decoupled from the nested scatters was also observed in the relationship between the selected SOC pools (SOC concentration, “<63 µm” SOC concentration) and the organo-mineral complexes (Fig. 5d, f). The decoupled nested scatter shows an almost strong positive relationship (r=0.69, r2=0.48, p<0.05) between the “<63 µm” SOC concentration and the molar ratio (Fig. 5f). This observation of relatively high “<63 µm” SOC concentrations as well as relatively high molar ratio values indicates that the SOC in the “<63 µm” fraction might be sequestered as organo-mineral complexes in the upper sampling intervals at Birch25, Birch50 and Birchnat. In such cases, the formation of metal–humus complexes might comprise a reasonable stabilization process of the SOC in the “<63 µm” fraction (Fig. 5f). The regression analysis between the SOC and volcanic minerals indicates that during afforestation, the organic carbon is preferably stabilized in metal–humus complexes. It implies that this process starts to be an effective stabilization process for total SOC and “<63 µm” SOC after 20 years of birch growth and can occur in deeper sampling intervals in older birch stands.
This study aimed to evaluate the SOC sequestration potential of afforestation on severely degraded soils in southern Iceland due to the forecasted high potential of these soils. Afforestation with mountain birch leads to an increase in the SOC stock (0–30 cm) between the ages of 15 and 50 years. Since the 50-year birch stands still contained lower SOC stock than naturally old growth birch woodlands, it appears that the SOC stock equilibrium has not been reached yet. Consequently, afforestation with the native mountain birch species is a successful strategy to sequester atmospheric carbon severely degraded volcanic soils by about 20 t C ha−1. However, stored C is likely relatively labile with a disproportional rise in the POM fraction SOC (>63 µm, <1.8 g cm−3) compared to mineral-associated OC stored in the HF and “<63 µm” fractions, especially in the top 10 cm. Indeed, the proportion of the latter SOC fraction declined to just more than half of the SOC stock (0–30 cm) in the afforested plots as opposed to over 90 % in unvegetated soils, which resulted in remarkable SOC stocks. Consequently, much of the newly stored C may not be sequestrated at all but is probably prone to loss again in the event of future change in OM inputs. Our approach thus reveals that detailed measurements on the SOC quality are equally needed to appreciate the SOC sequestration potential of restoration activities on severely degraded volcanic soils, rather than only measuring SOC stocks. Lastly, we found that severely degraded volcanic soils are surprisingly variable in their SOC stocks, with often inverse SOC profiles resulting from an interplay between soil erosion and burial by ash from volcanic eruptions. This highly local occurrence of specific SOC depth profiles, even more so than normal, necessitates a depth-differentiated and SOC-fractionated approach to deduce SOC storage resulting from land-use changes.
The data that support the findings of this study are available by request from the corresponding author (Matthias Hunziker).
MH designed the sampling setup, did the soil sampling and led the lab analysis procedure. MH also did the statistics, prepared the manuscript with valuable contributions of the two co-authors OA and NJK and undertook the revisions during the review process. NJK provided the lab facilities and supervised MH during his PhD studies. OA was the project leader of the CarbBirch research project.
The authors declare that they have no conflict of interest.
This work contributes to the CarbBirch project funded by Orkuveita Reykjavikur and the work within the Nordic Centre of Advanced Research on Environmental Services (CAR-ES) and the Forest Soil C-sink Nordic Network (FSC-Sink). We want to thank our lab technician and friend Marianne Caroni, who sadly left us much too early, for her help and inspired discussions. We would also like to extend our gratitude to Ruth Strunk and Judith Kobler for their help in the laboratory during carbon and volcanic clay measurements. Nina Carle and Mathias Würsch helped during data gathering in the field and in the laboratory. Our sincerest thanks go to Gudmundur Halldorsson and the people of the Soil Conservation Service at Gunnersholt for their help and hospitality. Further, the authors gratefully acknowledge Vladimir Wingate for improving the grammar. The comments provided by Lorenzo Menichetti, Robert Qualls and Steven Sleutel are much appreciated.
This paper was edited by Steven Sleutel and reviewed by Lorenzo Menichetti and Robert Qualls.
Aalde, H., Gonzalez, P., Gytarsky, M., Krug, T., Kurz, W. A., Ogle, S., Raison, J., Schoene, D., Ravandranath, N. H., Eggleston, H. S., Buendia, L., Miwa, K., Ngara, T., and Tanabe, K.: Forest Land, in: IPCC Guidelines for National Greenhouse Gas Inventories Volume 4 Agriculture, Forestry and Other Land Use, IGES, Hayama, Kanagawa, Japan, 1–83, 2006.
Ágústsdóttir, A. M.: Revegetation of eroded land and possibilities of carbon sequestration in Iceland, Nutr. Cycl. Agroecosys., 70, 241–247, 2004.
Aradóttir, Á., Svavarsdóttir, K., Jonsson, T. H., and Gudbergsson, G.: Carbon accumulation in vegetation and soils by reclamation of degraded areas, Iceland Agr. Sci. 13, 99–113, 2000.
Aradóttir, Á. L.: Population biology and stand development of birch (Betula pubescens Ehrh.) on disturbed sites in Iceland, PhD Dissertation, Texas A&M University, Texas, 1991.
Aradóttir, Á. L.: Restoration of birch and willow woodland on eroded areas, in: Effects of Afforestation on Ecosystems, edited by: Halldorsson, G., Oddsdottir, E. S., and Eggertsson, O., Landscape and Rural Development, 67–74, TemaNord 2207:508 (c) Nordic Council of Ministers Copenhagen, 2007.
Aradottir, A. L. and Arnalds, O.: Ecosystem degradation and restoration of birch woodlands in Iceland, in: Nordic Mountain Birch Ecosystem, edited by: Wielgolaski, F. E., Man and the Biosphere Series, 293–308, UNESCO, Paris, 2001.
Aradòttir, À. L., Arnalds, O., and Archer, S. R.: Degradation of vegetation and soils (Hnignun grodurs og jardvegs), in: Græðum Island, Soil Conservation Service Yearbook 1991–1992, 73–82, Landgrædsla Ríkisins Reykjavik, 1992.
Aradóttir, Á. L., Petursdottir, T., Halldorsson, G., Svavarsdottir, K., and Arnalds, O.: Drivers of Ecological Restoration: Lessons from a Century of Restoration in Iceland, Ecol. Soc., 18, 33, https://doi.org/10.5751/ES-05946-180433, 2013.
Arnalds, O.: The Icelandic “rofabard” soil erosion features, Earth Surf. Proc. Land. 25, 17–28, 2000.
Arnalds, O.: Soils of Iceland, JÖKULL-Icel. J. Earth Sci. 58, 409–421, 2008.
Arnalds, O.: Dust sources and deposition of aeolian materials in Iceland, Iceland Agr. Sci. 23, 3–21, 2010.
Arnalds, O.: Andosols – Soils of Volcanic Regions (Chapter 5), in: The Soils of Iceland, Springer Netherlands, Dordrecht, 47–54, 2015a.
Arnalds, O.: Classification and the Main Soil Types (Chapter 6), in: The Soils of Iceland, Springer Netherlands, Dordrecht, 55–70, 2015b.
Arnalds, O.: Chemical Characteristics (Chapter 8), in: The Soils of Iceland, Springer Netherlands, Dordrecht, 91–105, 2015c.
Arnalds, O.: Genesis and Mineralogical Characteristics (Chapter 9), in: The Soils of Iceland, Springer Netherlands, Dordrecht, 107–117, 2015d.
Arnalds, O.: The Soils of Iceland, World Soils Book Series, Springer Netherlands, Dordrecht, 2015e.
Arnalds, O. and Kimble, J.: Andisols of deserts in Iceland, 65, 1778–1786, 2001.
Arnalds, O., Gudbergsson, G., and Gudmundsson, J.: Carbon Sequestration and Reclamation of Severely Degraded Soils in Iceland, Iceland Agr. Sci., 13, 87–97, 2000.
Arnalds, O., Orradottir, B., Aradottir, A. L.: Carbon accumulation in Icelandic desert Andosols during early stages of restoration, Geoderma, 193–194, 172–179, 2013.
Arnalds, O., Dagsson-Waldhauserova, P., and Olafsson, H.: The Icelandic volcanic aeolian environment: Processes and impacts – A review, Aeolian Res., 20, 176–195, 2016.
Árnason, G.: Uppblástur og eyðing býla í Landsveit [Erosion and degradation of farmland in Landsveit], in: Sandgræðslan, edited by: Sigurjónsson, A., Búnaðarfélag Íslands og Sandgræðsla ríkisins, 88–92, 1958.
Bárcena, T. G., Gundersen, P., and Vesterdal, L.: Afforestation effects on SOC in former cropland: oak and spruce chronosequences resampled after 13 years, Glob. Change Biol., 20, 2938–2952, 2014.
Basile-Doelsch, I., Amundson, R., Stone, W. E. E., Borschneck, D., Bottero, J. Y., Moustier, S., Masin, F., and Colin, F.: Mineral control of carbon pools in a volcanic soil horizon, Geoderma, 137, 477–489, 2007.
Bjarnadottir, B.: Carbon stocks and fluxes in a young Siberian larch (Larix sibirica) plantation in Iceland, PhD Dissertation, Lund University, Lund, 2009.
Bjarnadottir, B., Sigurdsson, B. D., and Lindroth, A.: Estimate of annual carbon balance of a young Siberian larch (Larix sibirica) plantation in Iceland, Tellus B, 59, 891–899, 2007.
Blakemore, L. C., Searle, P. L., and Daly, B. K.: Methods for Chemical Analysis of Soils, No. 80, Scientific Report, New Zealand Soil Bureau, 1987.
Cambardella, C. A. and Elliott, E. T.: Particulate Soil Organic-Matter Changes across a Grassland Cultivation Sequence, Soil Sci. Soc. Am. J., 56, 777–783, 1992.
Christensen, B. T.: Physical fractionation of soil and structural and functional complexity in organic matter turnover, Eur. J. Soil Sci., 52, 345–353, 2001.
Crofts, R.: Healing the Land: The story of land reclamation and soil conservation in Iceland, The Soil Conservation Service of Iceland, Gunnarsholt, 2011.
Dahlgren, R. A., Saigusa, M., and Ugolini, F. C.: The Nature, Properties and Management of Volcanic Soils, Advances in Agronomy, Vol. 82, 113–182, Academic Press, New York, 2004.
Delmelle, P., Opfergelt, S., Cornelis, J.-T., and Ping, C.-L.: Volcanic Soils, in: The Encyclopedia of Volcanoes, 1253–1264, Elsevier, San Diego, 2015.
Dugmore, A. J., Gisladóttir, G., Simpson, I. A., and Newton, A.: Conceptual Models of 1200 Years of Icelandic Soil Erosion Reconstructed Using Tephrochronology, J. N. Atl., 2, 1–18, 2009.
Ellert, B. H., Janzen, H. H., VandenBygaart, A. J., and Bremer, E.: Measuring Change in Soil Organic Carbon Storage, in: Carter, M. R. and Gregorich, E. G., Soil Sampling and Methods of Analysis, CRC Press, Boca Raton, 2008.
FAL: Schweizerische Referenzmethoden der Eidg. landwirtschaftlichen Forschungsanstalten. Band 2: Bodenuntersuchungen zur Standort-Charakterisierung, Eidg. Forschungsanstalten FAL, RAC, FAW, Zürich-Reckenholz, 1996.
Gabarrón-Galeote, M. A., Trigalet, S., and van Wesemael, B.: Effect of land abandonment on soil organic carbon fractions along a Mediterranean precipitation gradient, Geoderma, 249–250, 69–78, 2015.
Goulden, M. L., McMillan, A. M. S., Winston, G. C., Rocha, A. V., Manies, K. L., Harden, J. W., and Bond-Lamberty, B. P.: Patterns of NPP, GPP, respiration, and NEP during boreal forest succession, Glob. Change Biol., 17, 855–871, 2011.
Guidi, C., Magid, J., Rodeghiero, M., Gianelle, D., and Vesterdal, L.: Effects of forest expansion on mountain grassland: changes within soil organic carbon fractions, Plant Soil, 385, 373–387, 2014.
Halldórsson, G., Aradóttir, Á. L., Sigurðsson, B. D., Oddsdóttir, E. S., Hunziker, M., and Arnalds, O.: Kolbjörk – endurheimt birkivistkerfa og kolefnisbinding [CarbBirch – Ecosystem restoration and carbon sequestration], in: Vistheimt Á Íslandi, edited by: Aradóttir, A. L. and Halldórsson, G., Landbúnaðarháskóli Íslands og Landgræðsla ríkisins, 133–136, 2011.
Hellsing, V., Ragnarsdottir, A., Jonsson, K., Andresson, K., Johannsson, T., Guðmundsson, J., Snorrason, A., Thorsson, J., and Einarsson, S.: National Inventory Report 2016; submitted under the United Nations framework convention on climate change, emissions of greenhouse gases in Iceland from 1990 to 2014, Environmental Agency of Iceland, Reykjavik, 2016.
Hunziker, M., Caviezel, C., and Kuhn, N. J.: Shrub encroachment by green alder on subalpine pastures: Changes in mineral soil organic carbon characteristics, Catena, 157, 35–46, 2017.
Hunziker, M., Sigurdsson, B. D., Halldorsson, G., Schwanghart, W., and Kuhn, N.: Biomass allometries and coarse root biomass distribution of mountain birch in southern Iceland, Iceland Agr. Sci., 27, 111–125, 2014.
IUSS Working Group WRB: World Reference Base for Soil Resources 2014 (World Soil Resources Reports No. 106), FAO, Rome, 2014.
Jobbágy, E. G. and Jackson, R. B.: The vertical distribution of soil organic carbon and its relation to climate and vegetation, Ecol. Appl., 10, 423–436, 2000.
Kaiser, M., Ellerbrock, R. H., and Sommer, M.: Separation of Coarse Organic Particles from Bulk Surface Soil Samples by Electrostatic Attraction, Soil Sci. Soc. Am. J., 73, 2118–2130, 2009.
Kolka-Jónsson, P.: Carbon sequestration and soil development under mountain birch (Betula pubescens) in rehabilitated areas in southern Iceland, MSc thesis, Ohio State University, 2011.
Lilienfein, J., Qualls, R. G., Uselman, S. M., and Bridgham, S. D.: Soil formation and organic matter accretion in a young andestic chronosequence at Mt. Shasta, California, Geoderma, 116, 249–264, 2003.
McDaniel, P. A., Lowe, D. J., Arnalds, O., and Ping, C.-L.: Andisols, in: Handbook of Soil Sciences, edited by: Huang, P. M., Li, Y., and Sumner, M. E., 2nd Edn., CRC Press (Taylor & Francis), Boca Raton, FL, 33.29–33.48, 2012.
Ministry for the Environment: Iceland's climate change strategy, Reykjavik, 2007.
Óskarsson, H., Arnalds, Ó., Gudmundsson, J., and Gudbergsson, G.: Organic carbon in Icelandic Andosols: geographical variation and impact of erosion, Catena, 56, 225–238, 2004.
Parfitt, R.: Allophane in New Zealand – a review, Aust. J. Soil Res., 28, 343–360, 1990.
Parfitt, R. and Childs, C.: Estimation of forms of Fe and Al – a review, and analysis of contrasting soils by dissolution and Mossbauer methods, Soil Res., 26, 121–144, 1988.
Poeplau, C. and Don, A.: Sensitivity of soil organic carbon stocks and fractions to different land-use changes across Europe, Geoderma, 192, 189–201, 2013.
Ritter, E.: Carbon, nitrogen and phosphorus in volcanic soils following afforestation with native birch (Betula pubescens) and introduced larch (Larix sibirica) in Iceland, Plant Soil, 295, 239–251, 2007.
Rodeghiero, M., Heinemeyer, A., Schrumpf, M., and Bellamy, P.: Determination of changes in soil carbon stocks, in: Soil Carbon Dynamics: An Integrated Methodology, edited by: Kutsch, W. L., Bahn, M., and Heinemeyer, A., Cambridge University Press, Cambridge, 49–75, 2009.
Rovira, P., Sauras, T., Salgado, J., and Merino, A.: Towards sound comparisons of soil carbon stocks: A proposal based on the cumulative coordinates approach, Catena, 133, 420–431, 2015.
Schmidt, M. W. I., Torn, M. S., Abiven, S., Dittmar, T., Guggenberger, G., Janssens, I. A., Kleber, M., Kögel-Knabner, I., Lehmann, J., Manning, D. A. C., Nannipieri, P., Rasse, D. P., Weiner, S., and Trumbore, S. E.: Persistence of soil organic matter as an ecosystem property, Nature, 478, 49–56, 2011.
Sigurdsson, B. D. and Snorrason, A.: Carbon sequestration by afforestation and revegetation as a means of limiting net-CO2 emissions in Iceland, Biotechnol. Agron. Soc., 4, 303–307, 2000.
Six, J., Elliott, E. T., Paustian, K., and Doran, J. W.: Aggregation and Soil Organic Matter Accumulation in Cultivated and Native Grassland Soils, Soil Sci. Soc. Am. J., 62, 1367–1377, https://doi.org/10.2136/sssaj1998.03615995006200050032x, 1998.
Six, J., Conant, R. T., Paul, E. A., and Paustian, K.: Stabilization mechanisms of soil organic matter: Implications for C-saturation of soils, Plant Soil, 241, 155–176, 2002.
Smith, D. M., Larson, B. C., Kelty, M. J., and Ashton, P. M. S.: The practice of silviculture: applied forest ecology, 9th Edn., Wiley, New York, 1997.
Snorrason, A.: Global Forest Resources Assessment 2010, Country Report Iceland, FAO, Rome, 2010.
Snorrason, A., Sigurdsson, B. D., Gudbergsson, G., Svavarsdottir, K., and Jonsson, T. H.: Carbon sequestration in forest plantations in Iceland, Iceland Agr. Sci., 15, 81–93, 2002.
Sollins, P., Spycher, G., and Topik, C.: Processes of soil organic matter accretion at a mudflow chronosequence, Mt Shasta, California, Ecology, 64, 1273–1282, 1983.
Stewart, C. E., Paustian, K., Conant, R. T., Plante, A. F., and Six, J.: Soil carbon saturation: concept, evidence and evaluation, Biogeochemistry, 86, 19–31, 2007.
Strachan, I. B., Arnalds, Ó., Pálmason, F., Thorgeirsson, H., Sigurdsson, B. D., Sigurdardóttir, H., and Novoselac, G.: Soils of the Gunnarsholt experimental plantation, Iceland Agr. Sci., 12, 15–26, 1998.
Thorarinsdottir, E. F. and Arnalds, O.: Wind erosion of volcanic materials in the Hekla area, South Iceland, Aeolian Res., 4, 39–50, 2012.
Thorsson, J.: Carbon sequestration rates in Icelandic land-reclamation sites, in preparation, 2019.
Torn, M. S., Trumbore, S. E., Chadwick, O. A., Vitousek, P. M., and Hendricks, D. M.: Mineral control of soil organic carbon storage and turnover, Nature, 389, 170–173, 1997.
Trigalet, S., Gabarrón-Galeote, M. A., Van Oost, K., and van Wesemael, B.: Changes in soil organic carbon pools along a chronosequence of land abandonment in southern Spain, Geoderma, 268, 14–21, 2016.
Vilmundardóttir, O. K., Gísladóttir, G., and Lal, R.: Soil carbon accretion along an age chronosequence formed by the retreat of the Skaftafellsjökull glacier, SE-Iceland, Geomorphology, 228, 124–133, 2015.
von Lützow, M., Kögel-Knabner, I., Ludwig, B., Matzner, E., Flessa, H., Ekschmitt, K., Guggenberger, G., Marschner, B., and Kalbitz, K.: Stabilization mechanisms of organic matter in four temperate soils: Development and application of a conceptual model, J. Plant Nutr. Soil Sc., 171, 111–124, 2008.
Wagai, R., Mayer, L. M., Kitayama, K., and Knicker, H.: Climate and parent material controls on organic matter storage in surface soils: A three-pool, density-separation approach, Geoderma 147, 23–33, 2008.
Walker, L. R., Wardle, D. A., Bardgett, R. D., and Clarkson, B. D.: The use of chronosequences in studies of ecological succession and soil development, J. Ecol., 98, 725–736, 2010.
Zimmermann, M., Leifeld, J., and Fuhrer, J.: Quantifying soil organic carbon fractions by infrared-spectroscopy, Soil Biol. Biochem., 39, 224–231, 2007.