


Abstract
The cosmic-ray (CR) positrons and antiprotons are often regarded as the collision products of CR nucleons with the interstellar medium. However, the predicted fluxes of CR positrons and antiprotons by the conventional models are not consistent with the experimental data from PAMELA, Fermi-LAT, AMS-02, etc. In this work, we choose the latest AMS-02 data to analyze the astrophysical background of CR positrons and antiprotons. QGSJET-II-04 is chosen as the hadronic interaction model. The GALPROP package is used to solve the propagation equation numerically. The results show that the predicted flux of CR positrons at low energies is consistent with AMS-02 data in the reacceleration and convection–diffusion (DCR) model. In the DCR model and the hadronic interaction model, QGSJET-II-04, the excess of CR antiprotons at low energies is excluded. The dark matter interpretation of the positron excess is analyzed with the total fluxes of CR electrons and positrons from AMS-02. The predicted best-fit mass of dark matter ranges from 400 GeV to 4 TeV. Moreover, in the above models the predicted flux of CR protons is completely consistent with AMS-02 data, which matches the hardening feature above 330 GeV.
Export citation and abstract BibTeX RIS
1. Introduction
In the origin of Galactic cosmic rays (CRs), the primary particles, such as nucleons and electrons, are commonly regarded as the injection of supernova relics (SNRs), in which CRs are accelerated by the diffusive shock (DSA; Fermi 1949; Krymskii 1977; Blandford & Ostriker 1978; Drury 1983; Blandford & Eichler 1987). In the DSA mechanism, the basic feature of the injection spectra is a power law, which is verified by the experimental data (Amenomori et al. 2008). The other particles, called the secondary CRs, are mainly produced in the collision between the primary particles and the interstellar medium in the Galaxy. The secondary CRs also belong to the astrophysical background. The fluxes of the secondary CRs are positively relevant to the collision cross sections, which are often calculated with the hadronic interaction models. Since the spectra of the primary CRs are a single power law, the calculated spectral features of the secondary CRs derive from the hadronic interaction models. Besides the hadronic interaction models, the exclusive cross section of the produced particles is also calculated with the empirical parameterizations of the Accelerator data. In practice, these calculations are developed into a parameterization model package, such as FLUKA (Ferrari et al. 2005; Bohlen et al. 2014), QGSJET-II-04 (Ostapchenko 2010), EPOS-LHC (Pierog et al. 2015), etc. In this work, QGSJET-II-04 is chosen to calculate the antiproton production.
When propagating in the Galaxy, the charged particles of CRs may be accelerated via the interaction with the turbulent interstellar magnetic field. The processes are often called reacceleration, in contrast to DSA. CRs also carry out the energy loss when propagating in the Galactic winds, which are blowing outward from the Galactic disk. This is called convection in CR propagation models. Besides the Galactic diffusion of CRs, the gain and loss of CR energy shape the original structure of the spectra of CRs. Thus, the calculated spectra of the secondary particles are relevant to the propagation models of CRs. In the conventional model, CR production and propagation are governed by the same mechanism below 1017 eV. CR propagation is often described by the diffusion equation (Berezinskii et al. 1990). The spectra of the secondary particles are calculated with the solution of the propagation equation. The parameters of the propagation equation involve the diffusion zone, reacceleration velocity, convection velocity, etc., which are summarized as the propagation model and constrained by the experimental data.
Recently, AMS-02 has reported their observed results of CRs. The spectra of CR protons are described by the high-precision data (Aguilar et al. 2015a). CR positrons (Aguilar et al. 2014b), antiprotons (Aguilar et al. 2016a), and the boron to carbon flux ratio (B/C) (Aguilar et al. 2016b) also have precise measurements. In a previous analysis (Jin et al. 2015a), we performed a global analysis of the propagation parameters with the AMS-02 data. The propagation parameters are well determined by the only CR proton and B/C data from AMS-02. The strategy of fitting parameters is different from the two ratios of CRs, such as Be10/Be9 and B/C. This situation originates from the high-precision data of CR protons from AMS-02. The high precision of CR proton spectra makes the spectral structure sensitive to the propagation parameters, such as the diffusion half-height Zh and coefficient D0. The combination of CR proton flux plus B/C ratio breaks the degeneracies between those parameters, which are often done by the ratio data, such as Be10/Be9 and B/C. As a result, at the 95% confidence level (C.L.), the constrained parameters are in a narrower range than the Be10/Be9 and B/C cases. The details are found in Figure 1 of Jin et al. (2015a). When the propagation parameters constrained by the measured data of the primary CRs are ready, the fluxes of secondary particles are predicted in the given interaction models.

Figure 1. In the conventional and QGSJET-II-4 models, the Z-factors are calculated for the secondary antiproton (left) and positron (right) based on a broken power-law spectrum of the primary particles. Expression (13) fitting to the QGSJET-II-4 model is denoted  . In the left panel, as a comparison, the line relevant to a simple power law is drawn and the legend is relative to Expression (13).
Download figure:
Standard image High-resolution imageSince the spectra of the secondary particles, such as CR positrons (Aguilar et al. 2014b) and antiprotons (Aguilar et al. 2016a), have the measured data with high precision, the calculated spectra are used to verify the propagation models and the hadronic interaction models and explore the origin of the experimental data. The positron excess has been discovered by PAMELA (Adriani et al. 2010a), Fermi-LAT (The Fermi-LAT Collaboration et al. 2011), and AMS-02 (Accardo et al. 2014) in the past years, which indicate that above about 10 GeV the measured fluxes of CR positrons are greater than the astrophysical fluxes predicted by CR propagation models and the hadronic interaction models. The phenomenological implications can be found in Jin et al. (2013, 2015a), Liu et al. (2013), Chen et al. (2015b), and Zhou et al. (2016). However, when the experimental data below about 10 GeV are focused, the calculated fluxes of CR positrons and antiprotons are also both consistent incompletely with the experimental data. In detail, the flux of CR positrons is greater than the measured data, and the flux of antiprotons is less. In Trotta et al. (2011) the fluxes of the CR positrons and antiprotons have been predicted from a global Bayesian analysis by using the GALPROP package (Strong et al. 2000). The authors of Trotta et al. (2011) indicate that the underpredicted antiprotons may result from a general feature of the reacceleration models. In Trotta et al. (2011) the hadronic interaction model of the CR antiproton product is from the parameterizations of Tan & Ng and Duperray et al. (Trotta et al. 2011), which is often called the conventional model. That is the default in the GALPROP package (Strong et al. 2000). Thus, when the above inconsistency is explored, the alternative propagation models and hadronic interaction models obviously need to be considered.
In Kachelriess et al. (2015), the authors have compared the antiproton yields in the hadronic collision with the conventional model, QGSJET-II-04 (Ostapchenko 2010), and EPOS-LHC (Pierog et al. 2015). Below 10 GeV the antiproton yield in the conventional model is less than in the other models. Moreover, in the ranges from 10 to 100 GeV, the antiproton yield in EPOS-LHC is greater than in the conventional model and QGSJET-II-04. As above 10 GeV the flux of CR antiprotons measured by AMS-02 has no distinct excess, in QGSJET-II-04 the antiproton yield is moderate from the low to high energies. In this work QGSJET-II-04 is chosen as the hadronic interaction model to enhance the flux of CR antiprotons at low energies. We have modified the codes relevant to the antiproton product with QGSJET-II-04 in the GALPROP package (Strong et al. 2000). In Kachelriess et al. (2015), QGSJET-II-04 has been parameterized as the Z-factors, which express the secondary particle yield more directly than the collision cross section between the particles. We have also calculated the Z-factors of the antiproton and positron for the conventional model and recalculated the Z-factors for QGSJET-II-04 with the CRMC package (Baus 2015; Pierog et al. 2015).
In this work, the alternative propagation models involve the following changes. First, the convections of the Galactic CRs are both taken into account to make up the reacceleration and convection–diffusion model (DCR) instead of the conventional reacceleration diffusion model (DR). second, in the source terms of the propagation equation, the injection spectra of the primary particles are characterized by a continuous function in the referred rigidity, which express analytically a simple power law with the same indices below/above the referred rigidity. The expression was used in the feature analysis of the measured spectra of CRs from Voyager (Stone et al. 2013; Corti et al. 2015). The propagation equation of CRs is solved numerically with the modified GALPROP package (Strong et al. 2000). The effect of the solar modulation of CRs is calculated with the model of force-field approximation (Gleeson & Axford 1968).
Based on the above alternative propagation model and hadronic interaction model, the fluxes of the CR positrons and antiprotons are calculated in the DR and DCR models. In the DR model, instead of the hadronic interaction model with QGSJET-II-04, the underpredicted flux of CR antiprotons has been enhanced to be consistent with the AMS-02 data (Aguilar et al. 2016a). Obviously, the antiproton yield of CRs depends on the hadronic interaction model. In Winkler (2017), based on the experimental data of NA49 (Anticic et al. 2010; Baatar et al. 2013), the author has updated the calculation of CR antiproton background from a previous paper (Kappl & Winkler 2014). The calculated fluxes of CR antiprotons are the same as (Kappl & Winkler 2014) or slightly more than (Winkler 2017) the AMS-02 data at low energies. Kappl & Winkler (2014) also indicate that in the absence of experimental data relevant to the low-energy proton collisions, the antiproton production is in the uncertainties. In the future, the experimental data at low energies will decrease the uncertainties and give the interpretation of the underpredicted flux of CR antiprotons.
However, for CR positrons, the alternative hadronic interaction model, QGSJET-II-04, does not decrease simultaneously the flux of CR positrons below 10 GeV. We have recalculated the Z-factors in QGSJET-II-04 and the conventional model. The comparison between them is shown in Figure 1. As seen in the right panel of Figure 1, Z-factors relevant to the positron yield in QGSJET-II-04 are slightly less than in the conventional model from 1 to 10 GeV. In QGSJET-II-04 the overpredicted flux of CR positrons below 10 GeV cannot be depressed sufficiently to the consistent values with the AMS-02 data (Aguilar et al. 2014b). Thus, in this work we only replace the hadronic interaction model for the antiproton production with QGSJET-II-04 in the GALPROP package (Strong et al. 2000). The positron production is kept to use the conventional model, which is the default in the GALPROP package (Strong et al. 2000). Facing the overpredicted flux of CR positrons below 10 GeV, we also attempt the strategy of the exclusive potential of the solar modulation for CR positrons. In fact, that is not effective in the depression of the overpredicted flux. When the propagation parameters of the DR model constrained by the experimental data of CR protons and the B/C ratio are chosen in the large C.L., the expected flux of CR positrons does not appear. Just when the alternative propagation model is chosen as the DCR model, the overpredicted flux of CR positrons is depressed distinctly. When CRs are propagating in the Milky Way, they are blown outward from the Galactic disk. Consequently, the density of CR particles is decreased by Galaxy wind, and the flux of CR positrons is decreased. Moreover, when the antiproton yield is described in QGSJET-II-04, the predicted flux of CR antiprotons keeps the agreement with the AMS-02 data in the DCR model. Thus, the DCR model has more available than the DR model in the prediction of the secondary CRs. In the next analysis of dark matter implications of CR positron excess above 10 GeV and CR antiproton excess above 100 GeV, the DCR model is chosen to explore the dark matter contribution.
In the DCR model, the compatible analysis with ACE data (Be10/Be9; Yanasak et al. 2001) is also performed. In the chi-square fitting, with three kinds of experimental data, CR protons, Be10/Be9, and B/C, the values of propagation parameters of the DCR model are constrained in the available range, which is seen in Table 3. χ2/N for the three experimental data are less than 2. However, if the measured data of CR positrons and antiprotons are included, the constrained propagation parameters cannot predict the consistent values completely with the experimental data. Specially, χ2/N for ACE data is 38/4. In order to explore the tensions of the propagation parameter constraint from AMS-02 and ACE data, the fluxes of CR positrons and antiprotons and values of Be10/Be9 are calculated with the marginal values of the propagation parameters at the region of 99% C.L. The result shows that the ACE data favor the slower increase of the convection velocities in the Galactic disk. But that is not favored by AMS-02 data. The calculated fluxes of CR positrons and antiprotons are increased remarkably. This implicates that the reacceleration and convection of CRs do not release this tension from AMS-02 and ACE data. In the above chi-square fitting, the potentials of the solar modulation of CRs for AMS-02 and ACE data are given the same values. As AMS-02 and ACE are the different experiments and the data of them are obtained in different time periods, the same potentials for AMS-02 and ACE data are not reasonable. Thus, the updated chi-square fittings are performed with the different potentials of the solar modulation for CR positrons, antiprotons, protons, and B/C data from AMS-02 and Be10/Be9 data from ACE, respectively, in the DCR model. The best-fit potential of the solar modulation for ACE data is 67.95 MV, and the relevant χ2/N is 2.93/4. Thus, the tension between ACE and AMS-02 data can be relieved by the different potentials of the solar modulation.
In order to analyze the differences of the potentials of the solar modulation between AMS-02 and ACE data in the DR and DCR models, the chi-square fittings are also performed only using the Be10/Be9 and B/C data. The result shows that in the DR model the best-fit potentials of the solar modulation for Be10/Be9 and B/C are 553.25 and 455.53 MV and the relevant χ2/N are 0.98/4 and 224.34/67, respectively. This implicates that the DR model is not favored by AMS-02 data and favored by ACE data and the differences of solar modulation potentials are not remarkable. In the DCR model, the best-fit potentials for Be10/Be9 and B/C are 93.05 and 1060.90 MV and the relevant χ2/N for ACE data are 2.76/4 and 50.69/67, respectively. The differences of solar modulation potentials between AMS-02 and ACE data are remarkable in the DCR model. The values of Be10/Be9 and B/C are well predicted with the constraint of AMS-02 and ACE data in the DCR model.
This paper is organized as follows. In Section 2, we outline the framework for the calculation of the propagation of the CR particles and the cross section of interaction between nucleons. In Section 3, we describe the data selection and the strategy of the data fitting in a number of propagation models. The numerical results are presented in Section 4. Our conclusions are given in Section 5.
2. Cosmic-Ray Propagation and Hadronic Interaction Model
2.1. Cosmic-Ray Propagation Equation and Parameters
In the conventional model, CR production and propagation are governed by the same mechanism at energies below 1017 eV. CR propagation is often described by the diffusion equation (Berezinskii et al. 1990)
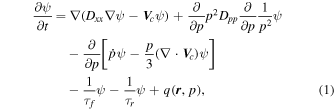
where  is the number density per unit of total particle momentum, which is related to the phase-space density
  as
as  . Dxx is the spatial diffusion coefficient parameterized as

where  is the rigidity of the CR particles and
  is the index below (above) a reference rigidity
  . The parameter D0 is a normalization constant, and
  is the ratio of the velocity v of the CR particles to the speed of light c. Vc is the convection velocity related to the drift of CR particles from the Galactic disk due to the Galactic wind. The diffusion in the momentum space is described by the reacceleration parameter Dpp related to the Alfvèn speed Va, i.e., the velocity of turbulences in the hydrodynamical plasma, whose level is characterized as ω (Berezinskii et al. 1990; Seo & Ptuskin 1994):

where  or
or  is the index of the spatial diffusion coefficient.
  ,
,  , and
, and  are the momentum-loss rate, the timescales for fragmentation, and the timescales for radioactive decay, respectively. The momentum-loss rate of CR electrons is not the same as that of CR nucleons, and the relevant expressions are found in Appendix C of Strong & Moskalenko (1998).
The convection term in Equation (1) is used to describe the Galactic wind blowing outward from the Galactic disk, and in the GALPROP package (Strong et al. 2000), the wind velocity Vc is expressed as (Strong & Moskalenko 1998)

where z is the height perpendicular to the Galactic disk and also appears in Equation (5).
The source  of the primary particles is often described as a broken power-law spectrum multiplied by the assumed spatial distribution described in the cylindrical coordinate (R, z) (Strong & Moskalenko 1998):
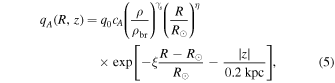
where η = 0.5, ξ = 1.0, and the parameter q0 is normalized with the propagated flux of CR protons. cA is the relative abundance of the Ath nucleon. The reference rigidity ρbr is described as the breaks of injection spectrum.  are the power indices below (above) a reference rigidity.
In this paper, the injection spectra of the primary CRs are described by the expression of the continuous functions in the referred rigidity of CRs, which may express a simple power law with the same indices below/above the referred rigidity. The spectral index difference between CR species is not considered in the paper. The expression  is replaced by the following:

where  and
and  are the spectral indices below/above the referred rigidity, and α determines the smoothness of the spectral change on the left and right sides of the referred rigidity; when α is 0, as a broken power law, the expression is the same as the one in Equation (5). In this work, α is taken as a free parameter to analyze the smoothness of the injection spectra of CR nucleons.
The flux of secondary particles is derived from the primary particle's spectra, spatial distribution, and interaction with the interstellar medium. The calculation methods of the secondary particle fluxes are referred to in the papers of Strong & Moskalenko (1998), Moskalenko et al. (2001), and Kelner et al. (2009).
2.2. The Secondary Particle Production in the Interstellar Medium and the Analytical Expression of Z-factors
CR antiprotons and positrons are produced in the collision with the interstellar medium, and in the propagation Equation (1) their source terms are described as follows (Moskalenko & Strong 1998):
where ni is the interstellar H and He density,  is the density of the jth CR nucleon, and
  is the cross section between the jth CR nucleon and interstellar H and He.
With the cross sections between the nucleon's collision, which are taken from the theoretical models or the collision experimental data, Equation (7) is often used to calculate the flux of secondary CRs. Recently, these calculations have been improved by using Z-factors (Kachelriess et al. 2014, 2015), where they took a numerical calculation instead of Equation (7). The concerned details may be found in Kachelriess et al. (2014, 2015). As the calculated Z-factors are relative to a simple power-law spectrum, in this paper a broken power-law spectrum is chosen to recalculate the Z-factors using the CRMC package (Pierog et al. 2015; Baus 2015). The details of the CRMC package (Pierog et al. 2015; Baus 2015) are found in Baus (2015). In the recalculation of Z-factors, the collision between the particles is more than 8,780,000 times.
For the Z-factor expression of the CR antiproton case, Equation (7) is modified as

Here  are the power indices of the interstellar spectra
  of the jth CR nucleon. The Z-factor
  is expressed via the inclusive spectra of antiprotons
  with
with  , as follows:

In Table 1 of Kachelriess et al. (2015), Z-factors are calculated with the modified QGSJET-II-4 model, whose values are listed discretely in the limited ranges of the energy and the spectral indices. In the calculation of secondary particle spectra, these numbers are not used conveniently. In this paper, these numbers are interpolated and fitted to an analytic expression, which is written in a good approximation as continuous functions
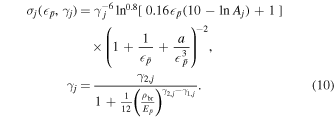
Here the dimensionless quantity  denotes kinetic energy
  over GeV per nucleon. The above spectral index
  is replaced by γj. Aigas and Aj are the nucleon number of the ith interstellar gas and the jth CR nucleon, respectively. a = 0.5 when
  and a = 1.0 when
  . In the expression of
  , the three parameters
  , ρbr, and
  are served for the broken power-law spectra of the primary CRs.
Table 1. The Z-factors from Expression (11) and Kachelriess et al. (2015)

|
( ) in This Paper, Equation (11) ) in This Paper, Equation (11) |
( ) in Kachelriess et al. (2015) ) in Kachelriess et al. (2015) |
||||||
|---|---|---|---|---|---|---|---|---|
| (P,P) | (P,He) | (He,P) | (He,CNO) | (P,P) | (P,He) | (He,P) | (He,CNO) | |
| 1 | 0.008 | 0.028 | 0.025 | 0.189 | 0.00772 | 0.0248 | 0.0277 | 0.196 |
| 10 | 0.094 | 0.360 | 0.310 | 3.617 | 0.1 | 0.35 | 0.339 | 3.24 |
| 100 | 0.178 | 0.694 | 0.587 | 7.106 | 0.187 | 0.715 | 0.612 | 7.15 |
| 1000 | 0.244 | 0.960 | 0.805 | 9.902 | 0.248 | 0.978 | 0.787 | 9.81 |
| 10000 | 0.304 | 1.199 | 1.002 | 12.428 | 0.307 | 1.2 | 0.959 | 12 |
Note. As an example, γj is chosen as 2.4 without the break for the injection nucleons Aj; the nucleon numbers are from the values in Table 1 of Kachelriess et al. (2015). As an example, Aj is 14 for CNO. The target nucleons Aigas are P and He.
Download table as: ASCIITypeset image
With Equation (10),  is simply rewritten as

Here Cij is a discrete function expressed as

Based on the analytic expression (11), the source term of the secondary antiproton is modified as

where Amax is the maximum nucleon number of the chosen particle of CRs, which mainly contribute to the production of CR antiprotons. In order to check the values of expression (11), the calculated values in the example of γj = 2.4 are listed in Table 1. If the standard deviation σ is 0.02, the total χ2 over data points calculated by the differences between the values of expression (11) and Kachelriess et al. (2015) is near 1.0 for all cases ( ). Thus, the errors may be accepted.
In this paper, the CR propagation Equation (1) is solved by the GALPROP package (Strong et al. 2000), which is based on a Crank–Nicholson implicit second-order scheme (Strong & Moskalenko 1998). In order to solve the equation, a cylindrically symmetric geometry is assumed, and the spatial boundary conditions assume that the density of CR particles vanishes at the boundaries of radius Rh and half-height Zh. The calculation option of the tertiary antiprotons is turned on in the GALPROP package (Strong et al. 2000). As the flux of the tertiary antiprotons is less than the secondary ones, the production of the tertiary antiprotons does not enhance the total fluxes of CR antiprotons to match the AMS-02 data.
At the top of the atmosphere of Earth, CR particles are affected by the solar winds and the heliospheric magnetic field. The force-field approximation is used to describe that effect, and the solar modulation potential ϕ denotes the force-field intensity (Gleeson & Axford 1968). In this paper, ϕ is a free parameter, and in some fittings, the difference of that from the experimental data is also taken for granted.
3. Data Selection and Fitting Schemes
3.1. The Hadronic Interaction Models, the Propagation Models, and the Experimental Data Selections
In order to compare the secondary particle production between the conventional and QGSJET-II-4 models, the Z-factors are recalculated for the secondary antiproton and positron based on a broken power-law spectrum of the primary particles, which is different from the a simple power law referred to in Kachelriess et al. (2015). The calculated Z-factors for the secondary antiproton and positron are drawn in the left and right panels of Figure 1. As seen in the left panel of Figure 1, for the secondary antiproton antiproton, the calculated Z-factors with a break in QGSJET-II-4 are greater than those of the conventional model at low energies. The Z-factors relevant to a simple power-law spectrum of the primary particles in QGSJET-II-4 are close to the ones in the conventional model. In the right panel of Figure 1, for the secondary positron, the calculated Z-factors in QGSJET-II-4 are slightly less than those in the conventional model from 1 to 10 GeV. Thus, we only replace the hadronic interaction model for the antiproton production with the QGSJET-II-04 model in the GALPROP package (Strong et al. 2000).
In the propagation models, the propagation parameter Alfvèn speed VA expresses the reacceleration of CRs, and the convection velocity Vc and dVc/dZh describe the convection of CRs. There are reacceleration parameters in both the DCR and DR models. In order to analyze the exclusive effectivity of the convection, we remove the reacceleration in the DCR model to make up the diffusion model with the convection (DC) model, which only includes the convection velocity. In the DC, DR, and DCR models, the propagation parameters in common are the following:
- 1.Half-height Zh, diffusion parameter D0, and
 .
. - 2.Spectral index: below (above) a reference rigidity ρbr and the spectral smoothness α for the source expression of primary nucleons.


In the DCR model, Alfvèn speed VA is not different between CR positrons and nucleons. The DCR model is constructed to verify whether reacceleration has a different effect between CR positrons and nucleons. The DCR0 model is relevant to the conventional hadronic model, which is the default in the GALPROP package (Strong et al. 2000). CR antiproton production in the conventional and QGSJET-II-4 models can be compared with the DCR0 and DCR models.
In a previous paper (Jin et al. 2015a), it was found that the propagation parameters can be constrained by the AMS-02 data: proton flux (P) and the ratio of boron to carbon flux (B/C). In this paper, CR protons and B/C from AMS-02 are chosen as the basic data to constrain the propagation parameters. With the best-fit propagation parameters, the fluxes of CRs are predicted by the solution of the propagation equation. Though the fluxes of CR antiprotons and positrons are also predicted, the measured data from AMS-02 for CR antiprotons and positrons are included to shorten the confidence interval of the constrained parameters by CR proton and B/C data. In order to check the predicted value of  compatible with ACE data, the ACE data are also included to constrain the propagation parameters. In the DCR
 model, there are the five groups of the experimental data: CR protons, antiprotons, positrons, B/C, and Be10/Be9. In the DCR
 model, the fluxes of CR antiprotons and positrons are not predicted and only calculated with the chosen parameters, which are the scanned values relevant to
  for CR protons, B/C, and Be10/Be9 from the DCR
 model. As the data from ACE and AMS-02 are obtained in different time periods, the potentials of solar modulation of CRs for ACE and AMS-02 data should be different. DCRϕ is the updated DCR
 model. In the DCRϕ model, the potentials of solar modulation of CRs for ACE and AMS-02 data are divided into two groups: ϕ and
  , which are the free parameters as well as the propagation parameters. The potential
  is used for ACE data: Be10/Be9. The potentials ϕ are used for AMS-02 data: CR protons, antiprotons, positrons, and B/C.
In the chi-square fitting of combining the secondary antiproton and positron data, in order to avoid the propagation parameters deviating the determined ranges by CR protons and B/C data, it is necessary to fix the sensitive intervals of CR energy in the given ranges. For CR positrons, the energy range of the fitting to CR positron data of AMS-02 is limited to 0.6–6.0 GeV. Above 6.0 GeV, the positron excess begins to appear in the CR positron data of the AMS-02 experiment. For CR antiprotons, the cross point of the Z-factors between the conventional model and QGSJET-II-4 is 6 GeV, which is found in Figure 1. From the comparison between the fitting line and MC points, below 2 GeV, the uncertainties of the calculated z-factors are large, which is found in Figure 1. The energy range of CR antiproton flux is restricted to 2.0–6.0 GeV. In the limited energy ranges, the fluxes of CR positrons and antiprotons are just closest to AMS-02 data, which is found in Figure 5. Thus, the secondary antiproton and positron data have only a slight constraint on the global chi-square fitting. In order to check the energy range sensitive to the propagation parameters, the chi-square fittings for all of the CR antiproton data from AMS-02 are done as a test. The result shows that the overlarge convention velocity (3050 km s−1) is favored to match the minimal chi-square for CR antiprotons (χ2/N = 94/57). Above 100 GeV the predicted flux of CR antiprotons is closest to AMS-02 data and includes the part of the excess. This is shown in the right panel of Figure 4. The relevant tag in the legend is DCR . It implies that the other sources need to be considered to contribute to CR antiprotons so as to tune the propagation parameters to the reasonable bounds. For the estimation of the astrophysical background, the flux of CR antiprotons should be predicted in the energy range sensitive to the propagation parameters.
3.2. The Fitting Schemes of Dark Matter Implications
In the DCR model, as the energy range of the fitting to CR positron and antiproton data of AMS-02 is limited in the given values and the calculated fluxes of CR positrons and antiprotons are closest to the experimental data in the given C.L. regions, the best-fit parameters come mainly from the constraint of CR protons and B/C. This is found in Figure 5. The experimental data of CR positrons and antiprotons have a slight constraint on the best-fit values of propagation parameters. Thus, the fluxes of CR positrons and antiprotons are well predicted by the DCR model, which is used for the interpretations of the positron excess above 6 GeV and the antiproton excess above several tens of GeV.
For the dark matter implications of the AMS-02 data, the prediction of mass and annihilation cross section of dark matter are based on the background of the total CR electrons and antiprotons, whose fluxes are calculated with the best-fit parameters in the DCR model. The parameters of the source term of CR electrons are fixed in the best-fit values, which are listed in Table 2. As seen in the table, above 1 GeV there are three spectral indices to describe the spectra of the primary electrons, which means that the primary electrons have a complex feature connected with the other origin. That has been discussed in Chen et al. (2015a).
Table 2. Best-fit Values of the Parameters with the Constraints of AMS-02 Data
| Ne |

|

|

|

|

|
|---|---|---|---|---|---|
| 0.4167 | 0.5718 | 1.4623 | 2.6743 | 93.32 | 2.4768 |
Note. The unit of normalization Ne is  , and the referred energy of CR electrons is 34.5 GeV. The breaks of injection electron spectra are
  , whose unit is GV.
  are spectral indices below/above the breaks, respectively.
Download table as: ASCIITypeset image
In the analysis of the annihilation cross section of the dark matter, the annihilation channels of the dark matter contributing to CR electrons, positrons, and antiprotons involve the following particle states:
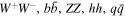
- 1. hh, and for CR positrons and electrons;
- 2., and for CR antiprotons.


In the fitting strategy, the limits on annihilation cross section are calculated with the best-fit parameters based on the given mass of dark matter, which is called the mass-fixed best fit. A global minimum in any values of dark matter mass is relevant to the minimal chi-square.
The annihilation spectra of Majorana dark matter particles via these channels are calculated using the numerical package PYTHIA (Sjöstrand et al. 2008). Ciafaloni et al. (2010) indicate that for the dark matter particles with the mass in the TeV scale the electroweak corrections are important in particular for annihilation/decay in leptonic channels. In this work, the electroweak corrections are always turned on for the calculation of the annihilation spectra of the dark matter. The analysis from dark matter decays is found in Mambrini et al. (2015).
Through the global χ2 fit using the MINUIT package (James 1994), all the best-fit values of the propagation parameters are derived from the minimized χ2. In Table 3, the best-fit parameters of each model are listed. In Table 4, the corresponding relations between the models and their concerned experimental data are presented. It is also shown that the best-fit χ2 values are relevant to the experimental data in the given propagation model.
Table 3. Best-fit Parameters of Models DCR, DR, and DC
| Para. | DCR | DR | DC | DCR
|
DCR0 | DCR1 | DCR2 | DCR
|
|---|---|---|---|---|---|---|---|---|
| α | 0.0 | 0.238 | 8.0E-3 | 0.0 | 0.0 | 0.0 | 0.0 | 0.0 |

|
701.93 | 597.4(817.6) | 394.8 | 603.5 | 601.2 | 664.8 | 463.2 | 701.73 (67.95) |

|
83.12 | 44.46 | 156.37 (178.43) | 68.44 | 83.2 | 43.9 | 83.10 | |
| Vc0 | 496.75 | 32.21 | 4673.1 | 435.8 | 483.9 | 114.2 | 496.62 | |

|
90.99 | 2.57 | 26.2 | 61.78 | 75.5 | 44.7 | 90.92 | |
| Zh | 2.695 | 3.7 | 4.0 | 4.013 | 4.1 | 3.0 | 3.0 | 2.7 |

|
2.726 | 1.636 | 1.164 | 21.166 | 1.891 | 2.946 | 1.222 | 2.727 |
| δ | 0.305 | 0.321 | 0.393 | 0.144 | 0.366 | 0.291 | 0.403 | 0.305 |
| Np | 4.609 | 4.533 | 4.53 | 4.564 | 4.649 | 4.583 | 4.571 | 4.609 |
| ρbr | 6.6 | 10.153 | 8.41 | 5.032 | 4.873 | 6.6 | 6.6 | 6.6 |

|
1.8398 | 1.772 | 1.748 | 1.654 | 1.586 | 1.808 | 1.538 | 1.8395 |

|
2.4125 | 2.447 | 2.427 | 2.411 | 2.398 | 2.408 | 2.386 | 2.4125 |
Note. The unit of Np is  . ϕ, ρbr, Zh,
  , vA, and Vc0 are in units of MV, GV, kpc,
  , km
, km  , and km
  , respectively. In the DR model, the bracketed
  or
or  is only used for CR positrons. In the DCRϕ model, the bracketed
  is only used for Be10/Be9 data from ACE. The rest of the propagation parameters are referred to the example 01 of GALPROP WebRun (Vladimirov et al. 2011).
Download table as: ASCIITypeset image
Table 4. Best-fit χ2 Relevant to the Models DCR, DR, and DC
| Models |

|

|

|

|

|
χ2 | χ2/N |
|---|---|---|---|---|---|---|---|
| DCR | 22.2 | 50.16 | 12.94 | 13.01 | 98.31 | 0.596 | |
| DR | 47.02 | 288.31 | 8.74 | 117.27 | 461.33 | 2.8 | |
| DC | 424.6 | 414 | 594.5 | 1037.33 | 2470.4 | 14.97 | |
| DCRV | 14.12 | 77.77 | 17.51 | 14.32 | 123.72 | 0.75 | |
| DCR0 | 49.17 | 91.42 | 382.62 | 185.58 | 708.79 | 4.3 | |
| DCR1 | 28.10 | 50.49 | 12.05 | 21.13 | 38.76 | 150.54 | 0.89 |
| DCR2 | 123.57 | 109.26 | 356.98 | 1923.1 | 5.95 | 2518.9 | 14.9 |
| DCRϕ | 22.20 | 50.148 | 12.93 | 13.03 | 2.93 | 101.24 | 0.601 |
Note. The subscript N of χ2 denotes the number of the experiment data points, for instance, the number of AMS-02 proton data points is N = 72. The total χ2 and its value over the total data points of the chosen experiment for each model are presented in the last two columns.
Download table as: ASCIITypeset image
4. Results
4.1. The Propagation Parameter Model Constrained by AMS-02 Data
In Table 3, the parameters are the best-fit values in the χ2 fitting by the MINUIT package (James 1994). The best-fit values for α are much less than 1 in all the models. In fact, α nearly vanishes in the DCR and DC models, which indicates that the injection spectra of CR nucleons become very sharp near the referred rigidity. In Table 4, the best-fit χ2 relevant to the three types of models DCR, DR, and DC are shown. With the comparison of χ2 between the models, it is shown that the DCR model is more favored by AMS-02 data and the other models have some flaw or large deviation from AMS-02 data. As a whole, AMS-02 data have higher precision than the other data and are strongly constrained on the propagation models and the hadronic interaction models. For instance, the latest released B/C data have not only higher precision but also a more complex feature of spectra than the other experimental data.  relevant to B/C data of AMS-02 in the DR and DC models are much greater than 2. Thus, only based on the B/C data of AMS-02, the conventional reacceleration diffusion model (DR) and the convention diffusion model (DC) are excluded. In the following several paragraphs, the DCR
 models are deeply explained.
First, there is a comparison between DCR and DCR0. In the DCR0 model, the hadronic interaction model is the conventional model. As the secondary particles, at low energies the flux of CR antiprotons is not favored by AMS-02. In the right panel of Figure 4, the pink dotted–dashed line relevant to the DCR0 model is below the experimental data line of AMS-02. At low energies  relevant to CR antiproton data of AMS-02 is very large.
  relevant to CR positrons is also brought to the worst value. In the DCR model, with an alternative interaction model, i.e., QGSJET-II-4 for the antiproton production, the predicted fluxes of CR antiprotons and positrons are well fitted to the AMS-02 data, though for CR positrons the hadronic interaction model is still the conventional model. This implies that the hadronic interaction model is key to relaxing the predicted tension between CR positrons and antiprotons. As seen in Figure 1, for CR antiprotons, Z-factors relevant to the QGSJET-II-4 model are greater than those of the conventional model at low energies. But for CR positrons, Z-factors relevant to the QGSJET-II-4 model are almost the same as those of the conventional model.
Second, in order to check the values of  compatible with ACE data, the propagation parameters are refitted by including the ACE data in the DCR
 and DCR
 models. The predicted values of
  in the DCR
 and DCR
 models are drawn in the left panel of Figure 4. For ISOMAX data (Hams et al. 2004), in the DCR
 and DCR
 models the predicted values are both consistent. For ACE data (Yanasak et al. 2001), the predicted values of
  are consistent with ACE data in the DCR
 model. But in the DCR
 model the relevant values (
 ) deviate remarkably from ACE data. In the DCR
 model only CR proton and B/C data of AMS-02 are included to perform the chi-square fitting. This means that the propagation parameters constrained by CR proton and B/C data of AMS-02 are compatible with ACE data. However, in the DCR
 model, CR antiprotons and positrons are both included. In the chi-square fitting, five groups of experimental data are chosen: CR protons, CR antiprotons, CR positrons, and B/C from AMS-02 and
  from ACE. Except for ACE data, the four groups of experimental data from AMS-02 favor completely the predicted values by best-fit propagation parameters, and all of the relevant χ2/N are less than 2. This means that in the DCR model the prediction has a tension between Be10/Be9 from ACE and CR antiprotons and positrons from AMS-02.
In order to explore the tensions of the propagation parameter constraint from AMS-02 and ACE data, the fluxes of CR positrons and antiprotons and values of Be10/Be9 are calculated with the marginal values of the propagation parameters at the 99% C.L. region. The relevant contours are found in Figures 2 and 3. In the propagation parameters, dVc/dz is relevant to the most upper/lower limits in all the contours. The values of Be10/Be9 decrease with dVc/dz dropping. When dVc/dz arrives at the lower limit of the 99% C.L. region, the values of Be10/Be9 are only near the ACE data. When the value of dVc/dz drops to 25 km kpc−1 s−1, the values of Be10/Be9 arrive at the error bars of ACE data. The relevant χ2/N is less than 2. However, the fluxes of CR positrons and antiprotons increase with dVc/dz dropping. When dVc/dz arrives at the lower limit of the 99% C.L. region, the fluxes of CR positrons and antiprotons deviate from AMS-02 data obviously. Thus, it is not easy to release the tensions between AMS-02 and ACE data only by the constrained propagation parameters. In the DCRϕ model, the potentials of the solar modulation of CRs for ACE and AMS-02 data are divided into two groups of values. The values of the best-fit potentials and the propagation parameters constrained by ACE and AMS-02 data are shown in the last column of Table 3. The potentials 67.95 and 701.73 MV of the solar modulation of CRs for ACE and AMS-02 data, respectively, have a remarkable difference. The values of constrained propagation parameters are very close to the values in the DCR model, which is shown in the first column of Table 3. The χ2/N relevant to the predicted fluxes of CRs and ratios of Be10/Be9 and B/C are shown in the last row of Table 4. Except the χ2/N relevant to CR antiprotons, which is less than 2, all other χ2/N are less than 1. Specially, χ2/N relevant to Be10/Be9 is 2.93/4. The predicted ratios of Be10/Be9 by the best-fit parameters are drawn in Figure 4. Except for Be10/Be9, the χ2/N relevant to CRs from AMS-02 is almost the same as the values in the first row of Table 4 for the DCR model. Thus, the tension between ACE and AMS-02 data can be relieved by the different potentials of the solar modulation in the DCR model.
In order to check the low-energy behavior consistency between the total beryllium flux and the ratios of Be10/Be9 about the tension, we performed a chi-square fitting to search the best-fit values ϕ of the solar modulation potential for the two groups of data: Be10/Be9 and the total beryllium flux. We add the normalized factor k multiplied by the predicted fluxes of all the beryllium isotopes. The factor k expresses the uncertainties of the absolute fluxes of CRs and the spallation cross section of the secondary particle production of CRs. When ϕ is at 67.95 MV, the best-fit value of the normalized factor k is 0.277 and the χ2/N is 25.24/6 for beryllium flux data from ACE. This means that the normalized factor does not improve exclusively the prediction of the total beryllium flux. The solar modulation potential has a remarkable influence on the gradient of the total beryllium flux. When ϕ is also free, that prediction is improved. The best-fit values of ϕ and k are 165.53 MV and 0.3785, respectively. The relevant χ2/N are 5.717/4 and 6.128/6 for Be10/Be9 and the total beryllium flux data. That means that the the total beryllium flux is also well predicted, together with the Be10/Be9. The ϕ of 165.53 MV is consistent with the solar minimum periods mentioned in Cholis et al. (2016). In Figure 4, the relevant curves are drawn.
In the DCRV model, Alfvèn speed VA has the two different values relevant to CR positrons and CR nucleons, which are found in Table 3. By comparing χ2 between the DCR and DCRV models in Table 4, it is found that the differences of the reacceleration effect do not improve the fluxes of CR positrons and CR nucleons to fit to AMS-02 data. At the meantime, as a bad result, the Galactic wind velocity Vc and the diffusion coefficient D0 are converged into the large values. In the chi-square fitting, the propagation parameters are not converged. This means that the Alfvèn speed VA is not sensitive to the difference between CR positrons and CR nucleons.
In order to explore the correlations between the propagation parameters in the DCR model, Markov Chain Monte Carlo sampling is done using the CosmoMC package (Lewis & Bridle 2011), which calls the functions of the GALPROP package (Strong et al. 2000) in the sampling steps. Except for the smoothness parameter α, there are 11 propagation parameters to be used. In the sampling results, the sampling steps in the 28 chains amount to more than 428,000 after burn-in. The details of the sampling methods are found in Jin et al. (2015a). For the contour drawing, the covariance matrix of 11 parameters is calculated with the sampling data. Based on the inverse of the covariance matrix, with the best-fit values of the propagation parameters in the DCR model, the correlation contours between any two parameters are drawn in Figures 2 and 3. As seen in these contours, the Alfvèn speed VA, the Galactic wind velocity Vc, and the diffusion coefficient  are completely the positive correlations between the two parameters. These correlations have been presented in the DCRV model. The Galactic wind velocity Vc and the diffusion coefficient D0 are converged into the large values together. The well-known correlations of the diffusion coefficient Zh,
  , and δ are also clearly shown. In Figure 2 and 3, the regions enclosing the
  , and 99% C.L. are shown for 11 propagation parameters. As seen for the regions in the given C.L., the confidence interval of the propagation parameters constrained by AMS-02 data is very narrow. This means that these correlations do not impact the convergence of the propagation parameters in the chi-square fitting for the DCR model. In Figure 5, the contours of the fluxes of CR protons, antiprotons, and positrons and the ratio of boron to carbon flux are predicted from the propagation parameter regions of the 99% C.L.. As seen in Figure 5, all the best-fit lines are in the middle of the contours.

Figure 2. Two-dimensional correlation contours for the combinations between the propagation parameters involving Zh,  , δ, Va, Vc0,
 ,
,  , and ϕ. The regions enclosing the
  , and 99% C.L. are shown. The red plus sign in each panel indicates the best-fit value.
Download figure:
Standard image High-resolution image
Figure 3. Same as Figure 2, but for the remaining contours.
Download figure:
Standard image High-resolution imageIt is known that the spectra of CR protons from the measurement of the AMS-02 experiment have two breaks with the kinetic energy increasing from 0.5 GeV to 2 TeV (Aguilar et al. 2015a). The second break of the CR proton spectra means that the absolute index of CR proton spectra begins to decrease above 330 GeV, which is often called the CR hardening. From a comparison of χ2 for the CR protons in Table 4, it is seen that in the DCR model the flux of CR protons with the multiple power indices is well predicted. Though the DCRV model does not help to improve the prediction of the fluxes of CR positrons and antiprotons, the large Vc and D0 promote the relevant χ2 decreasing from 22.2 to 14.12. The experimental data of CR protons with high precision from AMS-02 have 72 points. The  means that the flux of CR protons is better predicted in the DCRV model, which justifies the convection effect for CR propagation.
On the left of the first row of Figure 6, the fluxes of CR protons are drawn. It is apparently seen that the flux of CR protons above 330 GeV has a different trend change with different models. As a result of the comparison among the models, the DCR model can well predict the hardening flux of CR protons. And the flux at low energies is also well consistent with the AMS-02 data, which distinguishes from the DR model. On the right of the first row in Figure 6, the ratio of boron to carbon flux in the DC model is inconsistent with the AMS-02 data below 2 GeV, which indicates that the DC model cannot give a significant prediction.
In Figure 6, the fluxes of CR antiprotons are plotted at the left of the second row. From the low energy to the high one, except for the DC and DCR0 models, the consistent prediction for the flux of CR antiprotons is found in the DCR and DR models, though the tail data of AMS-02 show a bulge. That cannot completely be fitted. At low energies, the best-fit flux of CR antiprotons does not have the excess. In the DCR0 model, which is relevant to a conventional hadronic interaction model, the excess flux of CR antiprotons is remarkable at low energies. At high energies, the bulge relative to the predicted flux of CR antiprotons still exists and needs a further interpretation. As the fluxes of CR helium are one order of magnitude less than the fluxes of CR protons, though the spectrum of CR helium has a hardening feature, the flux of CR antiprotons from the contribution of CR helium is very little. In Figure 4, the difference of best-fit fluxes of CR antiprotons between the DCR and DCRHe models cannot be distinguished. In this paper, the excess is interpreted as the contribution from dark matter annihilation.

Figure 4. Top left: contours of the value of  predicted from the propagation parameter regions of the 99% C.L. are drawn. In the range (25,117) of the first contour, 25 is not from 99% C.L. and a scanned value for the predicted
  values is consistent with ACE data. Top right: the fluxes of CR helium are drawn with two spectral indexes. PAMELA (Adriani et al. 2011) and AMS-02 (Aguilar et al. 2015b) data are also shown. Bottom left: predicted
  flux ratio from the refitting parameters by combining the ACE data (denoted as DCR
 ) and the chosen parameters relevant to
  only for the experimental data: CR protons, B/C, and Be
 /Be
/Be (denoted as DCR
 ) based on the DCR model. DCR
 (67.95 MV) and DCR
 (165.53 MV) models are based on the different potentials of the solar modulation in the DCR model. In the inset, the predicted flux (blue dotted line) and ACE (Yanasak et al. 2001) experimental data (red) of the total beryllium are drawn, and the units of the vertical and horizontal axes are kinetic energy (GeV) and E2 flux (GeV
  ), respectively. ACE (Yanasak et al. 2001) and ISOMAX (Hams et al. 2004) data are also shown. Bottom right: flux of CR antiprotons predicted from the models DCR, DCR0, and DCR
 (all the antiproton data from AMS-02 are included) and the measurements from AMS-02 (Aguilar et al. 2016a, 2014a, 2014b), PAMELA (Adriani et al. 2010b), and BESS-PolarII (Abe et al. 2011) experiments. In the DCRHe model, the predicted flux of antiprotons is relevant to CR helium with the spectral index 2.3.
Download figure:
Standard image High-resolution image
Figure 5. Contours of the fluxes of CR protons, antiprotons, and positrons and the ratio of boron to carbon flux predicted from the propagation parameter regions of 99% C.L. The values of the chosen parameter are from the margin of 99% C.L. regions, and the values of the other parameters are best fit from the DCR model in Table 3. The best-fit lines and AMS-02 data (Aguilar et al. 2016a, 2015a, 2014a, 2014b) are also drawn.
Download figure:
Standard image High-resolution imageOn the right of the second row in Figure 6, the predicted flux of CR positrons is drawn. In the DC, DR, and DCR0 models, there is a fully inconsistent prediction with AMS-02 data. In contrast, in the DCR model the fluxes of CR positrons are well fitted to the AMS-02 data at low energies. And the maximal energy range is up to about 10 GeV. Above 10 GeV, CR positron excess becomes significant and begins to increase with rising energy. This implies that new sources different from the secondary particle production need to be considered. The dark matter interpretation of positron excess appears in the next paragraphs.

Figure 6. In the first row, the flux of CR protons (left) predicted from the models DCR, DR, and DC in comparison with the measurements from AMS-02 (Aguilar et al. 2015a) and PAMELA (Adriani et al. 2011) experiments; the ratio of boron to carbon flux (right) predicted from the models DCR, DR, and DC, and the measurements from the AMS-02 (Aguilar et al. 2016b) experiment. In the second row, the flux of CR antiprotons (left) and CR positrons (right) predicted from the models DCR(DCR0), DR, and DC, and the measurements from AMS-02 (Aguilar et al. 2016a, 2014a, 2014b), PAMELA (Adriani et al. 2010b), and BESS-PolarII (Abe et al. 2011) experiments. The DCR0 model is relevant to the conventional hadronic interaction models and does not use the expression in Equation (11). The DCR1 and DCR2 models are used to check the compatibility with ACE data.
Download figure:
Standard image High-resolution image4.2. Dark Matter Interpretations for CR Antiproton and Positron Excesses Based on AMS-02 Data
In Figure 7, all of the figures are drawn with the calculated data in the DCR model. On the left of the last row, the mass-fixed best-fit annihilation cross sections of dark matter contributing to CR antiprotons are drawn. It is seen that the annihilation cross sections of dark matter are different completely from those of Jin et al. (2015b). That situation is relevant to the flux of CR antiprotons fitting to AMS-02 data at low energies and weaker than AMS-02 data at high energies. It is known that the dark matter interpretation of the positron excess takes the large annihilation cross sections. But in this paper, the large annihilation cross section does not match the weak excess of CR antiprotons. The tension between the excess interpretations of CR antiprotons and positrons is perhaps relieved to a certain extent. For instance, the symmetry between the quark and lepton particles annihilated from dark matter needs the new hyperthesis. In Figure 7, it is also seen that all of the annihilation cross sections are greater than the predicted values from Fermi-LAT gamma-ray data of dwarf spheroidal satellite galaxies in the Milky Way.

Figure 7. All of the rows: left for CR antiprotons and right for the total of CR electrons and positrons. In the first row, the fluxes of CRs relevant to the astrophysical background, dark matter, and AMS-02 experiments (Aguilar et al. 2016a, 2014a, 2014b). ( ) denotes the primary electrons. (
 ) denotes CR electrons and positrons. In the second row, χ2 change with the mass of dark matter increasing. The dashed line denotes the number of the experimental data points. In the third row, the mass-fixed best-fit annihilation cross sections of dark matter via the channels of
  , etc. The dashed line denotes the thermal cross section
  . The best-fit values relevant to the
  ,
,  , and
, and  channels from the Fermi-LAT 6 yr gamma-ray data of dwarf spheroidal satellite galaxies of the Milky Way are also shown (Collaboration 2015).
Download figure:
Standard image High-resolution image
Based on the change of χ2 with the dark mater mass shown in the left of the second row in Figure 7, the best-fit mass of dark matter is found by referring to the minimal χ2. It is seen that the best-fit mass of dark matter is found to be near 600 GeV. As a whole, in all of the channels of the dark matter annihilation the predicted best-fit masses are only from 300 to 700 GeV. Meanwhile, the dark matter interpretation of the antiproton excess has the weak effect of discriminating the dark matter annihilation channels. In the left of the first row of Figure 7 the predicted fluxes of CR antiprotons from the total contribution of astrophysical background and dark matter annihilation are drawn. As the annihilation spectra of dark matter contributing to CR antiprotons are not sharp, as well as CR electrons, the bulge in the tail data of AMS-02 does not strongly constrain the interpretations of dark matter. As a result, for all the channels the predicted values do not match the fluxes of the last second point from AMS-02 data.
In this paper, the analysis of positron excess is based on the total fluxes of CR electrons and positrons, which is different from CR positron flux or the fraction data of AMS-02 used in the previous papers. In the right of Figure 7, the relevant figures are drawn from the first to the third rows. Being similar to the CR antiprotons, the astrophysical backgrounds of the total electrons and positrons are also calculated in the DCR model. In first row of Figure 7, the calculated flux of the CR electron background is well consistent with the AMS-02 data at low energies, but at high energies the experimental data of AMS-02 are manifestly in excess of the calculated background.
In the last row of Figure 7, the mass-fixed best-fit annihilation cross sections of dark matter contributing to CR electrons and positrons via many channels (2μ,  , etc.) are plotted. As seen in the panels, the mass-fixed best-fit values relevant to the lepton channels are different with mass of dark matter increasing. The cross mass of dark matter between the channels is near 10 TeV, where the same annihilation cross sections appear. As a whole, annihilation cross sections of dark matter still have large values. The relevant compatibility of the large annihilation cross section with the thermal relic density is discussed in terms of self-interacting dark matter (Liu et al. 2011, 2013; Dev et al. 2013; Chen et al. 2015b; Li et al. 2014; Li & Zhou 2014; Liang et al. 2016) and in connection with collider physics (Huang et al. 2015, 2016).
In the second row of Figure 7, the best-fit mass of dark matter is found from the change of χ2 with the mass of dark matter increasing. Except for 2 and 4 μ final states, the χ2 are less than the twice the experimental data points, and the predicted mass of dark matter is from 400 GeV to 4 TeV. The different channels of dark matter annihilation may be discriminated by the best-fit mass of dark matter. That is obviously different from the interpretation of the antiproton excess. The annihilation of heaviest dark matter is via the  final state, and the lightest one is relevant to 2τ. The total fluxes of CR electrons and positrons from the astrophysical background and the dark matter annihilation are drawn in the first row of Figure 7. As seen in the figure, at high energies the predicted fluxes of CR electrons and positrons are consistent with AMS-02 data. The best-fit fluxes are relevant to the ZZ final state. As seen in the last row of Figure 7, for all the annihilation channels the annihilation cross sections of dark matter are still one order of magnitude greater than from Fermi-LAT gamma-ray data of dwarf spheroidal satellite galaxies. The issues of the large annihilation cross sections still exist. The relevant exploration is found in Huang et al. (2015, 2016).
5. Conclusions
In the convectional model, the propagation parameters were well constrained by the experimental data of CRs, such as CR protons,  , B/C, etc. In the given propagation parameters, the solution of the propagation equation is used to predict the flux of CRs. Recently, AMS-02 has reported their observed results of CRs. In the conventional model, the predicted fluxes of CR positrons and antiprotons at low energies deviate significantly from the latest AMS-02 data. In this work, the hadronic interaction model, the propagation model, and the exclusive solar modulations are considered.
CR antiproton production is calculated in QGSJET-II-4 instead of the conventional model. As a result, in the reacceleration diffusion model the underpredicted flux of CR antiprotons can be enhanced to be consistent with AMS-02 data. However, the predicted fluxes of CR positrons and B/C deviate apparently from AMS-02 data in this model.
In the conventional model, the potentials of the solar modulation are the same for CR positrons and nucleons. We attempt to predict the flux of CR positrons with the different solar modulations between CR positrons and nucleons. In low energies, the overpredicted flux of CR positrons cannot be decreased. Similar to CR antiprotons, the hadronic interaction model is chosen as QGSJET-II-4. In the reacceleration diffusion model, the overpredicted flux could not be depressed completely. In QGSJET-II-4 and the conventional model, the positron production does not have the apparent distinction. That is found from the Z-factor comparison in Figure 1. When the reacceleration diffusion model is replaced by the convection and reacceleration diffusion model, the overpredicted flux of CR positrons is decreased to be consistent with AMS-02 data.
For the prediction of CR antiprotons and positrons, the convection and reacceleration diffusion models are chosen as CR propagation, and the hadronic interaction model is chosen as QGSJET-II-4 for the antiproton production. These are constructed as the DCR model. In the DCR model, the predicted fluxes of CR protons, antiprotons, and positrons and the predicted value of B/C are consistent completely with AMS-02 data. Moreover, the flux of CR protons with the hardening feature above 330 GeV is predicted consistently.
In the DCR model, with the propagation parameters constrained by CR protons and B/C data from AMS-02 without CR antiproton and positron data, the predicted values of  are compatible with ACE data. If the secondary antiproton and positron data from AMS-02 are also included in the χ2 fitting, the predicted values of Be10/Be9 are not consistent with ACE data. This means that the prediction has a tension between Be10/Be9 from ACE and CR antiprotons and positrons from AMS-02. The tension can be relieved by the different potentials of the solar modulation for ACE and AMS-02 data. The potential difference between them is remarkable.
In the DCR model, based on the predicted background of CR positrons and antiprotons, the contribution from dark matter is analyzed. For CR antiprotons, the slight bulge in the tail data of AMS-02 does not strongly constrain the interpretations of dark matter contributing to CRs. The limit lines of the annihilation cross sections of dark matter are higher apparently than from Fermi-LAT gamma-ray data of dwarf spheroidal satellite galaxies. The best-fit mass of dark matter is found near 600 GeV. In the different channels of dark matter annihilation the predicted best-fit mass is only from 300 to 700 GeV. The dark matter interpretation of CR antiproton excess has the weak effect of discriminating the dark matter annihilation channels.
In this work, the analysis on the positron excess is based on the total fluxes of CR electrons and positrons, which is different from the CR positron flux or the fraction data from AMS-02. In the DCR model, based on the redefined astrophysical background of CR electrons, the total fluxes of CR electrons and positrons are manifestly in excess. For the excess of the total fluxes of CR electrons and positrons, the differences of annihilation cross sections of dark matter for all the annihilation channels are remarkable between the constraints from Fermi-LAT and AMS-02 data. The issues of the large annihilation cross sections still exist. Except for 2 and 4 μ final states, in the other channels, the best-fit mass of dark matter is from 400 GeV to 4 TeV. The annihilation of heaviest dark matter is through the  final state, and the lightest one is via the 2τ channel. The best flux fitting to AMS-02 data is relevant to the ZZ final state.
Y.-L.W. is grateful to S. Ting for insightful discussions. We thank P. Zuccon, A. Kounine, A. Oliva, and S. Haino for helpful discussions on the details of the AMS-02 detector. This work is supported in part by the National Nature Science Foundation of China (NSFC) under grant Nos. 11851301, 11335012, 11475237, and 11121064, and also by the Strategic Priority Research Program of the Chinese Academy of Sciences, grant No. XDB23030100, as well as the CAS Center for Excellence in Particle Physics (CCEPP). The numerical calculations were done using the HPC Cluster of SKLTP/ITP-CAS and NAOC. We thank the referees of this paper for many suggestions, which are very useful to improve many parts in the paper.
Software: CRMC (v1.6.0; Pierog et al. 2015; Baus 2015), GALPROP (v54; Strong et al. 2000), PYTHIA (v8.175; Sjöstrand et al. 2008), MINUIT (v94.1; James 1994), CosmoMC Lewis & Bridle (2011).