Calibrating the Yield Strength of Archean Lithosphere Based on the Volume of Tonalite-Trondhjemite-Granodiorite Crust
 Prasanna M. Gunawardana
 Gabriele Morra
 Priyadarshi Chowdhury
 Peter A. Cawood
- 1 School of Earth, Atmosphere and Environment, Monash University, Clayton, Victoria, Australia
- 2 Department of Physics, School of Geosciences, University of Louisiana at Lafayette, Lafayette, LA, United States
Lithospheric yield stress is a key parameter in controlling tectonic processes. Using high resolution, 2D numerical modeling, we calculate the yield stress for a range of conditions appropriate to the early-to-mid Archean Earth, including hotter mantle potential temperatures and Moho temperatures. We then evaluate its effect on generating tonalite-trondhjemite-granodiorite (TTG) crust and benchmark the results against the preserved igneous rock record. Our results indicate that lithospheric yield stress values lower than the present-day values (i.e., ≤100 MPa) can generate TTG volumes similar to those preserved in the rock record. The models further highlight the dominance of lithospheric dripping in producing the Archean TTGs. Large volumes of TTG melts form within the thin, tail portions of the drips as these regions are more efficiently heated by the enclosing hotter mantle. In contrast, only limited melting occurs within the thickened parts of lithosphere as they are significantly weak and cannot sustain crustal thickening for long time periods, resulting in its removal via dripping. This study, therefore, reaffirms the dominance of non-plate tectonic mechanisms in producing TTGs under the conditions that operated on the hotter Archean Earth.
Introduction
Continental crust has played a key role in the evolution of the Earth system (e.g., Cawood et al., 2013). While its production is controlled by plate tectonics on the modern Earth (e.g., Rudnick and Gao, 2003), the tectonic processes that formed felsic crust and continents on the early Earth remain debated and range from plate tectonic to non-plate tectonic settings (e.g., Martin and Moyen, 2002; Bedard, 2003; Foley et al., 2003; Rapp et al., 2003; Harrison, 2009; Smithies et al., 2009; Chowdhury et al., 2017; Johnson et al., 2017; Moyen and Laurent, 2018; Rosas and Korenaga, 2018; Capitanio et al., 2019; Smithies et al., 2019; Chowdhury et al., 2020; O’Neill et al., 2020; Turner et al., 2020). This uncertainty partly stems from the significant gap in the preserved rock record and therefore, in our limited knowledge about the proportion and nature of the early continental and oceanic lithospheres (Cawood et al., 2013; Cawood et al., 2018; Lenardic, 2018; Stern, 2018). Numerical modeling of the early Earth processes and ground truthing its results with the limited rock record is, therefore, an important way to understand the early Earth processes (Rozel et al., 2017; Capitanio et al., 2019; Gerya, 2019; Chowdhury et al., 2020).
One approach to understand the Archean continental crust forming processes is by constraining the physical properties of the lithosphere(s) prevalent at that time. Previous research has shown that whether or not a terrestrial planet manifests some form of plate tectonics will depend on the lithospheric yield stress, i.e., the plastic strength of the crustal and the underlying lithospheric mantle rocks (Moresi and Solomatov, 1998; Trompert and Hansen, 1998; Tackley, 2000; O’Neill and Lenardic, 2007; van Heck and Tackley, 2008; Korenaga 2010a; Korenaga, 2010b; Van Heck and Tackley, 2011). Based on the magnitude of this parameter, a planet can exist in stagnant-lid, episodic-lid or mobile-lid tectonic mode (Moresi and Solomatov, 1998), since changing the yield stress value affects the mantle convection pattern via affecting the viscosity contrast between the lithosphere and convecting mantle. For example, present-day continental crust production mainly occurs at subduction and orogenic settings within a plate tectonic (mobile-lid) regime where average lithospheric yield stresses vary within >100–150 MPa (Kohlstead et al., 1995; Gurnis, 1988; Lowman and Jarvis, 1999; Tackley, 2000). However, this parameter remains poorly constrained for the Archean lithosphere.
Here, we perform high resolution 2D numerical modeling of the lithospheric dynamics under hotter mantle conditions appropriate for the early-to-mid Archean (>3 Ga) time-period, for a range of yield stress values varying between 50 and 250 MPa. We evaluate the models by calibrating the tempo of granitoid formation as obtained from them with the preserved geological record, and thereby, seek to constrain the yield stress values of Archean lithosphere and the consequent tectonic settings responsible for the formation of early felsic crust. Changes in the lithospheric processes due to different yield stress values are likely to affect the pressure-temperature (P-T) conditions of tectonic environments where metamorphism and partial melting processes operate. This implies that yield stress values are implicitly linked to the formation conditions and volumes of Archean felsic crust, which can be independently constrained from other approaches, thus, can be used to trace it back for the ancient lithosphere.
Methodology
Numerical Methods
We model 2D-mantle convection at high mantle potential temperatures (Tp; ∼1,475–1,600°C) inferred for the Archean (Herzberg et al., 2007; Herzberg et al., 2010; Korenaga, 2013; Ganne and Feng, 2017; Aulbach and Arndt, 2019) using the numerical code Underworld 2 (Moresi et al., 2007). This code is based on the finite element method and is coupled with the particle-in-cell approach (Evans and Harlow, 1957). It involves a Eulerian grid with the moving Lagrangian particles embedded in a finite element (Moresi et al., 2007). Each particle represents a specific solid or molten rock-type (termed as rock-particle hereafter) and carries the information about its physical properties like, P, T, density, etc., which can be tracked over the entire model duration. The mass, momentum, and energy conservation equations are solved under incompressible conditions to find the pressure, velocity, and thermal evolution of the mantle convection model. Physical properties such as density and viscosity associated with the Earth’s interior are mapped to these equations through particle indexing. The mass, momentum, and energy conservation equations are:
where u, P,
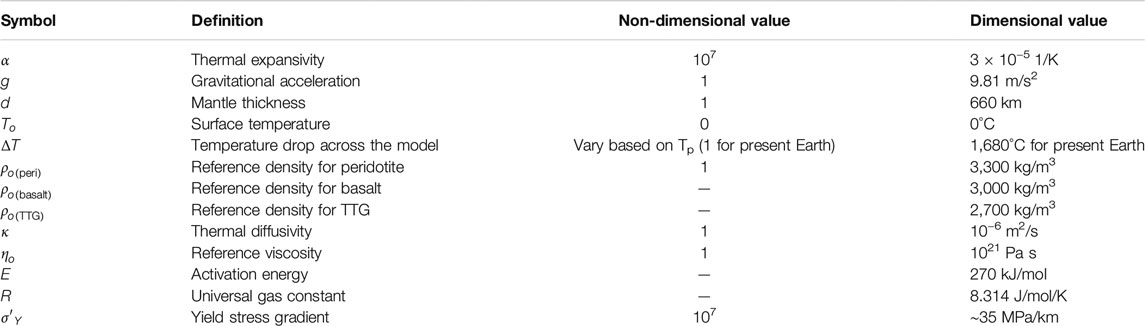
TABLE 1. Physical properties used in numerical modeling.
The temperature dependent diffusion creep rheology is applied using the Arrhenius equation (Rozel et al., 2017):
where
where
The dimensional values of the above non-dimensional parameters are retrieved using the relationships:
following scaling methods of Moresi and Solomatov (1998), Korenaga (2010b), and Van Heck and Tackley (2011). The primes represent the non-dimensional form of the variable and will be dropped here onwards, as we will only be dealing with non-dimensional symbols.
Partial Melting
To model felsic and mafic crust production, we implemented partial melting of the mantle peridotite and basaltic crust, including melt extraction, residue formation and eclogitization. For any rock-particle, melting initiates whenever its temperature exceeds its solidus. The adiabatic component of the temperature is added to the temperature solution (
where Tsolidus and Tliquidus represent solidus and liquidus temperatures (Figure 1; also see Appendix) and are taken from the previous studies (e.g., Sizova et al., 2015; Rozel et al., 2017; Chowdhury et al., 2020). The melting of felsic crust has not been considered here.
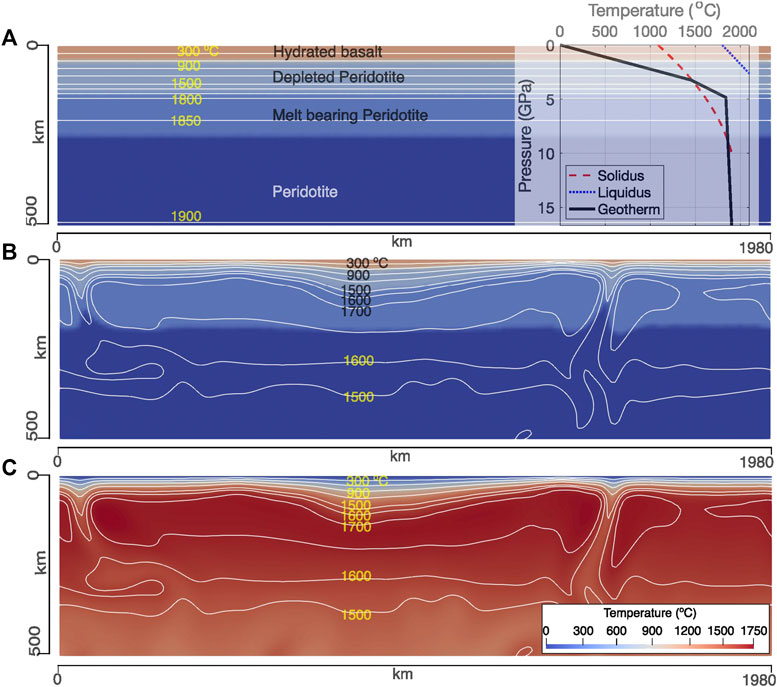
FIGURE 1. (A) The initial compositional setup used to reach a state of stable mantle convection. The geotherm corresponds to a mantle Tp of 1,600°C and mantle adiabat of 0.5°C/km. The thickness of basaltic crust is defined by a Moho-T of 600°C. (B,C) The compositional and thermal profile derived after a stable mantle convection pattern is established. The lithological particles in (B) has been redefined using the thermal profile shown in (C). This stage is considered as the start of model evolution for calculating the volume of tonalite-trondhjemite-granodiorite crust.
To extract melt from partially-molten lithologies, we define four threshold parameters (M1, M2, M3, and M4) following the algorithm of Sizova et al. (2015) for each rock-particle. M1 represents the non-extractable melt volume that always remains in a partially molten rock-particle, while M2 represents the minimum melt volume required for the melt-extraction to take place. The extracted melt volume is assumed to instantaneously leave the melting region and move to the surface (Schmeling, 2006). M3 is the maximum amount of melt that can be sustained in a crystalizing melt particle without melt fractionation. M4 is the maximum amount of cumulative melt that can be extracted from a rock-particle. Once a rock-particle melts beyond M4, it is considered infertile for further melting. All the threshold parameters are assigned distinct values according to the rock-type (mantle peridotite or basalt; see Appendix A1). The melt volume borne by a rock-particle at any instant of time
Density Calculations
The temperature dependent density (ρ) for different rock types is calculated using:
While ρmelt represents the temperature dependent density of the melt volume (M), ρsolid is the density of the solid part of the melt-bearing rock-types - called residue - that includes the effect of temperature, melt-extraction and eclogitization. It is calculated using:
where
The density of solid peridotite decreases due to melt depletion (e.g., Poudjom Djomani et al., 2001), which we have implemented using the relation:
Initial Setup and Boundary Conditions
Our 2D model domain is created with a 64 × 192 resolution Eulerian mesh and with 20 Lagrangian particles per cell. The model dimension is 660 km × 1,980 km (Figure 1A). A lithosphere with thick, hydrous basaltic crust is used in the models (Figure 1A) in accordance to the recent geological findings (e.g., Herzberg et al., 2010; Herzberg and Rudnick, 2012; Kamber, 2015; Johnson et al., 2017). The crustal thickness is set by the Moho temperature (Moho-T). Whenever a rock-particle exists within the upper 60 km of the model domain and its temperature is less than Moho-T, it is defined as basaltic crust. We varied the crustal thickness using three different values of Moho-T (500, 600, and 700°C). The relevant average basaltic crustal thickness for the model with mantle Tp 1,600°C and yield stress of 50 MPa case is presented in Appendix Figure A1. These different Moho-T values also simulate the effect of relatively colder and hotter crustal geotherms. Following the studies of Rey et al. (2014) and Sizova et al. (2015), the lithospheric thickness is thermally defined by 0°C at the surface and a temperature at a fixed depth of 100 km depending on the mantle Tp values. We further increased the mantle Tp value by 125, 200, and 250°C above its present-day value of 1,350°C in successive steps, which are consistent with the thermal conditions of Archean mantle (Herzberg et al., 2010; Korenaga, 2013). The ambient mantle temperature linearly increases following an adiabatic geotherm of ∼0.5°C/km below 150 km depth. Above 150 km, the mantle adiabat is linearly linked to the lithospheric geotherm over the depth interval of 100–150 km (Figure 1A). The top boundary is kept constant at 0°C while the bottom boundary is kept at constant temperature guided by the mantle Tp and the mantle adiabatic geothermal gradient (see Table 1). Free slip boundary conditions are imposed at the top and bottom of the model, while side walls are given periodic boundary condition. We have run all the models for a finite time at the beginning to reach a steady-state mantle convection (Figure 1C). Once this is achieved, the lithological layers are redefined according to the established steady-state thermal profile (Figure 1B). The stage is considered as the start of the model evolution.
Constraints From the Continental Rock Record
To evaluate our models, we predict the 1) relative abundances of various felsic igneous rocks and 2) the volume of continental crust that would have been formed during the early Archean (>3 Ga), and compare them against the volumes inferred from the rock record.
Comparison with the rock record of Tonalite-Trondhjemite-Granodiorites
To evaluate our models, we need information about the relative abundances of the different types of Tonalite-Trondhjemite-Granodiorite (TTG) - the dominant felsic lithologies that constitute Archean crust (reviewed in Moyen, 2011; Moyen and Laurent, 2018). Extant experimental and petrological studies show that the Archean TTGs mainly formed through the partial melting of hydrated metabasalts (Foley et al., 2003; Rapp et al., 2003; Moyen and Stevens, 2006; Qian and Hermann, 2013; Palin et al., 2016; Johnson et al., 2017). Our implemented algorithm of basalt melting is, thus, appropriate to model TTG formation. The trace element composition of TTGs further suggest that their formation occurred at three different pressure ranges: (Moyen, 2011): 1) at lower pressures (<1 GPa) where garnet-absent amphibolite residues are stable, called low-pressure (LP-) TTGs; 2) at intermediate pressures (∼1–2 GPa) where both garnet and plagioclase are present in the residue, called medium-pressure (MP-) TTGs; and 3) at high pressures (>2 GPa) where garnet and rutile are stable in the residue but not plagioclase, called high-pressure (HP-) TTGs. The bracketing pressure ranges, however, may vary depending on the source rock composition; for example, MP-TTGs can form at P < 1 GPa (∼0.7–0.8 GPa) from low-MgO enriched metabasalts (Johnson et al., 2017).
In this study, we focus on the formation of LP- and MP-TTGs as they dominate the >3 Ga rock record (cf. Moyen and Laurent, 2018), which is the time period of interest. We modeled partial melting of hydrous basaltic crust within a pressure range of 0.7–2.5 GPa, corresponding to a maximum depth of ∼75 km (Figure 2). Notwithstanding the ambiguities of nomenclature, this pressure range overlaps with the overall physical conditions of LP- and MP-TTGs formation during the Archean (Figure 2) (Palin et al., 2016; Johnson et al., 2017; Moyen and Laurent, 2018). Regarding the relative abundances, MP-TTGs constitute nearly 60% of the total TTG volume whereas LP- and HP-TTGs contribute equally toward the remaining 40% (Moyen, 2011; Moyen and Laurent, 2018). Since we focus on the LP- and MP-TTGs, we renormalize their proportions and obtain a ratio of 1:3 (∼25%:75%) between their abundances. Whenever a basaltic rock-particle melts, the resultant melt is classified as LP-/MP-/HP-TTG depending on in whose domain the melting took place (Figure 2). Melt is extracted once the melt-fraction reaches the threshold limit for extraction (M2) as mentioned above. The extracted melt volumes for each of the TTG-types are computed at each time step and added to the volumes of the previous time-steps. It must be noted that we did not consider water and basalt as separate entities and instead, assumed the basaltic crust to be sufficiently hydrated to produce the different TTG-types (e.g., Sizova et al., 2015; Chowdhury et al., 2020).
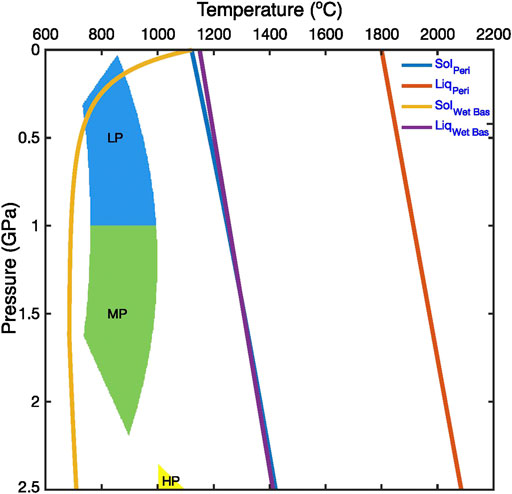
FIGURE 2. Pressure and temperature conditions of Low-Pressure (LP), Medium-Pressure (MP) and High-Pressure (HP) tonalite-trondhjemite-granodiorite formation (Reproduced from Moyen (2011) and Jain et al. (2019) under the Creative Commons CCBY license). The solidii and liquidii for mantle peridotite and hydrous basaltic crust (Sizova et al., 2015) are also shown. See Appendix for details.
Comparison with the volume of ∼3 Ga old continental crust
Comparing the total continental crustal volume between models and nature is not straightforward, particularly because of the large variations among different growth models and the difficulties in extrapolating the numerical model results at planetary scales. Estimates for the volume of continental crust at ∼3 Ga vary from ca. 10 to 120% of its present-day volume between the different growth models (Figure 3) (cf. Cawood and Hawkesworth, 2019). This is because these models are based on different assumptions and datasets. While some growth models are based on the present-day distribution of the continental crust (e.g., Condie and Aster, 2010), some others are schematic (e.g., Armstrong, 1981). A third group of growth models also exist that are based on datasets such as the proportions of juvenile vs. reworked crust inferred from the zircon data, the evolution of atmospheric argon, and the trace element and isotopic composition of mafic-ultramafic rocks (Campbell, 2003; Belousova et al., 2010; Dhuime et al., 2012; Pujol et al., 2013; Roberts and Spencer, 2015; McCoy-West et al., 2019). Here, we consider the volume estimates of this group of growth models since: 1) they do not rely on the present-day crustal distribution; thus, accounting for the current paucity of the early rock record and 2) they all independently show that at least 65–70% of the present-day continental volume existed by ∼3 Ga. It must be noted that besides granitoids, the Archean continental crust is also comprised of greenstone belt successions made up of mafic-ultramafic volcanic and volcaniclastic rock units (Moyen and Laurent, 2018; Smithies et al., 2018). The estimates of continental growth models are however, meant for the felsic component mainly (Dhuime et al., 2012; Pujol et al., 2013; cf.; Cawood et al., 2013).
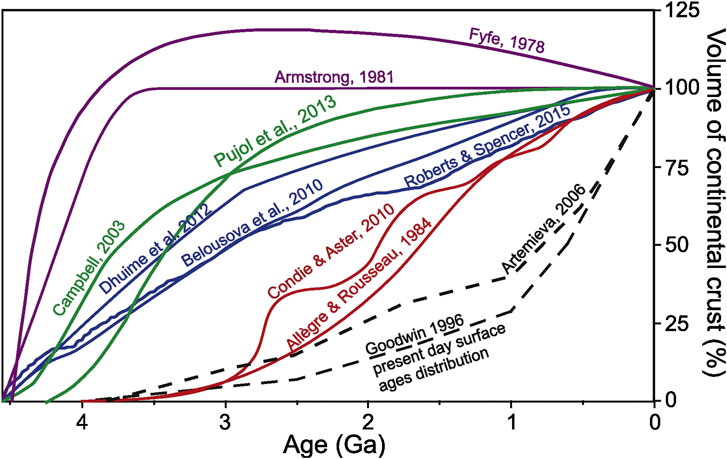
FIGURE 3. The growth models of the continental crust relative to its present-day volume (Reproduced from Cawood and Hawkesworth (2019) under the Creative Commons CCBY license). Note that the curves of Belousova et al. (2010), Dhuime et al. (2012), Roberts and Spencer (2015), Campbell (2003), Pujol et al. (2013), all of which used different proxies, predict similar volumes of continental crust at ∼3 Ga.
To measure crustal growth within our models, we introduce a parameter called the Differentiation Index (DI). Defined as the volume ratio of the continental crust to the upper mantle, this parameter quantifies how much continental crust has been extracted from the mantle and did not mix back (at least chemically); thus, accounting for the crustal recycling implicitly. Our approach follows the geochemical hypothesis that effectively continental crust has been extracted from the mantle (e.g., Rudnick and Gao, 2003). The DI value is estimated to be ∼2.4% for the modern Earth. It is calculated using the continental volume of ∼7.2 × 10⁹ km (cf. Cawood et al., 2013) and an upper mantle volume of ∼3.03 × 10¹¹ km (based on a spherical Earth of radius 6,371 km and an upper-lower mantle boundary at the depth of 660 km). The DI value at ∼3 Ga is ∼1.7%, which is calculated assuming the continental crustal volume to be ∼70% of the present-day volume and the same upper mantle volume. During the model evolution, we compute the total volume of TTG crust formed at each time-step (as mentioned above). We then use this accumulated TTG volume to compute DI at each time-step and trace over what duration its inferred value of ∼1.7% is achieved.
Model Results
Figure 4 illustrates the evolutionary stages of our reference numerical model, which has a surface yield stress of 50 MPa, a mantle Tp of 1,600°C (250°C higher than present-day), and a Moho-T of 600°C. The model evolution shows that two tectonic processes featuring local compression, called crustal thickening and dripping, occur under the influence of the convective flow of mantle. Thickening of the basaltic crust (Figure 4A) leads to phase transitions (i.e., eclogitization) within its deeper levels, which in turn increases the crustal density at those depths. Owing to a hotter geotherm set up by the hotter mantle and low yield stress, the crust could not support its gravitationally unstable eclogitized base and leads to the development of a Rayleigh-Taylor type instability within this region (Figure 4B). As this instability grows with time, a portion of the eclogitized crust drips back into the mantle (Figures 4C,D ). Such a process has been suggested to occur during the early Archean by previous studies (Johnson et al., 2014; Sizova et al., 2015; Rozel et al., 2017). Our model however, shows that: 1) individual drips may grow in length, reaching up to few hundreds of km (Figures 4A–D) and 2) individual dripping phases, i.e., from the appearance of the Rayleigh-Taylor-instability to the detachment stage, may last for ∼10 Myr. The cycle of crustal thickening evolving into dripping continue to occur over a periodicity of ∼20–30 Myr.
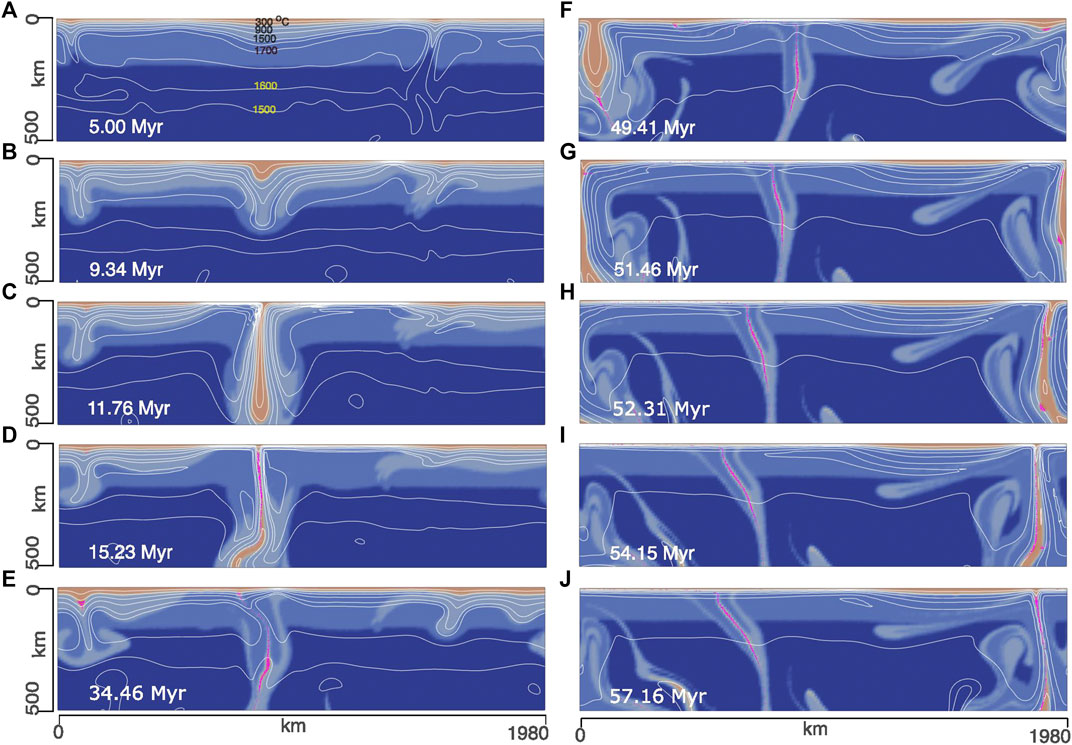
FIGURE 4. Evolution of the reference model with a surface yield stress of 50 MPa, mantle Tp of 1,600°C and Moho-T of 600°C. Mantle convection drives thickening of the basaltic crust (A), which eventually transform into a Rayleigh-Taylor type instability (B) and drips into the mantle (C–E). This cycle of crustal thickening followed by dripping continues. The residue forms during the production of tonalite-trondhjemite-granodiorite melt is shown in pink color. Within a period of ∼60 Myr, the model shows two major dripping phases: the first phase (B–E) between ∼9 and 34 Myr and the second phase (F–J) between ∼49 and 57 Myr. Note that this second phase is transferred across the (periodic) boundary from left to right in the model (G–H) around the ∼51–52 Myr time-period. The TTG formation mostly occurs during the dripping phase as compared to the thickening phase.
Regarding the formation felsic crust, the model shows that drips are more efficient in producing TTGs as compared to the basal part of a thickened crustal segment (cf. Figures 4A–D). The narrow tail region of a basaltic drip easily reaches supra-solidus temperatures due to the conductive heating from the surrounding hot mantle, resulting in its melting and the formation of TTGs. It must be noted that in our models we have shown the residues (pink colored lithology) formed after the production of TTGs. Therefore, although residues get transported at great mantle depths with the drips (Figures 4C,D), they have necessarily formed at depths <75 km since we did not allow melting of the basaltic crust beyond this depth limit. Figure 5 shows how the volumes of modeled LP-TTG and MP-TTG melts as well as their combined volume increase with time during the model evolution. The relative proportions of LP- to MP- TTG melts remain fairly constant (varying from ∼22%:78% to ∼30%:70%) around the ∼1:3 ratio throughout the model evolution (Figure 5B), which agrees well with the rock record (Moyen, 2011; Moyen and Laurent, 2018). In terms of the absolute volume, prominent spikes implying significant growth in the TTG volume, can be seen at ∼17.5, 56.8, and 100 Myr in the melt volume vs. time plot (Figure 5A). Notably, all these time-instants correspond to the active phases of dripping (Figure 5C). In contrast, melt volumes do not show any major increase when crustal thickening dominates the model evolution (Figure 5A), implying only limited mafic crustal melting in this setting.
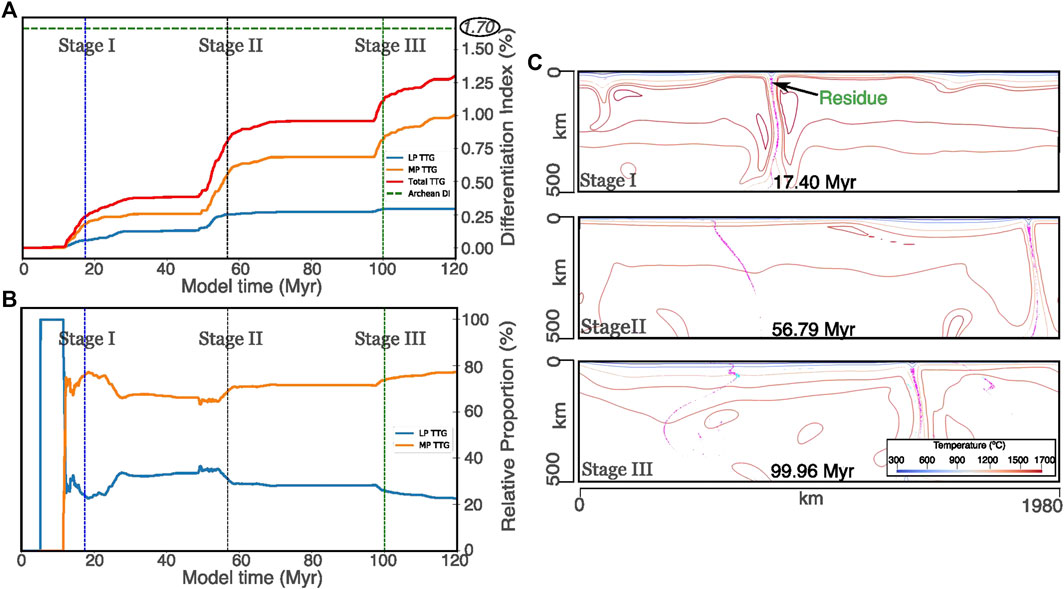
FIGURE 5. Evolution of (A) the volume of low-P tonalite-trondhjemite-granodiorite (TTG), medium-P TTG and total TTG crust [represented via Differentiation Index (DI)], and (B) the relative proportion of low-Pressure (LP) to medium-Pressure (MP) TTGs through model-time. The dashed green line in (A) represents the geologically constrained DI value (≥1.7) at 3 Ga (termed as Archean DI), corresponding to a continental volume of 70% of its present-day present-value (see text for details). Note that Stage-I, II, and III represent the major changes in the volume of TTG melts and total TTG crust. These stages correspond to (C) the three major, successive dripping phases in the model. The pink-coloured material represents the residue of the TTG melts. It must be noted that the residues form at shallow depths (P < 2 GPa) where LP- and MP- TTGs are prescribed to form, and then they get transported to deep mantle owing to greater density. The relative proportions of LP-TTGs to MP-TTGs remain around the ∼1:3 ratio throughout the model (except during the initial, few million years), which agrees with the preserved igneous rock record.
To test the effects of higher yield stress and Moho-T, we have simulated a model with a surface yield stress of 200 MPa and a Moho-T of 700°C under the mantle Tp of 1,600°C. This model also feature dripping (Figures 6A–C) and crustal thickening phases (Figures 6C–F) similar to the reference model. But, in this model, crustal thickening phases exhibit melting of the basaltic crust and TTG production in noticeable volumes (Figures 6E,F). A higher Moho-T along with a higher yield stress value leading to sustaining of thickened crustal domains over ∼20–30 Myr, facilitates melting at the base of the thickened basaltic crust. This substantiates our contention that Moho-T and yield stress values together influence the production of TTGs within thickened crustal domains. However, even within this setup, the overall volume of the TTGs is controlled by the melt produced during the dripping phase (Figures 6A–G). However, the relative proportion of modeled LP- to MP-TTG melt do not corroborate to the desired value of ∼1:3, rather they show sub-equal abundances (Figure 6H). Models with other values of yield stress, Moho-T and mantle Tp do not show any major deviation in their evolution from that of the reference model.
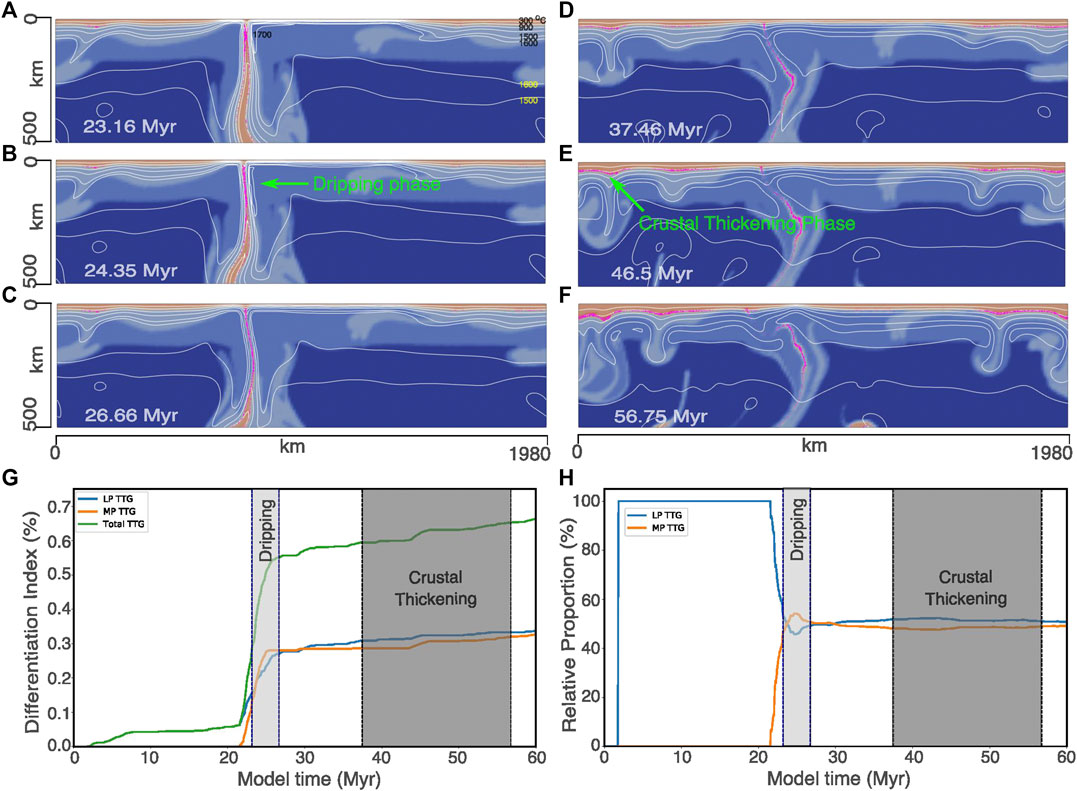
FIGURE 6. Evolution of a model with yield stress of 200 MPa, mantle Tp of 1,600°C and Moho-T of 700°C. While the overall model evolution (A–F) resembles that of the reference model, an enhanced production of tonalite-trondhjemite-granodiorites (TTGs) at the sites of thickened crust (E,F) is observed in this model. Evolution of (G) the TTG melt- and total TTG crustal volumes, and (H) relative proportions of (low-pressure) LP- to (medium-pressure) MP-TTGs through time. Crustal growth during the thickening phases (D–F) can be seen but the major growth still occurs during the dripping phases (A–C). Additionally, this model predicts an equal proportion of LP- and MP-TTGs during the Archean, which contrasts with the preserved rock record.
Furthermore, the model results show that TTG production and the resulting DI values increase with the lowering of lithospheric yield strength for any given mantle and Moho temperature conditions (Figure 7). When the mantle Tp range is within 1,500–1,600°C, only the models having a lithospheric yield stress of ∼50 to <100 MPa produces enough TTG volume such that their DI values approach or surpass the geological constrained DI value (∼1.7%) of the Earth approximately at 3 Ga within few hundreds of Myr (Figures 7A,B). However, at low yield stresses, the DI reaches ∼1.5–1.7% within ≤100 Myr when the Moho-T is 700°C irrespective of the mantle Tp (Figures 7A–C), implying an extremely rapid growth of felsic crust. In contrast, the DI values reach ∼0.5–1.2 in 100 Myr when the Moho-T is ∼600°C (Figures 7A–C); thereby, suggesting that the felsic crust grows steadily under these conditions and the DI values likely reach the ∼1.7% value in a few hundreds of Myr. A colder Moho (∼500°C) or mantle (<1,500°C Tp) seems to limit the TTG production such that the DI values remain <0.5 in 100 Myr (Figures 7A–C); thus, favoring a slow crustal growth. However, the estimated DI values likely reach the ∼1.7% in less than 1.5 Gyr for colder Moho (∼500°C) and/moderate Tp (∼1,540°C) and/higher yield stress (250 MPa) suggesting that slow crustal growth rates require excessively high lithospheric yield stress values. Even when the relative proportion of LP- and MP-TTGs are considered (Figures 7D–F), models with a combination of hotter mantle (>1,550°C Tp), moderately high Moho-T (∼500–600°C) and low lithospheric yield stresses (<150 MPa) provide the best agreement to the natural rock-record. A significantly hotter Moho (≥700°C; Figures 7D–F) or colder mantle (<1,500°C Tp; Figure 7F) would strongly favor or disfavour the production of LP-TTGs, respectively, (even for weak lithosphere), which in turn deviates the ratio of LP- to MP-TTGs from their geologically constrained value (∼1:3).
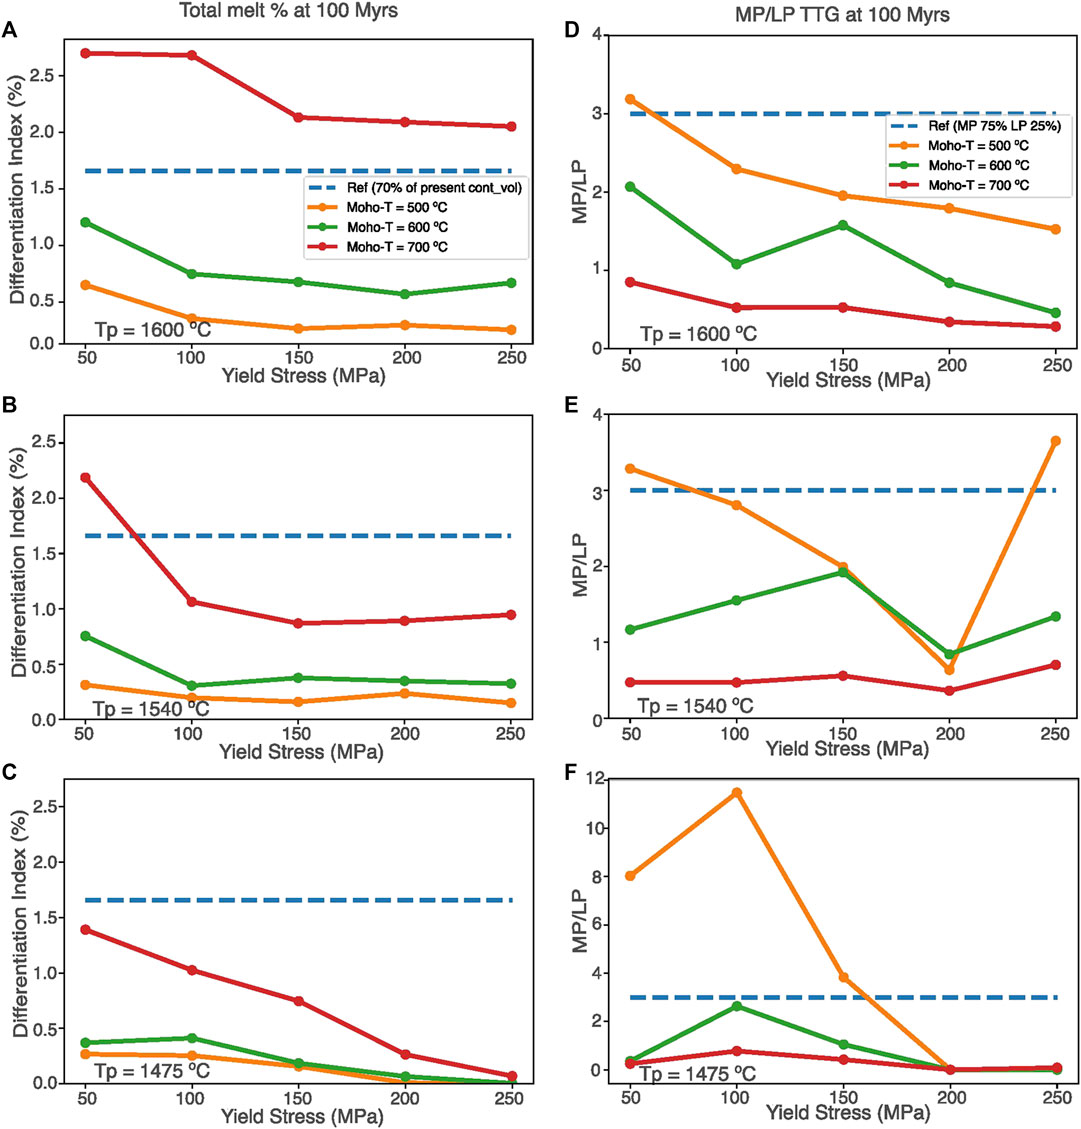
FIGURE 7. Plots showing (A–C) the total tonalite-trondhjemite-granodiorite (TTG) crustal volume cast in terms of the Differentiation Index (DI) value and (D–F) the proportions of low-pressure (LP-) to medium-pressure (MP-)TTGs as a function of lithospheric yield stress, as obtained from our numerical models with different mantle Tp and Moho-T values. The DI values are computed at the end of the first 100 Myr of the model evolution in each case. The dashed blue lines in (A–C) represent the geologically constrained DI value (≥1.7) at 3 Ga, while in (D–F) they represent the relative proportion of the LP-to MP-TTGs as preserved in the rock record (see text for details). Note that the models with low lithospheric yield stresses (at hotter mantle and moderate hotter Moho conditions) produce the DI values that are likely to result a continental volume of 70% of its present-day value (DI = ∼1.7) in few hundreds of Myr while matching the rock-record of the proportions of LP- and MP-TTGs.
Discussion
Yield Stress of the Archean Lithosphere
Our modeling shows that Archean lithosphere has somewhat lower yield strength compared to the present-day lithosphere (>100 MPa). The presence of such weaker lithosphere (together with hotter mantle) is critical for producing the large volumes of the Archean continental crust. This is because lowering the lithospheric yield stress facilitate the dripping-off of basaltic crustal segments, where the most favourable melting conditions (∼0.7–1.8 GPa; > 800°C) ascertained for the production of TTGs (e.g., Palin et al., 2016; Johnson et al., 2017; cf.; Moyen and Laurent, 2018), are easily attained. Furthermore, weaker lithosphere (with moderately high Moho-T) can aptly replicate the relative dominance of MP-TTGs over LP-TTGs similar to what is preserved in the rock-record. Higher values of yield stress (>100 MPa) would impede the formation of drips and therefore, would result in a lower abundance of MP-TTGs, particularly if the crust is not significantly thick and/or thermally pre-conditioned for melting. Consequently, we suggest that the yield strength of Archean lithosphere likely varied between ∼50 and 100 MPa, provided the mantle was significantly hotter than today.
The yield stress of material is temperature dependent in most engineering applications (Liu et al., 2002; Senkova et al., 2006; Heidarzadeh et al., 2014; Wu et al., 2014; Altenberger et al., 2015), as well as geological laboratory experiments related to different rock compositions (Evans and Goetze., 1979; Long et al., 2011; Sygała et al., 2013; Idrissi et al., 2016; Hansen et al., 2019). Therefore, owing to the hotter thermal structure and different crustal composition of Archean lithosphere relative to the present-day crust (Chardon et al., 2009; Dhuime et al., 2015; Tang et al., 2016; Brown et al., 2020), it is expected to have a lower yield strength. In fact, studies of how a lithosphere deforms have shown that it involves three main mechanisms: diffusion creep, dislocation creep and Peierls mechanism (Regenauer-Lieb et al., 2006), and ultimately results in a shear heating controlled rupture of the ductile harder lithospheric layer (Regenauer-Lieb et al., 2001; Thielmann and Kaus, 2012; Stern and Gerya, 2018). The yield stress that we apply is an average of a large number of processes, which are primarily thermally controlled and secondary pressure controlled, and determine the rupture of a lithosphere whose ultimate strength is thermally controlled (Braeck and Podladchikov, 2007). Consequently, the effect on the thermally driven tectonic style during the Archean, when the uppermost mantle boundary layer was hotter, is expected.
The results agree with laboratory experiments of rock deformation showing a lower yield stress with increasing temperature (Evans and Goetze., 1979; Long et al., 2011; Sygała et al., 2013; Idrissi et al., 2016; Hansen et al., 2019). Postulations of weaker lithosphere due to hotter mantle temperatures, higher radioactive heat generation and melt impregnation have been suggested by previous studies as well (e.g., van Hunen and van den Berg, 2008; Sizova et al., 2010; Magni et al., 2014; Rozel et al., 2017). Our results converge with these studies in finding a need for a weaker lithospheric strength. Overall, the lithospheric weakening could have occurred due to both viscous strength variations as well as yield strength variations with higher temperature conditions in the Archean Earth.
Tectonic Settings for the Early TTG Formation
Our modeling also bears implications for tectonic settings where the Archean felsic crust formation may have occurred. Previous studies have invoked both plate tectonic settings (mainly subduction) analogous to the present-day scenario (e.g., Foley et al., 2003; Harrison, 2009; Korenaga, 2018; Turner et al., 2020) or at various tectonic sites hosted within a stagnant-lid type tectonic regime (e.g., Smithies et al., 2009; Sizova et al., 2015; Johnson et al., 2017; Nebel et al., 2018; Smithies et al., 2019) for the formation of TTG-dominated crust during the Archean. Although the debate continues, recent studies are increasingly favoring the stagnant (squishy)-lid to transitional mobile-lid tectonic settings (not like modern plate tectonics) for the Archean crust formation (Johnson et al., 2014; Sizova et al., 2015; Chowdhury et al., 2017; Condie, 2017; Hawkesworth et al., 2017; Rozel et al., 2017; Johnson et al., 2017; Cawood et al., 2018; Moyen and Laurent, 2018; Capitanio et al., 2019; Smithies et al., 2019; Chowdhury et al., 2020). Tectonic processes like crustal thickening, dripping and local crustal overturns are suggested as settings for TTG production, particularly during the pre-3 Ga time-period (e.g., Smithies, 2000; Johnson et al., 2014; Sizova et al., 2015; Johnson et al., 2017). Our study highlights the relative dominance of these different non-plate tectonic mechanisms in producing TTGs. The reference model shows that production of TTG dominantly occurs during the dripping phase instead of during the crustal thickening phase. This partly contradicts the results of Sizova et al. (2015), which showed that crustal thickening promotes TTG production. However, they implemented an unusually high, initial Moho-T of ∼1,200°C, which is markedly higher than 600°C value used in our model. Such lower Moho-T values together with the rapid transition of the thickened crustal domains into drips (within <10 Myr) at low yield stresses, impeded large-scale melting of the mafic crust during crustal thickening in the reference model. This becomes evident when we increase the Moho-T and yield stress compared to the reference model and observed a greater proportion of melting within the thickened crustal domains.
Nonetheless, in all our models, the dripping process dominates TTG formation. We infer that this is because dripping continuously brings newer basaltic material to the melting region, maintaining a steady melting of the source rock (Figures 4 and 6). Secondly, dripping leads to crustal thinning and the resultant, mantle upwelling around the locale of the drip. This heats up the surrounding crust, which facilitates its subsequent melting. In contrast, only a thin layer of the lower most crust reaches melting conditions within a thickened crustal segment (Figures 6E,F). Given that crustal thickening occurs at a local scale and is not laterally pervasive, the resultant melting and TTG production is also limited. We, however, do not suggest that crustal thickening did not contribute toward Archean crustal growth. Instead, we imply that this may have contributed significantly only when an unusually hot (Moho-T > 1,000–1,200°C) and thick (>35–40 km) mafic crust was available for melting conditions that may have existed in the Archean but perhaps not everywhere (cf. Cawood and Hawkesworth, 2019).
Conclusions
The preserved record of early Archean felsic crust is more consistent with the presence of weaker lithosphere during active tectonism at those times. Tectonic activity involving such weaker lithosphere atop hotter mantle would have led to the production of voluminous TTG melt prior to ∼3 Ga, consistent with the inference of numerous crustal growth models. Our study further shows that TTG production may have dominantly occurred within mafic crustal drips, whereas crustal thickening made an only subordinate contribution unless the crust was significantly thicker. The low yield stress facilitated the drips to grow in length up to few hundreds of km and keeping them stable over tens of Myr. Furthermore, weaker lithosphere together with the dominance of dripping can also account for the large abundance of MP-TTGs relative to the LP-variant within the early Archean rock record.
Data Availability Statement
The raw data supporting the conclusions of this manuscript will be made available by the authors, without undue reservation, to any qualified researcher.
Author Contributions
PG—Overall research project is carried out from identifying the research problem, model development, and evaluation of results to drafting the manuscripts. GM—Provided support for the numerical model development, applying Geophysical significance, and Initial manuscript corrections. PC—Provided support in interpreting the model results, comparing them with the rock-record and manuscript development. PAC—The whole research project was guided by PAC from identifying the research problem to final manuscript development.
Funding
MIPRS and MGS PhD scholarship provided by Monash University, and Australian Research Council grant FL160100168.
Conflict of Interest
The authors declare that the research was conducted in the absence of any commercial or financial relationships that could be construed as a potential conflict of interest.
Acknowledgments
We acknowledge the computational resources provided by the Monash eResearch Center and eSolutions-Research Support Services (for the MonARCH HPC Cluster) and National Computational Infrastructure (NCI), Australia. We thank Jeroen van Hunen (Durham University) and two reviewers for their constructive comments that have immensely improved the manuscript. We also thank Christopher M. Gonzalez, Shayne McGregor, Fabio Capitanio, and John Mansour (Monash University) for insightful discussions.
Appendix
Appendix A1: Pressure-Temperature Conditions for Low-P, Medium-P and High-P TTG Formation
The pressure-temperature (P-T) conditions of LP- and MP-TTGs formation during the Archean (Figure 2) can be written as the following functions (Jain et al., 2019):
where, T is in °C and P is in GPa. Low-P TTGs generally forms at P < 0.8–1 GPa while the medium-P TTGs forms at P > 0.7–1 GPa, depending upon the actual source rock composition (Moyen, 2011; Palin et al., 2016; Johnson et al., 2017). For simplicity, our employed functions put this pressure bracket between low-P and medium-P TTGs at 1 GPa, following the traditional definition scheme put forward by Moyen (2011). The P-T conditions for forming the High-P TTG via partial melting of basalts is given by (Jain et al., 2019):
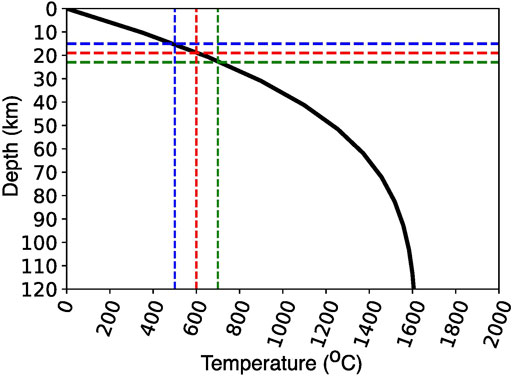
FIGURE A1. The average basaltic crustal thickness relevant for different Moho-T values for a model with yield stress of 50 MPa and mantle Tp of 1,600°C.
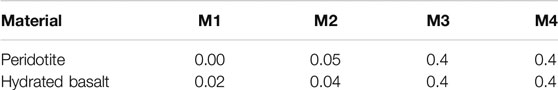
TABLE A1. Melt extraction threshold values.
Appendix A2: Solidii and Liquidii for Different Lithologies Used in the Modeling
For mantle melting, we used the P-T dependent peridotite melting model parametrized in Sizova et al. (2015).
where P is in GPa and T is in °C. For the melting of hydrated basalt, we used the following parametrized solidus and liquidus functions (Sizova et al., 2015):For, P < 1.6 GPa
for, 1.6 GPa < P < 10 GPa
References
Allègre, C. J., and Rousseau, D. (1984). The growth of the continent through geological time studied by Nd isotope analysis of shales. Earth Planet. Sci. Lett. 67 (1), 19–34.
Altenberger, I., Kuhn, H.-A., Müller, H. R., Mhaede, M., Gholami-Kermanshah, M., and Wagner, L. (2015). Material properties of high-strength beryllium-free copper alloys. Int. J. Mater. Prod. Technol. 50 (2), 124–146. doi:10.1504/IJMPT.2015.067820
Armstrong, R. L. (1981). Radiogenic isotopes: the case for crustal recycling on a near-steady-state no-continental-growth earth. Phil. Trans. A Math. Phys. Sci. 301 (1461), 443–472. doi:10.1098/rsta.1981.0122
Artemieva, I. M. (2006). Global 1° × 1° thermal model TC1 for the continental lithosphere: implications for lithosphere secular evolution. Tectonophysics 416 (1–4), 245–277. doi:10.1016/j.tecto.2005.11.022
Aulbach, S., and Arndt, N. T. (2019). Eclogites as palaeodynamic archives: evidence for warm (not hot) and depleted (but heterogeneous) Archaean ambient mantle. Earth Planet. Sci. Lett. 505, 162–172. doi:10.1016/j.epsl.2018.10.025
Bédard, J. H. (2003). Evidence for regional‐scale, pluton‐driven, high‐grade metamorphism in the archaean minto block, northern Superior province, Canada. J. Geol. 111, 183–205. doi:10.1086/345842
Belousova, E. A., Kostitsyn, Y. A., Griffin, W. L., Begg, G. C., O’Reilly, S. Y., and Pearson, N. J. (2010). The growth of the continental crust: constraints from zircon Hf-isotope data. Lithos 119 (3–4), 457–466. doi:10.1016/j.lithos.2010.07.024
Braeck, S., and Podladchikov, Y. Y. (2007). Spontaneous thermal runaway as an ultimate failure mechanism of materials. Phys. Rev. Lett. 98 (9), 095504. doi:10.1103/physrevlett.98.095504
Brown, M., Johnson, T., and Gardiner, N. J. (2020). Plate tectonics and the archean earth. Annu. Rev. Earth Planet. Sci. 48, 1–12. doi:10.1146/annurev-earth-081619–052705
Campbell, I. H. (2003). Constraints on continental growth models from Nb/U ratios in the 3.5 Ga Barberton and other Archaean basalt-komatiite suites. Am. J. Sci. 303 (4), 319–351. doi:10.2475/ajs.303.4.319
Capitanio, F. A., Nebel, O., Cawood, P. A., Weinberg, R. F., and Chowdhury, P. (2019). Reconciling thermal regimes and tectonics of the early Earth. Geology 47, 923–927. doi:10.1130/g46239.1
Cawood, P. A., and Hawkesworth, C. J. (2019). Continental crustal volume, thickness and area, and their geodynamic implications. Gondwana Res. 66, 116–125. doi:10.1016/j.gr.2018.11.001
Cawood, P. A., Hawkesworth, C. J., and Dhuime, B. (2013). The continental record and the generation of continental crust. Geol. Soc. Am. Bull. 125 (1–2), 14–32. doi:10.1130/b30722.1
Cawood, P. A., Hawkesworth, C. J., Pisarevsky, S. A., Dhuime, B., Capitanio, F. A., and Nebel, O. (2018). Geological archive of the onset of plate tectonics. Philos. Trans. A Math. Phys. Eng. Sci. 376 (2132), 20170405. doi:10.1098/rsta.2017.0405
Chardon, D., Gapais, D., and Cagnard, F. (2009). Flow of ultra-hot orogens: a view from the Precambrian, clues for the Phanerozoic. Tectonophysics 477, 105–118. doi:10.1016/j.tecto.2009.03.008
Chowdhury, P., Chakraborty, S., Gerya, T. V., Cawood, P. A., and Capitanio, F. A. (2020). Peel-back controlled lithospheric convergence explains the secular transitions in Archean metamorphism and magmatism. Earth Planet. Sci. Lett. 538, 116224. doi:10.1016/j.epsl.2020.116224
Chowdhury, P., Gerya, T., and Chakraborty, S. (2017). Emergence of silicic continents as the lower crust peels off on a hot plate-tectonic Earth. Nat. Geosci. 10, 698–703. doi:10.1038/ngeo3010
Condie, K. C. (2017). A planet in transition: the onset of plate tectonics on Earth between 3 and 2 Ga? Geosci. Front. 9, 51–60. doi:10.1016/j.gsf.2016.09.001
Condie, K. C., and Aster, R. C. (2010). Episodic zircon age spectra of orogenic granitoids: the supercontinent connection and continental growth. Precambrian Res. 180 (3–4), 227–236. doi:10.1016/j.precamres.2010.03.008
Dhuime, B., Hawkesworth, C. J., Cawood, P. A., and Storey, C. D. (2012). A change in the geodynamics of continental growth 3 billion years ago. Science 335, 1334–1336. doi:10.1126/science.1216066
Dhuime, B., Wuestefeld, A., and Hawkesworth, C. J. (2015). Emergence of modern continental crust about 3 billion years ago. Nat. Geosci. 8 (7), 552–555. doi:10.1038/ngeo2466
Evans, B., and Goetze, C. (1979). The temperature variation of hardness of olivine and its implication for polycrystaline yield stress. J. Geophys. Res. 84, 5505–5524. doi:10.1029/jb084ib10p05505
Evans, M. W., and Harlow, F. H. (1957). The particle-in-cell method for hydrodynamic calculations. Los Angels, CA: Los Almos National Laboratory Report, 2139.
Foley, S. F., Buhre, S., and Jacob, D. E. (2003). Evolution of the Archean crust by delamination and shallow subduction. Nature 421, 241–252. doi:10.1038/nature01319
Fyfe, W. S. (1978). The evolution of the earth’s crust: modern plate tectonics to ancient hot spot tectonics? Chem. Geol. 23 (1–4), 89–114. doi:10.1016/0009-2541(78)90068-2
Ganne, J., and Feng, X. (2017). Primary magmas and mantle temperatures through time. Geochem. Geophys. Geosyst. 18, 872–888. doi:10.1002/2016gc006787
Gerya, T. V. (2010). Introduction to numerical geodynamic modelling. New York, NY: Cambridge University Press.
Gerya, T. V. (2019). Geodynamics of the early Earth: quest for the missing paradigm. Geology 47 (10), 1006–1007. doi:10.1130/focus-Oct2019
Gurnis, M. (1988). Large-scale mantle convection and the aggregation and dispersal of supercontinents. Nature 332 (6166), 695–699. doi:10.1038/332695a0
Harrison, T. M. (2009). The Hadean crust: evidence from >4 Ga zircons. Annu. Rev. Earth Planet. Sci. 37, 479–505. doi:10.1146/annurev.earth.031208.100151
Hansen, L. N., Kumamoto, K. M., Thom, C. A., Wallis, D., Durham, W. B., Goldsby, D. L., et al. (2019). Low-temperature plasticity in olivine: grain size, strain hardening, and the strength of the lithosphere. J. Geophys. Res. Solid Earth 124, 5427–5449. doi:10.1029/2018jb016736
Hawkesworth, C. J., Cawood, P. A., Dhuime, B., and Kemp, T. I. S. (2017). Earth’s continental lithosphere through time. Annu. Rev. Earth Planet. Sci. 45, 169–198. doi:10.1146/annurev-earth-063016-020525
Heidarzadeh, A., Jabbari, M., and Esmaily, M. (2015). Prediction of grain size and mechanical properties in friction stir welded pure copper joints using a thermal model. Int. J. Adv. Manuf. Technol 77 (9–12), 1819–1829. doi:10.1007/s00170-014-6543-7
Herzberg, C., Asimow, P. D., Arndt, N., Niu, Y., Lesher, C. M., Fitton, J. G., et al. (2007). Temperatures in ambient mantle and plumes: constraints from basalts, picrites and komatiites. Geochem. Geophys. Geosyst. 8, Q02006. doi:10.1029/2006gc001390
Herzberg, C., Condie, K., and Korenaga, J. (2010). Thermal history of the Earth and its petrological expression. Earth Planet. Sci. Lett. 292, 79–88. doi:10.1016/j.epsl.2010.01.022
Herzberg, C., and Rudnick, R. (2012). Formation of cratonic lithosphere: an integrated thermal and petrological model. Lithos 149, 4–15. doi:10.1016/j.lithos.2012.01.010
Idrissi, H., Bollinger, C., Boioli, F., Schryvers, D., and Cordier, P. (2016). Low-temperature plasticity of olivine revisited with in situ tem nanomechanical testing. Sci. Adv. 2, e1501671. doi:10.1126/sciadv.1501671
Ito, K., and Kennedy, G. C. (1971). “An experimental study of the basalt-garnet granulite-eclogite transition.” in The structure and physical properties of the Earth’s crust. Editor Heacock, J. G. (American Geophysical Union), Vol. 14, 303–314.
Jain, C., Rozel, A. B., Tackley, P. J., Sanan, P., and Gerya, T. V. (2019). Growing primordial continents self-consistently in global mantle convection models. Gondwana Res. 73, 96–122. doi:10.1016/j.gr.2019.03.015
Johnson, T. E., Brown, M., Gardiner, N. J., Kirkland, C. L., and Smithies, R. H. (2017). Earth’s first stable continents did not form by subduction. Nature 543, 239–242. doi:10.1038/nature21383
Johnson, T. E., Brown, M., Kaus, B. J. P., and Van Tongeren, J. A. (2014). Delamination and recycling of Archaean crust caused by gravitational instabilities. Nat. Geosci. 7, 47–52. doi:10.1038/ngeo2019
Kamber, B. S. (2015). The evolving nature of terrestrial crust from the Hadean, through the Archaean, into the Proterozoic. Precambrian Res. 258, 48–82. doi:10.1016/j.precamres.2014.12.007
Kohlstedt, D. L., Evans, B., and Mackwell, S. J. (1995). Strength of the lithosphere: constraints imposed by laboratory experiments. J. Geophys. Res. 100, 17587–17602. doi:10.1029/95jb01460
Korenaga, J., (2010a). On the likelihood of plate tectonics on super-Earths: does size matter?Astrophys. J. Lett. 725, L43–L46. doi:10.1088/2041-8205/725/1/l43
Korenaga, J. (2010b). Scaling of plate-tectonic convection with pseudoplastic rheology. J. Geophys. Res 115, B11405. doi:10.1029/2010jb007670
Korenaga, J. (2013). Initiation and evolution of plate tectonics on Earth: theories and observations. Annu. Rev. Earth Planet. Sci. 41, 117–151. doi:10.1146/annurev-earth-050212-124208
Korenaga, J. (2018). Crustal evolution and mantle dynamics through Earth history. Philos. Trans. A Math. Phys. Eng. Sci. 376 (2132), 20170408. doi:10.1098/rsta.2017.0408
Lenardic, A. (2018). The diversity of volcanic-tectonic modes and thoughts about transitions between them. Philos. Trans. A Math. Phys. Eng. Sci. 376 (2132), 20170416. doi:10.1098/rsta.2017.0416
Liu, Z. C., Lin, J. P., Li, S. J., and Chen, G. L. (2002). Effects of Nb and Al on the microstructures and mechanical properties of high Nb containing TiAl base alloys. Intermetallics 10, 653–659. doi:10.1016/s0966-9795(02)00037-7
Long, H., Weidner, D. J., Li, L., Chen, J., and Wang, L. (2011). Deformation of olivine at subduction zone conditions determined from in situ measurements with synchrotron radiation. Earth Planet. Sci. Lett. 186, 23–35. doi:10.1016/j.pepi.2011.02.006
Lowman, J. P., and Jarvis, G. T. (1999). Effects of mantle heat source distribution on supercontinent sability. J. Geophys. Res. 104 (6), 12733–12747. doi:10.1029/1999jb900108
Magni, V., Bouilhol, P., and van Hunen, J. (2014). Deep water recycling through time Geochem. Geochem. Geophys. Geosyst. 15 (11), 4203–4216. doi:10.1002/2014GC005525
Martin, H., and Moyen, J.-F. (2002). Secular changes in TTG composition as markers of the progressive cooling of the Earth. Geology 30 (4), 319–322. doi:10.1130/0091-7613(2002)030<0319:scittg>2.0.co;2
McCoy-West, A. J., Chowdhury, P., Burton, K. W., Sossi, P., Nowell, G. M., Fitton, J. G., et al. (2019). Extensive crustal extraction in Earth’s early history inferred from molybdenum isotopes. Nat. Geosci. 12, 946–951. doi:10.1038/s41561-019-0451-2
Moresi, L., Quenette, S., Lemiale, V., Mériaux, C., Appelbe, B., and Mülhaus, H. B. (2007). Computational approaches to studying non-linear dynamics of the crust and mantle. Phys. Earth Planet. Inter. 163 (1–4), 69–82. doi:10.1016/j.pepi.2007.06.009
Moresi, L., and Solomatov, V. (1998). Mantle convection with a brittle lithosphere: thoughts on the global tectonic styles of the Earth and Venus. Geophys. J. Int. 133, 669–682. doi:10.1046/j.1365-246x.1998.00521.x
Moyen, J.-F. (2011). The composite Archean grey gneisses: petrological significance, and evidence for a non-unique tectonic setting for Archean crustal growth. Lithos 123, 21–36. doi:10.1016/j.lithos.2010.09.015
Moyen, J.-F., and Laurent, O. (2018). Archaean tectonic systems: a view from igneous rocks. Lithos 302 (303), 99–125. doi:10.1016/j.lithos.2017.11.038
Moyen, J.-F., and Stevens, G. (2006). “Experimental constraints on TTG petrogenesis: implications for Archean geodynamics.” in Archean geodynamics and environments. Editors K. Benn, J. -C. Mareschal, and K. C. Condie (AGU), 149–178.
Nebel, O., Capitanio, F. A., Moyen, J.-F., Weinberg, R. F., Clos, F., Nebel-Jacobsen, Y. J., et al. (2018). When crust comes of age: on the chemical evolution of Archaean, felsic continental crust by crustal drip tectonics. Philos. Trans. A Math. Phys. Eng. Sci. 376 (2132), 20180103. doi:10.1098/rsta.2018.0103
O’Neill, C., and Lenardic, A. (2007). Geological consequences of super-sized Earths. Geophys. Res. Lett. 34, L19204. doi:10.1029/2007gl030598
O’Neill, C., Marchi, S., Bottke, W., and Fu, R. (2020). The role of impacts on Archaean tectonics. Geology 48, 174–178. doi:10.1130/G46533.1
Palin, R. M., White, R. W., and Green, E. C. R. (2016). Partial melting of metabasic rocks and the generation of tonalitic–trondhjemitic–granodioritic (TTG) crust in the Archaean: constraints from phase equilibrium modelling. Precambrian Res. 287, 73–90. doi:10.1016/j.precamres.2016.11.001
Poudjom Djomani, Y. H., O’Reilly, S. Y., Griffin, W. L., and Morgan, P. (2001). The density structure of subcontinental lithosphere through time. Earth Planet. Sci. Lett 184, 605–621. doi:10.1016/s0012-821x(00)00362-9
Pujol, M., Marty, B., Burgess, R., Turner, G., and Philippot, P. (2013). Argon isotopic composition of Archaean atmosphere probes early Earth geodynamics. Nature 498, 87–90. doi:10.1038/nature12152
Qian, Q., and Hermann, J. (2013). Partial melting of lower crust at 10–15 kbar: constraints on adakite and TTG formation. Contrib. Mineral. Petrol. 165, 1195–1224, doi:10.1007/s00410-013-0854-9.
Rapp, R. P., Shimizu, N., and Norman, M. D. (2003). Growth of early continental crust by partial melting of eclogite. Nature 425, 605–609. doi:10.1038/nature02031
Regenauer-Lieb, K., Weinberg, R. F., and Rosenbaum, G. (2006). The effect of energy feedbacks on continental strength. Nature 442 (7098), 67–70. doi:10.1038/nature04868
Regenauer-Lieb, K., Yuen, D. A., and Branlund, J. (2001). The initiation of subduction: critically by addition of water? Science 294, 578–580. doi:10.1126/science.1063891
Rey, P. F., Coltice, N., and Flament, N. (2014). Spreading continents kick-started plate tectonics. Nature 513, 405–408. doi:10.1038/nature13728
Roberts, N. M. W., and Spencer, C. J. (2015). The zircon archive of continent formation through time. Geol. Soc. Lond. Spec. Publ. 389 (1), 197–225. doi:10.1144/sp389.14
Rosas, J. C., and Korenaga, J. (2018). Rapid crustal growth and efficient crustal recycling in the early Earth: implications for Hadean and Archean geodynamics. Earth Planet. Sci. Lett. 494, 42–49. doi:10.1016/j.epsl.2018.04.051
Rozel, A. B., Golabek, G. J., Jain, C., Tackley, P. J., and Gerya, T. V. (2017). Continental crust formation on early Earth controlled by intrusive magmatism. Nature 545, 332–335. doi:10.1038/nature22042
Rudnick, R. L., and Gao, S. (2003). “Composition of the continental crust,” in Treatise on geochemistry. Editors Holland, H. D., Turekian, K. K. (Amsterdam, Netherlands: Elsevier), Vol. 3, 1–64. doi:10.1016/B0-08-043751-6/03016-4
Schmeling, H. (2006). A model of episodic melt extraction for plumes. J. Geophys. Res. 111, B03202. doi:10.1029/2004jb003423
Senkova, S. V., Senkov, O. N., and Miracle, D. B. (2006). Cryogenic and elevated temperature strengths of an Al–Zn–Mg–Cu alloy modified with Sc and Zr. Metall. Mater. Trans. A 37, 3569–3575. doi:10.1007/s11661-006-1051-5
Sizova, E., Gerya, T., Brown, M., and Perchuk, L. L. (2010). Subduction styles in the Precambrian: insight from numerical experiments. Lithos 116, 209–229. doi:10.1016/j.lithos.2009.05.028
Sizova, E., Gerya, T., Stüwe, K., and Brown, M. (2015). Generation of felsic crust in the Archean: a geodynamic modeling perspective. Precambrian Res. 271, 198–224. doi:10.1016/j.precamres.2015.10.005
Smithies, R. H. (2000). The Archaean tonalite–trondhjemite–granodiorite (TTG) series is not an analogue of Cenozoic adakite. Earth Planet. Sci. Lett. 182, 115–125. doi:10.1016/s0012-821x(00)00236-3
Smithies, R. H., Champion, D. C., and Van Kranendonk, M. J. (2009). Formation of Paleoarchean continental crust through infracrustal melting of enriched basalt. Earth Planet. Sci. Lett. 281, 298–306. doi:10.1016/j.epsl.2009.03.003
Smithies, R. H., Ivanic, T. J., Lowrey, J. R., Morris, P. A., Barnes, S. J., Wyche, S., et al. (2018). Two distinct origins for Archean greenstone belts. Earth Planet. Sci. Lett. 487, 106–116. doi:10.1016/j.epsl.2018.01.034
Smithies, R. H., Lu, Y., Johnson, T. E., Kirkland, C. L., Cassidy, K. F., Champion, D. C., et al. (2019). No evidence for high-pressure melting of Earth’s crust in the Archean. Nat. Commun. 10, 5559. doi:10.1038/s41467-019-13547-x
Stern, R. J., (2018). The evolution of plate tectonics. Philos. Trans. A Math. Phys. Eng. Sci. 376 (2132), 20170406. doi:10.1098/rsta.2017.0406
Stern, R. J., and Gerya, T. (2018). Subduction initiation in nature and models: a review. Tectonophysics 746, 173–198. doi:10.1016/j.tecto.2017.10.014
Sygała, A., Bukowska, M., and Janoszek, T. (2013). High temperature versus geomechanical parameters of selected rocks-the present state of research. J. Sustain. Min. 12 (4), 45–51. doi:10.7424/jsm130407
Tackley, P. J., (2000). Self-consistent generation of tectonic plates in time-dependent, three-dimensional mantle convection simulations, 1, Pseudoplastic yielding. Geochem. Geophys. Geosyst. 1 (8), 200GC000036. doi:10.1029/2000gc000036
Tackley, P. J. (2000a). “The quest for self-consistent incorporation of plate tectonics in mantle convection,” in History and dynamics of global plate Motions. Editor Richards, M. A. (AGU).
Tang, M., Chen, K., and Rudnick, R. L. (2016). Archean upper crust transition from mafic to felsic marks the onset of plate tectonics. Science 351, 372–375. doi:10.1126/science.aad5513
Thielmann, M., and Kaus, B. J. P. (2012). Shear heating induced lithospheric-scale localization: does it result in subduction? Earth Planet. Sci. Lett. 359 (360), 1–13. doi:10.1016/j.epsl.2012.10.002
Trompert, R., and Hansen, U. (1998). Mantle convection simulations with rheologies that generate plate-like behaviour. Nature 395, 686–689. doi:10.1038/27185
Turner, S., Wilde, S., Wörner, G., Schaefer, B., and Lai, Y.-J. (2020). An andesitic source for Jack Hills zircon supports onset of plate tectonics in the Hadean. Nat. Commun. 11, 1241. doi:10.1038/s41467-020-14857-1
van Heck, H. J., and Tackley, P. J. (2008). Planforms of self-consistently generated plates in 3-d spherical geometry. Geophys. Res. Lett. 35, L19312. doi:10.1029/2008gl035190
van Heck, H. J., and Tackley, P. J. (2011). Plate tectonics on super-earths: equally or more likely than on earth. Earth Planet. Sci. Lett. 310 (3–4), 252–261. doi:10.1016/j.epsl.2011.07.029
van Hunen, J., and van den Berg, A. P. (2008). Plate tectonics on the early Earth: limitations imposed by strength and buoyancy of subducted lithosphere. Lithos 103 (1–2), 217–235. doi:10.1016/j.lithos.2007.09.016
Wu, Z., Bei, H., Pharr, G. M., and George, E. P. (2014). Temperature dependence of the mechanical properties of equiatomic solid solution alloys with face-centered cubic crystal structures. Acta Mater. 81, 428e441. doi:10.1016/j.actamat.2014.08.026
Zhang, C., Holtz, F., Koepke, J., Wolff, P. E., Ma, C., and Bédard, J. H. (2013). Constraints from experimental melting of amphibolite on the depth of formation of garnet-rich restites, and implications for models of Early Archean crustal growth. Precambrian Res. 231, 206–217. doi:10.1016/j.precamres.2013.03.004
Keywords: Archean, TTG, geodynamics, yield stress, dripping
Citation: Gunawardana PM, Morra G, Chowdhury P and Cawood PA (2020) Calibrating the Yield Strength of Archean Lithosphere Based on the Volume of Tonalite-Trondhjemite-Granodiorite Crust. Front. Earth Sci. 8:548724. doi: 10.3389/feart.2020.548724
Received: 03 April 2020; Accepted: 24 August 2020;
Published: 24 September 2020.
Edited by:
Jeroen Van Hunen, Durham University, United KingdomReviewed by:
Kent Condie, New Mexico Institute of Mining and Technology, United StatesJ. Elis Hoffmann, Freie Universität Berlin, Germany
Copyright © 2020 Gunawardana, Morra, Chowdhury and Cawood. This is an open-access article distributed under the terms of the Creative Commons Attribution License (CC BY). The use, distribution or reproduction in other forums is permitted, provided the original author(s) and the copyright owner(s) are credited and that the original publication in this journal is cited, in accordance with accepted academic practice. No use, distribution or reproduction is permitted which does not comply with these terms.
*Correspondence: Prasanna M. Gunawardana, prasanna.gunawardana@monash.edu