Cost Effectiveness of Ecosystem-Based Nutrient Targets—Findings from a Numerical Model for the Baltic Sea


Department of Economics, Swedish University of Agricultural Sciences, P.O. Box 7013, 75007 Uppsala, Sweden
*
Author to whom correspondence should be addressed.
Water 2020, 12(10), 2679; https://doi.org/10.3390/w12102679
Submission received: 22 August 2020
/
Revised: 14 September 2020
/
Accepted: 21 September 2020
/
Published: 24 September 2020
(This article belongs to the Section Oceans and Coastal Zones)
Abstract
:An ecosystem-based management of a large sea can give heterogeneous nutrient load targets for different parts of the sea. Cost effective solutions to heterogeneous nutrient reductions targets based on ecological conditions are compared with the same overall nutrient reductions to the Baltic Sea. To this end, a numerical programming model is used, which includes eight different nutrient abatement measures (fertilizer and livestock reduction, cultivation of catch crops, reduced airborne nitrogen emissions, improved cleaning at sewage treatment plants, construction of wetlands and buffer strips, and mussel farming) in 21 catchments of the Baltic Sea. The results indicate that the cost for the international agreement on maximum load targets to different marine basins amounts to 5.3 billion euro. This is more than twice as large as the cost for the same total nutrient load targets to the Baltic Sea without specific targets for the marine basins. However, the resulting nutrient loads to the different marine basins deviate from the basin targets where the loads are lower for some basins but can exceed that for one basin, Baltic Proper, by approximately 22 per cent. Whether or not the ecological costs and benefits from deviations in basin targets under the Baltic Sea targets exceed the excess abatement cost of 2.9 billion euro for achieving the marine basin targets remains to be verified.
1. Introduction
The EU Marine Strategy Framework Directive envisages that the management of marine waters shall be guided by an ecosystem-based approach (EU [1]). The management can then be focused on marine regions or subregions, such as different marine basins in a sea. This could imply different nutrient targets within a sea, which is the case for nutrient load targets for the Baltic Sea [2]. However, movements of nutrients in the sea makes it difficult to target nutrient reductions from land to specific marine basins (e.g., [3]). It is also well-known in economics that detailed targets at the spatial scale imply high costs for reaching a given overall pollutant reduction target (e.g., [4]). If the difference in costs between detailed and overall targets is large, it may be of interest for society to consider overall targets and compare the spatial outcomes with the more detailed ecosystem-based targets. Despite the large literature on cost effective nutrient reductions (e.g., [5,6,7]), there is no study comparing costs and spatial outcomes between overall and ecosystem-based targets.
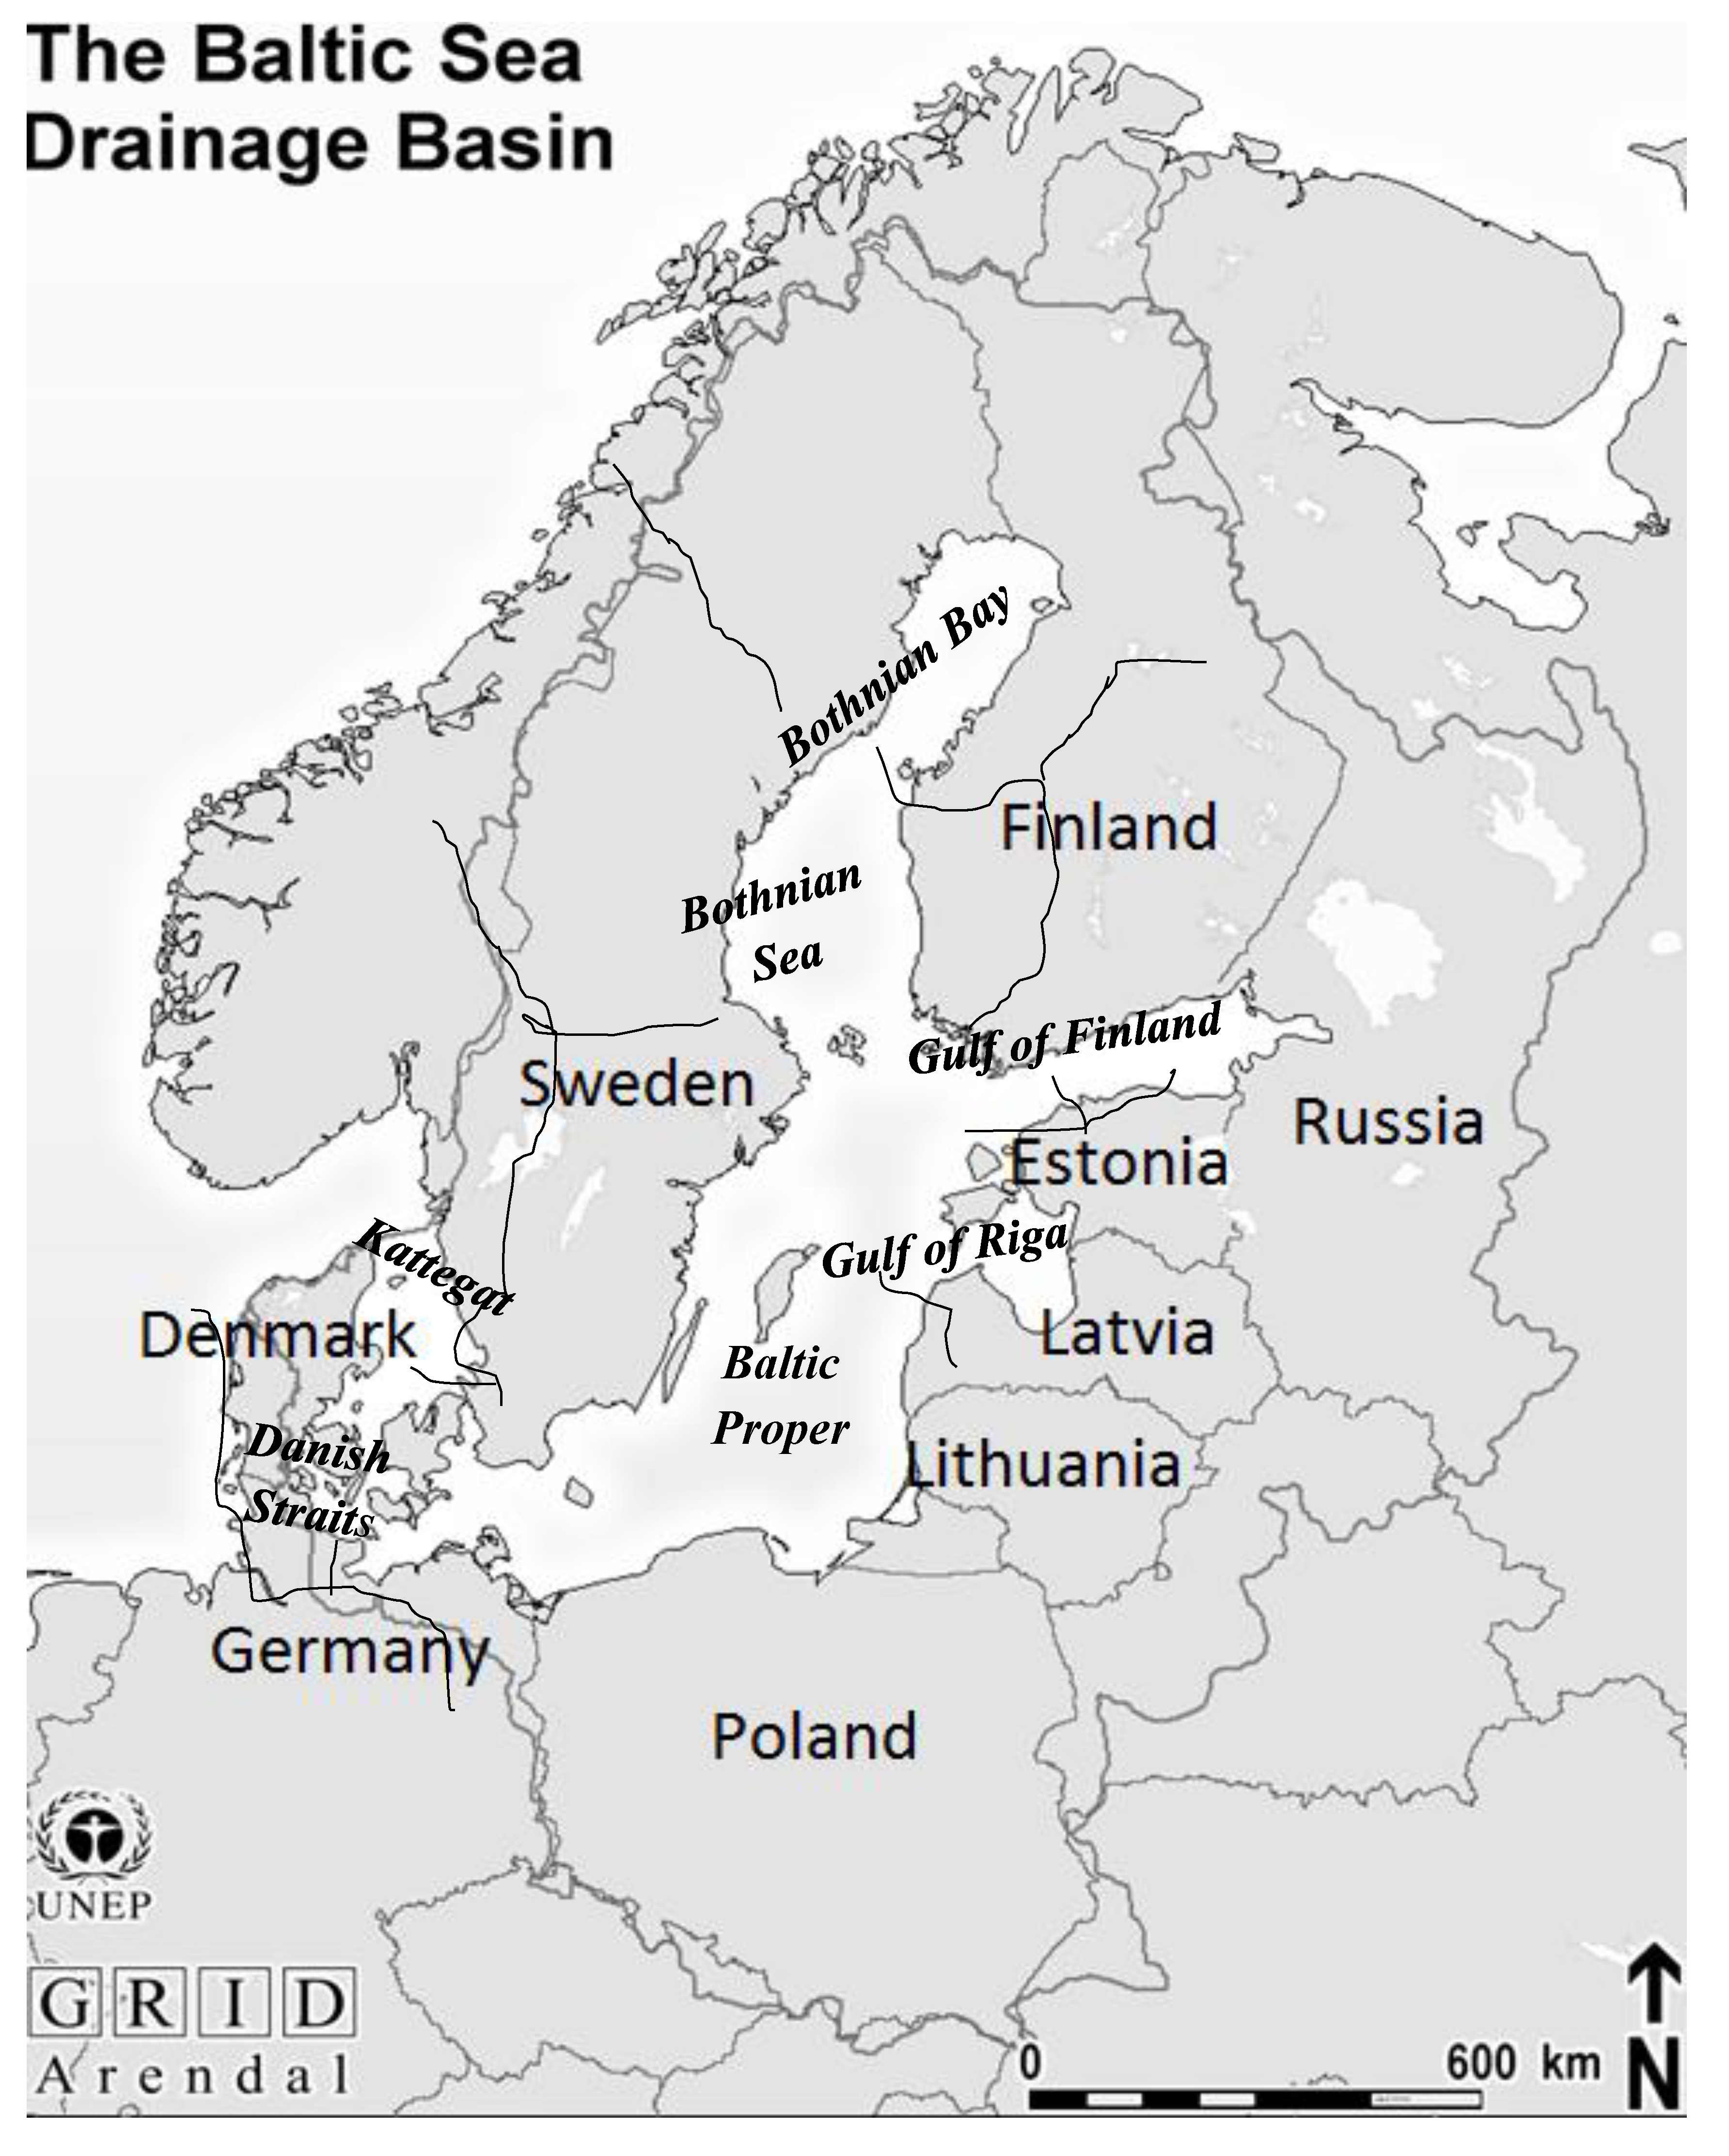
The purpose of this study is to calculate the difference in costs and spatial nutrient load outcomes for overall and detailed nutrient (nitrogen and phosphorus) targets for the Baltic Sea, which suffers from the world’s largest areas of sea bottoms without any biological life due to eutrophication (e.g., [8,9]). The sources and processes of eutrophication have been known for several decades (e.g., [10]). Mitigation of the damage from eutrophication has been on the agenda for the countries surrounding the Baltic Sea for decades, leading to the collaborative establishment of the Convention on the Protection of the Marine Environment of the Baltic Sea (Helsinki Commission HELCOM) in the late 1980s, working to implement nutrient reductions as determined by several international agreements [2,11,12]. The earliest agreement determined overall target reductions, which were imposed proportionally on each country surrounding the sea [11]. Ecosystem-based nutrient targets were introduced by HELCOM [11,12] for each of the seven marine basins of the sea (Figure A1) with large differences in reduction requirements. For example, phosphorus loads to the largest marine basin, Baltic Proper, needed to be reduced by 60%, while other basins, Bothnian Bay and the Bothnian Sea, faced no reductions in neither phosphorus nor nitrogen. Based on these marine basin targets, HELCOM [11,12] derived country targets for each of the nine counties surrounding the sea.
Several studies have calculated costs for achieving the international nutrient loads targets to the sea [5,6,7,13,14,15,16,17,18,19]. The relatively early models calculated costs of nutrient reductions by 50% as envisaged by the first international agreement in the 1980s [5,6,13]. The 50% targets were imposed on each country and the studies showed that such country specific targets can raise the total abatement cost by threefold, compared with overall nutrient reduction targets. The nutrient targets were later changed to reflect the ecological conditions in different marine basins [2,12]. In addition, country targets were determined based on the marine basin targets. However, as demonstrated by Elofsson [7], the specification of targets for each catchment in each country set by HELCOM [12] would raise costs by almost 1 billion euro (in 2017 prices), or 20%, compared with targets only for marine basins.
It is well-known in economics that detailed specification of targets in time and space raises the cost compared with more general targets for, e.g., a sea such as the Baltic Sea. The reason is that the detailed targets seldom reflect the differences in marginal abatement costs among the involved regions; the higher the variation in marginal abatement cost the larger is the difference in costs between detailed and general targets (e.g., Newell and Stavins [20]). This study calculates costs for overall and spatial nutrient targets based on an updated numerical cost minimization model developed by Gren and Tirkaso [21]. The model rests on recent advances in the calculation of costs and effects of improved cleaning at sewage treatment plants and mussel farming, nutrient transports in the catchments, and the availability of land for wetland restoration [16,21,22,23]. In our view, the main contribution to the literature is twofold; update of calculations of costs for nutrient reduction targets to the Baltic Sea and a comparison of costs and spatial allocation of nutrients loads between overall and ecosystem-based targets.
The paper is organized as follows. The structure of the numerical cost minimization model is presented in Section 2, together with the target formulations. Data is described in Section 3, and results with respect to costs are presented in Section 4. Nutrient loads and deviations from the basin targets are calculated and discussed in Section 5, and conclusions are presented in Section 6.
2. Structure of the Numerical Model
A basic assumption in this study is that a Baltic Sea decision maker minimizes cost for achieving given nitrogen and phosphorus load targets. Although a seemingly simple principle, the manager faces difficulties when considering the various means of nutrient transports media (air, soil, and inland water streams) before they enter the coastal waters. Further, abatement measures located along the transport modes can be connected where, for example, emission from upstream sources affect nutrient abatement by downstream measures, such as wetlands. This transport by several media implies inseparability between different measures reducing the nutrient load to the Baltic Sea.
In order to account for the ecosystem-based nutrient targets at the country and marine basin scales, abatement measures are distinguished by their location in a certain country c = 1, …, n with discharges into a marine basin b = 1, …, l in the Baltic Sea. In this study, the nutrient loads to the Baltic Sea can be reduced by four classes of measures:
- Measures reducing the nutrient emissions from sources with deposition on the Baltic Sea and/or on land within the drainage basin, Abc,r where r = 1, …, f are the different deposition measures. The abatement measures reducing deposition included in this study are reductions in fertilizers, livestock, air borne emissions from combustion of fossil fuels and ammonia volatilization from livestock, and increased cleaning at sewage treatment plants.
- Land use measures, Abc,l, with l = 1,…, g different land use measures, reduce the leaching from a given deposition on land to water streams. The land use measures included in this study are cultivation of catch crops which affects nitrogen leaching and construction of buffer strips which reduce transports of phosphorus.
- Measures reducing the impact of given upstream nutrient water transport on the coastal water by creation of nutrient sinks in terms of wetlands, Wbc.
- In situ measures, which reduce the content of nutrient in the sea and include mussel farming in the coastal waters, Mbc.
The total nutrient emissions from a catchment, Ebc,p, of a nutrient p (nitrogen and phosphorus) is dispersed on different marine basins in the Baltic Sea and on land in different countries, which is written as:
where with as the business as usual (BAU) emission, up,r is the fraction of nutrient p of abatement measure Abc,r, is the share of emission that is deposited on the Baltic Sea, and is the fraction of emission from region bc that is transported and deposited in another region located in the country e with discharges into marine basin j. The sum of all coefficients cannot exceed unity, i.e., . For airborne emission sources, the sum is likely to be less than unity since part of the emissions is deposited in countries and marine waters (e.g., the North Sea) outside the Baltic Sea and its catchment. On the other hand, for emission sources located at the coast with direct discharges into a marine basins abc,p,r = 1.
The deposition of nutrient on land within a region Dbc,p from emissions in all regions Eej,p is written as and constitutes a potential for leaching into water streams which is transported to the coastal water. The nutrient leaching is also determined by several other factors, such as climate, soil, hydrology, geology, and land uses. We simplify these complicated processes by writing the total leaching from land into water streams in a region, Lbc,p, as the leaching prior to implementing the land use measures, Lbc,p, minus the leaching reduction obtained by implementing land use measures, ubc,p,l Abc,l where ubc,p,l is the impact on leaching of pollutant p from abatement by land based measure l in region bc by one unit. Both initial leaching and the reduction in leaching achieved by land use measures are functions of the nutrient deposition on land. The total leaching into water streams from the catchment bc can then be written as:
where and with subscripts denoting partial derivatives.
The final load to the Baltic from a given nutrient leaching is determined by the nutrient retention during the transport by water streams to the Baltic Sea. Nitrogen retention occurs through three processes; plant assimilation, sedimentation, and denitrification where nitrogen is transformed into harmless gas. Only the first two processes generate phosphorus retention. Similar to nutrient leaching, the level of retention is determined by several factors such as climate, soil, and hydrology. In general, the retention is higher for sources remote to the Baltic Sea. This means that the spatial allocation of emission sources and nutrient reduction measures influence the load to the Baltic Sea. In principle, it is analytically straightforward to make a spatial division of each region bc. However, as demonstrated in the next section, lack of data makes associated numerical calculations impossible.
The final load of nutrients from the catchment into the Baltic Sea depends on retention of nutrient from the leaching spots to the coastal waters, and on the construction of nutrient sinks, such as wetlands along this pathway. The abatement of the nutrient by wetlands is, in turn, determined by the inflow of Lbc,p and the wetland area, Wbc, which is written as ubc,p,wAbc,w(Lbc,p,Wbc), where ubc,p,w is the impact on nutrient p of a unit abatement by wetlands.
Finally, negative nutrient loads can be created by mussel farming which, by harvesting of biomass, absorbs nutrient from the sea. In principle, one could expect a relation between nutrient loads from the catchment and the removal capacity of mussel farming if it were not for the transports of nutrient between basins in the Baltic Sea and internal load of phosphorus from the sea bottom area (e.g., Murray et al. [10]). The linkage between mussel biomass and nutrient loads from the catchment is therefore disregarded in this study. The total load to a marine basin from its catchment, Fbc,p, is then written as:
where is the direct deposition on marine basins in the Baltic Sea from emission sources and ubc,p,mAbc,p(Mbc) is the nutrient removal by mussel farming.
Based on the descriptions of the loads and abatement measures, we define three different nutrient targets for the Baltic Sea. Two targets are based on the international agreements in HELCOM [2] on marine basin and country targets, and the third is a target on overall reductions to the Baltic Sea, which are defined as:
where .
There exists a cost function for each abatement measure, denoted by Cc,r(Abc,r), Cc,l(Abc,l), Cc,w(Wbc) and Cc,m(Mbc) all of which are assumed to be non-declining in the arguments. Note that all cost functions for basins within a country c are assumed to have the same shape, the reason is that inputs determining the cost, such as wage and interest rate, are the same within but not between countries. The total cost for the entire Baltic Sea region, C, is then written as:
Each abatement measure is subject to a capacity constraint where some are self-evident such as the limit of increased cleaning at sewage treatment plants is determined by the population and reduction in livestock by the number of different animals.
The decision problem is formulated as choosing the allocation of abatement measures which minimizes the costs for achieving either of the nutrient load targets defined by Equations (4)–(6), according to:
The first-order conditions for the different targets differ with respect to the summation over catchments in country c with discharges to basin b. For the overall Baltic Sea target, the summation is made over all catchments and the associated first-order condition for reductions in deposition measures, Abc,r, is written as
where sub index denotes partial derivative, and λp is the Lagrange multiplier which shows the impact of total costs from a marginal change in the target for a nutrient p entering the Baltic Sea. The first-order condition in Equation (10) is most involved, because of the transboundary impacts between catchments where reductions in e.g., air borne emissions, generate direct and indirect effects on the Baltic Sea. The direct effects are shown by the first term within parenthesis at the right-hand side of Equation (10). Indirect effects occur through the deposition on land in other catchments with further transports into the Baltic Sea, as shown by the second term within parenthesis at the right-hand side of Equation (10). The impact on deposition on land is, in turn, divided into two counteracting parts; the reduction of leaching under business as usual and the reduced abatement effect of land use measures, according to . In addition, the nutrient reduction effect of constructed wetlands is reduced when leaching into the wetland area decreases.
The first-order conditions for the other abatement measures are simpler, according to:
The summation under the country and marine basin targets affects only the first order conditions for Abc,r, because of the transboundary effect of this measure. The first-order conditions for this measure under the country and marine basin targets are then written as:
The Lagrange multipliers are now written as λp,c under the country targets regime and differ for each country. Similarly, the Lagrange multipliers with marine basin targets, λp,b, differ for each marine basin. Both classes of Lagrange multipliers can be either higher or lower than the shadow cost of the Baltic Sea targets, depending on the stringency of the targets for the country or marine basin in question. Since the first-order conditions for the other abatement measures are quite similar to those for Baltic Sea targets with the replacement of λp with λp,c or λp,b, they are not repeated here.
With respect to total cost under the different targets, it can only be concluded that the total cost under the overall Baltic Sea targets is lower than for the other two targets. The reason is the well-known condition for cost effectiveness that marginal cost among all measures and locations shall be the same. This is likely not to occur under the marine basin and country targets. It is not possible to make any conclusions about the total costs between these two target settings, since some countries discharge nutrient load to several marine basins, and all marine basins receive nutrient from at least two countries.
The different target settings will also give rise to different loads to the marine basins. Only the marine basin targets will guarantee the fulfillment of the targeted loads to the basins in our model. Given that these targets are determined for achieving sufficient ecological conditions, excess loads to any basin may danger the determined ecological achievement. Differences in total costs and for different countries between the targets need to be balanced against deviations in nutrient loads to the targeted marine basins.
3. Description of Data
Two classes of data are needed for the numerical application of the model presented in Section 2: (i) nutrient loads and targets, and (ii) costs and impacts of all abatement measures. With respect to the first class of data, the entire drainage basin was divided into 21 catchments with discharges from catchments in the nine countries with coastal waters to the Baltic Sea (Denmark, Sweden, Finland, Russia, Estonia, Latvia, Lithuania, Germany, Poland) to one or several of the seven marine basins (Bothnian Bay, Bothnian Sea, Baltic Proper, The Gulf of Finland, The Gulf of Riga, Danish Straits, and Kattegat), which are presented in Figure A1. All countries but Poland and Lithuania discharge nutrients into more than one marine basin. Data are obtained from a number of different sources briefly described in the following. All costs are measured in 2017 euro, and, when possible, activity levels are also measured for 2017. Unless otherwise stated, all data is found in Gren and Tirkaso [21].
3.1. Nutrient Loads and Targets
For each catchment, nutrient loads to the sea are calculated based on data on emission from sources, and nutrient leaching and retention within the Baltic Sea catchment. Emission sources include livestock, fertilizer use, sewage treatment plants, and fossil fuel energy. Emission from livestock and fertilizers are calculated based on number of animals and fertilizers per unit of agricultural land and emission intensity. Nutrient loads into the Baltic Sea from sewage treatment plants depend on cleaning level of the nutrients, which differ considerably among countries [22]. The loads are allocated among the catchments based on information on population density in the countries, where it is assumed that the load per person equivalent is the same in all catchments in a country.
Data on emissions of ammonia (NH3) and nitrogen oxides (NOx) from the nine countries around the Baltic Sea is obtained from NMI [24], which includes direct deposition into the Baltic Sea from these countries and indirect through dispersal of the nutrients on land in several countries, which leach into waters in the catchment with transports into the sea. In present study, we include only the deposition originating from emission sources in the catchments of the nine countries surrounding the sea, since it is assumed that the HELCOM targets are based on the loads which these countries are able to reduce. The indirect loads to the sea are then calculated with data on emissions of NOx and NH3 and matrices of the dispersion of these emissions among the countries [24].
Data on leaching of the deposition is obtained from [25], and shares of retention during the transports from the location to the Baltic Sea are obtained from [16]. Nitrogen retention in [16] is divided between retention in surface and ground water, but the allocation of leaching into these waters is unclear. It is therefore assumed that the nitrogen retention is the average of these two retention modes. The calculated load to the Baltic Sea is presented in Table 1.
With respect to nutrient targets, the international agreement on maximum nutrient loads manifested by the Baltic Sea Action Plan (BSAP) envisages reductions for each country, which are supposed to achieve necessary improvements in ecological conditions in different marine basins (HELCOM [2]). The targets, as measured by maximum allowable loads in percent of the business-as-usual (BAU) nutrient loads, show a wide variation between basins and countries (Table 1).
The calculated total load of phosphorus is in the same order of magnitude as the calculations made for 2010 by 26 Pihlainen et al. [26], but it is approximately 15% lower for nitrogen. The calculated nitrogen load to the Baltic Sea in this study includes only emissions originating from sources in the nine countries surrounding the sea. If all atmospheric deposition on land in the catchment would be included, the load to the Baltic Sea would increase with approximately 60 kton N. The outside deposition of nitrogen oxides and ammonia on the sea adds another 130 kton [24]. With respect to the allocation of loads into different marine basins, Baltic Proper and Gulf of Finland receive the majority of both nutrients, which is also reported by HELCOM [27]. However, a limitation of the calculation is that the role of coastal waters is not included, because of lack of data (e.g., [28])
According to HELCOM [2] the country targets are derived from the needs to reduce nutrient loads into the different marine basins, and the most stringent maximum load targets measured as share of BAU loads are determined for the Baltic Proper. This explains the relatively stringent country targets for countries discharging into this marine basin, with the largest reduction requirements for Poland, Lithuania, and Russia for both nutrients.
3.2. Impacts, Costs and Capacity of Abatement Measures
The model includes eight different abatement measures for each catchment: reductions in livestock and fertilizers, cultivation of catch crops, creation of wetlands and buffer strips, mussel farming, increased cleaning at sewage treatment plants, and reduction in emissions of NOx. The calculation of effects of livestock reduction is most involved, since it gives rise to reductions in both airborne emissions and deposition on agricultural land. The impact from reduction in ammonia reduces direct emissions on different marine basins in the sea and deposition on land in all catchments, with associated impacts on the nutrient load when accounting for leaching and retention in each catchment. The cost of livestock reduction is calculated as foregone profits, which are obtained from [16]. It is assumed that the maximum reduction capacity corresponds to 40% of the livestock.
Effects of reductions in NOx emission are similar to those of ammonia reductions, except for the direct deposition on land and data on dispersal among countries and on the sea is obtained from [24]. Costs of reductions in NOx arise from the reduction in the use of different fossil fuels. The cost is calculated as the reduction in consumer surplus from reductions in NOx due to decreases in transports. Impacts on consumer surplus is calculated by deriving a linear demand function with data on emissions, price (unit price of transport fuel divided by N emissions), and price elasticities. With respect to abatement capacity, it is assumed that a maximum of 40% of the NOx emissions can be reduced.
Effects on the Baltic Sea of reductions in fertilizers are assumed to correspond to the product of the share of leaching of deposition and the share of leaching not subject to retention for each nutrient. With respect to costs, they arise from the impact of fertilizers on yield, which, in turn, depends on a number of factors, such as prices of crops and inputs, and soil quality. It is here simply assumed that the farmers maximize profits for each price level of fertilizers, and the cost can then be calculated as the associated change in profits. These changes are calculated as the reduction in consumer surplus separately for N and P fertilizers. Linear demand functions are estimated based on point estimates of use, prices and elasticities. It is assumed that the fertilizer cannot be reduced by more than 50%.
The effects of improved cleaning at sewage treatment plants depend on location of the plant. If located upstream in a catchment, the load is subject to retention. A plant located downstream at the coast has a unit impact from a unit nutrient discharged into the sea. It is assumed that the location of the improved cleaning at sewage treatment plants corresponds to the actual location [27], and the effect is then calculated as the weighted average of upstream and downstream impact. The retention of nutrient from discharges of upstream located plants is assumed to correspond to the retention in surface waters from [16]. With respect to costs, they are subject to both economies of scale and scope where unit cost decreases as the scale of the plant increases and if several pollutant are mitigated (usually BOD (biochemical oxygen demand), N, and P). The average cost per person equivalent of expanding cleaning to the tertiary cleaning level in each catchment is calculated by Hasler et al. [16], but there is no information on how to allocate the costs between BOD, nitrogen and phosphorus. Following Hautakangas et al. [22] it is simply assumed that the costs are equally divided between the pollutants. The maximum abatement capacity in each country of each nutrient is obtained from Hautakangas [29].
Catch crops grow in periods between ordinary crops and reduce leaching from the land, which would otherwise have been without crops absorbing nitrogen. The effect of catch crops is endogenous and depends on the deposition of nitrogen on arable land, which, in turn, depends on the application of fertilizers and air borne deposition. Following [16], it is assumed that catch crops reduce leaching of nutrient by 35%. Catch crops can be cultivated only on land without winter crops. Costs of catch crops include time for sowing and seed purchases, obtained from [16].
Similar to catch crops, the effects of constructing buffer strips and wetlands are endogenous, and depend on the inflow of nutrient into the location of the land use. For buffer strips, the inflow is determined by the leaching of phosphorus from agricultural land. It is assumed that the wetland is constructed downstream close to a coastal zone, in order to act effectively as a filter of upstream nutrient load. The inflow to the wetland is then determined by the deposition of nutrients on upstream agricultural land, leaching and retention during the transport to the sea. The nutrient retention of the constructed wetlands and buffer strips depend on a number of factors such as temperature and size. It is here simply assumed that the nutrient retention corresponds to 50% of the load entering the wetland and that phosphorus retention by buffer strip is 30% of the inflow. Costs of restoring wetlands and buffer strips include the opportunity cost of land, which is approximated by the annual rental prices of agricultural land. Available areas for wetland restoration in the different countries have been investigated by [16]. Since the effect depends on the location of the wetland downstream in a catchment, it is assumed that 30% of the potential areas can be restored. Similar capacity estimates have not been made for buffer strips, and it is assumed that 1% of agricultural land can be used for this purpose.
Regarding mussel farming, calculations of the impacts and costs of mussel farming are based on Gren and Tirkaso [30], who developed a meta-regression model and estimated a cost function for producing mussels. In the present study this cost function was transferred to mussel farming in the Baltic Sea through salinity levels at the coastal zones [31], and through wages and interest rates between the countries in 2017 [32,33]. Data on the maximum production of biomass in each catchment was obtained from [23], who assumed that 0.5% of the coastal area within one nautical mile of the coast zones along all countries with coastal zones in the Baltic Proper, the Danish Straits and Kattegat could be used for mussel farming. It is further assumed that the content of nitrogen is 0.008 kg N/kg mussel biomass, and that of phosphorus is 0.0006 kg P/kg biomass [34].
4. Cost Effective Solutions to Alternative Targets
In order to compare the results from the model with results from other studies, the total cost for reaching marine basin nutrient targets without mussel farming are calculated. Given all assumptions and data, the total minimum cost for reaching the marine basin targets amount to 5.79 billion euro. Hasler et al. [16] is the only study calculating the cost of reaching the same HELCOM [2] marine basin targets as in this study, and obtained a cost of 5.2 billion Euro (in 2017 prices). Elofsson [7] calculated cost-effective solutions to marine basin targets by HELCOM [12], which differ slightly from the maximum load targets set by HELCOM [2] as measured in percent of BAU nutrient loads. The maximum phosphorus loads were lower for Baltic Proper and Gulf of Riga, but higher for Gulf of Finland. The cost estimated by Elofsson [7] was 4.5 billion Euro (in 2017 prices), which is 20% lower than the cost estimate in the present study for the HELCOM [2] targets.
The cost estimated by Gren et al. [5] and Ollikaninen and Hourakangas [6] for a 50% reduction in the load of phosphorus, which is most close to the HELCOM [2] phosphorus target, amounted to 0.7 and 1.3 billion euro, respectively (in 2017 prices). Calculated cost for an overall phosphorus reduction by 50% in the present model amounts to 2.8 billion euro. The higher cost is likely to reflect the increasing cost from the need to introduce abatement measures reducing loads from agriculture because of the early augmentation of relatively low cost measures, such as increases of nutrient cleaning at sewage treatment plants with direct discharges into the coastal waters.
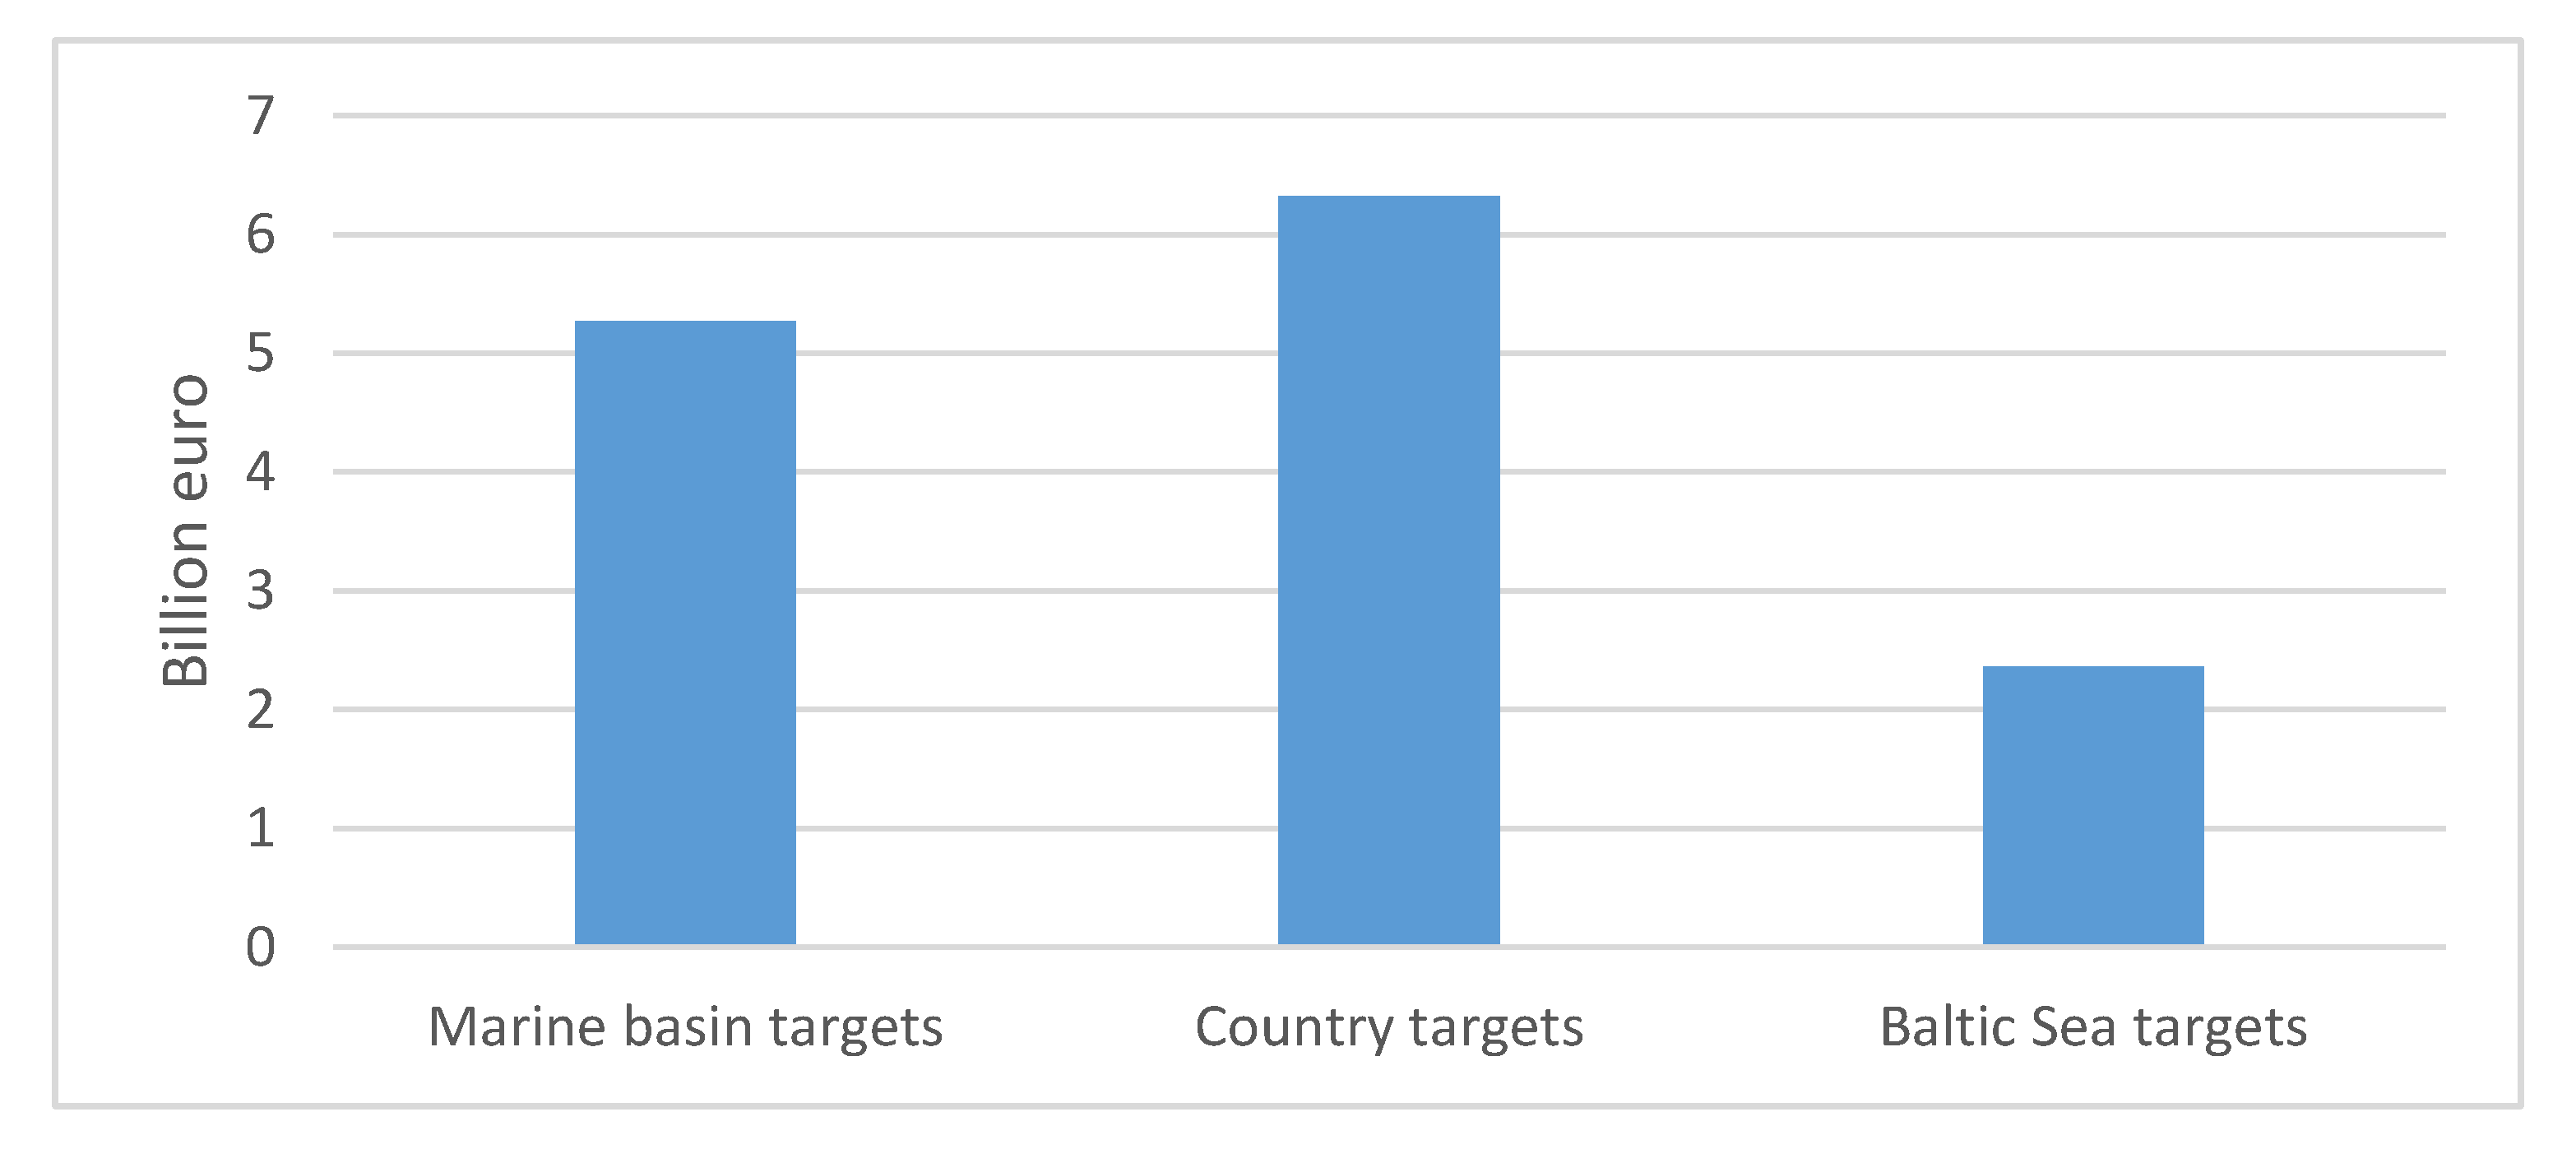
The total cost for achieving the marine basin targets with the inclusion of mussel farming amounts to 5.27 billion euro, which is slightly lower than the cost under the country targets regime, but considerably higher than the cost of the overall reduction of N and P loads (Figure 1).
The total cost of overall reductions in N and P loads by 18 and 49%, respectively, corresponds to almost half of the cost for the other targets. The main reason for this cost difference is the high abatement costs for Poland under the marine basin and country targets (Table 2).
The high share of total abatement cost for Poland under the marine basin and country targets is explained by the large share of phosphorus loads from Poland to Baltic Proper and the large load reduction target for the basin and the country. Similar results were obtained by Elofsson [7] and Hasler et al. [16]. It can be noticed that the abatement costs in Poland are relatively high compared with other countries, which explain the lower costs for this country under Baltic Sea targets. The relatively high cost for abatement measures in Poland is explained by the upstream location of agriculture and sewage treatment plants, which raises costs for load reduction to the coast because of the nutrient retention. Denmark, Finland, Germany, and Sweden then need to increase their abatement to reach a cost-effective solution.
However, as in all numerical modelling, the results are sensitive to different assumptions and parameter values of the different types of data; biological (retention and leaching), costs of measures, and abatement capacity. Changes in retention rates can either increase or decrease cost. A reduction increases load from upstream sources, which increases the reduction need as measured in kton nutrient. On the other hand, abatement costs of upstream measures decrease because of a higher effect on the sea. Studies indicate that retention might change because of climate change (e.g., Eriksson et al. [35]), and we therefore calculate costs under all three targets for an increase in retention rates by 10% for both nutrients in all catchments. The calculations also rest on simplifying assumptions on the loads and costs of measures in the agricultural sector, and calculations are therefore made for a decrease by 10% in the production of meat and costs of abatement measures in agriculture. For similar reasons, costs are calculated for a decrease by 10% in the maximum increase in nutrient cleaning at sewage treatment plants (Table 3).
The costs are particularly sensitive for changes in the capacity of low-cost measures; a 10% decrease in cleaning capacity of sewage treatment plants raises the cost for achieving the marine basin targets by almost 60%, and even more for country targets. The reason is the replacement with abatement measures in agriculture, which are more expensive. The increase in costs is lower as measured in percent for the Baltic Sea targets, which is explained by the possibility to replace the cleaning by sewage treatment plants with relatively low cost agricultural and other measures in all catchments.
5. Nutrient Loads to Marine Basins under Different Targets
It might be argued that the higher cost under the marine basin targets can be justified, because of the precision in achieving nutrient load targets for the marine basins. It is therefore of interest to examine the nutrient loads to the basins under the Baltic Sea and country targets (Table 4).
The results in Table 4 show that none of nitrogen targets for any basin will be achieved with country targets, although the underperformance is relatively modest as measured in per cent deviation from the HELCOM [2] targets displayed in Table 1. This is also the case for the phosphorus targets to Baltic Proper and Gulf of Riga, but the loads to Gulf of Finland are lower than the marine basin target. The results are more mixed under the Baltic Sea targets, where the nitrogen loads to Gulf of Finland and Kattegat and phosphorus loads to Gulf of Riga and Gulf of Finland are considerably lower than the marine basin targets. On the other hand, the phosphorus load to Baltic Sea exceeds the basin target by almost one fourth.
Whether or not the cost of the deviations from the basin targets under the Baltic Sea targets justify the excess cost corresponding to 2.9 billion euro depends on the ecological impacts of the deviation in nutrient loads and associated valuation in monetary terms. There exist no quantitative estimates of the relation between nutrient loads and ecological impacts, such as fish populations and blue green algal, for the different marine basins in the Baltic Sea, and it is therefore difficult to find empirical evidence for the choice of the targets. On the other hand, there are a few studies estimating the value for target achievements. Söderqvist [36] made a contingent valuation study of the achievement of the HELCOM [11] targets of 50% reduction in both nutrients in two countries Sweden and Poland. Transfer of the results for these countries to the other seven countries gave a total value of 4.4 billion euro (in 2017 prices). This was followed up by Athainen et al. [37], who implemented surveys in all nine countries around the sea, and found that the total willingness to pay for achieving the HELCOM [12] targets with assumed ecological effects amounted to 3.9 billion euro (in 2017 prices). Czasjkownsy et al. [38]) applied the travel cost method to estimate the recreational values of the Baltic Sea, and found that a perceived improvement of current status to very good quality would raise welfare by 2.1 billion euro (in 2017 prices).
Common to all valuation studies is the use of a scenario where an improvement is made from a current bad to a future good status due to the achievement of the targets. It can then be noticed that all three value estimates are lower than the calculated costs in this study for achieving the marine basin targets. When comparing the extra cost of 2.9 billion euro per year from exceeding the target for Baltic Proper by 23%, it is difficult to justify the marine basin target instead of a Baltic Sea target, and even more problematic when the latter target implies larger reductions in nitrogen and phosphorus than the targets for several marine basins. Another aspect is the implicit assumption of local stationarity of nutrients in the basins where they are discharged. However, it is likely that discharges of nutrient into one marine basin is dispersed to other basins, because of oceanographic conditions (e.g., [3]). If so, the stringent targets for direct discharges into Baltic Proper and Gulf of Finland are likely not to be met, and discharges into other basins for which there are no targets will affect the targeted basins ([14]).
6. Discussion and Conclusions
The main purpose of this study was to calculate costs of achieving overall and ecosystem-based heterogeneous targets for nutrient loads to the Baltic Sea, and to compare the dispersal of nutrient loads. This was made with a static cost minimization model, which included eight different abatement measures in each of the 21 catchments (reductions in NOx, fertilizers, and livestock, cultivation of catch crops, construction of buffer strips and wetlands, and mussel farming).
The results showed that the annual cost of achieving the ecosystem-based targets in terms of HELCOM [2] targets for different marine basins can be more than twice as large as the cost of the same overall nutrient load target; 5.3 billion euro compared with 2.4 billion euro. This relatively large difference in costs between the two types of target formulations remains the same, and can even be reinforced from changes in exogenous parameter values on nutrient transports in the catchment and available abatement capacity of low cost measures. It was also demonstrated that the overall target formulation would result in loads exceeding the HELCOM [2] target for Baltic Proper, but can be below the phosphorus basin targets for Gulf of Riga and Gulf of Finland and the nitrogen targets for the Gulf of Finland and Kattegat.
A question then arose if the costs of these deviations in terms of ecological impacts on the marine basins are higher than the excess abatement cost of the marine basin targets. The current lack of studies relating nutrient loads to ecological effects and valuation in monetary terms for different marine basins inhibits a comparison of these costs and thereby a justification of marine basin instead of Baltic Sea targets. Future research on these topics are thus needed for the maintenance of basin targets instead of a more flexible target formulation, which allows for the implementation of low-cost abatement measures in the entire Baltic Sea.
An argument in favor of overall Baltic Sea targets instead of marine basin targets is found in the difficulties associated with the implementation of international targets. In principle, the HELCOM suggestions for mitigating eutrophication in the Baltic Sea have rested on command and control policies with targets for each country, and each country has, in turn, implemented these targets by command and control policies with targets for sectors and regions within the country. It is well-known that such command and control policies can be much more expensive than economic instruments, such as nutrient load charges or trading markets. However, the implementation of economic instruments for the marine basin targets would require charges or markets that differ for the basins because of the differences in load targets (e.g., [39]). In this respect, it would be easier to implement only one charge or market for each of the nutrients under the Baltic Sea targets. The identification of barriers to and possibilities for a move from current tradition of detailed command and control policies for achieving basin targets to application of economic instruments for reaching overall Baltic Sea targets is another important area for future research.
Author Contributions
I.-M.G. prepared the original draft of the paper, made the analysis and the calculations. W.T.T. collected the data, contributed to the analysis and preparation of the manuscript. Both authors have read and agreed to the published version of the manuscript.
Funding
We are grateful for financial support from the BONUS Optimus projects, funded by BONUS (Art. 185) jointly from the European Union’s Seventh Programme for research, technological development and demonstration, and from the Swedish Agency for Marine and Water Management.
Conflicts of Interest
The authors declare no conflict of interest.
Appendix A
Figure A1.
The Baltic Sea drainage basin. Source: Gren and Tirkaso [21].
Figure A1.
The Baltic Sea drainage basin. Source: Gren and Tirkaso [21].

References
- EU 2008. Directive 2008/56/EC of the European Parliament and of the Council. Available online: https://eur-lex.europa.eu/legal-content/EN/TXT/?uri=CELEX:32008L0056 (accessed on 17 July 2020).
- HELCOM 2013. Summary Report on the Development of Revised Maximum Allowable Inputs (MAI) and Updated Country Allocated Reduction Targets (CART) of the Baltic Sea Action Plan. Available online: http://www.helcom.fi/Documents/Ministerial2013/Associated%20documents/Supporting/Summary%20report%20on%20MAI-CART.pdf (accessed on 15 November 2019).
- Savchuk, O. Resolving the Baltic Sea into seven subbasins: N and P budgets for 1991–1999. J. Mar. Syst. 2005, 56, 1–15. [Google Scholar] [CrossRef]
- Baumol, W.; Oates, W. The Theory of Environmental Policy; Cambridge University Press: Cambridge, NY, USA, 1988. [Google Scholar]
- Gren, I.-M.; Jannke, P.; Elofsson, K. Cost-Effective Nutrient Reductions to the Baltic Sea. Environ. Resour. Econ. 1997, 10, 341–362. [Google Scholar] [CrossRef]
- Ollikainen, M.; Honkatukia, J. Towards Efficient Pollution Control in the Baltic Sea: An Anatomy of Current Failure with Suggestions for Change. AMBIO 2001, 30, 245. [Google Scholar] [CrossRef] [PubMed]
- Elofsson, K. Cost-effectiveness of the Baltic Sea Action Plan. Mar. Policy 2010, 34, 1043–1050. [Google Scholar] [CrossRef]
- Andersen, J.H.; Carstensen, J.; Conley, D.J.; Dromph, K.; Fleming-Lehtinen, V.; Gustafsson, B.G.; Josefson, A.B.; Norkko, A.; Villnäs, A.; Murray, C. Long-term temporal and spatial trends in eutrophication status of the Baltic Sea. Boil. Rev. 2015, 92, 135–149. [Google Scholar] [CrossRef] [PubMed] [Green Version]
- Diaz, R.; Rosenberg, R. Spreading Dead Zones and Consequences for Marine Ecosystems. Science 2008, 321, 926–929. [Google Scholar] [CrossRef] [PubMed]
- Murray, C.J.; Müller-Karulis, B.; Carstensen, J.; Conley, D.J.; Gustafsson, B.G.; Andersen, J.H. Past, Present and Future Eutrophication Status of the Baltic Sea. Front. Mar. Sci. 2019, 6, 1–12. [Google Scholar] [CrossRef] [Green Version]
- HELCOM (Helsinki Commission). Declaration on the Protection of the Marine Environmental of the Baltic Sea. Helsinki, Finland. 1988. Available online: https://helcom.fi/helcom-at-work/ministerial-meetings/1988-helsinki/ (accessed on 21 August 2020).
- HELCOM (Helsinki Commission). Baltic Sea Action Plan. Helsinki, Finland. 2007. Available online: https://helcom.fi/baltic-sea-action-plan/ (accessed on 21 August 2020).
- Elofsson, K. Cost-effective reductions of stochastic agricultural loads to the Baltic Sea. Ecol. Econ. 2003, 47, 13–31. [Google Scholar] [CrossRef]
- Gren, I.-M.; Wulff, F. Cost effective management of polluted coupled heterogeneous marine basins in the Baltic Sea. Reg. Environ. Chang. 2004, 4, 1–24. [Google Scholar] [CrossRef]
- Ahlvik, L.; Ekholm, P.; Hyytiäinen, K.; Pitkänen, H. An economic–ecological model to evaluate impacts of nutrient abatement in the Baltic Sea. Environ. Model. Softw. 2014, 55, 164–175. [Google Scholar] [CrossRef]
- Hasler, B.; Smart, J.C.R.; Fonnesbech-Wulff, A.; Andersen, H.; Thodsen, H.; Mathiesen, G.B.; Smedberg, E.; Göke, C.; Czajkowski, M.; Wąs, A.; et al. Hydro-economic modelling of cost-effective transboundary water quality management in the Baltic Sea. Water Resour. Econ. 2014, 5, 1–23. [Google Scholar] [CrossRef]
- Ahlvik, L.; Iho, A. Optimal geoengineering experiments. J. Environ. Econ. Manag. 2018, 92, 148–168. [Google Scholar] [CrossRef]
- Gren, I.-M.; Folmer, H. International cooperation of stochastic environmental damage: The case of the Baltic Sea. Ecol. Econ. 2003, 47, 31–43. [Google Scholar] [CrossRef]
- Gren, I.-M.; Säll, S.; Aklilu, A.Z.; Tirkaso, W.T. Does Mussel Farming Promote Cost Savings and Equity in Reaching Nutrient Targets for the Baltic Sea? Water 2018, 10, 1682. [Google Scholar] [CrossRef] [Green Version]
- Newell, R.G.; Stavins, R.N. Cost Heterogeneity and the Potential Savings from Market-Based Policies. J. Regul. Econ. 2003, 23, 43–59. [Google Scholar] [CrossRef]
- Gren, I.-M.; Tirkaso, W. Costs of Alternative Nutrient Load Targets for the Baltic Sea—Technical Report; Working Paper 2020:02; Department of Economics, Swedish University of Agricultural Sciences: Uppsala, Sweden, 2020; Available online: https://www.researchgate.net/profile/Ing-Marie_Gren/publication/342052832_Costs_of_alternative_nutrient_load_targets_for_the_Baltic_Sea_-_Technical_report/links/5ee0ad4345851516e665a169/Costs-of-alternative-nutrient-load-targets-for-the-Baltic-Sea-Technical-report.pdf (accessed on 20 August 2020).
- Hautakangas, S.; Ollikainen, M.; Aarnos, K.; Rantanen, P.-L. Nutrient Abatement Potential and Abatement Costs of Waste Water Treatment Plants in the Baltic Sea Region. AMBIO 2013, 43, 352–360. [Google Scholar] [CrossRef] [Green Version]
- Gren, I.M. Economic value of uncertain nutrient abatement by mussel farming. PLoS ONE 2019, 14, e0210823. [Google Scholar] [CrossRef] [Green Version]
- NMI (Norwegian Meteorological Institute) EMEP Status Report 1/2019. 2019. Available online: https://emep.int/publ/reports/2019/EMEP_Status_Report_1_2019.pdf (accessed on 11 May 2020).
- Gren, I.-M.; Jonzon, Y.; Lindkvist, M. Calculation of Costs for Nutrient Reductions to the Baltic Sea—Technical Report; Department of Economics: Uppsala, Sweden, 2008. [Google Scholar]
- Pihlainen, S.; Zandersen, M.; Hyytiäinen, K.; Andersen, H.E.; Bartosova, A.; Gustafsson, B.; Jabloun, M.; Mc Crackin, M.; Meier, H.M.; Olesen, J.E.; et al. Impacts of changing society and climate on nutrient loading to the Baltic Sea. Sci. Total. Environ. 2020, 731, 138935. [Google Scholar] [CrossRef]
- HELCOM (Helsinki Commisison). Updated Fifth Baltic Sea Pollution Load (PLC-5.5). Environmental Proceedings No 145. 2015. Available online: https://www.helcom.fi/wp-content/uploads/2019/08/BSEP145_Lowres-1.pdf (accessed on 7 April 2020).
- Tagliapietra, D.; Povilanskas, R.; Razinkovas-Baziukas, A.; Taminskas, J. Emerald Growth: A New Framework Concept for Managing Ecological Quality and Ecosystem Services of Transitional Waters. Water 2020, 12, 894. [Google Scholar] [CrossRef] [Green Version]
- Hautakangas, S.; Ollikainen, M. Nutrient trading between waste water treatment plants in the Baltic Sea region. Environ. Res. Econ. 2019, 73, 533–556. [Google Scholar] [CrossRef]
- Gren, I.-M.; Tirkaso, W. Costs of mussel farming: A meta regression analysis. Aquaculture 2019. in review. [Google Scholar]
- Feistel, R.; Weinreben, S.; Wolf, H.; Seitz, S.; Spitzer, P.; Adel, B.; Nausch, G.; Schneider, B.; Wright, D.G. Density and Absolute Salinity of the Baltic Sea 2006–2009. Ocean Sci. 2010, 6, 3–24. [Google Scholar] [CrossRef] [Green Version]
- OECD Statistics. 2020. Available online: https://data.oecd.org/earnwage/average-wages.htm (accessed on 13 May 2020).
- OECD Statistics. 2020. Available online: https://data.oecd.org/interest/long-term-interest-rates.htm (accessed on 13 May 2020).
- Wollak, B.; Forss, J.; Welander, U. Evaluation of blue mussels (Mytilus edulis) as substrate for biogas production in Kalmar County (Sweden). Biomass Bioenergy 2018, 111, 96–102. [Google Scholar] [CrossRef]
- Hägg, H.E.; Humborg, C.; Mörth, C.-M.; Medina, M.R.; Wulff, F. Scenario Analysis on Protein Consumption and Climate Change Effects on Riverine N Export to the Baltic Sea. Environ. Sci. Technol. 2010, 44, 2379–2385. [Google Scholar] [CrossRef]
- Söderqvist, T. Contingent Valuation of a Less Eutrophied Balti Sea; Beijer Discussion Paper Series No 88; Beijer International Institute of Ecological Economics, Royal Swedish Academy of Sciences: Stockholm, Sweden, 1996. [Google Scholar]
- Ahtiainen, H.; Artell, J.; Czajkowski, M.; Hasler, B.; Hasselström, L.; Huhtala, A.; Meyerhoff, J.; Smart, J.C.R.; Söderqvist, T.; Alemu, M.H.; et al. Benefits of meeting nutrient reduction targets for the Baltic Sea—a contingent valuation study in the nine coastal states. J. Environ. Econ. Policy 2014, 3, 278–305. [Google Scholar] [CrossRef]
- Czajkowski, M.; Ahtiainen, H.; Artell, J.; Budziński, W.; Hasler, B.; Hasselström, L.; Meyerhoff, J.; Nõmmann, T.; Semeniene, D.; Söderqvist, T.; et al. Valuing the commons: An international study on the recreational benefits of the Baltic Sea. J. Environ. Manag. 2015, 156, 209–217. [Google Scholar] [CrossRef] [Green Version]
- Ollikainen, M.; Hasler, B.; Elofsson, K.; Iho, A.; Andersen, H.E.; Czajkowski, M.; Peterson, K. Toward the Baltic Sea Socioeconomic Action Plan. AMBIO 2019, 48, 1377–1388. [Google Scholar] [CrossRef] [Green Version]
Figure 1.
Total costs for marine basin, country targets, and overall N and P reductions.


Table 1.
Calculated business-as-usual (BAU) nitrogen (N) and phosphorus (P) loads from countries and to marine basins, and maximum load targets as share of BAU loads.
Table 1.
Calculated business-as-usual (BAU) nitrogen (N) and phosphorus (P) loads from countries and to marine basins, and maximum load targets as share of BAU loads.
| BAU N Load, kton a | BAU P Load, kton a | HELCOM N Targets, Share of BAU Load b | HELCOM P Targets, Share of BAU Load b | |
|---|---|---|---|---|
| Marine basins; | ||||
| Botthnian Bay | 18.0 | 1.08 | 1 | 1 |
| Bothnian Sea | 18.7 | 1.01 | 1 | 1 |
| Baltic Proper | 463.0 | 20.3 | 0.77 | 0.40 |
| Gulf of Finland | 100.1 | 3.80 | 0.88 | 0.48 |
| Gulf of Riga | 28.5 | 1.37 | 1 | 0.87 |
| Danish Straits | 31.4 | 0.62 | 1 | 1 |
| Kattegat | 28.5 | 1.08 | 0.93 | 1 |
| Total | 688.2 | 29.25 | 0.82 | 0.51 |
| Countries; | ||||
| Denmark | 33.3 | 0.66 | 0.93 | 0.98 |
| Finland | 43.9 | 1.99 | 0.94 | 0.91 |
| Germany | 20.7 | 0.29 | 0.86 | 0.68 |
| Poland | 332.9 | 16.48 | 0.77 | 0.39 |
| Sweden | 50.9 | 2.11 | 0.90 | 0.85 |
| Estonia | 15.2 | 0.72 | 0.90 | 0.60 |
| Latvia | 29.1 | 1.26 | 0.95 | 0.90 |
| Lithuania | 75.9 | 1.89 | 0.78 | 0.44 |
| Russia | 86.2 | 3.85 | 0.86 | 0.47 |
Table 2.
Allocation of costs between countries under marine basin, country, and Baltic Sea targets.
| Country | Marine Basin Targets | Country Targets | Baltic Sea Targets |
|---|---|---|---|
| Denmark | 0.002 | 0.002 | 0.168 |
| Finland | 0.010 | 0.002 | 0.052 |
| Germany | 0.021 | 0.039 | 0.052 |
| Poland | 3.700 | 5.401 | 0.789 |
| Sweden | 0.372 | 0.013 | 0.089 |
| Estonia | 0.016 | 0.007 | 0.082 |
| Latvia | 0.044 | 0.003 | 0.121 |
| Lithuania | 0.564 | 0.475 | 0.403 |
| Russia | 0.543 | 0.385 | 0.607 |
| Total | 5.272 | 6.327 | 2.363 |
Table 3.
Costs for achieving alternative targets under different scenarios, billion euro.
| Marine Basin Targets | Country Targets | Baltic Sea Targets | |
|---|---|---|---|
| 10% decrease in retention | 5.64 | 6.99 | 2.52 |
| 10% decrease in meat production | 3.91 | 4.61 | 1.71 |
| 10% increase in costs of agricultural measures | 5.75 | 6.91 | 2.51 |
| 10% decrease in sewage cleaning capacity | 8.37 | 10.26 | 3.36 |
Table 4.
Deviations from marine basin load targets under the country and Baltic Sea targets, % from basin load targets.
Table 4.
Deviations from marine basin load targets under the country and Baltic Sea targets, % from basin load targets.
| Country Targets | Baltic Sea Targets | |||
|---|---|---|---|---|
| N | P | N | P | |
| Baltic Proper | 5.8 | 2.7 | 5.1 | 22.8 |
| Gulf of Finland | 5.6 | −1.5 | −11.1 | −14.3 |
| Gulf of Riga | 3.7 | −49.0 | ||
| Kattegat | 2.8 | −9.2 | ||
© 2020 by the authors. Licensee MDPI, Basel, Switzerland. This article is an open access article distributed under the terms and conditions of the Creative Commons Attribution (CC BY) license (http://creativecommons.org/licenses/by/4.0/).
Share and Cite
MDPI and ACS Style
Gren, I.-M.; Tirkaso, W.T. Cost Effectiveness of Ecosystem-Based Nutrient Targets—Findings from a Numerical Model for the Baltic Sea. Water 2020, 12, 2679. https://doi.org/10.3390/w12102679
AMA Style
Gren I-M, Tirkaso WT. Cost Effectiveness of Ecosystem-Based Nutrient Targets—Findings from a Numerical Model for the Baltic Sea. Water. 2020; 12(10):2679. https://doi.org/10.3390/w12102679
Chicago/Turabian StyleGren, Ing-Marie, and Wondmagegn Tafesse Tirkaso. 2020. "Cost Effectiveness of Ecosystem-Based Nutrient Targets—Findings from a Numerical Model for the Baltic Sea" Water 12, no. 10: 2679. https://doi.org/10.3390/w12102679
Note that from the first issue of 2016, this journal uses article numbers instead of page numbers. See further details here.