


1. Introduction
As one of the largest mountain systems of high mountain Asia, Tien Shan (39–46° N, 69–95° E) stretches ~2500 km from west-southwest to east-northeast. It holds one of the highest concentrations of glaciers at the middle and low latitudes of the world, and is known as ‘central Asian Water Tower’. Glaciers serve as not only a reliable and unequivocal climate indicator, but also as an indispensable water resource for the domestic use, agricultural irrigation, hydropower and ecology in Chinese Xinjiang, Kyrgyzstan and nearby countries with large populations (e.g. Pritchard, Reference Pritchard2019). In response to climatic warming in recent decades, these glaciers are experiencing wide-ranging mass loss, which affects the downstream seasonal runoff, and increases the risk of proglacial lake outbursts (e.g. Watson and others, Reference Watson2019). These issues have widespread concerns among the public and policy-makers. Therefore, quantitative estimation of glacier mass changes is of vital importance for water management, disaster risk reduction and making policy on the adaptation of environmental change and local development.
Based on the characteristics of climate, topography and drainage basin, Tien Shan is generally divided into four sub-regions, i.e. western, northern, central and eastern Tien Shan. There are 10 778 glaciers with a coverage of 13 566.6 km2 (Zhang and others, Reference Zhang, Zhao, Han and Sun2019). Their spatial distribution is uneven, among which glaciers in central Tien Shan are largest in area, accounting for 59.3% of glacier area over the whole Tien Shan, followed by western Tien Shan, whereas the smallest glacierized area is found in the eastern Tien Shan (Chen and others, Reference Chen, Li, Deng, Fang and Li2016). During the past half-century, significant warming has caused widespread retreat of alpine glaciers (Haeberli and others, Reference Haeberli, Hoelzle, Paul and Zemp2007; Farinotti and others, Reference Farinotti2015). In accord with glaciers in other regions of the world, glaciers in the Tien Shan have been retreating since the mid-19th century (e.g. Solomina and others, Reference Solomina, Barry and Bodnya2004; Bolch and others, Reference Bolch2009; Narama and others, Reference Narama, Kääb, Duishonakunov and Abdrakhmatov2010), resulting in a decrease of glacier area and mass loss of 18 and 27% for the 1961–2012 period (Farinotti and others, Reference Farinotti2015). At the regional scale, glacier behavior is usually heterogeneous. Between the 1960s and 2000, 20% shrinkage in the extent of glaciers was observed over the western Tien Shan, 15.1% over the central Tien Shan, and 13 and 3.1% over the northern and eastern Tien Shan, respectively (Chen and others, Reference Chen, Li, Deng, Fang and Li2016). In the central Tien Shan, decrease in the area and mass from east to west and from the inner to the outer ranges has been also documented between the 1970s and 2000s (e.g. Pieczonka and Bolch, Reference Pieczonka and Bolch2015). Although a lot of effort has been made to quantify glacier distribution and glacier changes over the Tien Shan, considerable gaps in knowledge still exist with respect to ice loss rates and related climate drivers on different timescales, especially for the eastern Tien Shan.
To investigate the temporal changes in the glacier mass, continuous glacier mass-balance measurements are generally required by means of traditional glaciological methods of snow pits and ablation stakes. However, these are only available for a few select glaciers over a limited number of years due to extremely harsh conditions and logistic constraints (Paterson, Reference Paterson1994). In recent decades, substantial advances have been made in geodetic mass-balance measurements, including improved resolution and spatial coverage, to estimate glacier surface elevation and mass changes over various time spans. The advantage of this method is to calculate the regionally averaged glacier mass balance over the several years or decades through multi-temporal digital elevation models (DEMs). Here, we focus on the Karlik Range in the easternmost Tien Shan, where several studies have revealed significant shrinkage in glacier extent during the past 40 years, and an acceleration of shrinkage since the 1990s (Wang and others, Reference Wang, Hou and Liu2009). However, a comprehensive estimate of changes in glacier mass balance on different timescales is lacking. Thus, based on the available topographic maps, ASTER DEM and SRTM DEM, our objective is to quantify the surface-elevation and mass changes of the glaciers on the Karlik Range between 1972 and 2015. We also investigated several climate drivers related to the observed changes.
2. Study area
Karlik Range is located on the easternmost Tien Shan and surrounded by deserts such as the Gobi (Fig. 1). Its highest peak is Tomurti Peak at an elevation of 4886 m a.s.l. Largely controlled by the westerlies and Mongolian-Siberian high, the climate is continental, with dominant precipitation occurring in summer (May–September), and with cold and dry winter (Wang and others, Reference Wang, Liu and Ding1986). Records from the Yiwu Weather Station on the north slope of Karlik Range indicate that only 8% of annual precipitation falls in winter (Luo and others, Reference Luo, Liu and Wu1999). A unique glacial field with nearly free of debris is present over the Karlik Range. There are different types of the glaciers, including flat-top, valley, hanging and cirque glaciers. According to the second Chinese Glacier Inventory by Landsat Thematic Mapper (TM) and Enhanced Thematic Mapper Plus (ETM+) images during 2006–2011 (Guo and others, Reference Guo2015), there are 146 glaciers covering an area of 109.2 km2. The glaciers with an area of <1 km2 are dominant, and the largest one has an area of only 6.6 km2. Their equilibrium-line altitude (ELA) ranges from 3900 to 4000 m a.s.l.

Fig. 1. (a) Location of the study area. Sub-regions of Tien Shan: (I) western Tien Shan, (II) central Tien Shan, (III) northern Tien Shan and (IV) eastern Tien Shan. (b) Glacier field of the Karlik Range, seen on the Landsat ETM+ image on 17 September 2001.
3. Data and methods
3.1 Data
3.1.1 Topographic maps
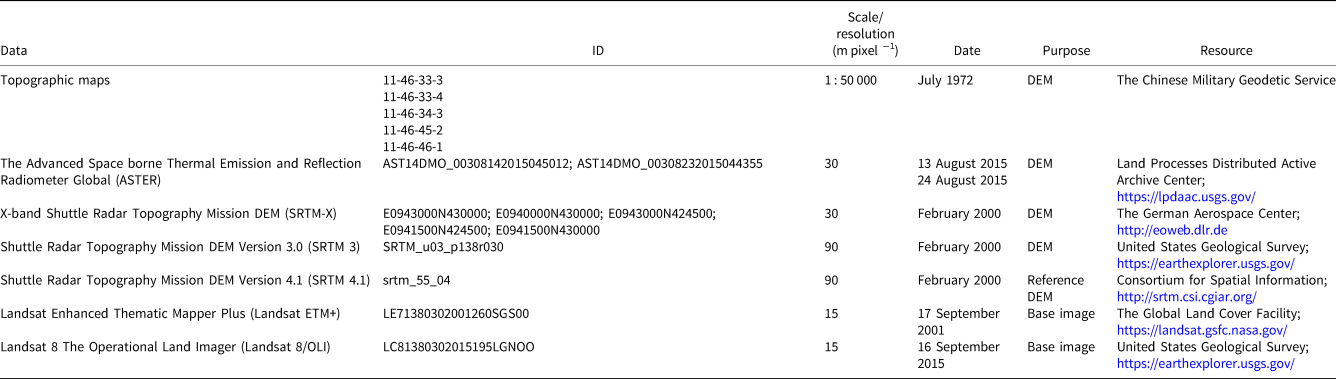
Four topographic maps at a scale of 1 : 50 000 generated using aerial stereo pairs from July 1972 were acquired by the Chinese Military Geodetic Service (Table 1) . These maps were projected to the Beijing Geodetic Coordinate System 1954 (BJ54) and the Yellow Sea 1956 datum (the mean sea level at the Qingdao Tidal Observatory in 1956). A seven-parameter transformation was used to convert the BJ54 and Yellow Sea 1956 datum to the World Geodetic System 1984 (WGS1984) and Earth Gravity Model 1996 (EGM96). The contours and points digitized from these maps are used to establish a DEM at a resolution of 30 m, called TOPO-DEM.
Table 1. List of data for the glacier change assessment over the Karlik Range
According to the Standardization Administration of the People's Republic of China (General Administration of Quality Supervision Inspection and Quarantine, 2008), the nominal accuracy of topographic maps in verticality is ±3 m over flat regions (<2° slopes), ±5 m over hilly regions (2–6° slopes), ±8 m over mountainous regions (slopes of 6–25°) and ±14 m over high mountain regions (slopes of >25°). The accuracies were determined by comparing with measured elevations of ground control points. The average slope of glacier fields in the Karlik Range is 15.3°; thus, we consider the vertical accuracy of TOPO DEM to be ±8 m.
3.1.2 SRTM DEM and ASTER DEM
In this study, we use the Shuttle Radar Topography Mission (SRTM) DEMs (Table 1), which are generated by X-band and C-band synthetic aperture radar data with swath widths of 225 and 45 km, respectively (Farr and others, Reference Farr2007). The SRTM data have been collected on 11 February 2000 and we consider that the SRTM DEM for the glaciers on Karlik Range also covers this temporal range. The C-band SRTM DEM covers an approximately global surface from 56° S to 60° N latitudes. This DEM is thought to represent the glacier surface at the end of the ablation period of 1999, because C band radar penetrates into the winter snowpack (Rignot and others, Reference Rignot, Echelmeyer and Krabill2001). Due to the narrower swath of antennas in the X-band sensor, the resulting DEM only accounts for approximately half of the C-band SRTM DEM extent. The C-band SRTM DEM has an initial spatial resolution of 3 arcsec (Rodriguez and others, Reference Rodriguez, Morris and Belz2006). On 24 September 2014, 1 arcsec (~30 m) global C-band SRTM DEM became available. Its coordinate system is WGS84, defined as 1996 Earth Gravitational Model (EGM96) geoid. The X-band SRTM DEM has a spatial resolution of 1 arcsec and follows the WGS84 ellipsoid vertical datum. The nominal absolute elevation accuracy of SRTM data is ±16 m at the 90% confidence level, equivalent to a root mean square error of ~10 m.
C-band radar penetration of SRTM into snow and ice can reach up to 10 m in the accumulation area of glaciers (Dall and others, Reference Dall, Madsen, Keller and Forsberg2001; Rignot and others, Reference Rignot, Echelmeyer and Krabill2001). Because of the narrower wavelength of X-band radar, it penetrates snow and ice to shallower depth than that of the C-band; therefore, it is usually neglected for glacier mass-balance estimates. Fortunately, the X-band DEM covers >95% of glaciers in the Karlik Range; thus, this DEM is used to assess glacier mass balance in this study. The void-filled version 4.1 SRTM dataset (SRTM4.1), which has a resolution of 3 arcsec (Jarvis and others, Reference Jarvis, Reuter, Nelson and Guevara2008) and was produced by the CGIAR Consortium for Spatial Information using the original SRTM3 data (USGS, 2006), is also used as a reference to correct the X-band SRTM DEM, TOPO-DEM and ASTER DEM. A MATLAB-geoid height program is used to convert the vertical reference datum of the SRTM X-band DEM to the EGM96 geoid. This program uses the EGM96 Geopotential Model and correction coefficients to calculate point geoid undulations with respect to the WGS84 ellipsoid at any given latitude and longitude by spherical harmonic synthesis. The EGM96 Geopotential Model uses a 15-min grid of point values in the tide-free system to a degree and order 360. The uncertainty in the conversion based on this model is estimated to be 0.01 m (https://www.mathworks.com/help/aerotbx/ug/geoidheight.html), which is negligible in the estimate of glacier elevation changes.
The Advanced Space borne Thermal Emission and Reflection Radiometer (ASTER) is a multispectral imager that was launched on board Terra spacecraft of the National Aeronautics and Space Administration (NASA) in December 1999. It contains three subsystems: a visible and near-infrared telescope (VNIR), a shortwave infrared (SWIR) sensor and a thermal infrared (TIR) facility, at resolutions of 15, 30 and 90 m, respectively. The VNIR subsystem consists of two independent telescopes that produce stereo images for creating DEMs. The 3N (nadir) and 3B (backward) bands of ASTER Level 1A images are used to generate the ASTER DEM (AST14 DEM) by the Land Processes Distributed Active Archive Center (LP DAAC) based on SilcAst software. AST14DEM does not contain data gaps and has an estimated vertical accuracy of 10–20 m (Nuth and others, Reference Nuth and Kääb2011). AST14DEM is geodetically referenced to the WGS84/EGM96 geoid. After carefully checking the quality of the ASTER images (no clouds and minimum snow cover) used to produce AST14DEMs, we choose two AST14DEMs tiles obtained on 13 and 24 August 2015 for the glacier mass change evaluation (Table 1).
3.2 Methods
3.2.1 DEM co-registration and terrain curvature corrections
Before we calculated the surface elevation changes based on DEM differencing, a 3-D co-registration was necessary to minimize the biases caused by the horizontal and vertical offsets between the DEMs in evaluation. As Nuth and Kääb (Reference Nuth and Kääb2011) noted, the relationship between the elevation difference and topographic slope and aspect can be quantified using the following equations:


where α and Φ are the topographic slope and aspect, respectively; dH is the elevation difference of the ice-free areas; $\overline {{\rm d}H}$ is the overall elevation difference, representing the vertical bias and a, b and c are the regression parameters, determined using least square optimization. X, Y and Z stand for the horizontal shift in the X-direction, Y-direction and mean vertical bias, respectively (Table 2).
Table 2. The offsets in X, Y and Z directions of the DEM dataset and the uncertainty in DEMs before and after co-registration
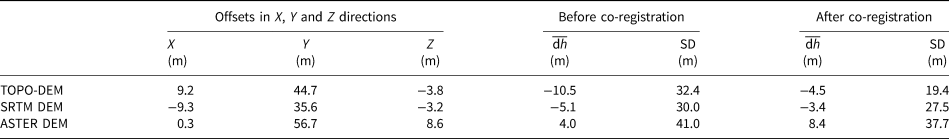
SD stands for standard deviation and $\overline {{\rm d}h}$ denotes mean bias.
Before co-registration, all DEMs were projected in the UTM Zone 46 North projection and resampled to the same cell size of 30 m resolution. Then, SRTM4.1 was used as the no-glacier reference to correct the horizontal and vertical shifts in the X-band SRTM DEM, TOPO-DEM and ASTER DEM datasets (Fig. S1). Offsets on the stable non-glacierized terrain were calculated by a minimum of the standard deviation (SD) of the elevation difference (Berthier and others, Reference Berthier2007). When masking out the stable terrain for co-registration, the areas with slope angles of <5° were eliminated, following the approach of Wang and others (Reference Wang2018).
Gardelle and others (Reference Gardelle, Berthier, Arnaud and Kaab2013) suggested that differences in the original spatial resolution of DEMs may lead to altitude-dependent vertical biases, which exhibit a robust relationship with the terrain maximum curvature. Furthermore, the resulting vertical biases consistently exist, whether or not the terrain is covered with glaciers. Therefore, we used this relationship from the ice-free terrain to correct the biases in the terrains covered by glaciers.
3.2.2 Glacier polygons and geodetic mass-balance calculation
To quantify the glacier mass balance over different time spans, the corresponding glacier extents were delineated. We visually interpreted the glacier boundaries from 1972 based on the topographic maps corrected by aerial images. The resulting glacier boundaries were further verified using three Landsat Multispectral Scanner images from August and September 1977 and SRTM4.1 data. The polygons delineating glacier extents in 2000 were determined using a combination of Landsat Thematic Mapper (TM) and Enhanced Thematic Mapper Plus (ETM+) imagery from 2001, with SRTM4.1. Landsat 8 and ASTER images (Table 1) were used to delineate the glacier extents in 2015. To ensure the clarity of the glacier boundary and reduce the false photointerpretation of glaciers, images with the minimal seasonal snow and no cloud coverage were selected. When manually delineating glacier boundaries, the accuracy of all photo interpretations was bound to the minimum of a single pixel.
To minimize error in the elevation change calculation, outlier filtering was performed before the glacier surface elevation changes were calculated. First, elevation changes of >100 m in the glacier zones below the ELA and elevation increases of >50 m above the ELA likely result from stereo-matching errors caused by cloud cover or a low contrast of radiometry. Thus, these data were defined as outliers and were not included in the elevation change assessment. Second, the pixels were regarded as outliers if their elevation change values were not within ±3σ in each 100 m altitude bin (Gardelle and others, Reference Gardelle, Berthier, Arnaud and Kaab2013). The DEM elevation uncertainties usually increase as the slope angle increases, especially on mountain crests (>30° slope). As suggested by Pieczonka and others (Reference Pieczonka, Bolch and Buchroithner2011), pixels with slopes >30° were excluded. These glaciers are small and their slope angles are relatively high within the accumulation zone. Several unrealistic interpolation over data gaps may occur when using topographic maps derived from stereo photogrammetry, often in low-contrast accumulation zones. Here, following Holzer and others (Reference Holzer2015), we excluded pixels with values outside the 30 and 68% elevation change quantiles of the accumulation zone for each glacier.
There are a number of methods for filling in missing elevation change data of glaciers, such as linearly interpolating elevation differences, using the mean difference of the elevation bin, applying a polynomial fit of the elevation change by the elevation bin, and combining glacier hypsometry with the curve. According to McNabb and others (Reference McNabb, Nuth, Kääb and Girod2019), among the void-filling methods, using linear interpolation of elevation changes and local mean hypsometric methods perform best and result in differences from the non-void filled elevation change estimates of <1%. We used the local mean hypsometric method to fill the voids and the missing elevations were assigned from the mean value of the corresponding 100-m elevation bin.
To estimate the mass balance of an individual glacier, we first calculated its volume change by multiplying each grid pixel elevation change value with the corresponding pixel area (the resolution of the DEMs) in the glacier polygon, and then summing these values. Then, the variation in the glacier surface elevation was determined by dividing the calculated glacier volume changes by the area of the glacier. Finally, we used an average ice-firn density of 850 ± 60 kg m−3 (Huss, Reference Huss2013) to convert the glacier elevation change to glacier geodetic mass balance in units of m w.e. a−1.
3.2.3 Uncertainty assessment
Systematic and random uncertainties in the glacier elevation changes (U Δh) were estimated using the SD of the averaged elevation change (STDh), the number of measurements (considering spatial autocorrelation) from non-glacierized terrain (e.g. Nuth and Kääb, Reference Nuth and Kääb2011; Paul and others, Reference Paul2015) and the averaged absolute difference (AAD) between the median elevation change on and off-glacier (Berthier and Brun, Reference Berthier and Brun2019) in Eqn (6):

where N eff is the number of independent pixels measurements. Because the gridpoints have strong spatial autocorrelation, the influence of spatial autocorrelation should be removed in the calculation. N eff was estimated by the following formula:

where N t is the total number of pixels from stable areas; P is the pixel resolution and d is the distance of spatial autocorrelation. As suggested by Koblet and others (Reference Koblet2010) and Bolch and others (Reference Bolch, Pieczonka and Benn2011), the spatial autocorrelation of gridpoints from 20 pixels is negligible. In this study, the spatial autocorrelation distance was considered to be 600 m, which was a conservative value determined by semivariogram analyses over mountainous regions (Rolstad and others, Reference Rolstad, Haug and Denby2009; Maurer and others, Reference Maurer, Rupper and Schaefer2016; Brun and others, Reference Brun, Berthier, Wagnon, Kääb and Treichler2017).
To account for the errors introduced when filling the elevation values by extrapolation, the uncertainty of extrapolation (U e) was also calculated. Following Maurer and others (Reference Maurer, Rupper and Schaefer2016) and Maurer and others (Reference Maurer, Schaefer, Rupper and Corley2019), the maximum of the SDs of glacial elevation change in any 100 m bin were regarded to be U e.
The glacier boundary errors in the estimation of changes in glacier thickness cannot be negligible. The uncertainty of the glacier extent in this study was based on the formula proposed by Braun and others (Reference Braun2019):

where U a is defined as the error of the glacier area and P/A is the ratio between the perimeter and area. Paul and others (Reference Paul2013) analyzed the accuracy of the remote-sensing image to extract the glacier boundary and found an area ratio parameter P/A (Paul et al.) of 5.03 km−1; therefore, this parameter was applied to the estimation of uncertainty in glacier areas by Braun and others (Reference Braun2019). Huss and others (Reference Huss2013) estimated the uncertainty in the ice density to be 60 kg m−3, which was also included in the overall uncertainty estimate.
The total uncertainty in the glacier mass balance (U) was estimated using Eqn (9), which accounts for systematic and random uncertainties in glacier elevation change (U Δh), the extrapolation uncertainty (U e), the area uncertainty (U a) and the ice density error (U d):

where ΔM represents the mass-balance estimate, Δh is the estimated elevation change, a is the glacier area and d is the ice density. The total uncertainty in the glacier mass balance was reported at ±1σ (standard error of the average).
4. Results
Glaciers in the Karlik Range experienced significant surface lowering during the past 40 years. For the entire study area, the mean glacier elevation change is estimated to be −0.22 ± 0.08 m a−1 from 1972 to 2000, and −0.52 ± 0.20 m a−1 for the 2000–2015 period (Table 3), which results in annual mass loss rates of 0.19 ± 0.08 m w.e. a−1 over 1972–2000 and 0.45 ± 0.17 m w.e. a−1 over 2000–2015. This reveals accelerated mass loss in the early 21st century, compared to that in 1972–2000.
Table 3. Glacier elevation change and mass balance for the Karlik Range during 1972–2000, 2000–2015 and 1972–2015 periods
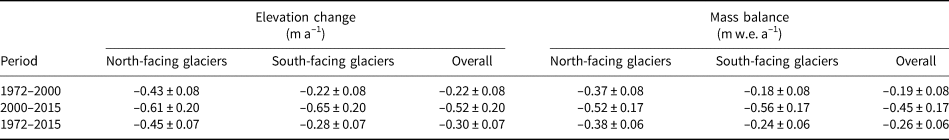
The uncertainty was ±1σ of total uncertainty.
The DEM differencing for the three time spans 1972–2000, 2000–2015 and 1972–2015 shows spatially and temporally heterogeneous change in glacier surface elevation in the Karlik Range (Figs 2 and 3). Larger ice surface lowering is mainly observed in the lower part of the ablation zone, whereas smaller ice thinning is generally observed at higher elevations. During 1972–2000, ~79% of the glaciers' surface lowered. Over 2000–2015, glacier thinning is observed in almost all glacier gridcells, and the thinning rates are generally larger compared to those in 1972–2000. The annual mean mass loss rate of north facing glaciers (−0.37 ± 0.08 m w.e. a−1) is double that of south facing glaciers (−0.18 ± 0.08 m w.e. a−1) for the 1972–2000 period (Table 3). However, between 2000 and 2015, the mean mass loss rate of north facing glaciers (−0.52 ± 0.17 m w.e. a−1) is lower than that of south facing glaciers (−0.56 ± 0.17 m w.e. a−1).

Fig. 2. Surface elevation change of the glaciers over the Karlik Range: (a) between 1972 and 2000 and (b) from 2000 to 2015.
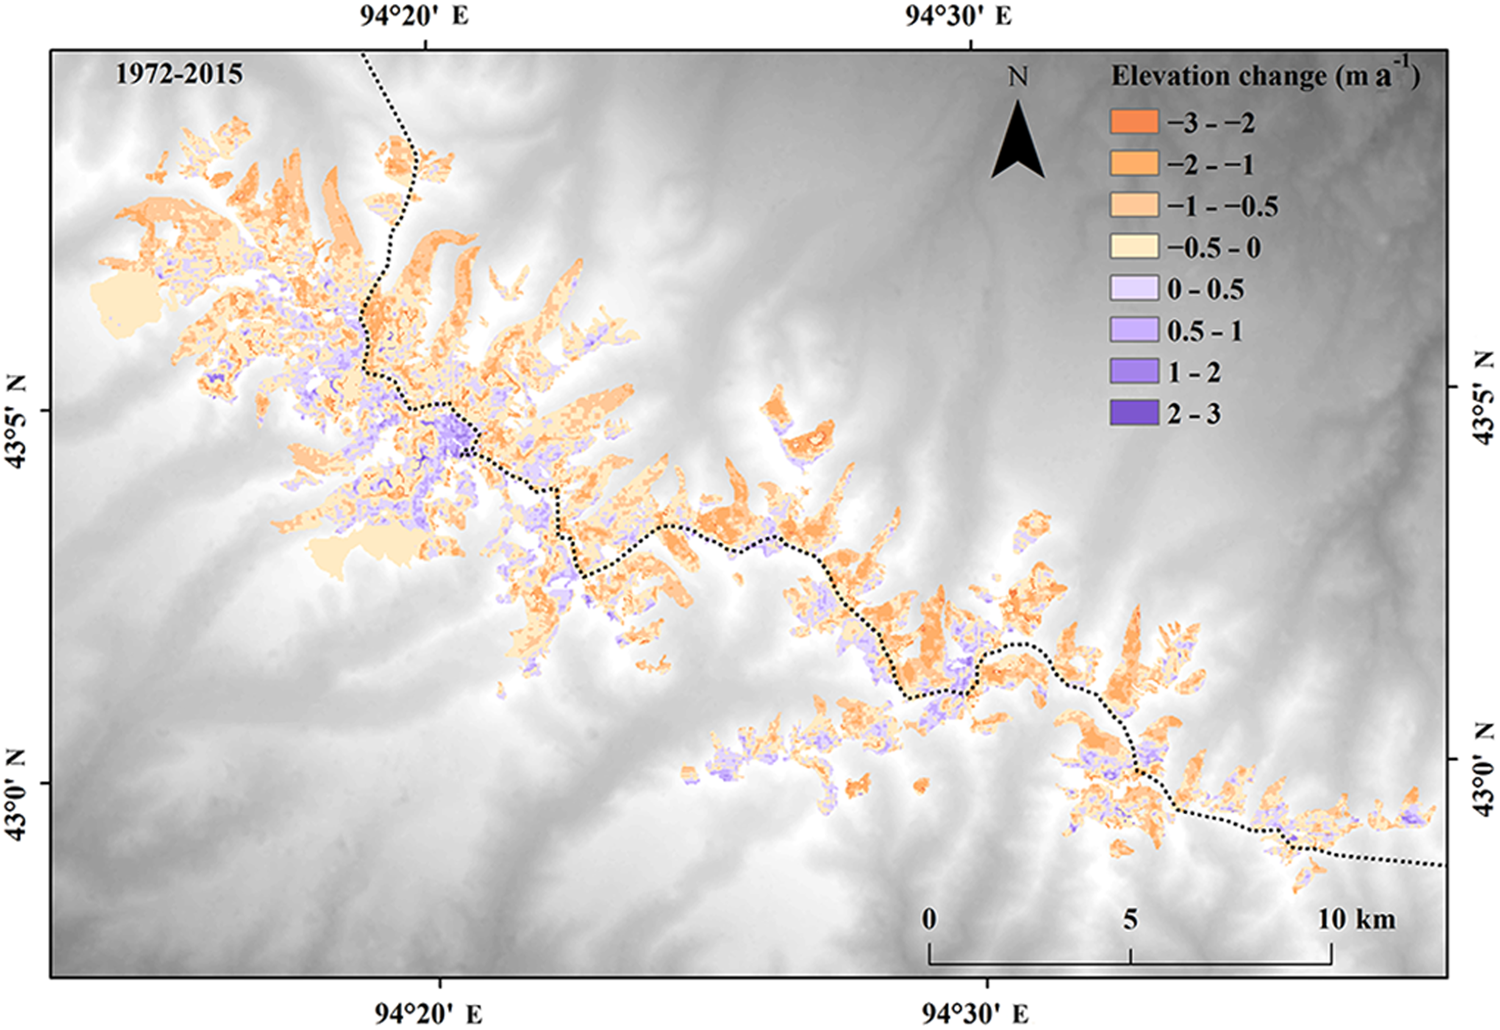
Fig. 3. Surface elevation change of the glaciers over the Karlik Range during 1972–2015.
Large positive elevation change values (>4 m a−1) occur in several grid pixels near the mountain ridges, over several parts of glacier margins and steep faces. Glacier thickening in these regions is likely related to DEM artifacts, sliding or avalanches, and so on, but we can ignore their impacts on the elevation change estimates due to their minor spatial coverage (<1%).
The altitudinal distribution of rates of glacier elevation changes in 100 m elevation bins, with uncertainties, for the periods 1972–2000, 2000–2015 and 1972–2015, are shown in Figure 4. Error bars are so large that no clear trends can be easily observed within the uncertainty limits. However, error bars are the SD values of the DEM differencing on all gridcells of each elevation bin, which include uncertainties in the glacier elevation changes and the large glacier elevation changes that occur at local scales. All in all, these glacier ice thinning profiles are a function of elevation, i.e. the rate of thinning decreases with increased elevation. Between 1972 and 2000, glacier thinning (negative glacier elevation change rates) is dominant, with greater thinning in the lower elevations. From 2000 to 2015, the glacier surfaces lowered at all altitudes.
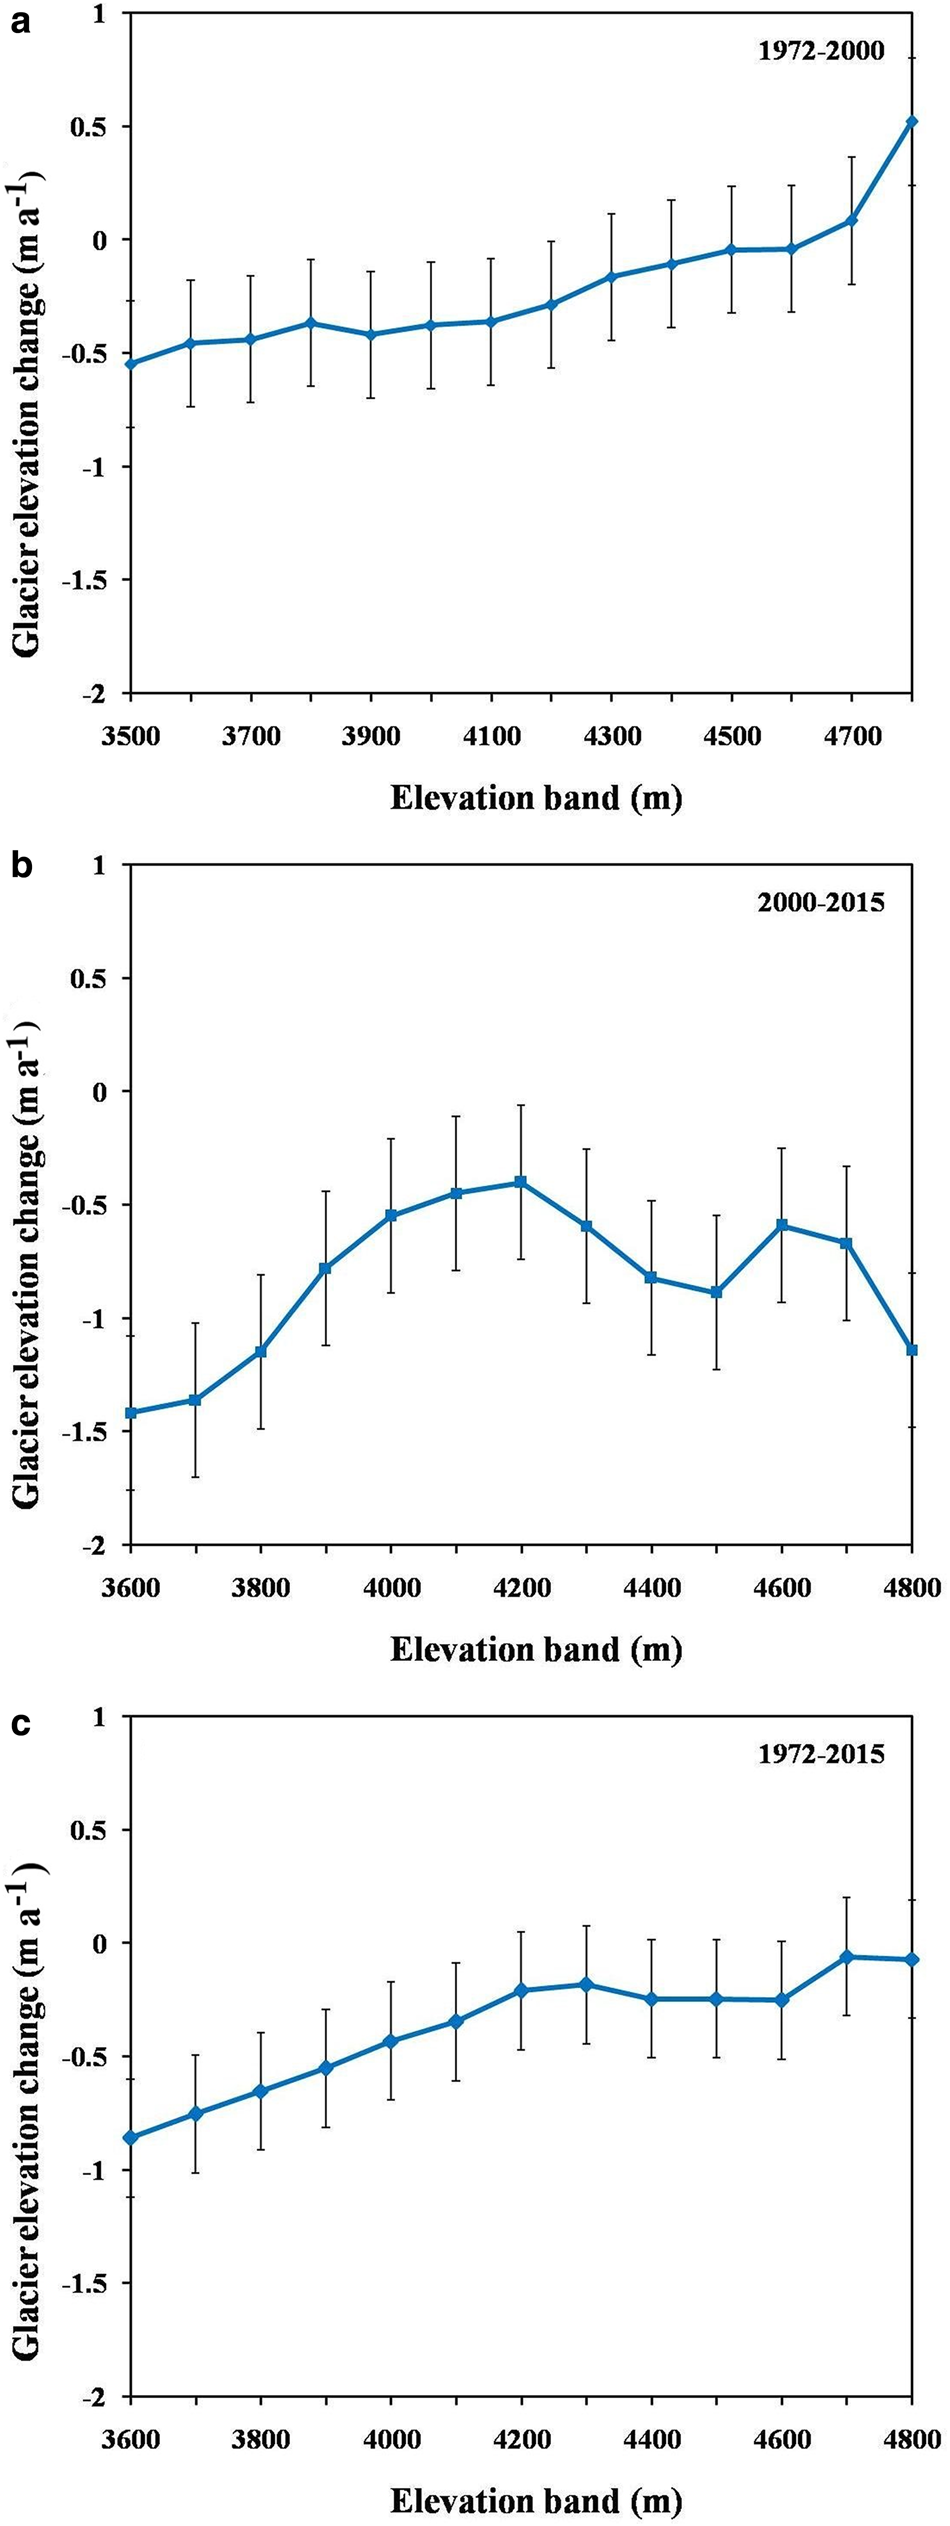
Fig. 4. Averaged glacier elevation change rate in each 100 m elevation bin over the Karlik Range, for the (a) 1972–2000, (b) 2000–2015 and (c) 1972–2015 periods. Generally, glacier elevation change rates decrease with increased elevation.
5. Discussion
5.1 Comparison with the previous estimates of glacier changes in the Karlik Range
Previous studies showed an overall decline in glacier extent in the Karlik Range since the Little Ice Age (LIA). Between the LIA and 2006–2010, glaciers experienced a decrease in area of at least 29.6% (Li and others, Reference Li, Li, Chen and Lu2016). Wang and others (Reference Wang, Hou and Liu2009) reported 5.3% area loss from 1971/72 to 2001/02 in this region, and accelerated shrinkage since the 1990s. For the whole Karlik Range, the total extent of 75 glaciers decreased by 10.5% between 1972 and 2005 (Li and others, Reference Li, Li, Gao and Wang2011). Total glacier area loss over the eastern Tien Shan is estimated to be 21.5% during 1977–2013 by Du and others (Reference Du2019).
Ice thickness measurements of Ground Penetrating Radar in three sites in the upper parts of Miaoergou Ice Cap (43°03′ N, 94°19′ E) on the Karlik Range show that the thinning of this ice cap is 0.2 m a−1 between 1981 and 2005 (Li and others, Reference Li, Wang, Zhu and Li2007). Our estimates show a surface lowing of this ice cap of 0.26 ± 0.06 m a−1 over 1972–2015, which is consistent with the results of Li and others (Reference Li, Wang, Zhu and Li2007). Based on Real Time Kinematic-Global Position System elevation measurements and DEMs generated from 1 : 50 000 topographical maps from 1972, Wang and others (Reference Wang2015) reported a thinning of 0.51 m a−1 over the ablation zone of the Yushugou No. 6 (43°05′ N, 94°19′ E) glacier during 1972–2011, which is broadly consistent with our estimate for the ablation area of the same glacier (0.41 ± 0.07 m a−1 over 1972–2015).
5.2 Comparison with the other regions of Tien Shan
A number of studies have estimated glacier mass changes on Tien Shan over the different time spans with different methods. For example, Farinotti and others (Reference Farinotti2015) reported glacier mass changes over the western and central Tien Shan during 1961–2012 based on average GRACE-based estimates, ICESat-based estimates and estimates based on glaciological measurements and modeling. Pieczonka and Bolch (Reference Pieczonka and Bolch2015) evaluated glacier mass loss over the central Tien Shan during 1976–1999 using KH-9 Hexagon data and SRTM DEMs. These studies are also affected by relatively large uncertainties mainly caused by noise in remote-sensing images, such as that related to radar signal penetration, voids in the optical stereo-imagery due to low radiometric contrast and so on. As a result, the differences in regional glacier mass loss rates may often fall within their uncertainty bounds. Furthermore, the different glacier mass loss rates may occur over different time frames. Thus, we cannot make direct comparisons with these estimates. Glacier mass loss estimates for the entire Tien Shan, not including the Karlik Range, between 2000 and 2016, were calculated by Brun and others (Reference Brun, Berthier, Wagnon, Kääb and Treichler2017) using ASTER images and SRTM DEM. Compared with the result of Brun and others (Reference Brun, Berthier, Wagnon, Kääb and Treichler2017) (−0.28 ± 0.20 m w.e. a−1), our regional glacier mass budget is more negative (−0.45 ± 0.17 m w.e. a−1 during 2000–2015). This may be attributed to differences in regional air temperature changes. From 2000, a significant positive trend of annual mean air temperature was observed in the eastern Tien Shan, whereas no obvious temperature changes occurred in the other regions of Tien Shan (Chen and others, Reference Chen, Li, Deng, Fang and Li2016). Other possible factors include differences in the spatial extents of studies, and errors in determination of the radar penetration of SRTM DEMs. In addition, the uncertainty in the estimate by Brun and others (Reference Brun, Berthier, Wagnon, Kääb and Treichler2017) is still large, almost equal in magnitude to their average estimate.
5.3 Uncertainties in the glacier mass-balance estimate
The error of signal penetration of SRTM is an important source of uncertainty. Under conditions of melting/liquid water, almost no penetration occurs in the X-band and C-band radar signals of SRTM. However, under frozen conditions, the C-band radar can penetrate several meters. SRTM X-band energy is prone to penetrate dry snow over the accumulation zone (Gardelle and others, Reference Gardelle, Berthier and Arnaud2012). The average penetration depth of TanDEM-X is 0.61 ± 0.06 m for the Puruogangri icefield in the inner Tibetan Plateau (Liu and others, Reference Liu2019), which appears to imply that the penetration depth of the X-band SRTM DEM may be not negligible for our studied glaciers, especially for the accumulation areas. This implies that the uncertainty in the glacier mass-balance estimate will further increase if this is not considered. However, compared with the large average elevation changes (>6 m) for any time spans within 1972–2000, 2000–2015 and 1972–2015, X-band radar signal penetration might be minimal in our study area and the uncertainty in the glacier mass-balance estimate result from the X-band penetration depth may be negligible. Therefore, as most studies have done, X-band penetration is not considered based on the hypothesis proposed by Gardelle and others (Reference Gardelle, Berthier and Arnaud2012). Of course, if we corrected the X-band penetration depth in our estimate, the resulting glacier elevation changes might slightly increase for the 1972–2000 period but would decrease for the 2000–2015 period.
Our error bars for glacier mass balance (0.08–0.17 m w.e. a−1) are relatively large. Systematic errors in the glacier elevation change estimate account for ~78% of the total uncertainty. These errors largely result from noise in the DEMs. In addition, the uncertainty in the elevation changes somewhat depends on the ability to co-register DEMs. However, the vertical deviation of ice-free areas, which is used to co-register DEMs, may not fully reflect the vertical deviation on the glaciers. To explore this discrepancy, as suggested by Berthier and others (Reference Berthier and Brun2019), we add the average absolute difference of the median elevation change on and off-glacier in the uncertainty estimate.
The uncertainties in the glacier mass change estimate may complicate interpretation of the resulting variability in glacier elevation and mass balance. In magnitude, the errors cover ~35% of the changes in the mass balance during 1972–2000, 41% of those that occur during 2000–2015, and 23% of those that occur during 1972–2015. Despite the relatively large errors (maximum: 0.17 m w.e. a−1), the error bounds are smaller than the mean glacier mass loss over 1972–2000 (−0.19 m w.e. a−1) and the mean value for 2000–2015 (−0.45 m w.e. a−1).
5.4 Variability in the glacier mass balance
Glacier mass loss is usually estimated from the shrinkage in the glacier extent and surface lowering. As described in Section 4, between 1972 and 2000, glaciers experience surface lowering of −0.22 ± 0.08 m a−1, and the mean surface lowering rate reaches −0.52 ± 0.20 m a−1 since 2000. Most glaciers (>80%) have decreased in extent during the two time spans (Du and others, Reference Du2019). The glacier mass loss caused by extent shrinkage accounts for 47.3% of the total glacier mass loss during 1972–2000. For the 2000–2015 period, 25.9% of the total glacier mass loss occurs due to reduced glacier extent.
To investigate the role of morphometrics in glacier mass balance, we examine the correlation between glacier mass-balance change over 1972–2015 and morphometric factors, i.e. the elevation, surface slope and aspect of individual glaciers (Figs 5a, b, c). Glacier mass-balance changes positively correlate (r = 0.46, p < 0.05) with mean elevation, which reveals less negative changes with increasing elevation. Similarly, glacier mass-balance changes positively correlate with the aspect values (r = 0.48, p < 0.05). Several previous studies reported the important role of surface slope in changes in the glacier extent, length and surface elevation (e.g. DeBeer and Sharp, Reference DeBeer and Sharp2009; Garg and others, Reference Garg, Shukla, Tiwari and Jasrotia2017), because of the effect of slope on ice velocity and snow accumulation and transport. However, no statistically significant correlation is found between the glacier mass balance and mean surface slope. We further examine the relationship between the glacier mass-balance changes and morphometric factors at a gridcell scale. In general, the grid with lower elevations experiences larger glacier mass loss. Despite the significance at the confidence of >99%, no strong correlations (r < 0.3) are observed for elevation, surface slope and aspect at the gridcell scale (Figs 5d, e, f).

Fig. 5. The relationship between the glacier mass balance and morphometric factors including mean elevation, aspects and slopes for individual glacier (n = 103) and at gridcell scale (n = 127 922, 97 218). Small slopes in gridcells may be within the uncertainty range of the DEM vertical accuracy. Thus, when calculating correlations at the gridcell scale, we exclude the gridpoints with slope of <10°, which is determined based on a gridcell distance of the 3 × 3 grid of pixels in the DEM and the vertical accuracy of the DEM.
Although debris coverage is an important non-climatic factor that affects glacier mass-balance changes, it is not considered because almost no debris is observed on the glaciers in this study region. The formation and development of proglacial lakes are also linked with glacier melting. Three proglacial lakes are observed on the Landsat 8/OLI images acquired on 16 September 2015, but not occur in the Landsat ETM+ images obtained on 17 September 2001. The average rate of thinning of the three lake-terminating glaciers is 0.68 ± 0.17 m w.e. a−1 for the 2000–2015 period, higher than the regional average. This agrees with the previous estimates of the differences in the surface lowering between land and lake-terminating glaciers (e.g. Neckel and others, Reference Neckel, Loibl and Rankl2017; Wu and others, Reference Wu, Liu, Jiang, Xu and Wei2019).
5.5 Climate forcing
Glacier mass-balance fluctuations are the net result of variations in snowfall, melting and refreezing. For glaciers in high mountain Asia, the contribution of sublimation or refreezing to the temporal variability in glacier mass balance is very limited, compared to those caused by changes in the snowfall and melting (e.g. Huintjes and others, Reference Huintjes2015; Li and others, Reference Li, Yang, Qi and Li2018). Thus, the observed glacier mass loss on the Karlik Range during 1972–2015 may be associated with regional air temperature and precipitation changes. Based on the CRU dataset, a marked warming (0.45°C decade−1, p < 0.05) in the eastern Tien Shan from 1961 to 2014 was reported by Chen and others (Reference Chen, Li, Deng, Fang and Li2016). Records from Yiwu (32 km to the northeast of Karlik Range, at an elevation of 1729 m a.s.l.) and Hami (84 km to the southwest of Karlik Range, at an elevation of 738 m a.s.l.) meteorological stations (Fig. 1) show a significant warming during 1972–2015, with an increase in the summer mean temperature of 0.11°C decade−1 (p < 0.05) at Hami Station and 0.33°C decade−1 (p < 0.05) at Yiwu Station (Fig. 6a), respectively. The annual mean temperatures at the three hydrometric stations (Yushugou, Toudaogou and Baiji Stations) also experienced dramatic increases (0.79, 0.58 and 1.28°C decade−1) during the past 30 years (Fig. S2). Furthermore, a more rapid warming (0.86°C decade−1) is found during the summer at the Yushugou hydrometric station (Fig. S3).
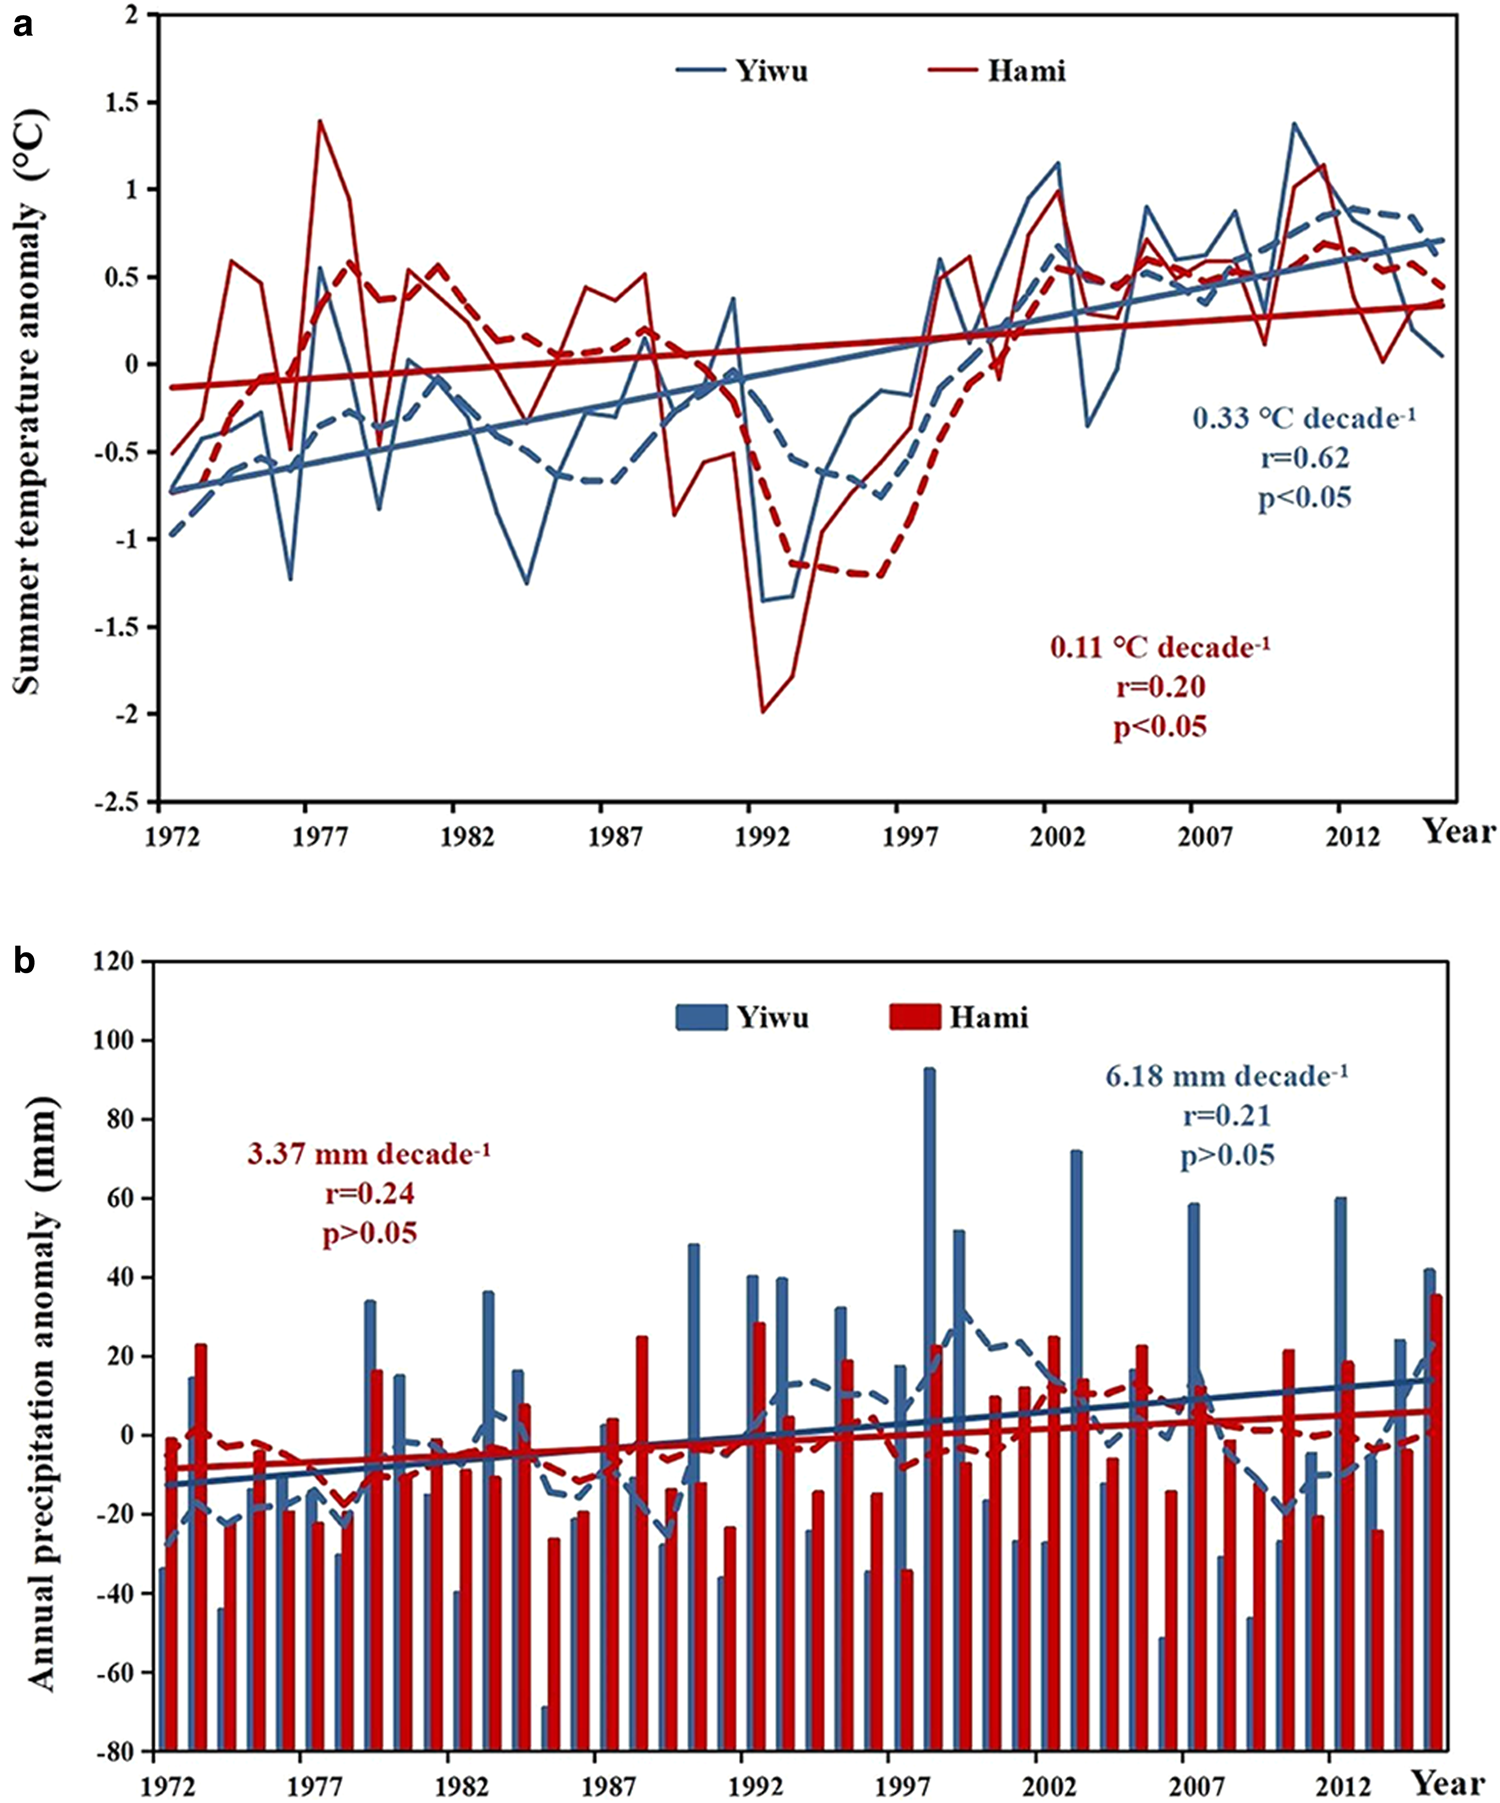
Fig. 6. Time series of (a) summer air temperature and (b) annual precipitation from Yiwu and Hami meteorological stations, which are located 32 and 84 km from Karlik Range, respectively. The series are shown as anomalies relative to their respective 1981–2010 averages.
There are slight increases but insignificant trends in annual precipitation records for the 1972–2015 period at the Yiwu (6.18 mm decade−1, p > 0.05) and Hami (3.37 mm decade−1, p > 0.05) stations (Fig. 6b). No significant trends (p > 0.05) are observed at the three hydrometric stations (0.74 mm decade−1 at Yushugou Station, 4.10 mm decade−1 at Toudaogou Station and 1.20 mm decade−1 at Baiji Station) during the 1970s to 2007 (Fig. S4). In the eastern Tien Shan, the snowfall portion of total annual precipitation declined during the past 50 years (Guo and Li, Reference Guo and Li2015; Chen and others, Reference Chen, Li, Deng, Fang and Li2016). These records appear to indicate that snowfall in this study region likely decreased during 1972–2015. Furthermore, glaciers over Tien Shan are considered to be much more sensitive to air temperature variability than snow accumulation (Oerlemans and others, Reference Oerlemans and Fortuin1992; Rupper and Roe, Reference Rupper and Roe2008; Farinotti and others, Reference Farinotti2015). For example, on Glacier No. 1 (43°06′ N, 86°49′ E) at Urumqi River head over the eastern Tien Shan, when the air temperature increased by 1°C, the glacier ELA would rise by >80 m, which requires a >40% increase in precipitation to offset the glacial ablation caused by temperature increase (Liu and others, Reference Liu, Xie, Wang and Ye1999). Thus, a slight increase in the annual precipitation in this region contributes little to glacier or snow accumulation; thus, the insignificant increase in precipitation is unable to offset the glacial ablation caused by a significant increase in air temperature.
The N-facing glaciers mass loss was much larger than that of the S-facing glaciers from 1972 to 2000, which is possibly related to variations in the regional summer temperatures. Records from the Yiwu Weather Station on the north slope of Karlik Range show a warming trend (0.16°C decade−1) in the summer air temperature, but a cooling trend (−0.30°C decade−1) occurs at the Hami Weather Station on the south slope during 1972–2000. During the same period, only a slight increase in annual precipitation is found at the two stations (Fig. 6). This probably contributes to very limited increase in accumulation of the glaciers. However, different summer temperature changes may cause more ablation on the N-facing glaciers than on S-facing glaciers.
A doubling of glacier mass loss during 2000–2015 compared to 1972–2000 may be related to the recorded mean summer air temperatures, which are 0.62 and 0.94°C warmer for 2000–2015 than those in 1972–2000 at the Hami and Yiwu Stations, respectively, as a result of the dramatic warming during the past 40 years. Assuming a similar sensitivity of glaciers in this study to variability in the air temperature as was observed for the sensitivity of Glacier No. 1 at Urumqi River head, the averaged ELA of the glaciers on the Karlik Range should have risen by at least 40 m. To offset glacial melting resulting from increased temperature, annual precipitation must increase by >50%. Five year smoothing averages of the anomalies of annual precipitation show slight increases between 1972 and the mid-1990s, but decreases in the annual precipitation since the late 1990s are observed at the two weather stations (Fig. 6). A decline in the snow cover extent is found from 2003 to 2014 in this region (Chen and others, Reference Chen, Li, Deng, Fang and Li2016). Under such climate conditions, the icefield experiences more melting rather than accumulation. As a consequence, glaciers generally show higher thinning rates at the ablation zones during 2000–2015, compared with those in 1972–2000 (Fig. 2). The larger extent of surface lowering over 2000–2015 are observed, relative to 1972–2000 (Fig. 2). However, meteorological and glacial observations over the glacier field are still required to improve atmospheric and glacier energy-balance models to further quantify the response of glacier melting to climate changes. To address this, one automatic weather station will be established on Yushugou No. 6 glacier, and more glacial observations, such as ice thickness, ice velocity and stake-based mass balance, will be performed at the Tianshan Glaciological Station, Chinese Academy of Sciences (personal communication from Puyu Wang), due to the easy access to this glacier.
6. Conclusions
In this study, topographic maps, SRTM DEMs and ASTER DEMs are used to examine variability in the mass balances of glaciers in the Karlik Range over the past 40 years. These changes are spatially and temporally heterogeneous. More negative mass balance occurs at lower elevations. Compared to south facing glaciers, north facing glaciers experience larger mass losses during 1972–2000, but lower mass losses for the 2000–2015 period. On average, a negative glacier mass balance (−0.26 ± 0.06 m w.e. a−1) is found for the period 1972–2015, as the result of glacier extent shrinkage and surface lowering. In particular, the average rate of glacier mass loss during 2000–2015 is twice that estimated for the 1972–2000 interval. The accelerated glacier mass loss for the more recent interval is coincident with increased air temperatures measured at meteorological stations in the region since the late 1990s, whereas the decline in annual precipitation measured at hydrometric stations was not significant since the late 1990s.
The uncertainties in our glacier mass-balance estimate remain relatively large, accounting for ~35 and 41% mass loss changes in the two time spans of 1972–2000 and 2000–2015, respectively. The main source of uncertainties is the noise inherent in DEMs constructed by topographic maps, SRTM observations and ASTER images. In addition, the penetration depth of the X-band SRTM is not considered, and this likely increases the uncertainties of the glacier mass loss assessment. Other studies of glacier mass balance based on remotely sensed DEMs usually also suffer from considerable noise/uncertainty (e.g. Pieczonka and Bolch, Reference Pieczonka and Bolch2015; Braun and others, Reference Braun2019). Consequently, at this time, we cannot effectively separate regional differences in glacier mass changes from their uncertainty bounds.
Supplementary material
The supplementary material for this article can be found at https://doi.org/10.1017/jog.2020.76.
Acknowledgements
This work was supported by the National Natural Science Foundation of China (41971081 and 41830644), the Project for Outstanding Youth Innovation Team in the Universities of Shandong Province (2019KJH011), the Strategic Priority Research Program of the Chinese Academy of Sciences (XAD19070103) and the Outstanding Youth Fund of Shandong Provincial Universities (ZR2016JL030). We thank the two anonymous reviewers, Hester Jiskoot (Chief editor) and Dan Shugar (Scientific editor) for their comments and suggestions to improve this paper. The glacier elevation change data for the 1972–2000, 2000–2015 and 1972–2015 periods are available in the Supporting information (dataset).


 Open access