Evaluating the Effect of pH, Temperature, and Hydraulic Retention Time on Biological Sulphate Reduction Using Response Surface Methodology


Abstract
:1. Introduction
2. Materials and Methods
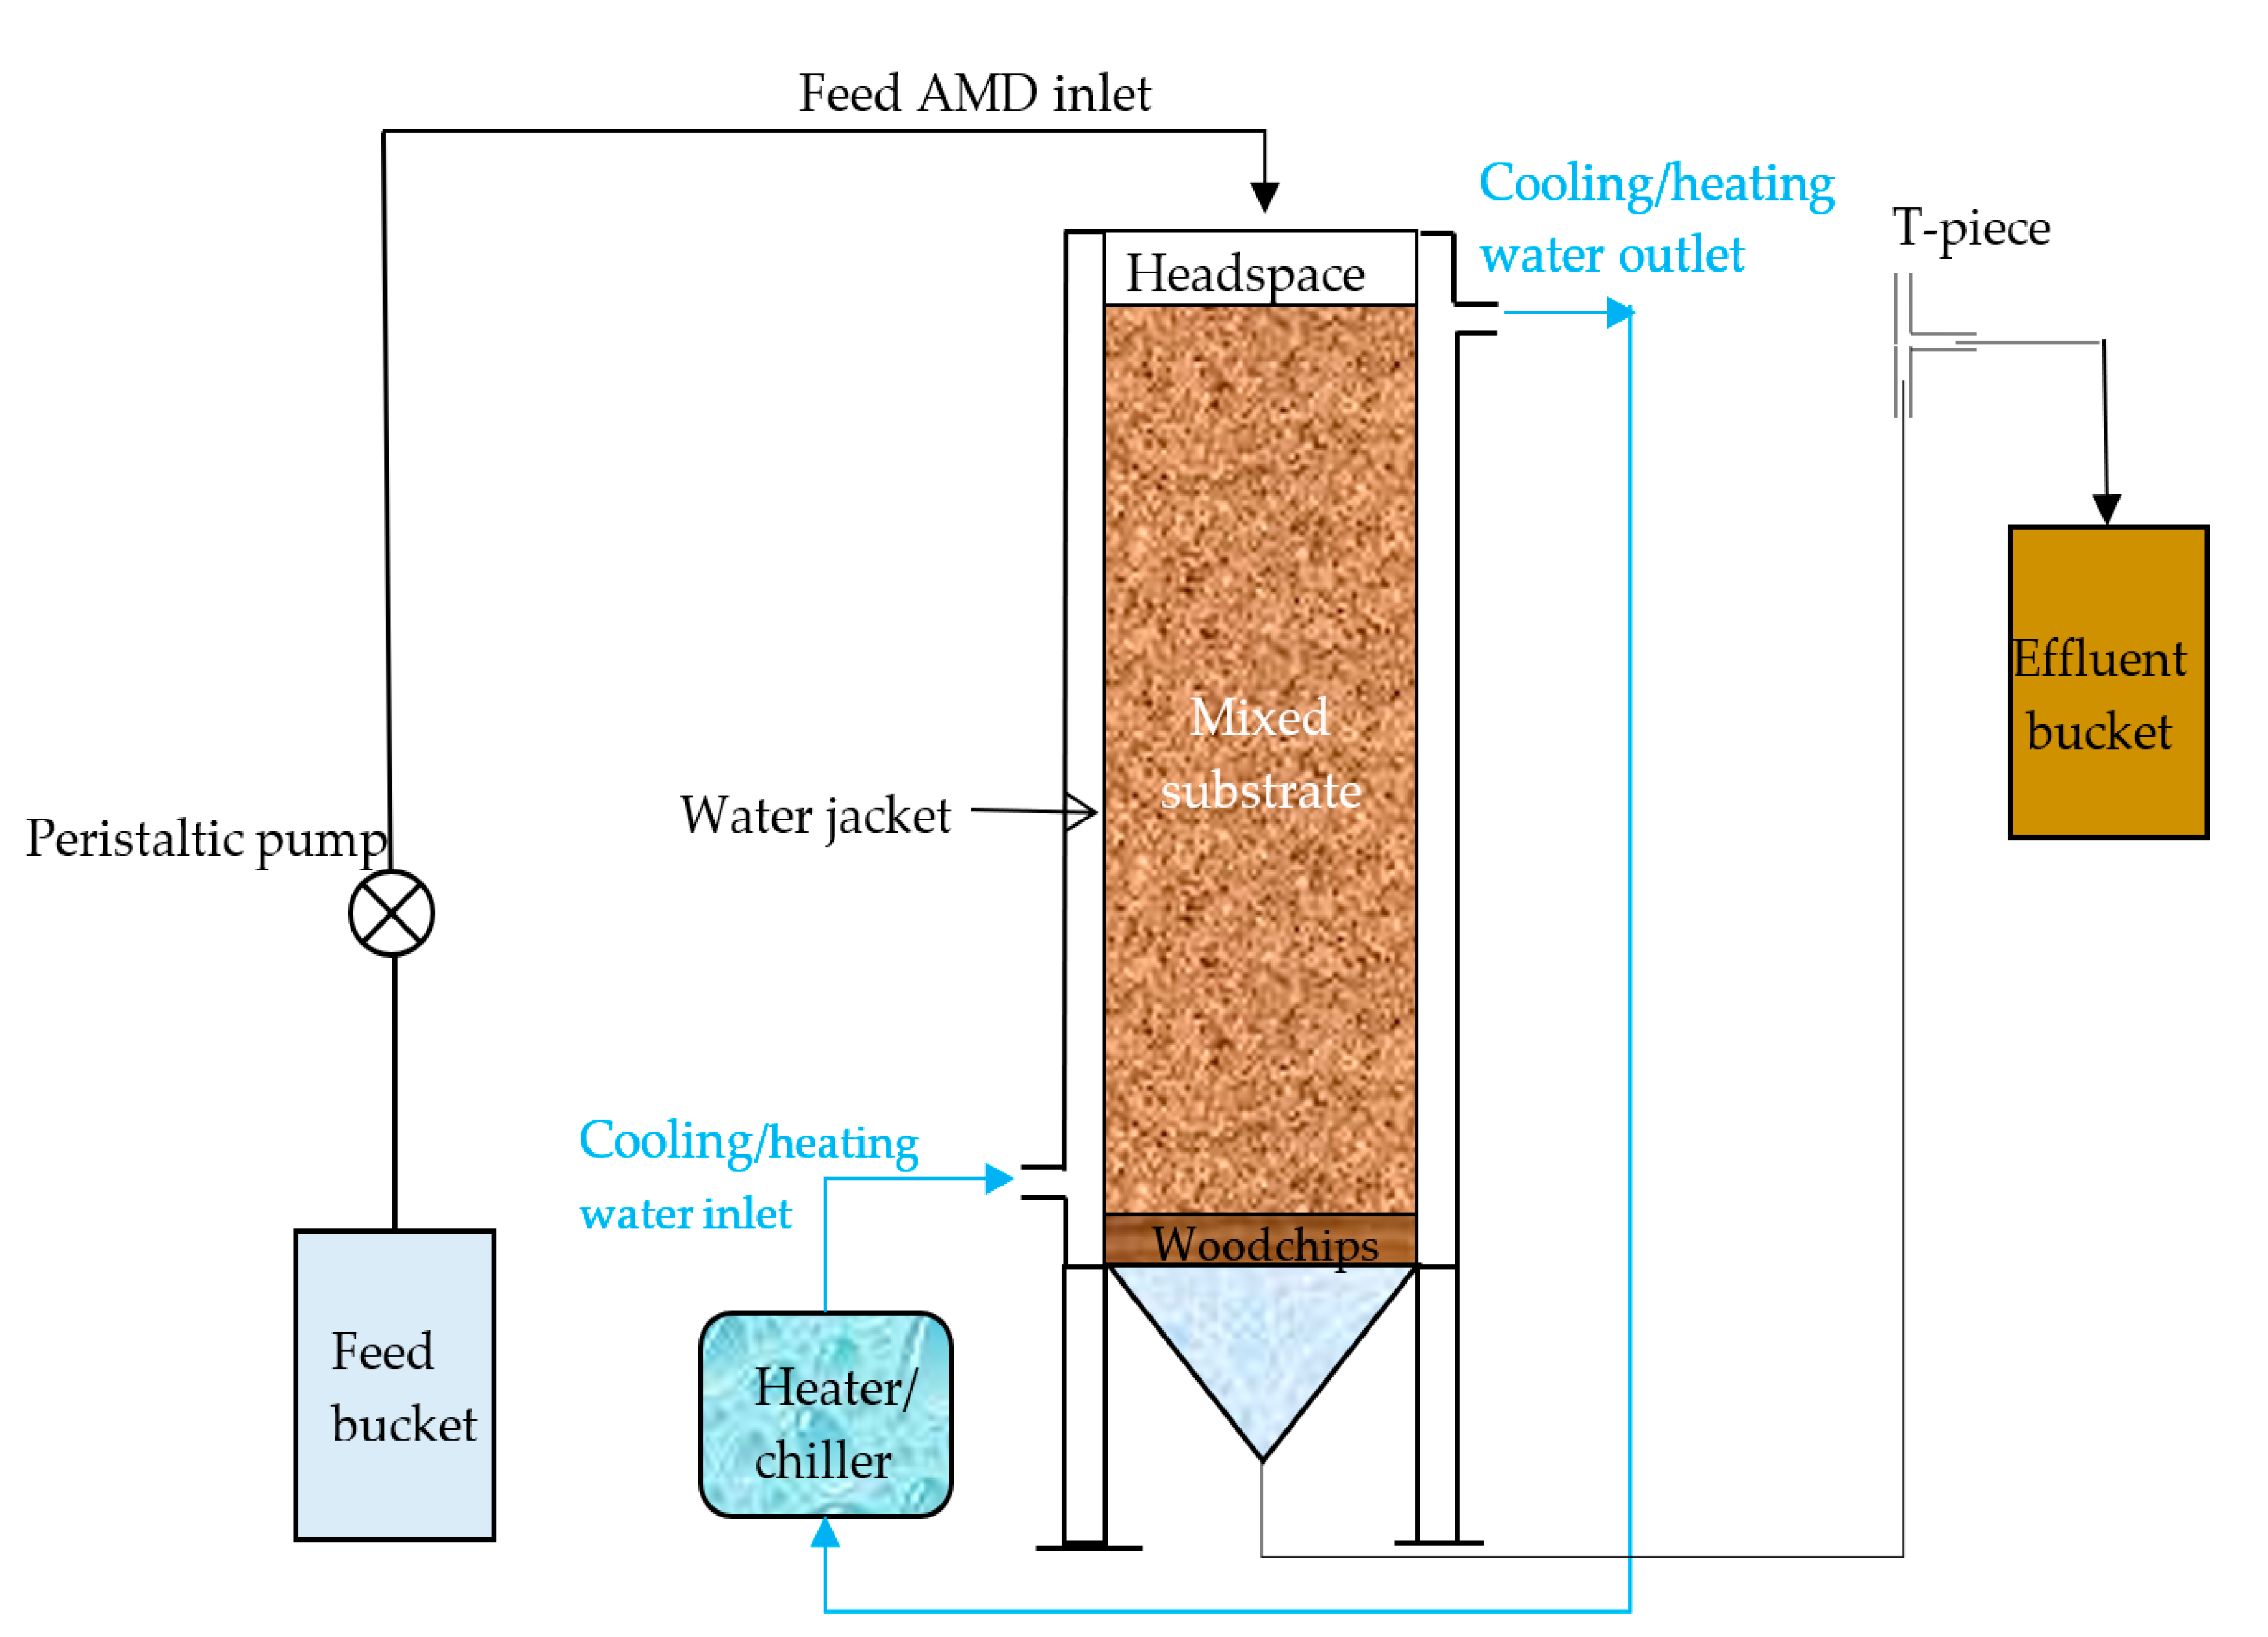
2.1. Reactor Set-Up
2.2. Substrates
2.3. AMD and Inoculum
2.4. Sampling and Analysis
2.5. Experimental Design
2.6. Statistical Analysis
3. Results and Discussion
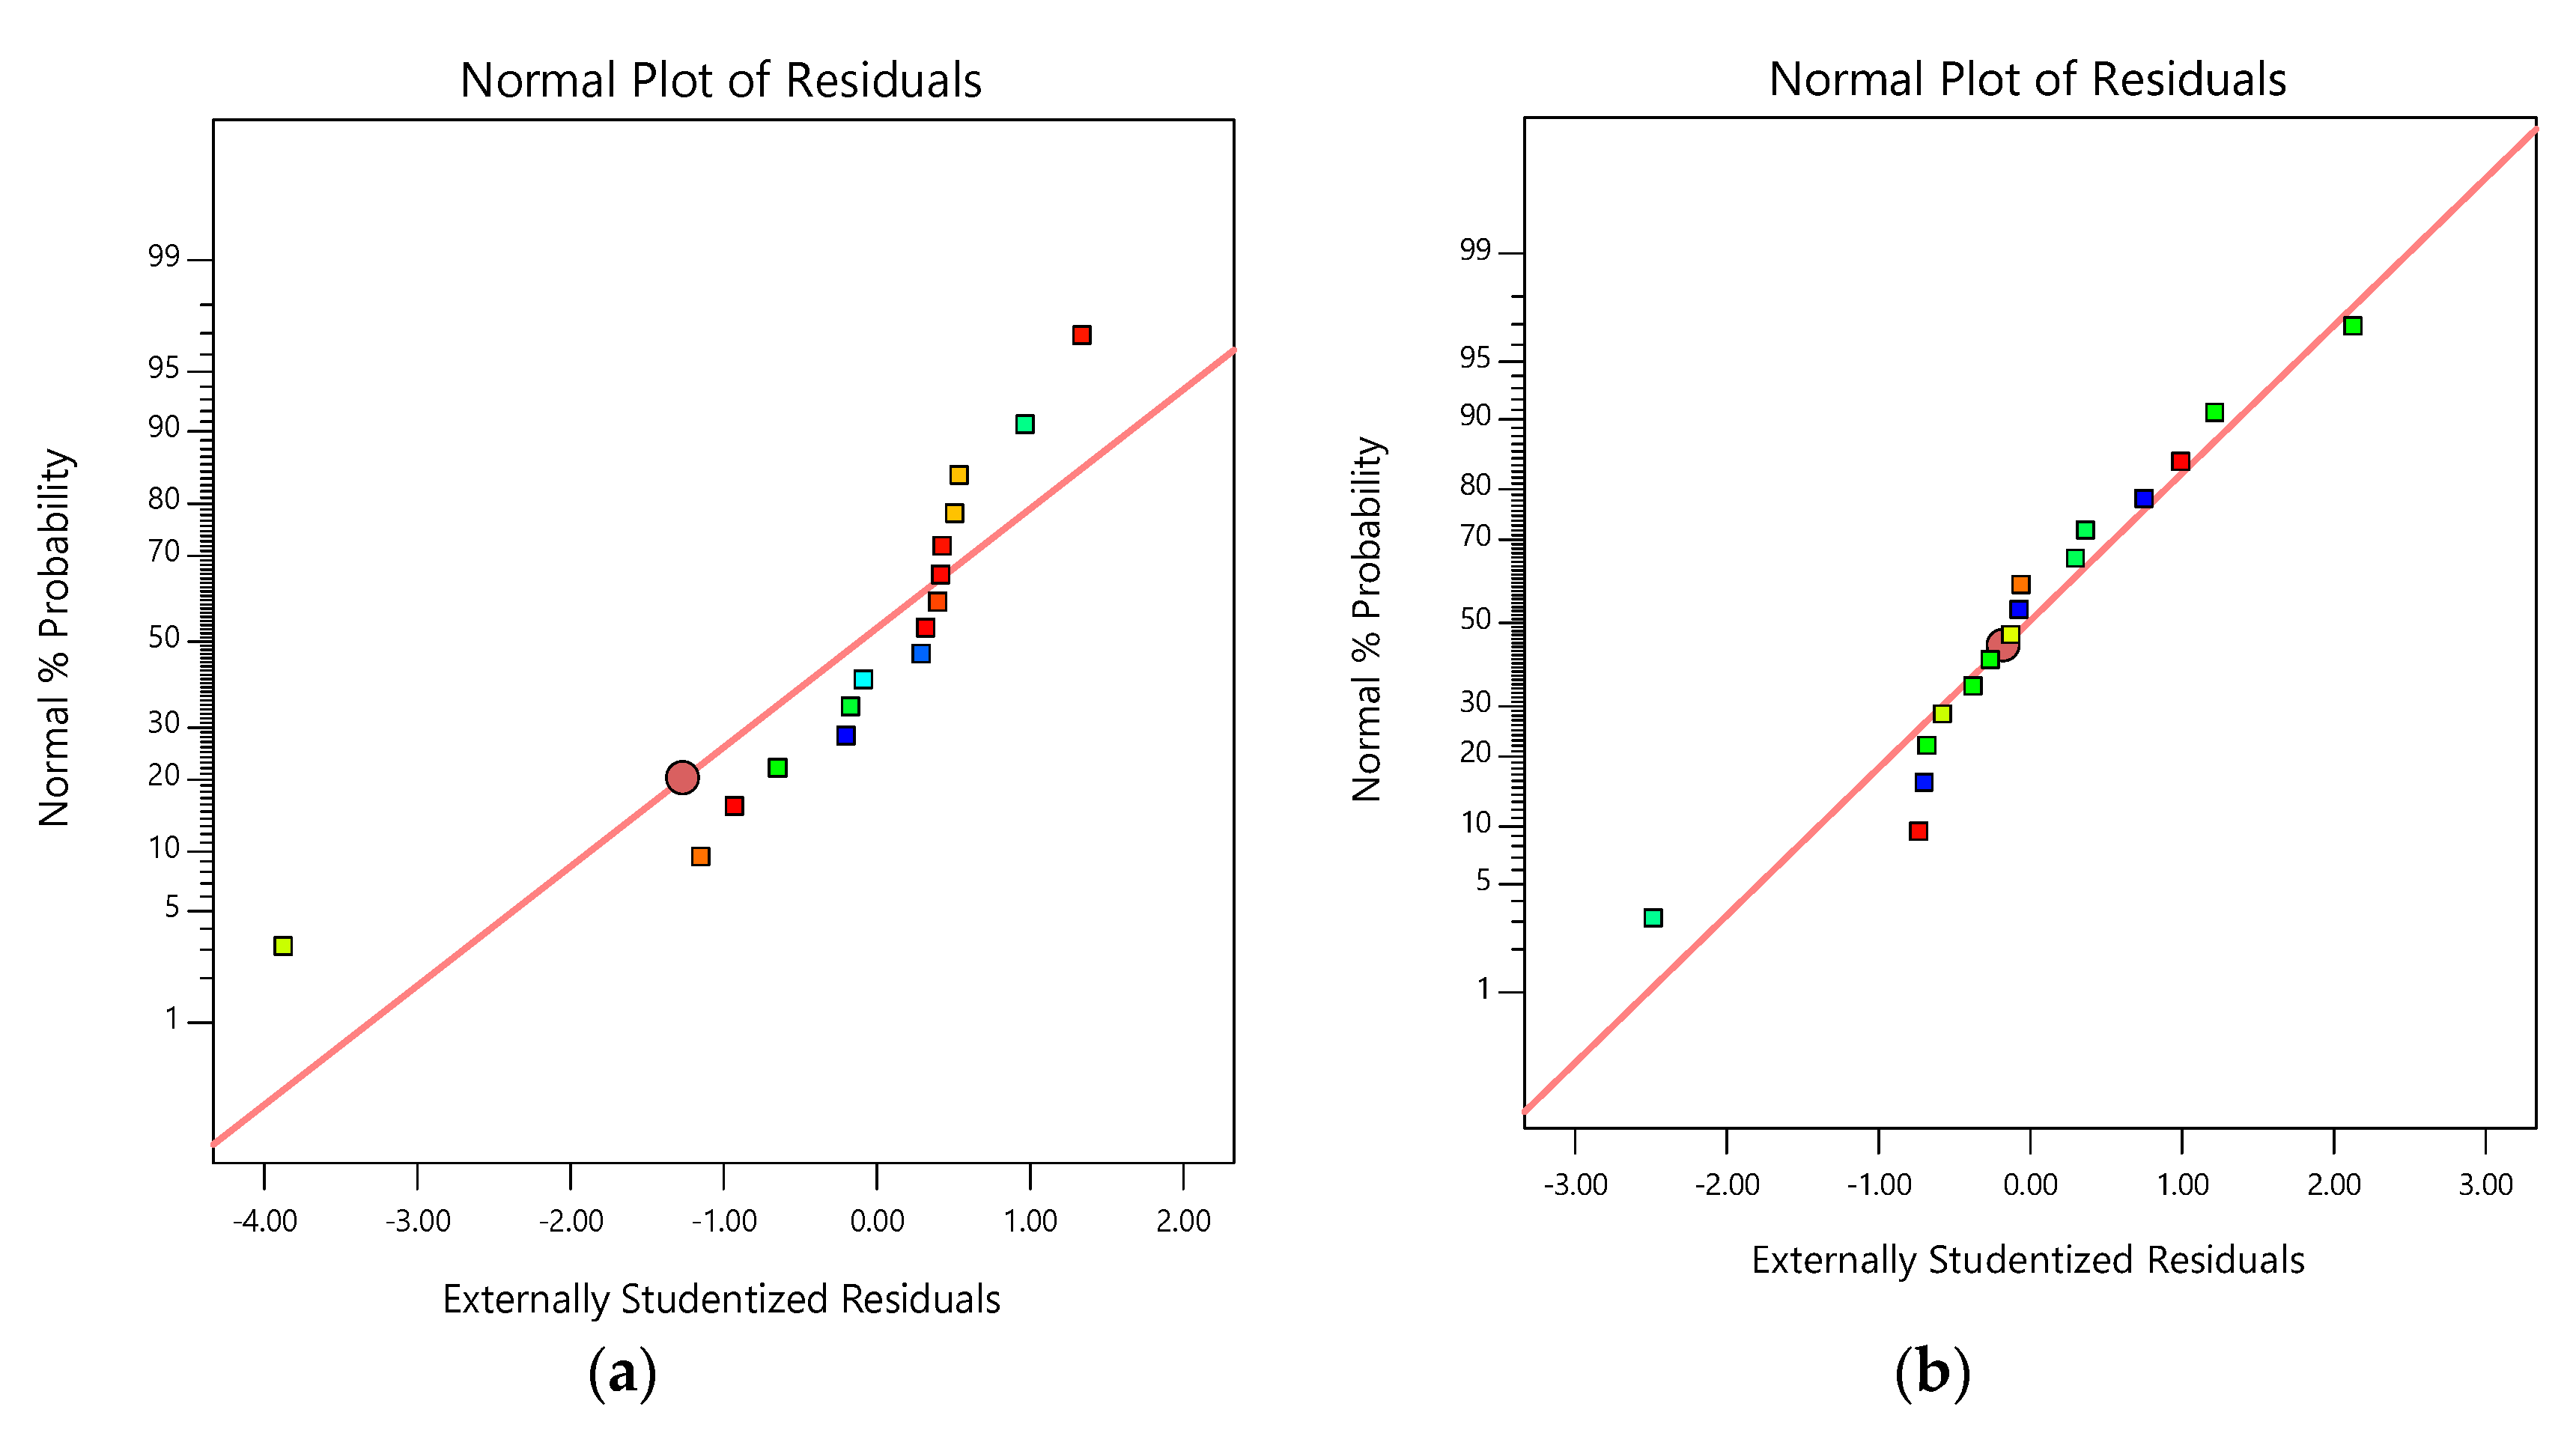
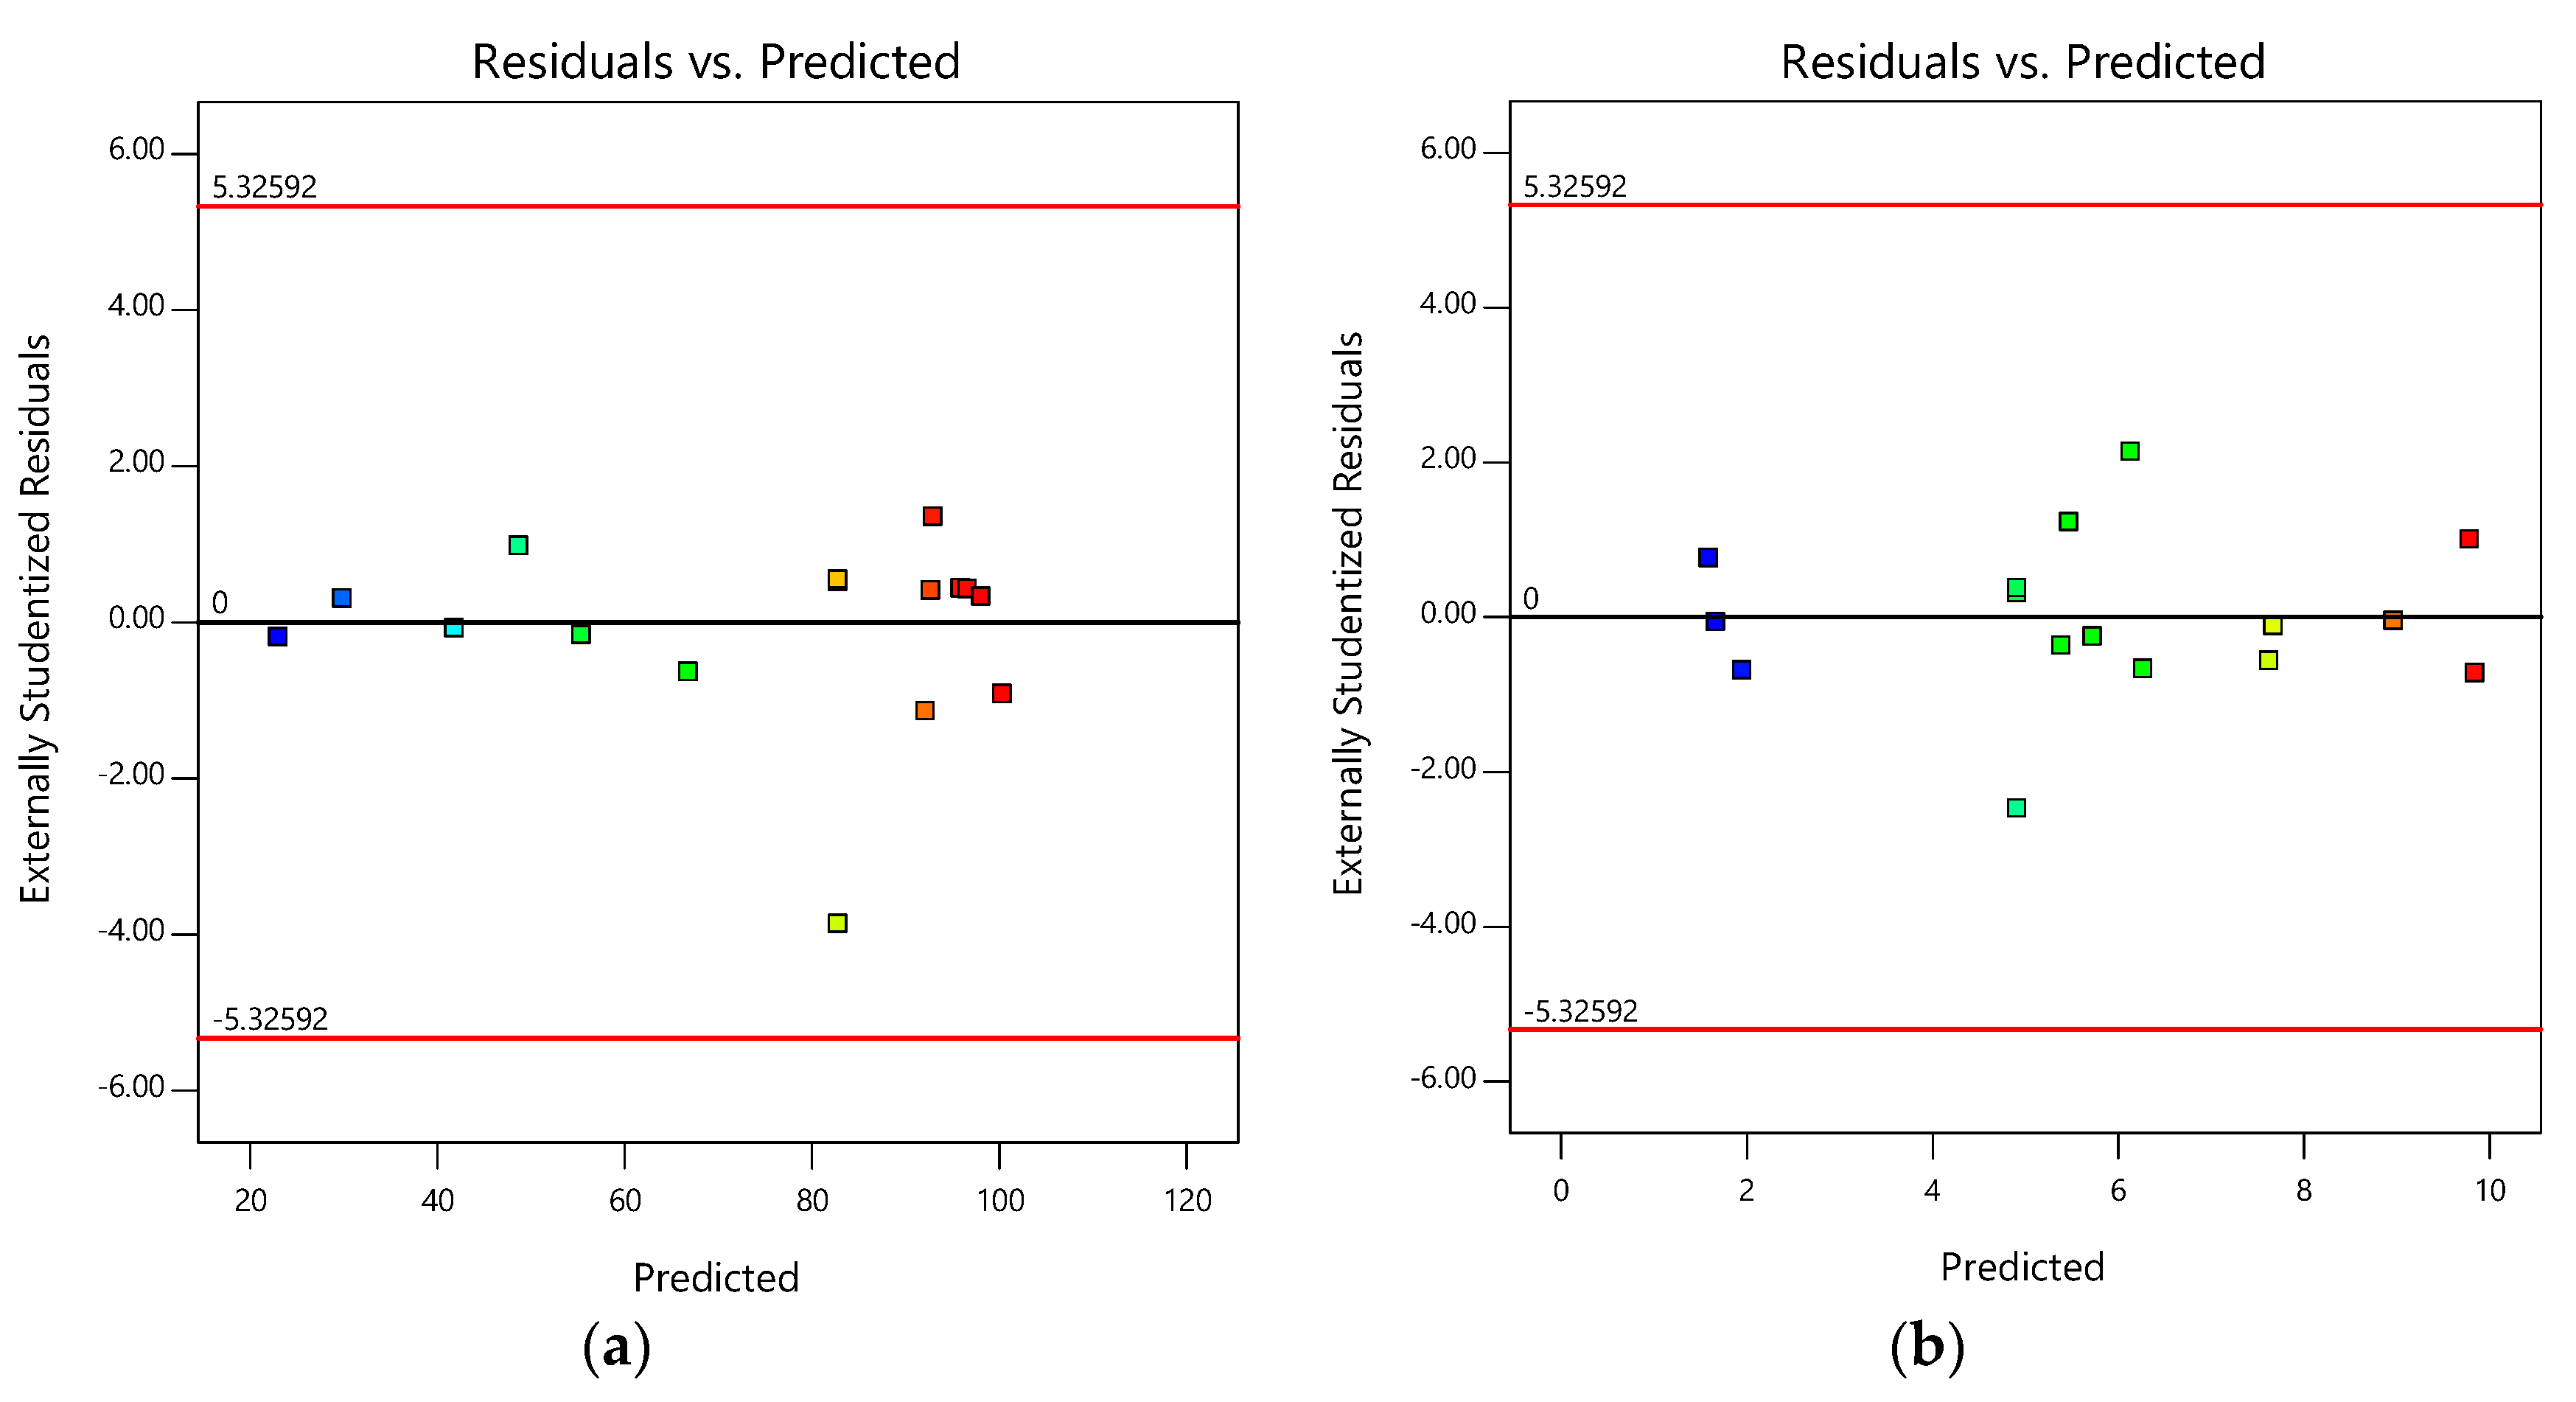
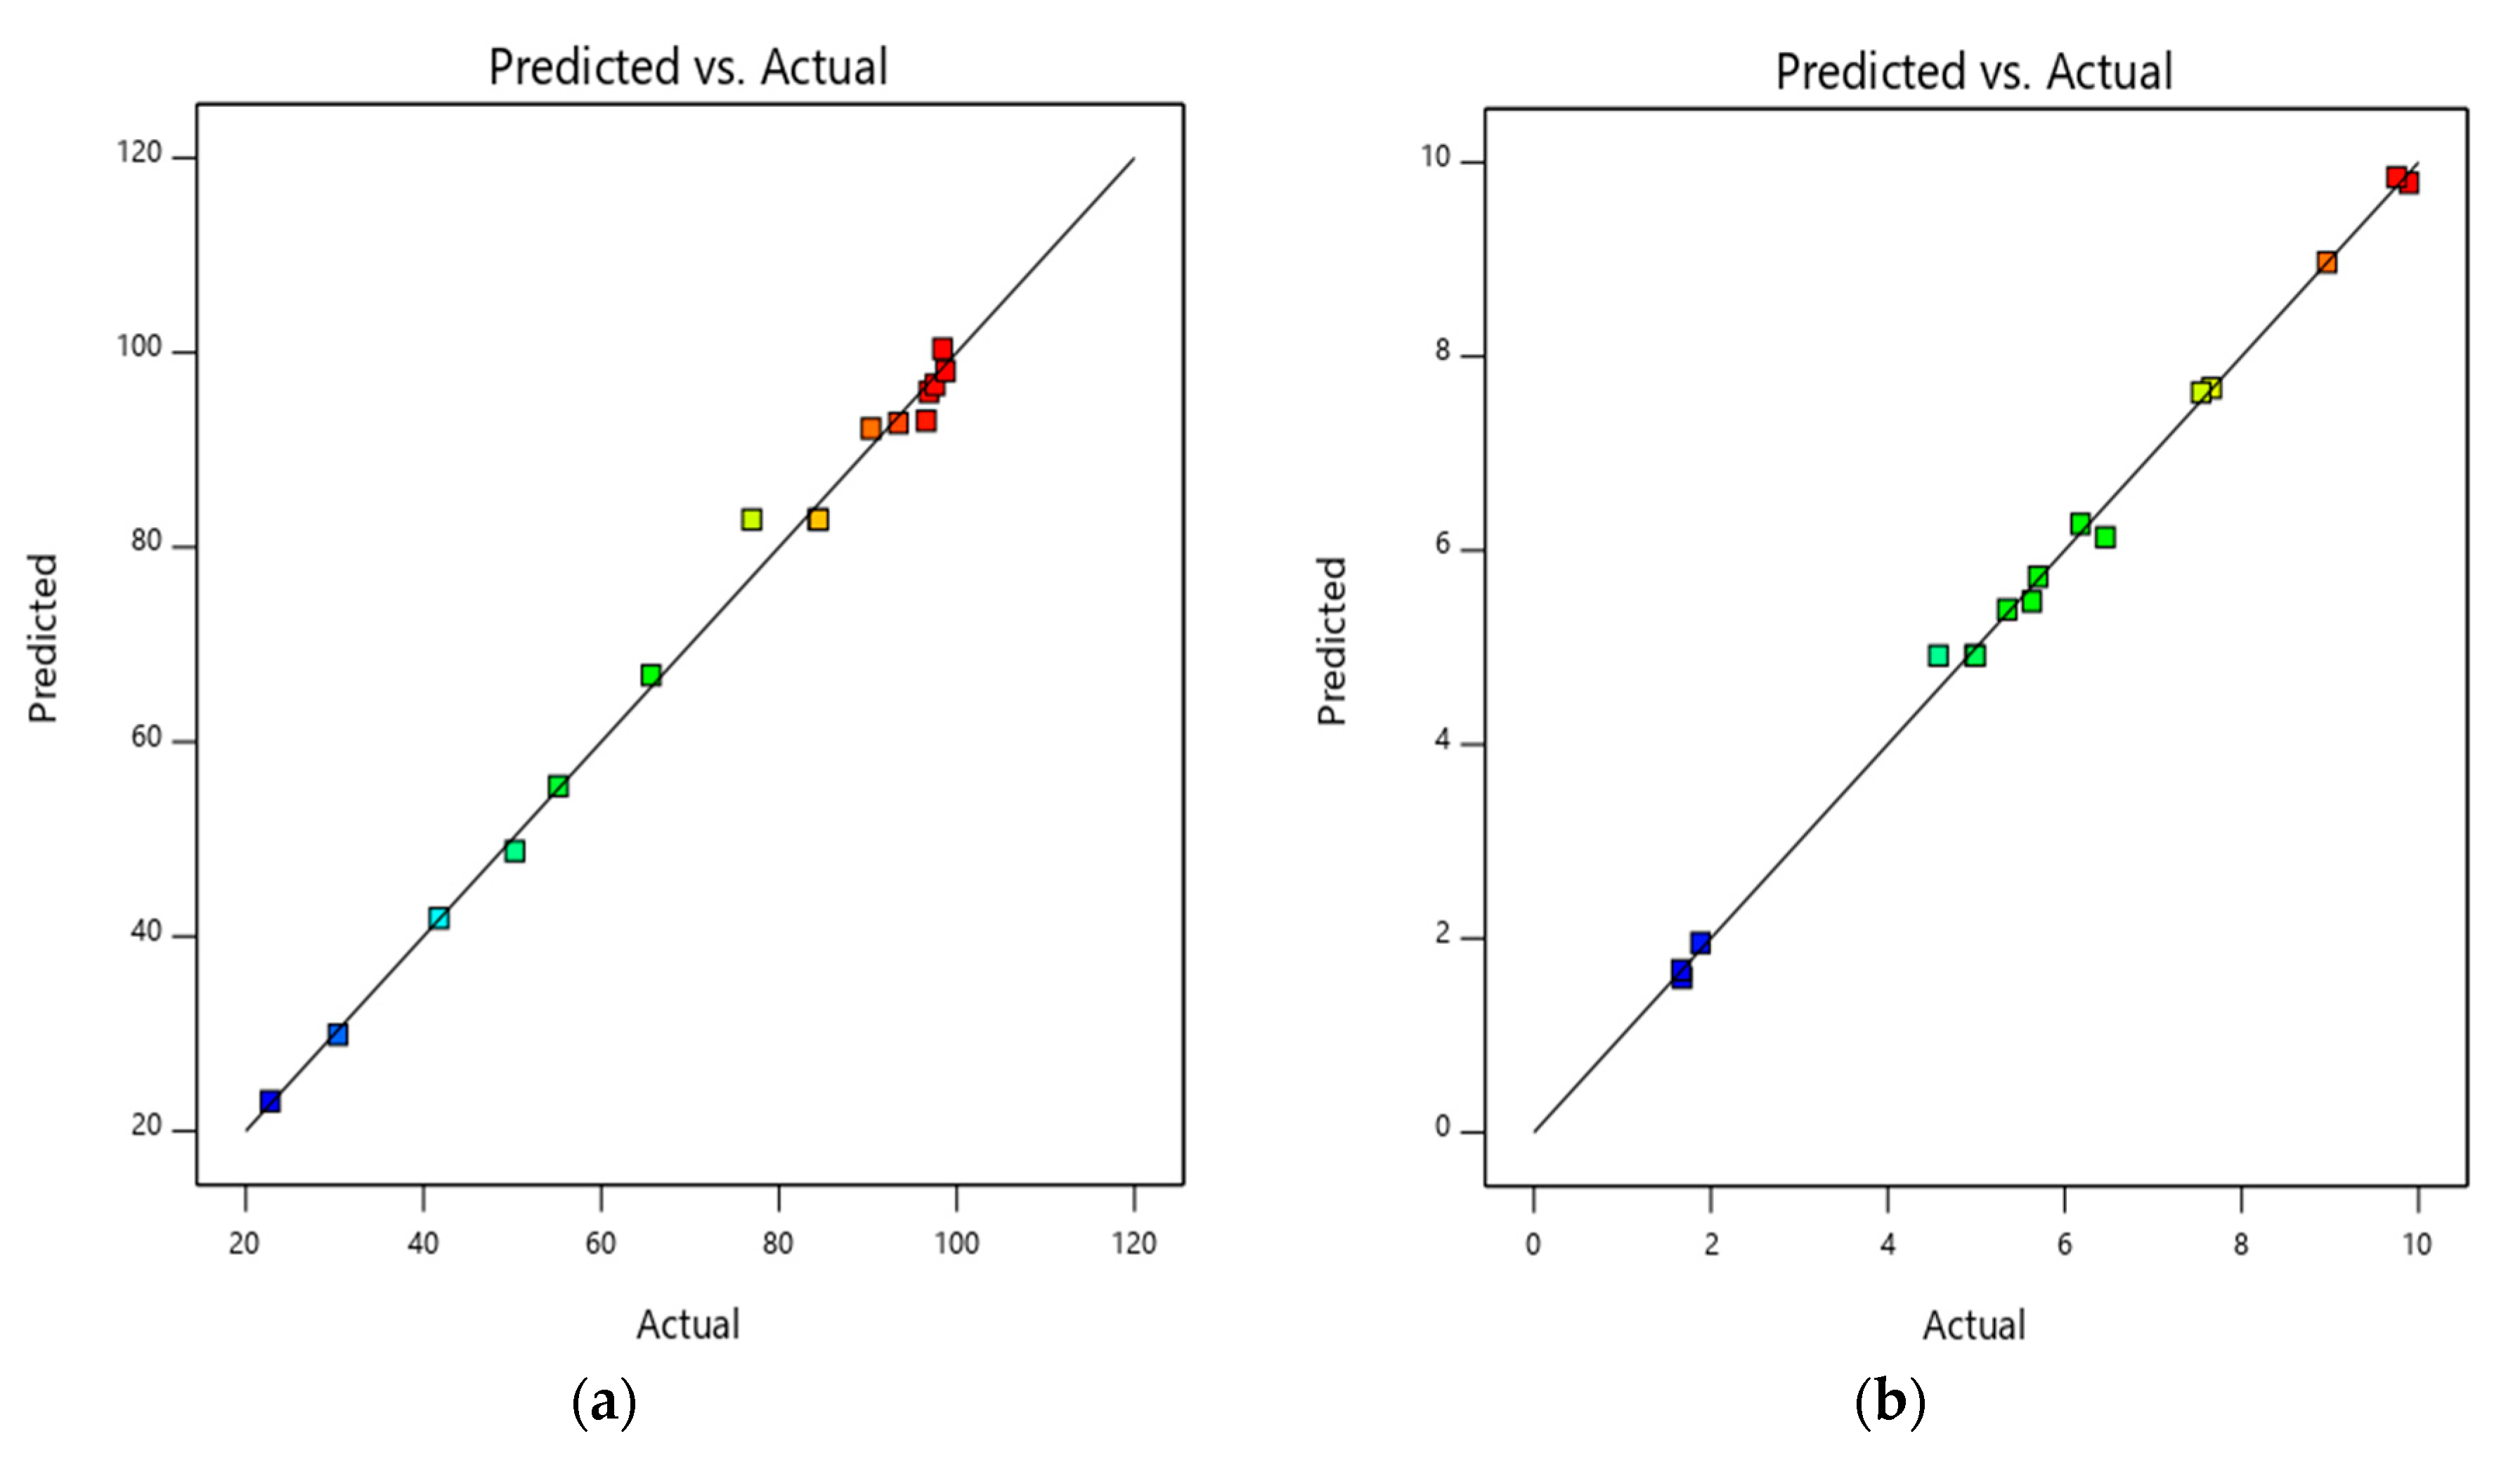
3.1. Statistical Analysis
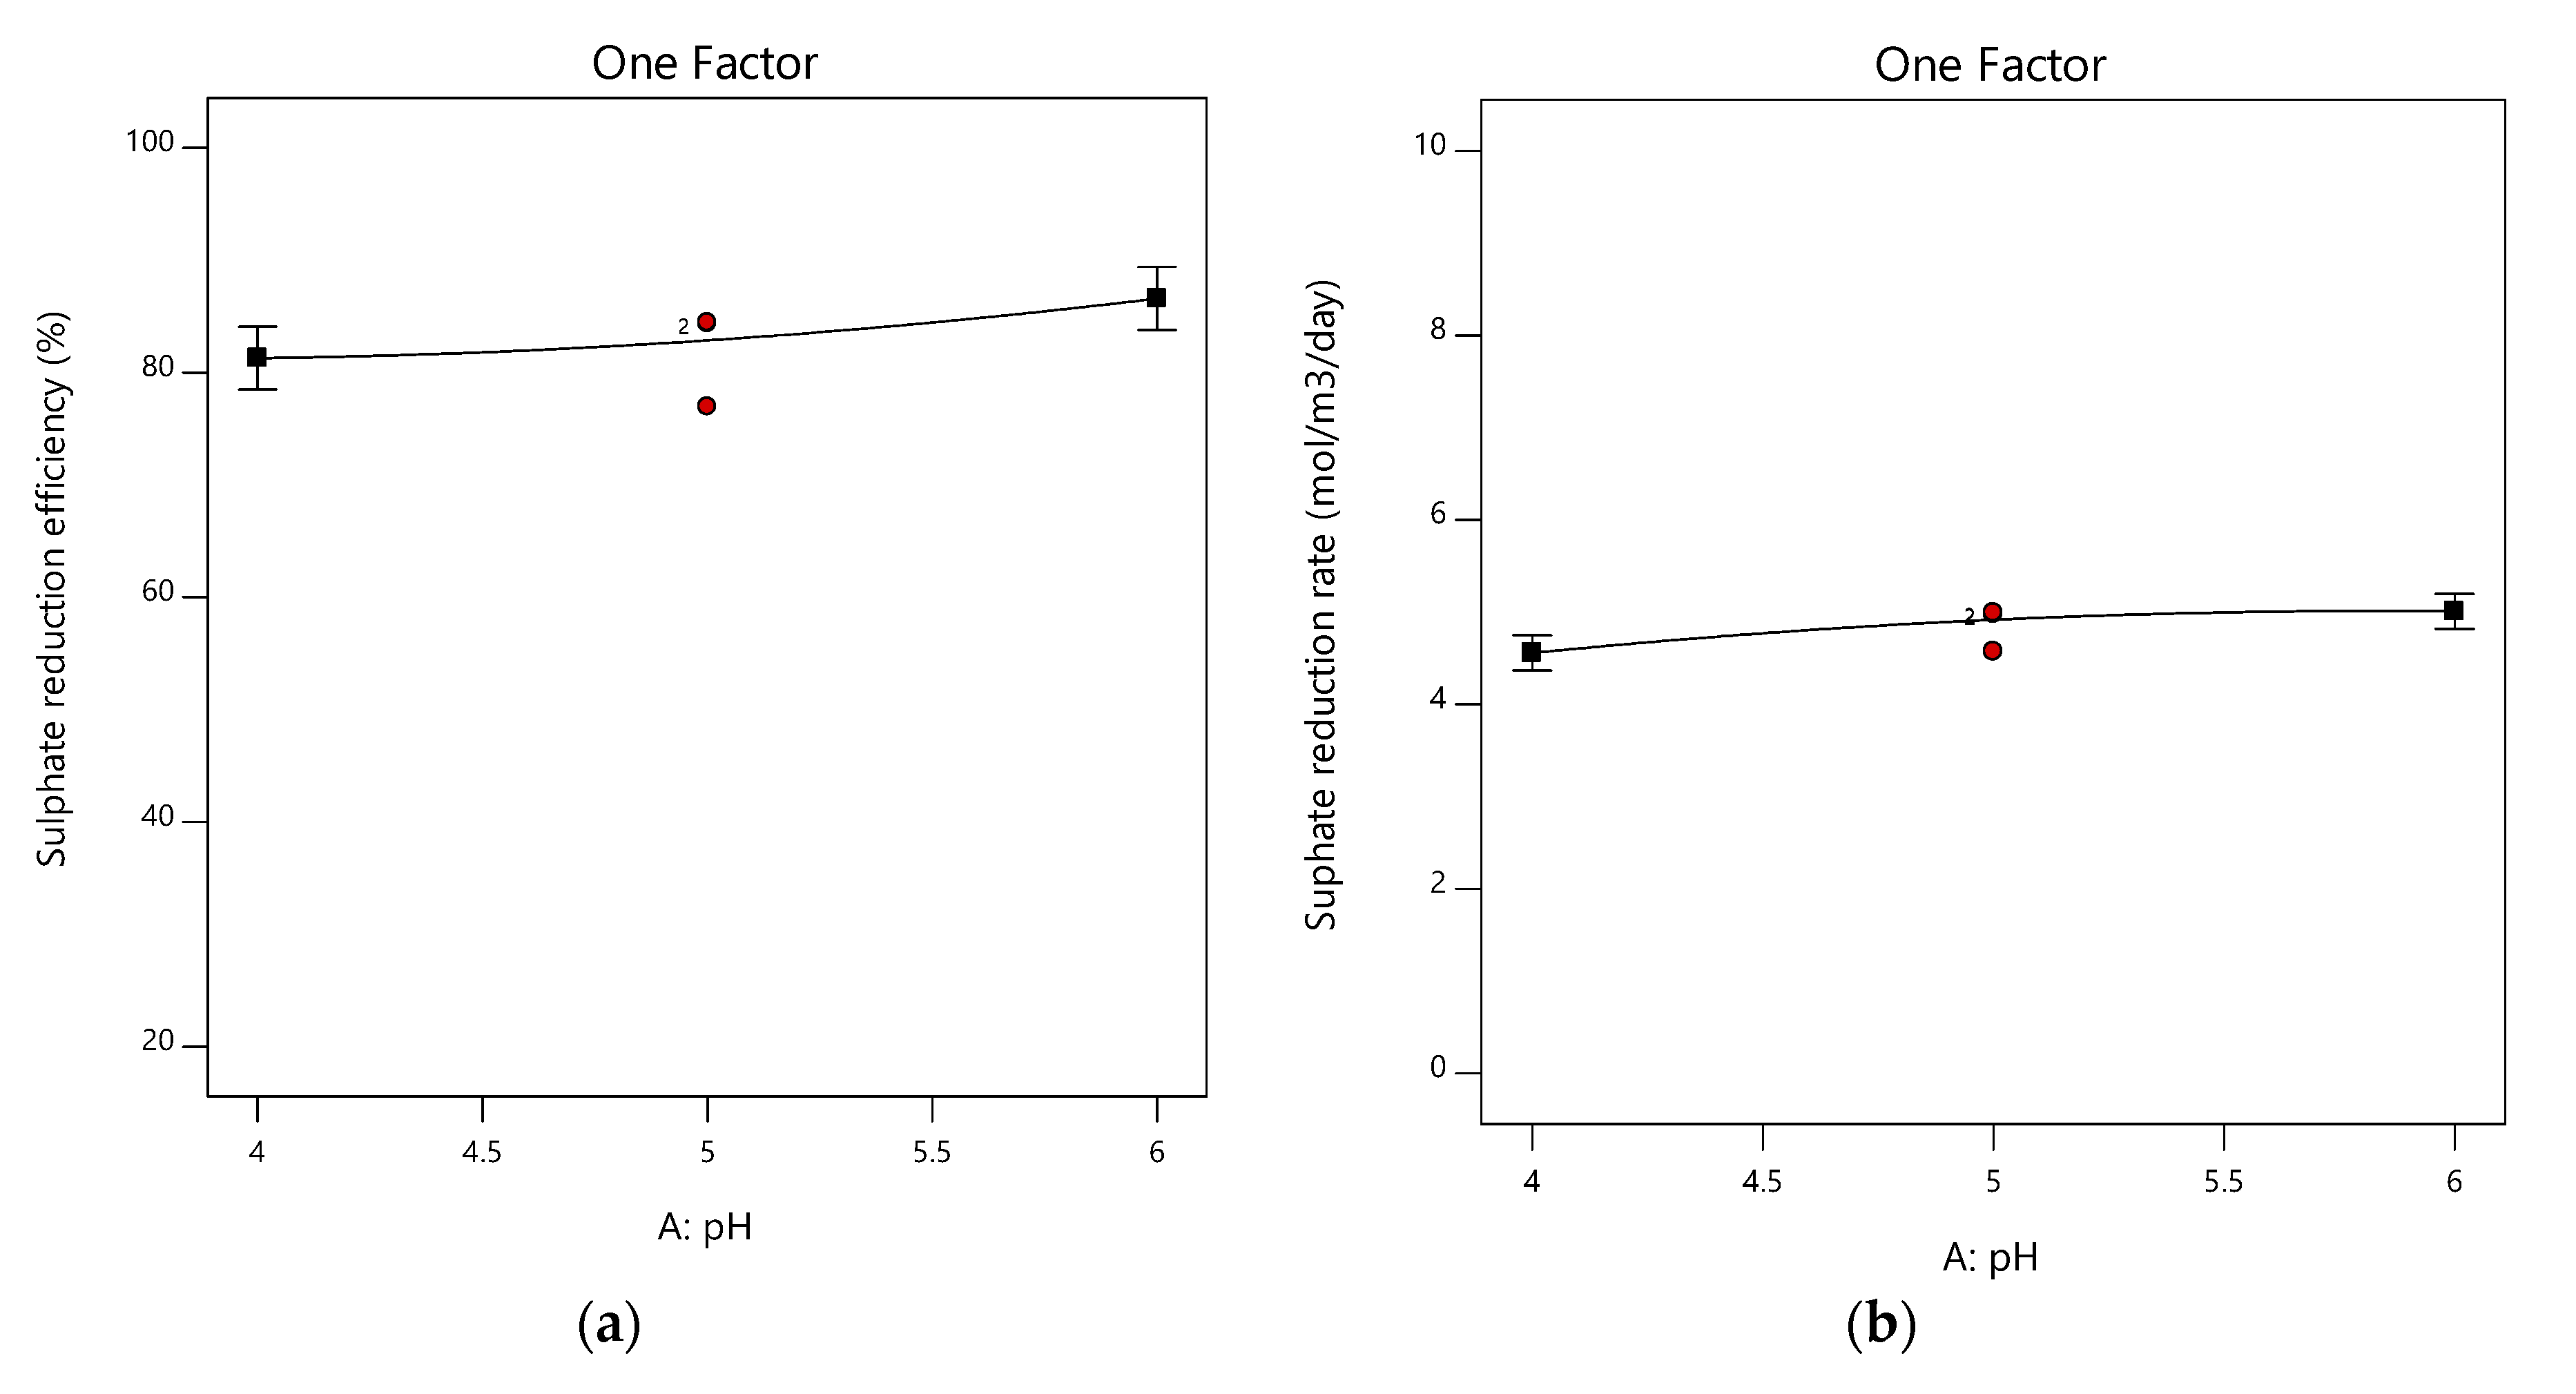
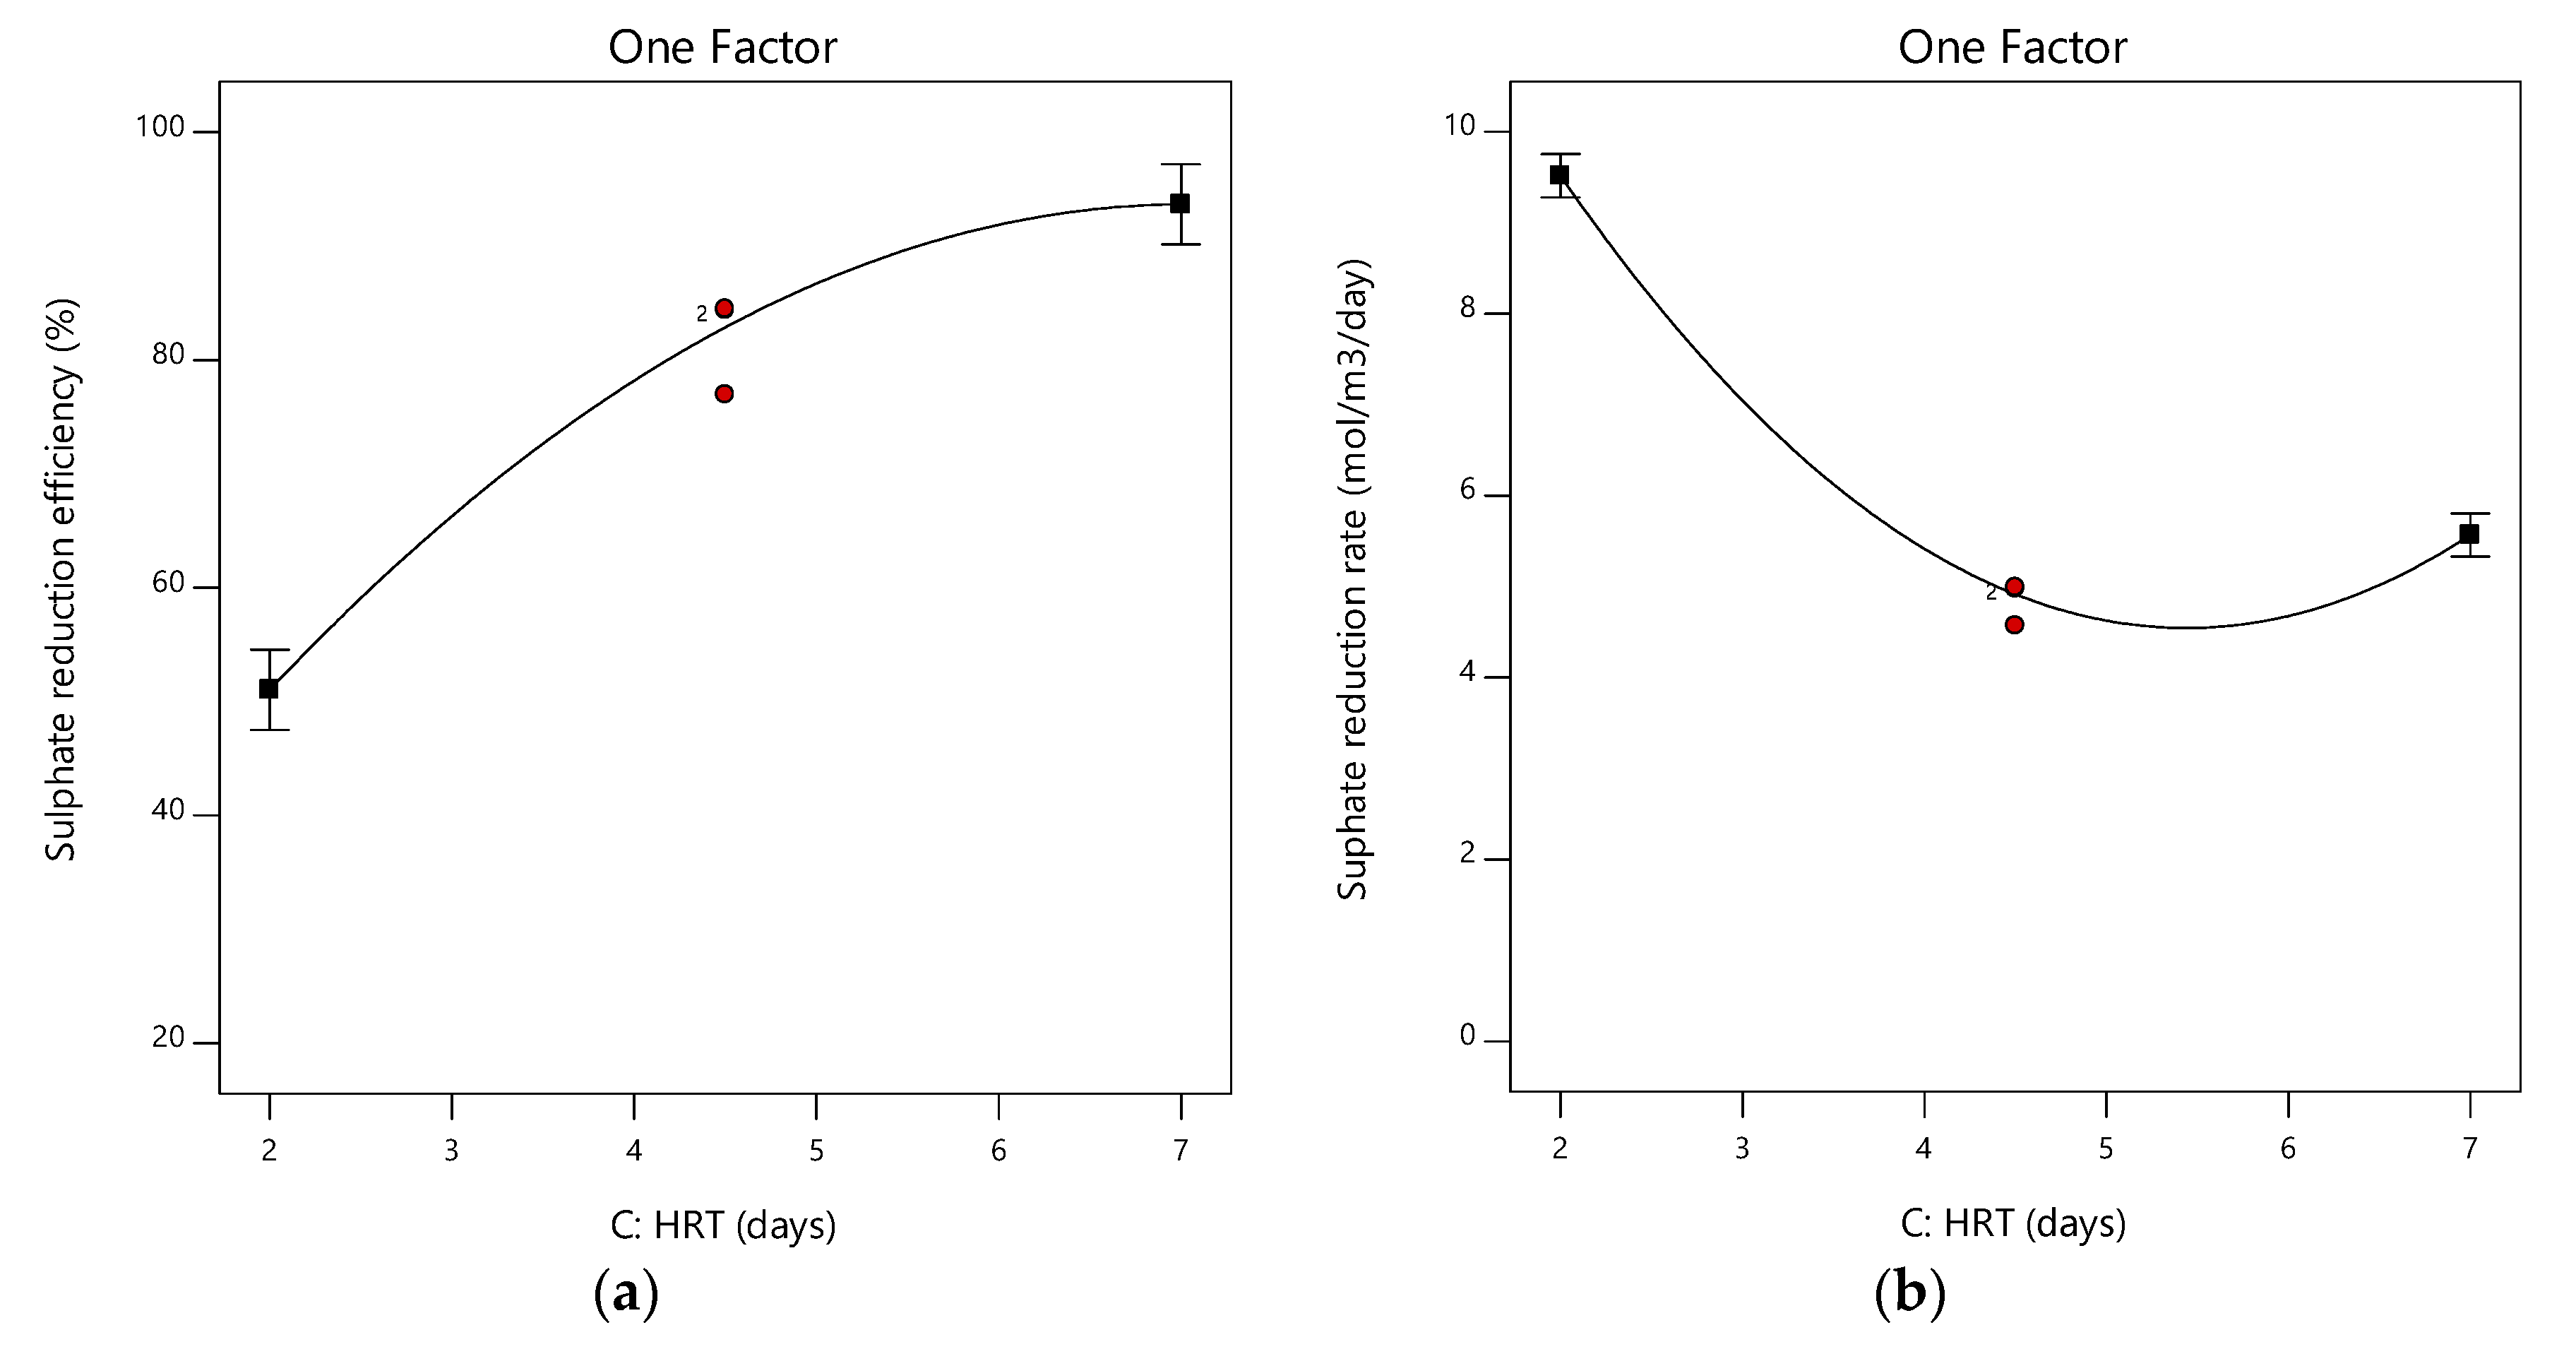
3.2. Effect of Individual Factors
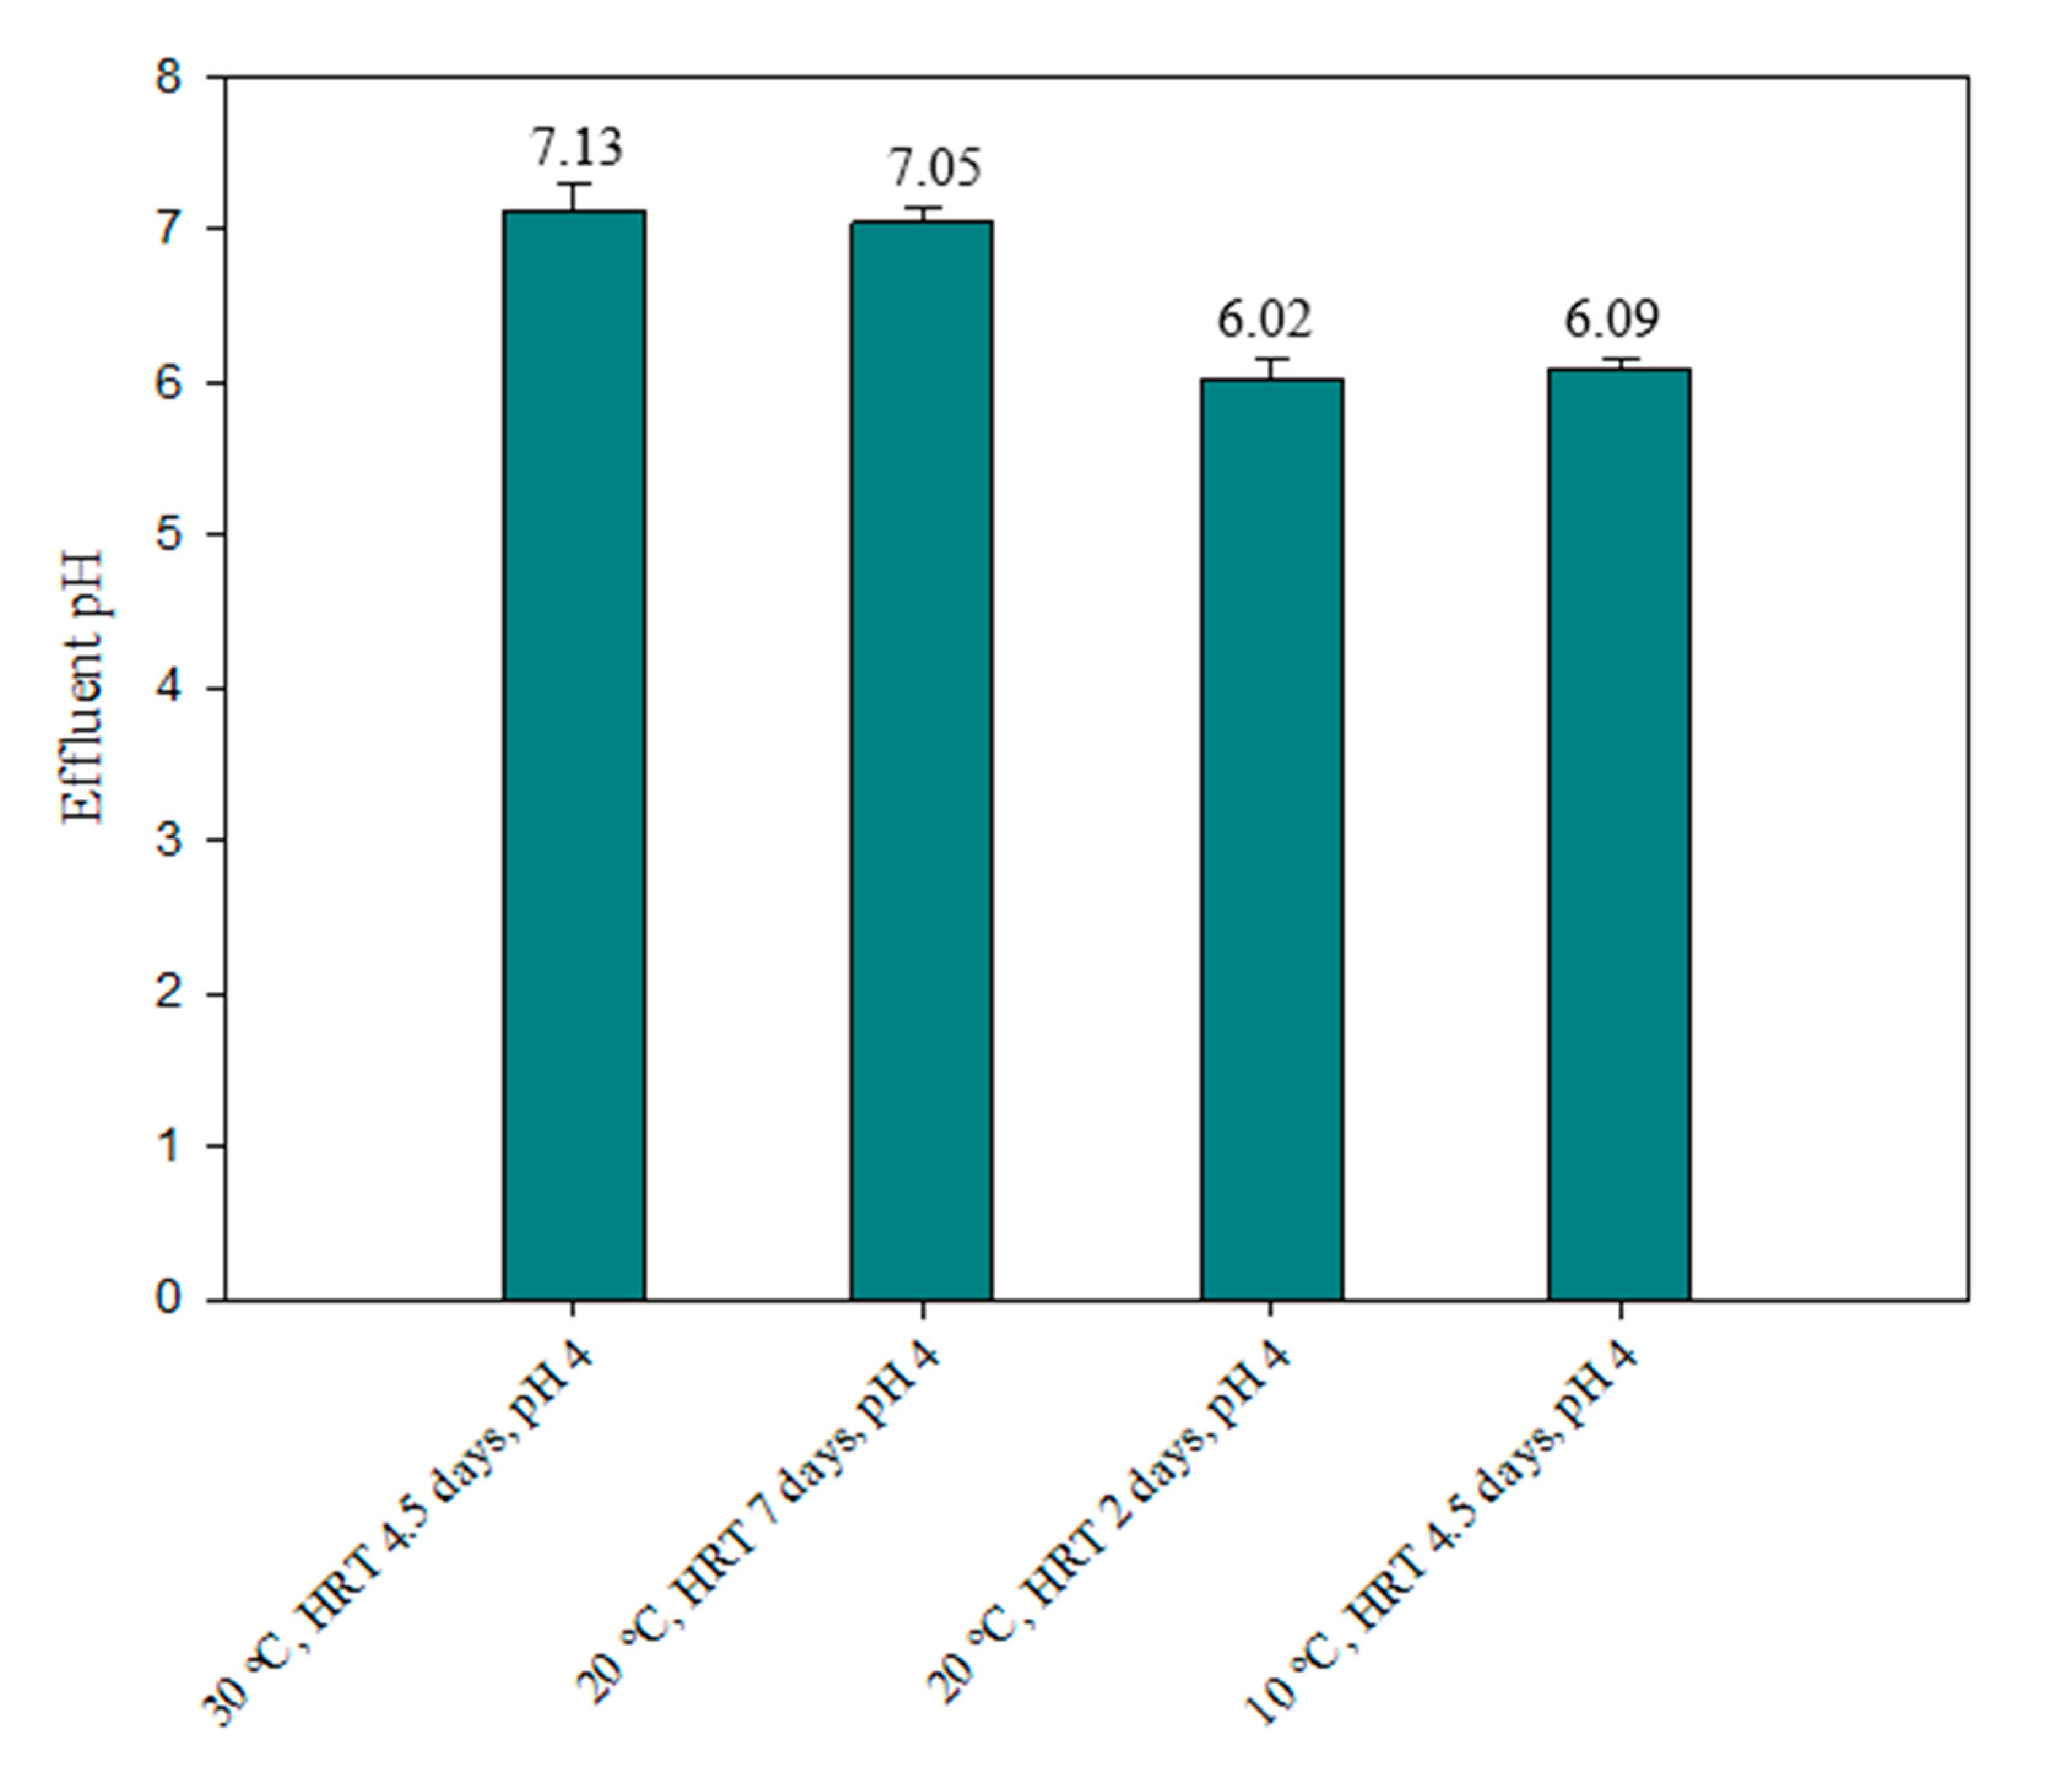
3.2.1. pH
3.2.2. Temperature
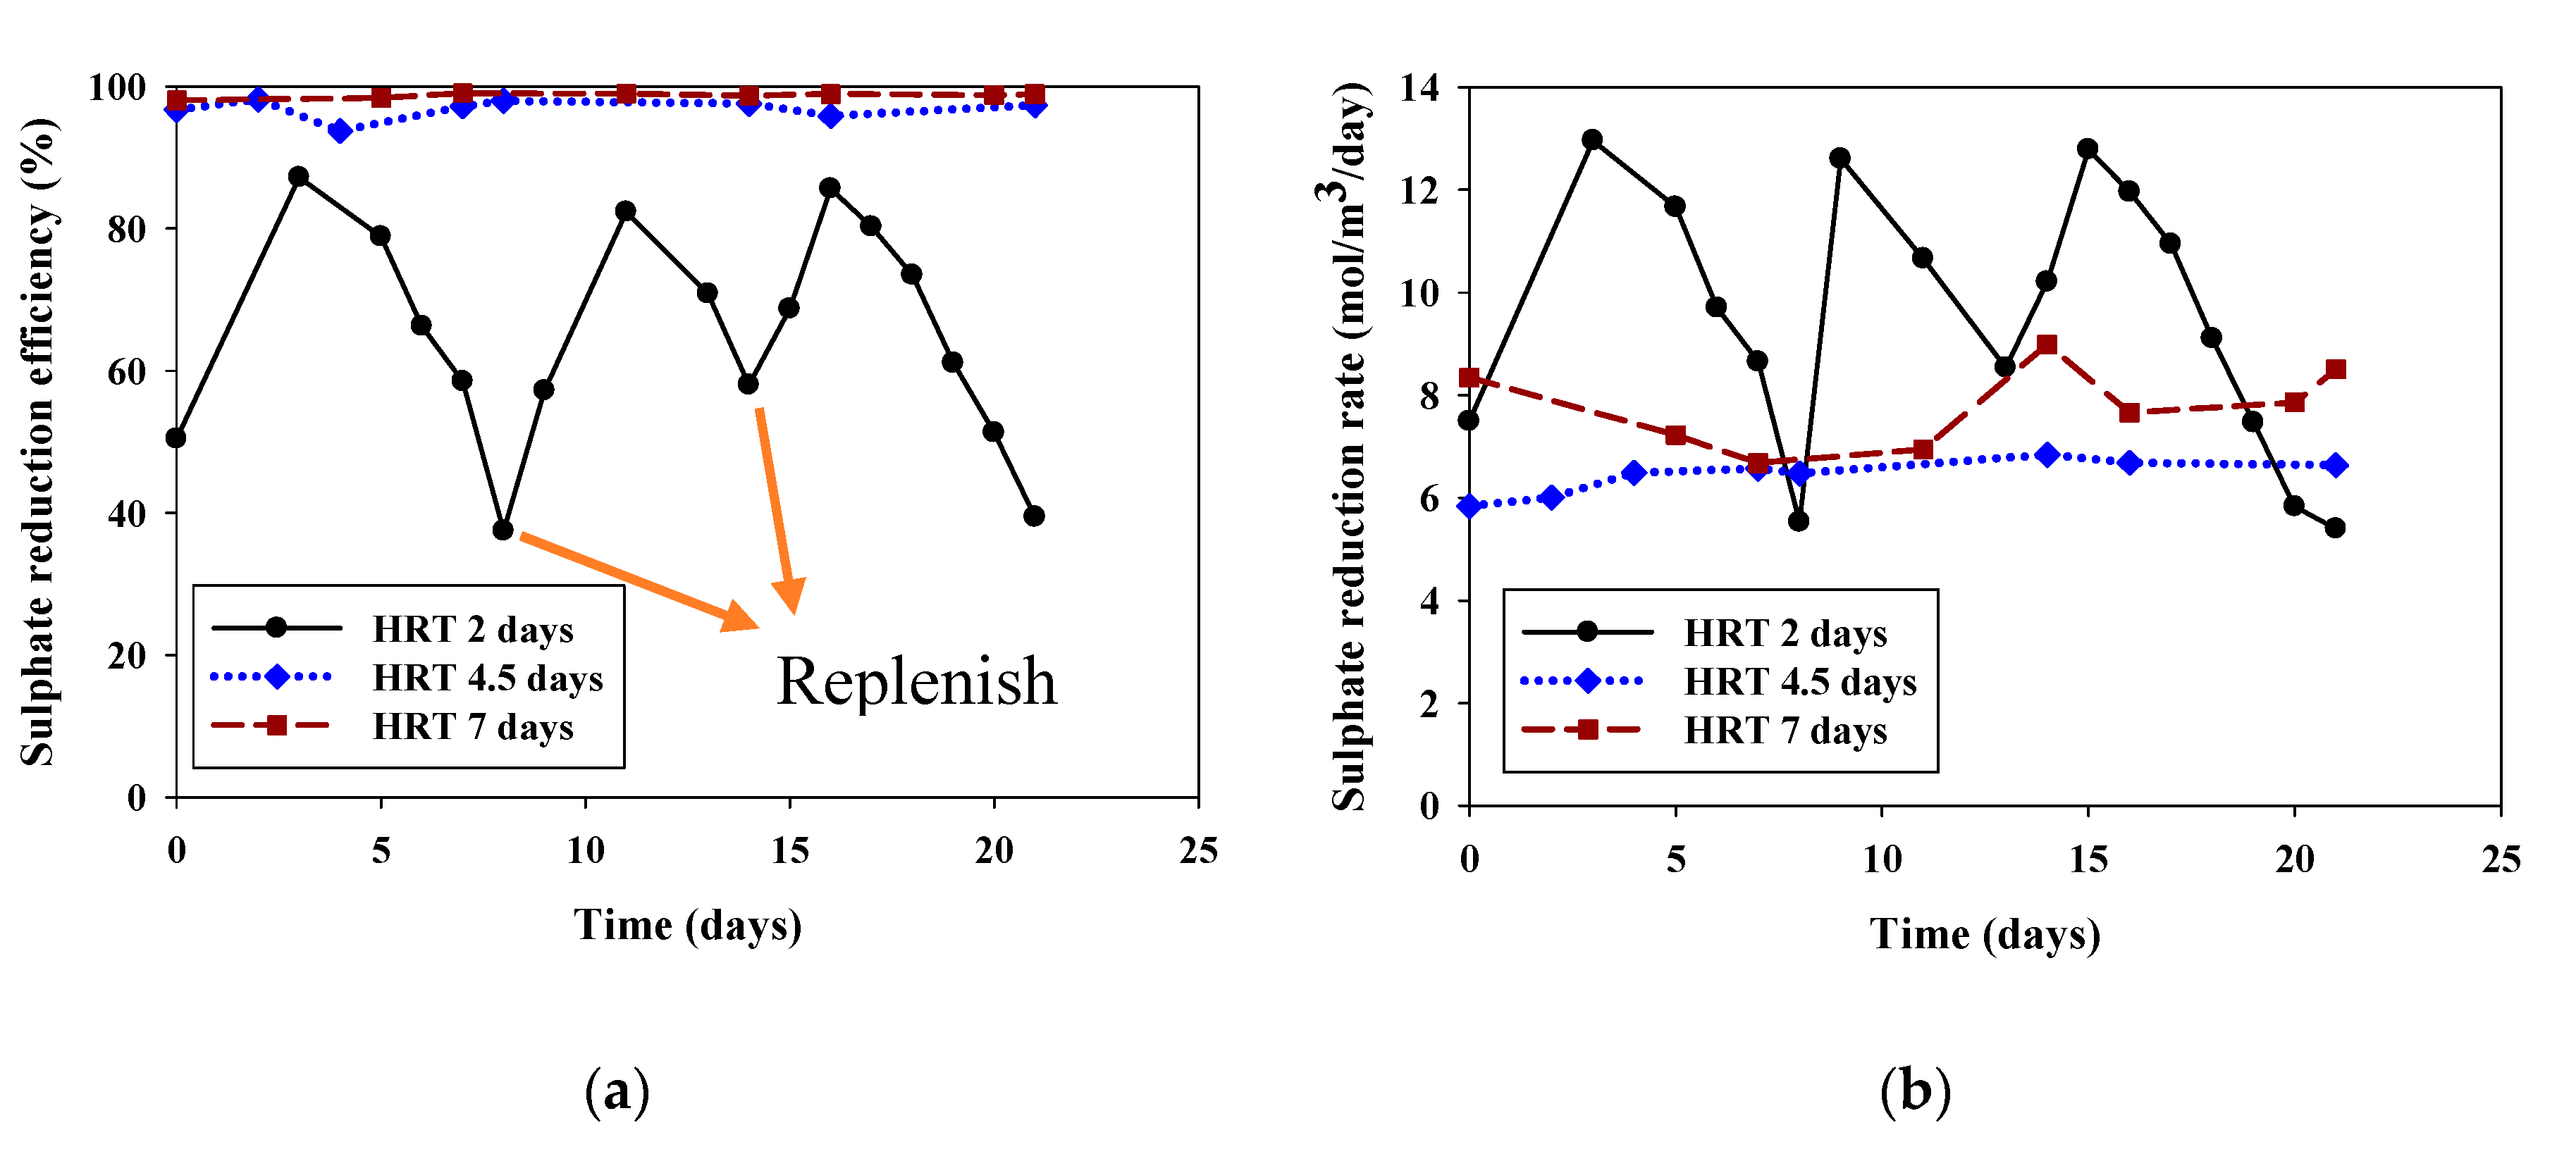
3.2.3. HRT
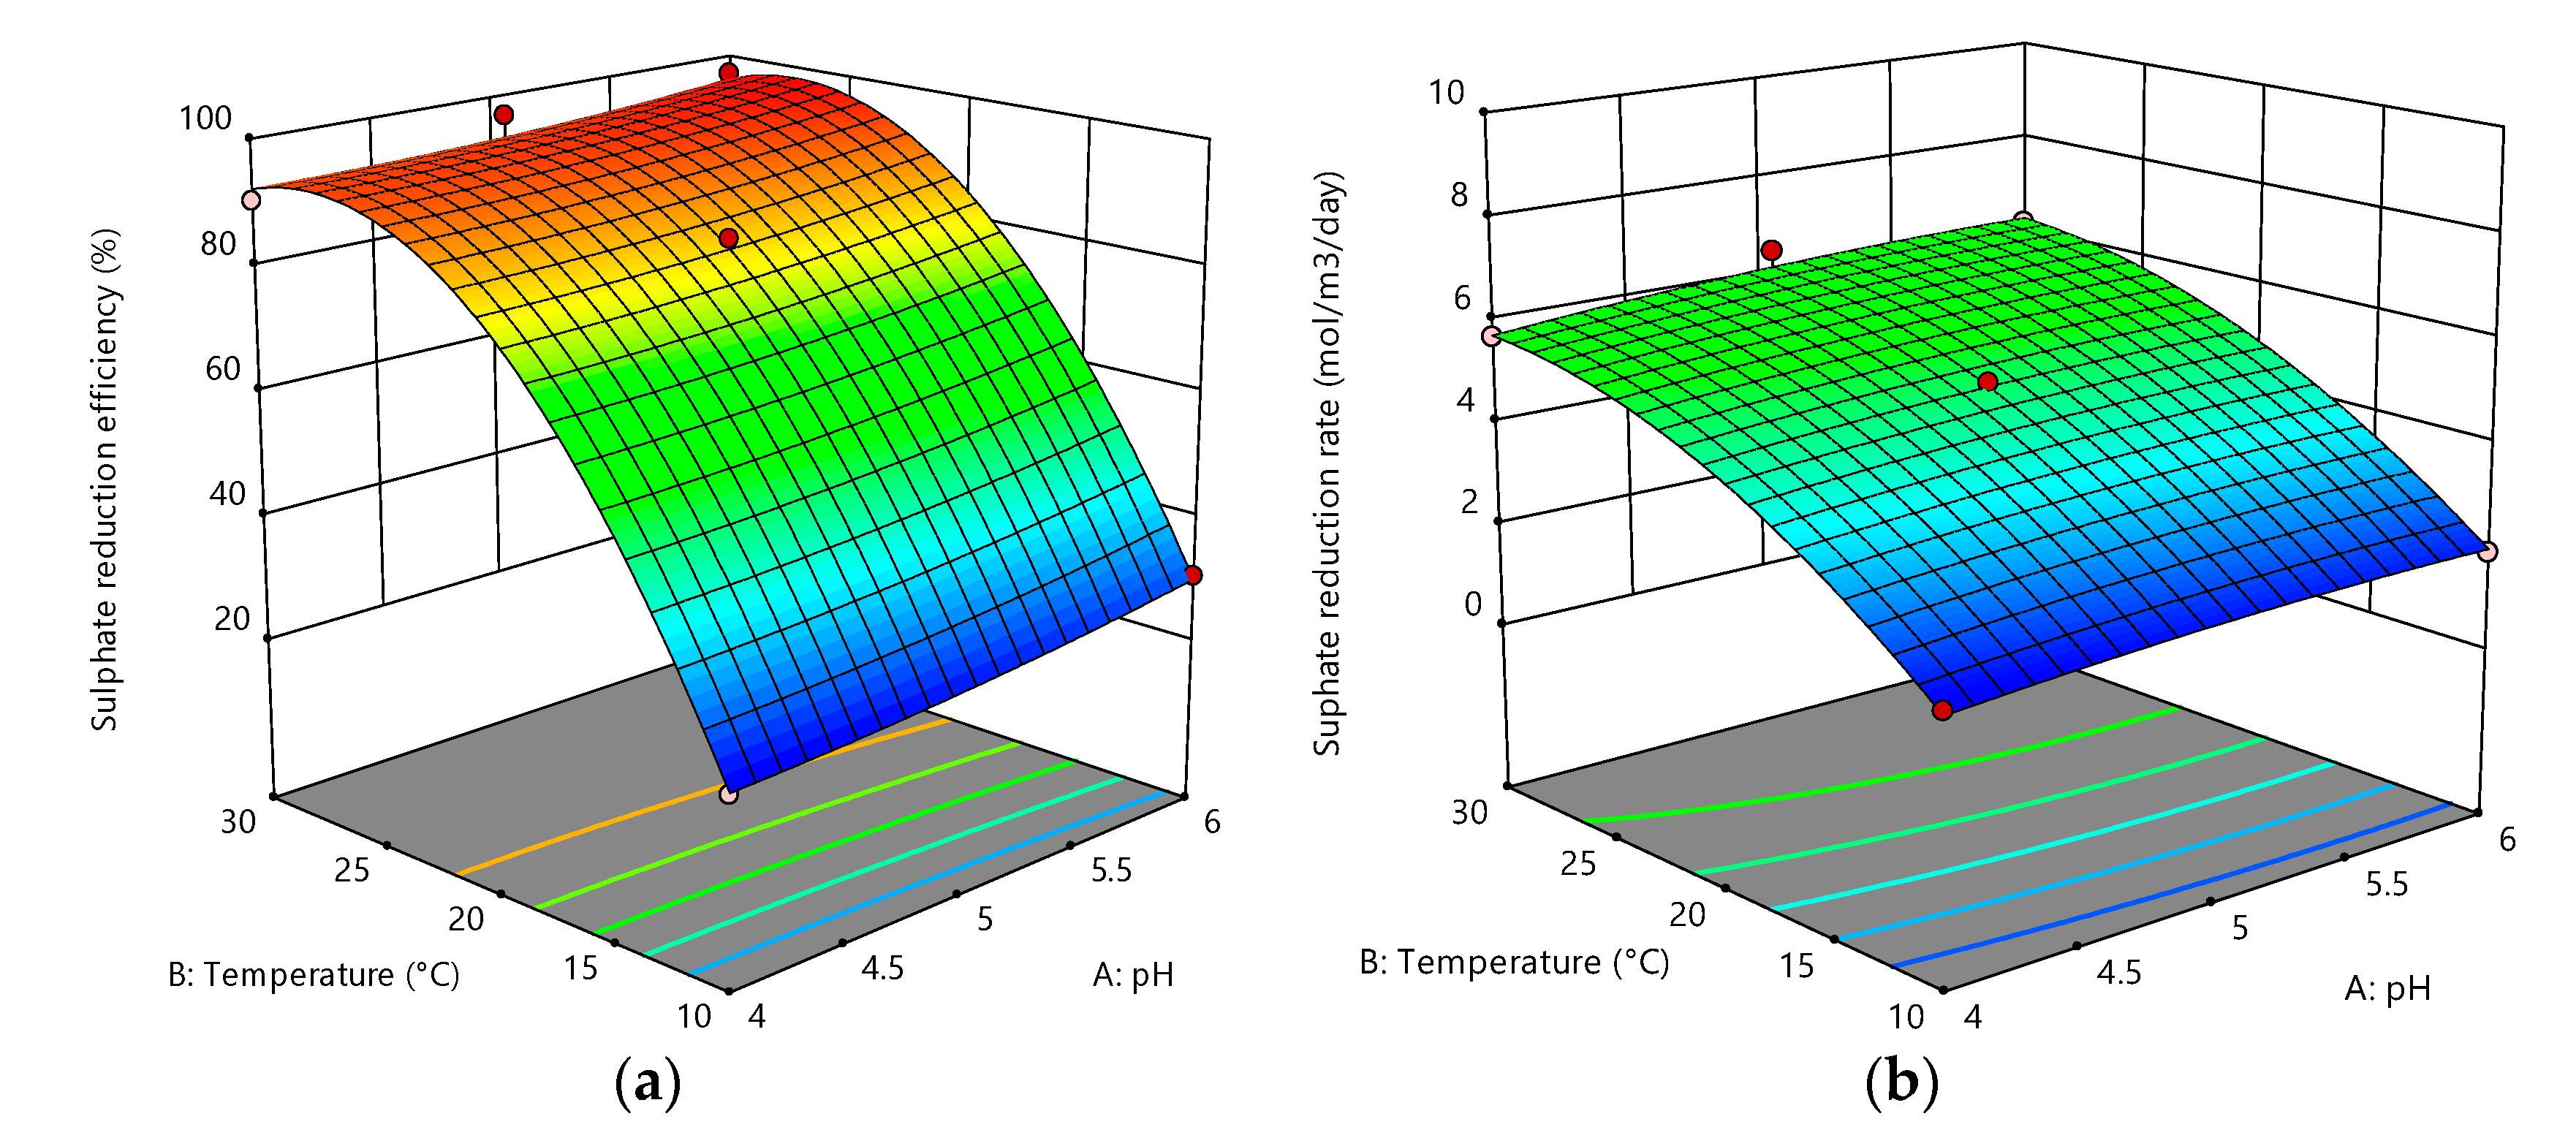
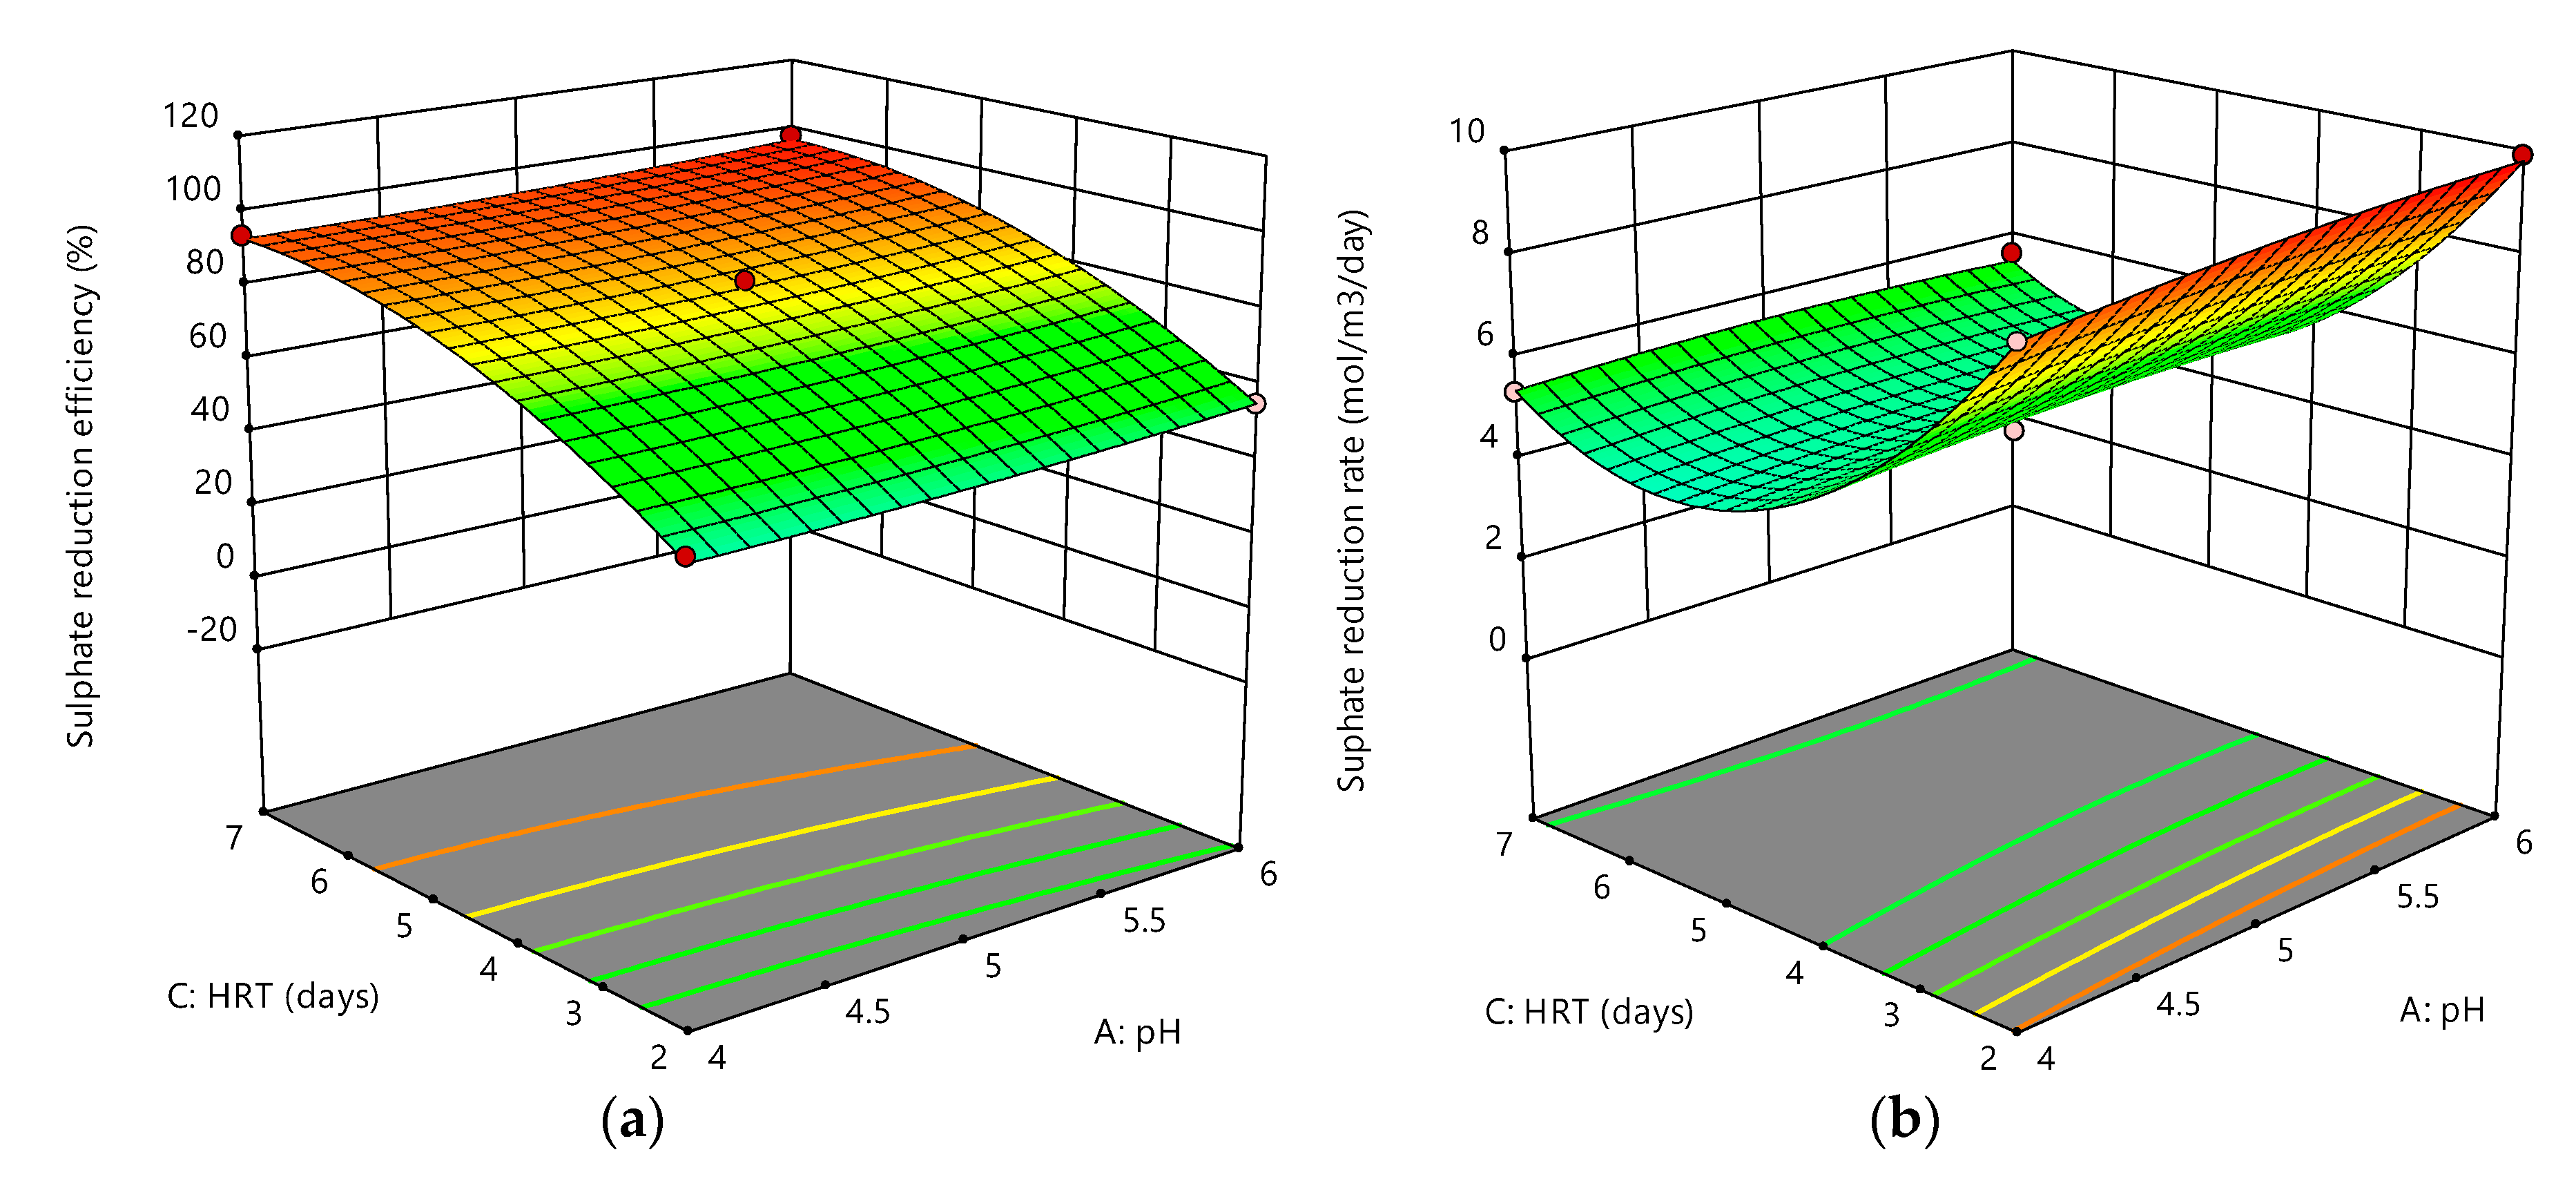
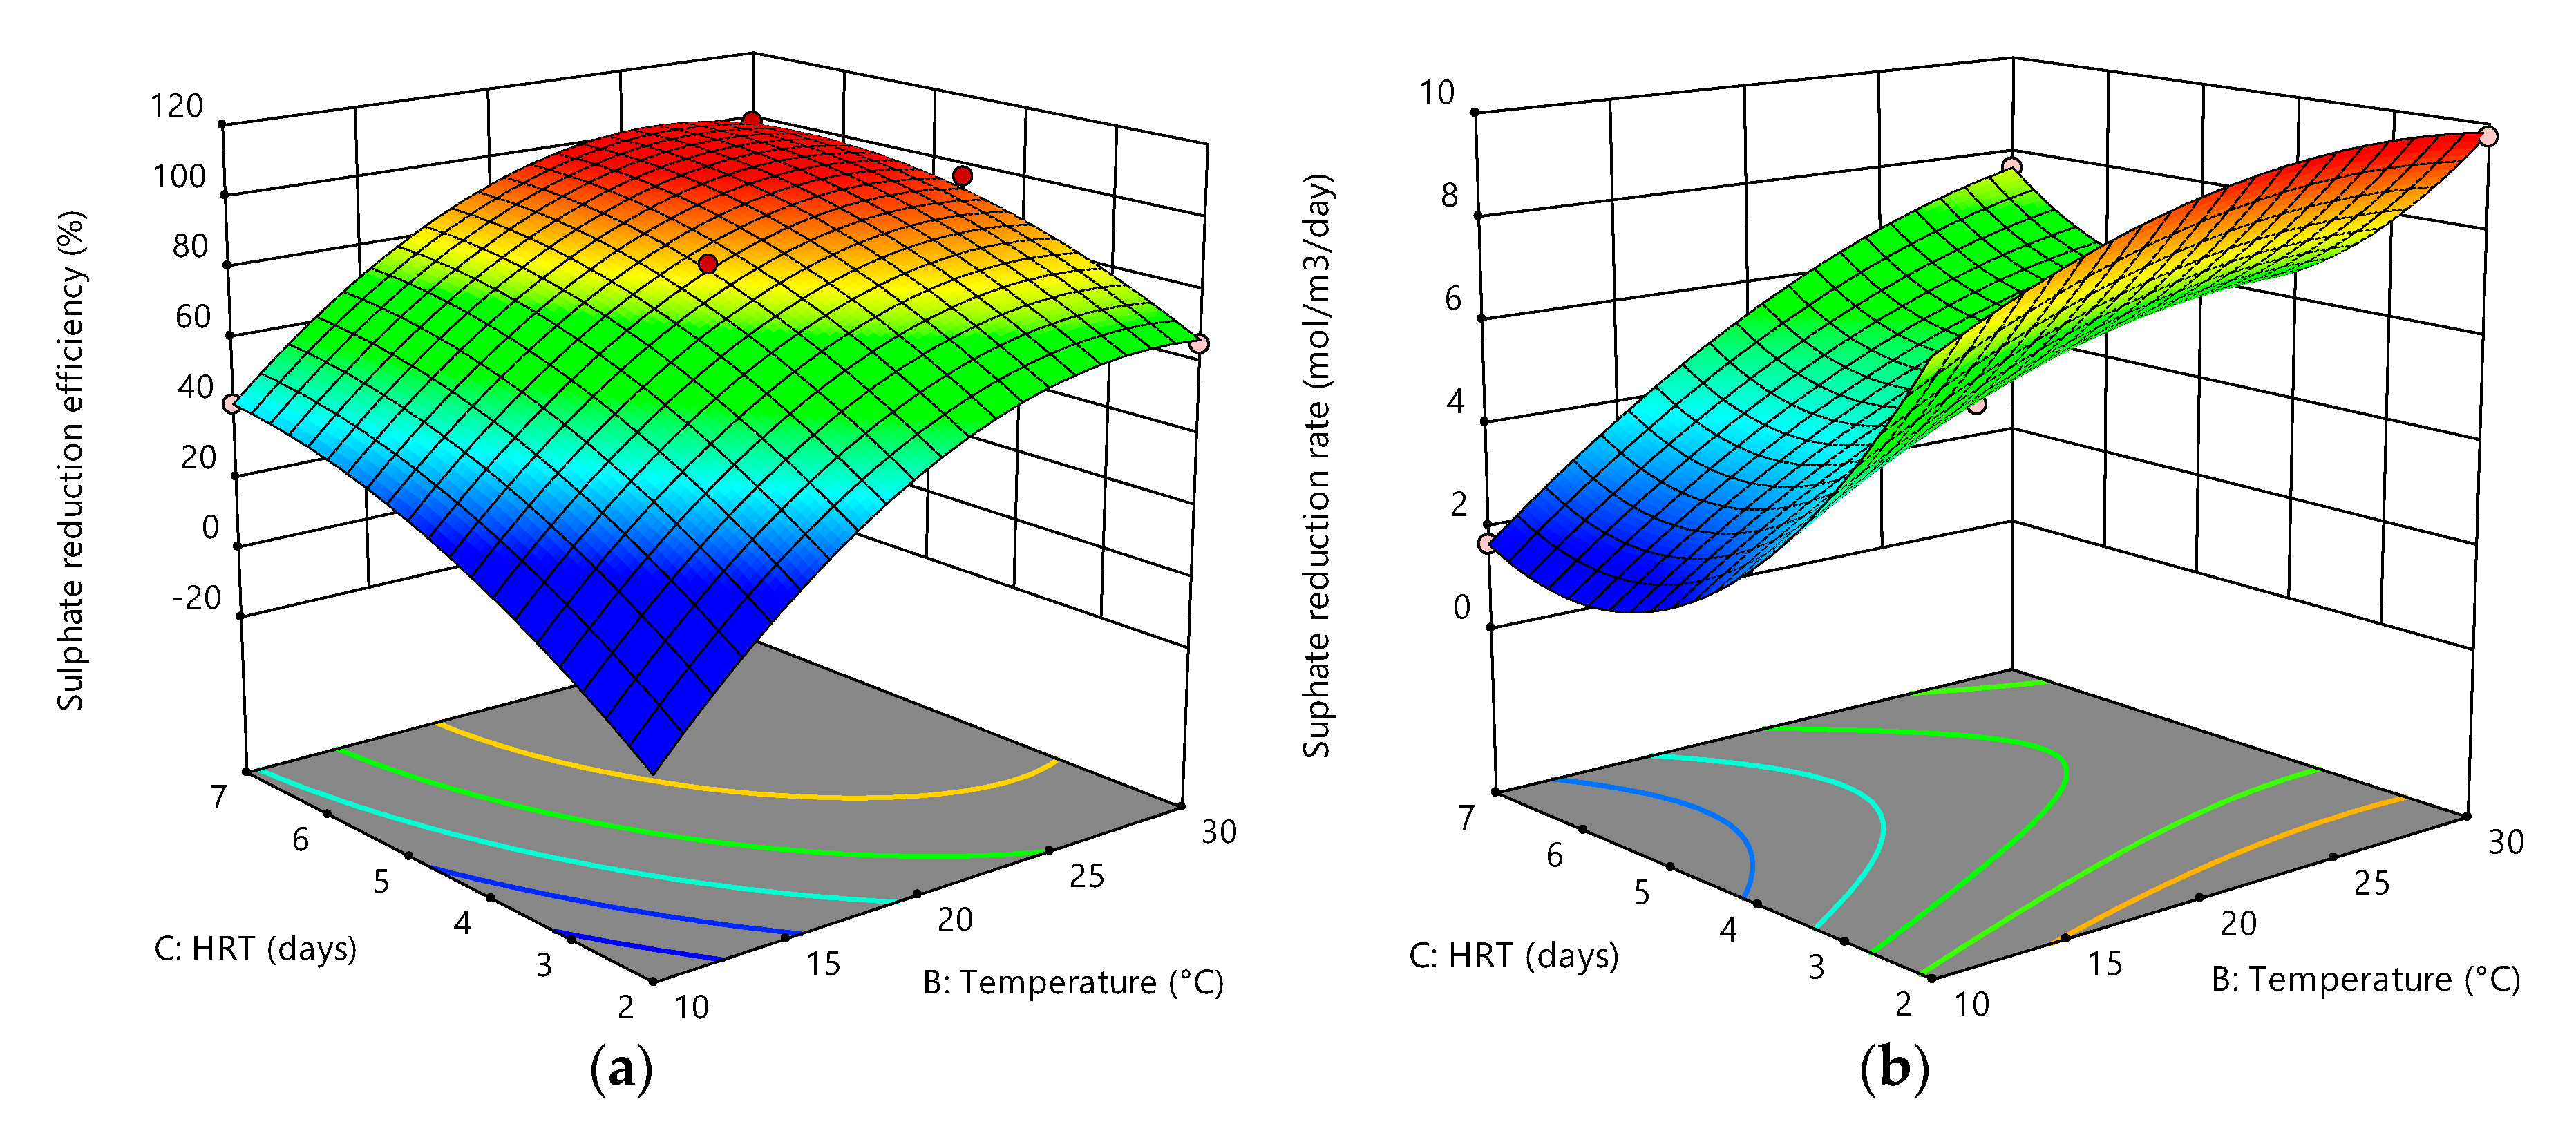
3.3. Interactions between Factors
3.4. Optimisation
3.5. Sulphide
4. Conclusions
Author Contributions
Funding
Acknowledgments
Conflicts of Interest
References
- Equeenuddin, S.M.; Tripathy, S.; Sahoo, P.K.; Panigrahi, M.K. Hydrogeochemical characteristics of acid mine drainage and water pollution at Makum Coalfield, India. J. Geochem. Explor. 2010, 105, 75–82. [Google Scholar] [CrossRef]
- Mccarthy, T.S. The impact of acid mine drainage in South Africa. S. Afr. J. Sci. 2011, 107, 1–7. [Google Scholar] [CrossRef]
- Akcil, A.; Koldas, S. Acid Mine Drainage (AMD): Causes, treatment and case studies. J. Clean. Prod. 2006, 14, 1139–1145. [Google Scholar] [CrossRef]
- Kaksonen, A.H.; Puhakka, J.A. Sulfate Reduction Based Bioprocesses for the Treatment of Acid Mine Drainage and the Recovery of Metals. Eng. Life Sci. 2007, 7, 541–564. [Google Scholar] [CrossRef]
- Arnold, M.; Mariekie, G.; Ritva, M. Technologies for sulphate removal with valorisation options. In Proceedings of the IMWA 2016 Annual Conference: Mining Meets Water—Conflicts and Solutions, Leipzig, Germany, 11–15 July 2016; pp. 1343–1345. [Google Scholar]
- Arnold, D.E. Diversion wells—A low-cost approach to treatment of acid mine drainage. In Proceedings of the Twelfth West Virginia Surface Mine Drainage Task Force Symposium, Morgantown, WV, USA, 3–4 April 1991. [Google Scholar]
- Johnson, D.B.; Hallberg, K.B. Acid mine drainage remediation options: A review. Sci. Total Environ. 2005, 338, 3–14. [Google Scholar] [CrossRef]
- Liamleam, W.; Annachhatre, A.P. Electron donors for biological sulfate reduction. Biotechnol. Adv. 2007, 25, 452–463. [Google Scholar] [CrossRef]
- Luptakova, A.; Macingova, E. Alternative substrates of bacterial sulphate reduction suitable for the biological-chemical treatment of acid mine drainage. Acta Montan. Slovaca 2012, 17, 74. [Google Scholar]
- Sheoran, A.S.; Sheoran, V.; Choudhary, R.P. Bioremediation of acid-rock drainage by sulphate-reducing prokaryotes: A review. Miner. Eng. 2010, 23, 1073–1100. [Google Scholar] [CrossRef]
- Jiménez-Rodríguez, A.M.; Durán-Barrantes, M.D.L.M.; Borja, R.; Sánchez, E.; Colmenarejo, M.; Raposo, F. Biological sulphate removal in acid mine drainage using anaerobic fixed bed reactors with cheese whey as a carbon source. Lat. Am. Appl. Res. 2010, 40, 329–335. [Google Scholar]
- Logan, M.V.; Reardon, K.F.; Figueroa, L.A.; Mclain, J.E.; Ahmann, D.M. Microbial community activities during establishment, performance, and decline of bench-scale passive treatment systems for mine drainage. Water Res. 2005, 39, 4537–4551. [Google Scholar] [CrossRef]
- Mannucci, A.; Munz, G.; Mori, G.; Lubello, C. Factors affecting biological sulphate reduction in tannery wastewater treatment. Environ. Eng. Manag. J. 2014, 13, 1005–1012. [Google Scholar] [CrossRef]
- Neale, J.W.; Muller, H.H.; Gericke, M.; Muhlbauer, R. Low-Cost Biological Treatment of Metal- and Sulphate-Contaminated Mine Waters. IMWA 2017, 1, 453–460. [Google Scholar]
- Seyler, J.; Figueroa, L.; Ahmann, D.; Wildeman, T.; Robustelli, M. Effect of solid phase organic substrate characteristics on sulfate reducer activity and metal removal in passive mine drainage treatment systems. In Proceedings of the National Meeting of the American Society of Mining and Reclamation and the 9th Billings Land Reclamation Symposium, Billings, MT, USA, 3–6 June 2003. [Google Scholar]
- Zagury, G.; Neculita, C.; Bussiere, B. Passive treatment of acid mine drainage in bioreactors: Short review, applications, and research needs. In Proceedings of the 60th Canadian Geotechnical Conference & 8th Joint CGS/IAH-CNC Groundwater Conference, Ottawa, ON, Canada, 21–24 October 2007. [Google Scholar]
- Bijmans, M.; Buisman, C.; Meulepas, R.; Lens, P. Sulfate reduction for inorganic waste and process water treatment. Compr. Biotechnol. 2011, 6, 435–446. [Google Scholar] [CrossRef]
- Chaiprapat, S.; Preechalertmit, P.; Boonsawang, P.; Karnchanawong, S. Sulfidogenesis in Pretreatment of High-Sulfate Acidic Wastewater Using Anaerobic Sequencing Batch Reactor and Upflow Anaerobic Sludge Blanket Reactor. Environ. Eng. Sci. 2011, 28, 597–604. [Google Scholar] [CrossRef]
- Moon, C.; Singh, R.; Veeravalli, S.; Shanmugam, S.; Chaganti, S.; Lalman, J.; Heath, D. Effect of COD:SO42− Ratio, HRT and Linoleic Acid Concentration on Mesophilic Sulfate Reduction: Reactor Performance and Microbial Population Dynamics. Water. 2015, 7, 2275–2292. [Google Scholar] [CrossRef] [Green Version]
- Doshi, S.M. Bioremediation of Acid Mine Drainage Using Sulfate-Reducing Bacteria; US Environmental Protection Agency, Office of Solid Waste and Emergency Response and Office of Superfund Remediation and Technology Innovation: Washington, DC, USA, 2006; p. 65.
- Lettinga, G.; Pol, L.H.; Koster, I.; Wiegant, W.; De Zeeuw, W.; Rinzema, A.; Grin, P.; Roersma, R.; Hobma, S. High-rate anaerobic waste-water treatment using the UASB reactor under a wide range of temperature conditions. Biotechnol. Genet. Eng. Rev. 1984, 2, 253–284. [Google Scholar] [CrossRef]
- Salo, M.; Bomberg, M.; Grewar, T.; Seepei, L.; Mariekie, G.; Arnold, M. Compositions of the Microbial Consortia Present in Biological Sulphate Reduction Processes During Mine Effluent Treatment. IMWA 2017, 1, 14–21. [Google Scholar]
- Visser, A.; Gao, Y.; Lettinga, G. Effects of short-term temperature increases on the mesophilic anaerobic breakdown of sulfate containing synthetic wastewater. Water Res. 1993, 27, 541–550. [Google Scholar] [CrossRef]
- Bezerra, M.A.; Santelli, R.E.; Oliveira, E.P.; Villar, L.S.; Escaleira, L.A. Response surface methodology (RSM) as a tool for optimization in analytical chemistry. Talanta 2008, 76, 965–977. [Google Scholar] [CrossRef]
- Najib, T.; Solgi, M.; Farazmand, A.; Heydarian, S.M.; Nasernejad, B. Optimization of sulfate removal by sulfate reducing bacteria using response surface methodology and heavy metal removal in a sulfidogenic UASB reactor. J. Envion. Chem. Eng. 2017, 5, 3256–3265. [Google Scholar] [CrossRef]
- Cabrera, G.; Pérez, R.; Gomez, J.; Abalos, A.; Cantero, D. Toxic effects of dissolved heavy metals on Desulfovibrio vulgaris and Desulfovibrio sp. strains. J. Hazard. Mater. 2006, 135, 40–46. [Google Scholar] [CrossRef] [PubMed]
- Dvorak, D.H.; Hedin, R.S.; Edenborn, H.M.; Mcintire, P.E. Treatment of metal-contaminated water using bacterial sulfate reduction: Results from pilot-scale reactors. Biotechnol. Bioeng. 1992, 40, 609–616. [Google Scholar] [CrossRef] [PubMed]
- Macingova, E.; Luptakova, A. Recovery of metals from acid mine drainage. Chem. Eng. 2012, 28, 109–114. [Google Scholar] [CrossRef]
- Ňancucheo, I.; Johnson, D.B. Selective removal of transition metals from acidic mine waters by novel consortia of acidophilic sulfidogenic bacteria. Microb. Biotechnol. 2012, 5, 34–44. [Google Scholar] [CrossRef] [Green Version]
- Utgikar, V.P.; Harmon, S.M.; Chaudhary, N.; Tabak, H.H.; Govind, R.; Haines, J.R. Inhibition of sulfate-reducing bacteria by metal sulfide formation in bioremediation of acid mine drainage. Environ. Toxicol. 2002, 17, 40–48. [Google Scholar] [CrossRef]
- Dev, S.; Roy, S.; Das, D.; Bhattacharya, J. Improvement of biological sulfate reduction by supplementation of nitrogen rich extract prepared from organic marine wastes. Int. Biodeterior. Biodegrad. 2015, 104, 264–273. [Google Scholar] [CrossRef]
- Choudhary, R.P.; Sheoran, A.S. Comparative study of cellulose waste versus organic waste as substrate in a sulfate reducing bioreactor. Bioresour. Technol. 2011, 102, 4319–4324. [Google Scholar] [CrossRef]
- Kuyucak, N.; St-Germain, P. In situ treatment of acid mine drainage by sulfate reducing bacteria in open pits: Scale-up experiences. In Proceedings of the International Land Reclamations and Mine Drainage Conference and the Third International Conference on the Abatement of Acidic Drainage, Pittsburgh, PA, USA, 24–29 April 1994. [Google Scholar]
- Jong, T.; Parry, D.L. Microbial sulfate reduction under sequentially acidic conditions in an upflow anaerobic packed bed bioreactor. Water Res. 2006, 40, 2561–2571. [Google Scholar] [CrossRef]
- Sun, Y.; Wei, J.; Zhang, J.P.; Yang, G. Optimization using response surface methodology and kinetic study of Fischer–Tropsch synthesis using SiO2 supported bimetallic Co–Ni catalyst. J. Nat. Gas Sci. Eng. 2016, 28, 173–183. [Google Scholar] [CrossRef]
- Talib, N.A.A.; Salam, F.; Yusof, N.A.; Ahmad, S.A.A.; Sulaiman, Y. Optimization of peak current of poly (3,4-ethylenedioxythiophene)/multi-walled carbon nanotube using response surface methodology/central composite design. RSC Adv. 2017, 7, 11101–11110. [Google Scholar] [CrossRef] [Green Version]
- Kolmert, Å.; Johnson, D.B. Remediation of acidic waste waters using immobilised acidophillic sulfate-reducing bacteria. J. Chem. Technol. Biotechnol. 2001, 76, 836–843. [Google Scholar] [CrossRef]
- Elliott, P.; Ragusa, S.; Catcheside, D. Growth of sulfate-reducing bacteria under acidic conditions in an upflow anaerobic bioreactor as a treatment system for acid mine drainage. Water Res. 1998, 32, 3724–3730. [Google Scholar] [CrossRef]
- Sen, A.M.; Johnson, B. Acidophilic sulphate-reducing bacteria: Candidates for bioremediation of acid mine drainage. Process Metall. 1999, 9, 709–718. [Google Scholar] [CrossRef]
- Tsukamoto, T.; Killion, H.; Miller, G. Column experiments for microbiological treatment of acid mine drainage: Low-temperature, low-pH and matrix investigations. Water Res. 2004, 38, 1405–1418. [Google Scholar] [CrossRef]
- Lopes, S.I.C. Sulfate Reduction at Low pH in Organic Wastewaters. Ph.D. Thesis, Wageningen University, Wageningen, The Netherlands, 2007. [Google Scholar]
- Ferrentino, R.; Langone, M.; Andreottola, G. Temperature effects on the activity of denitrifying phosphate accumulating microorganisms and sulphate reducing bacteria in anaerobic side-stream reactor. J. Environ. Bio. Res. 2017, 1, 1. [Google Scholar]
- Greben, H.; Bologo, H.; Maree, J. The effect of different parameters on the biological volumetric and specific sulphate removal rates. In Proceedings of the WISA Biennial Cinference 2002, Durban, South Africa, 19–23 May 2002. [Google Scholar]
- Marais, T.; Huddy, R.; Van Hille, R.; Harrison, S. The Effect of Temperature on the Kinetics of Sulphate Reduction and Sulphide Oxidation in an Integrated Semi-Passive Bioprocess for Remediating Acid Rock Drainage. In Proceedings of the 11th ICARD|IMWA| MWD Conference—Risk to Opportunity, Pretoria, South Africa, 10–14 September 2018. [Google Scholar]
- Gibert, O.; De Pablo, J.; Cortina, J.L.; Ayora, C. Chemical characterisation of natural organic substrates for biological mitigation of acid mine drainage. Water Res. 2004, 38, 4186–4196. [Google Scholar] [CrossRef] [PubMed]
- Glombitza, F. Treatment of acid lignite mine flooding water by means of microbial sulfate reduction. Waste Manag. 2001, 21, 197–203. [Google Scholar] [CrossRef]
- Greben, H.; Maree, J. The effect of reactor type and residence time on biological sulphate and sulphide removal rates. In Proceedings of the WISA Biennial Conference 2000, Sun City, South Africa, 28 May–1 June 2000. [Google Scholar]
- Mallelwar, P.C. Effect of Linoleic Acid and Hydraulic Retention Time on Anaerobic Sulfate Reduction in High Rate Reactors. Master’s Thesis, University of Windsor, Windsor, ON, Canada, 2013. [Google Scholar]
- Isa, Z.; Grusenmeyer, S.; Verstraete, W. Sulfate reduction relative to methane production in high-rate anaerobic digestion: Microbiological aspects. Appl. Environ. Microbiol. 1986, 51, 580–587. [Google Scholar] [CrossRef] [Green Version]
- Sipma, J.; Osuna, M.B.; Lettinga, G.; Stams, A.J.; Lens, P.N. Effect of hydraulic retention time on sulfate reduction in a carbon monoxide fed thermophilic gas lift reactor. Water Res. 2007, 41, 1995–2003. [Google Scholar] [CrossRef]
- Mukwevho, M.; Chirwa, E.; Maharajh, D. Performance of Biological Sulphate Reduction at Low pH, Low Temperature and Low Hydraulic Retention Time. Chem. Eng. Trans. 2020, 79, 439–444. [Google Scholar] [CrossRef]
- Poinapen, J.; Wentzel, M.W.; Ekama, G. Biological sulphate reduction with primary sewage sludge in an upflow anaerobic sludge bed (UASB) reactor. Part 1: Feasibility study. Water SA 2009, 35, 525–534. [Google Scholar] [CrossRef] [Green Version]
- Kasim, M.S.; Harun, N.H.; Hafiz, M.S.A.; Mohamed, S.B.; Mohamad, W.N.F.W. Multi-Response Optimization of Process Parameter in Fused Deposition Modelling by Response Surface Methodology. Int. J. Recent Technol. 2019, 8, 327–338. [Google Scholar] [CrossRef]
- Greben, H.; Maree, J.; Eloff, E.; Murray, K. Improved sulphate removal rates at increased sulphide concentration in the sulphidogenic bioreactor. Water SA 2005, 31, 351–358. [Google Scholar] [CrossRef] [Green Version]
- Valdés, F.; Muñoz, E.; Chamy, R.; Ruiz, G.; Vergara, C.; Jeison, D. Effect of sulphate concentration and sulphide desorption on the combined removal of organic matter and sulphate from wastewaters using expanded granular sludge bed (EGSB) reactors. Electron. J. Biotechnol. 2006, 9, 371–378. [Google Scholar] [CrossRef] [Green Version]
- Marais, T.S.; Huddy, R.; Harrison, S.T.L.; Van Hille, R. Demonstration of simultaneous biological sulphate reduction and partial sulphide oxidation in a hybrid linear flow channel reactor. J. Water Process Eng. 2020, 34, 101143. [Google Scholar] [CrossRef]


| Code | Factors | Factor Range and Levels (Coded) | ||
|---|---|---|---|---|
| −1 | 0 | 1 | ||
| A | pH | 4 | 5 | 6 |
| B | Temperature (°C) | 10 | 20 | 30 |
| C | HRT (days) | 2 | 4.5 | 7 |
| Run | Independent Variables | Response Variables | |||
|---|---|---|---|---|---|
| A: pH | B: Temperature (°C) | C: HRT (days) | Sulphate Reduction Efficiency (%) | Sulphate Reduction Rate (mol/m3/day) | |
| 1 | 5 | 20 | 4.5 | 76.94 | 4.57 |
| 2 | 5 | 30 | 7 | 98.73 | 7.66 |
| 3 | 4 | 30 | 4.5 | 90.34 | 5.70 |
| 4 | 5 | 30 | 2 | 65.61 | 9.75 |
| 5 | 6 | 20 | 2 | 50.28 | 8.97 |
| 6 | 5 | 10 | 7 | 41.74 | 1.66 |
| 7 | 5 | 20 | 4.5 | 84.46 | 4.99 |
| 8 | 4 | 10 | 4.5 | 22.76 | 1.67 |
| 9 | 6 | 30 | 4.5 | 96.87 | 6.17 |
| 10 | 6 | 20 | 7 | 97.56 | 5.63 |
| 11 | 4 | 20 | 2 | 55.17 | 9.89 |
| 12 | 4 | 20 | 7 | 93.43 | 5.35 |
| 13 | 5 | 20 | 4.5 | 84.38 | 4.98 |
| 14 | 6 | 10 | 4.5 | 30.38 | 1.88 |
| 15 | 6 | 30 | 7 | 98.40 | 7.54 |
| 16 | 5 | 30 | 4.5 | 96.57 | 6.46 |
| Response | Source of Variation | Sum of Squares | df | Mean Square | F-Value | p-Value |
|---|---|---|---|---|---|---|
| Sulphate reduction efficiency (%) | Model | 10,155.47 | 9 | 1128.39 | 101.70 | <0.0001 1 |
| A-pH | 59.11 | 1 | 59.11 | 5.33 | 0.0604 2 | |
| B-Temperature | 6519.62 | 1 | 6519.62 | 587.61 | <0.0001 1 | |
| C-HRT | 2442.99 | 1 | 2442.99 | 220.19 | <0.0001 1 | |
| AB | 2.65 | 1 | 2.65 | 0.2389 | 0.6424 2 | |
| AC | 2.11 | 1 | 2.11 | 0.1897 | 0.6784 2 | |
| BC | 72.74 | 1 | 72.74 | 6.56 | 0.0429 1 | |
| A² | 3.68 | 1 | 3.68 | 0.3316 | 0.5856 2 | |
| B² | 1808.36 | 1 | 1808.36 | 162.99 | <0.0001 1 | |
| C² | 370.19 | 1 | 370.19 | 33.37 | 0.0012 1 | |
| Residual | 66.57 | 6 | 11.10 | |||
| Lack of Fit | 29.32 | 4 | 7.33 | 0.3937 | 0.8060 2 | |
| Pure Error | 37.25 | 2 | 18.62 | |||
| Correction Total | 10,222.04 | 15 | ||||
| Sulphate reduction rate (mol/m3/day) | Model | 101.69 | 9 | 11.30 | 221.37 | <0.0001 1 |
| A-pH | 0.5037 | 1 | 0.5037 | 1.49 | 0.2617 2 | |
| B-Temperature | 25.50 | 1 | 25.50 | 499.63 | <0.0001 1 | |
| C-HRT | 20.96 | 1 | 20.96 | 410.67 | <0.0001 1 | |
| AB | 0.0093 | 1 | 0.0093 | 0.1822 | 0.6844 2 | |
| AC | 0.1504 | 1 | 0.1504 | 2.95 | 0.1369 2 | |
| BC | 1.78 | 1 | 1.78 | 34.89 | 0.0010 1 | |
| A² | 0.0577 | 1 | 0.0577 | 1.13 | 0.3287 2 | |
| B² | 2.58 | 1 | 2.58 | 50.60 | 0.0004 1 | |
| C² | 23.09 | 1 | 23.09 | 452.42 | <0.0001 1 | |
| Residual | 0.3062 | 6 | 0.0510 | |||
| Lack of Fit | 0.1926 | 4 | 0.0481 | 0.8472 | 0.6045 2 | |
| Pure Error | 0.1137 | 2 | 0.0568 | |||
| Correction Total | 102.00 | 15 |
| R2 | Adjusted R2 | Predicted R2 | Adequate Precision | |
|---|---|---|---|---|
| Sulphate reduction efficiency (%) | 0.9935 | 0.9837 | 0.9716 | 29.36 |
| Sulphate reduction rate (mol/m3/day) | 0.9970 | 0.9925 | 0.9853 | 46.21 |
© 2020 by the authors. Licensee MDPI, Basel, Switzerland. This article is an open access article distributed under the terms and conditions of the Creative Commons Attribution (CC BY) license (http://creativecommons.org/licenses/by/4.0/).
Share and Cite
Mukwevho, M.J.; Maharajh, D.; Chirwa, E.M.N. Evaluating the Effect of pH, Temperature, and Hydraulic Retention Time on Biological Sulphate Reduction Using Response Surface Methodology. Water 2020, 12, 2662. https://doi.org/10.3390/w12102662
Mukwevho MJ, Maharajh D, Chirwa EMN. Evaluating the Effect of pH, Temperature, and Hydraulic Retention Time on Biological Sulphate Reduction Using Response Surface Methodology. Water. 2020; 12(10):2662. https://doi.org/10.3390/w12102662
Chicago/Turabian StyleMukwevho, Mukhethwa Judy, Dheepak Maharajh, and Evans M. Nkhalambayausi Chirwa. 2020. "Evaluating the Effect of pH, Temperature, and Hydraulic Retention Time on Biological Sulphate Reduction Using Response Surface Methodology" Water 12, no. 10: 2662. https://doi.org/10.3390/w12102662