Bringing Earth Observation to Classrooms—The Importance of Out-of-School Learning Places and E-Learning
by
 , and
, and
Lisa Dannwolf
1,*, 
Tobias Matusch
1 ,
,
Johannes Keller
1, 
Ronja Redlich
2 and
Alexander Siegmund
1,3 1
Research Group for Earth Observation (rgeo), Department of Geography, Heidelberg University of Education, Czernyring 22/10-12, 69115 Heidelberg, Germany
2
VISTA Geowissenschaftliche Fernerkundung GmbH, Gabelsbergerstr. 51, 80333 München, Germany
3
Heidelberg Center for the Environment (HCE) & Institute of Geography, Heidelberg University, Berliner Straße 48, D-69120 Heidelberg, Germany
*
Author to whom correspondence should be addressed.
Remote Sens. 2020, 12(19), 3117; https://doi.org/10.3390/rs12193117
Submission received: 31 July 2020
/
Revised: 16 September 2020
/
Accepted: 21 September 2020
/
Published: 23 September 2020
(This article belongs to the Collection Teaching and Learning in Remote Sensing)
Abstract
:Viewing the Earth from above has fascinated people at least since the Apollo mission in the 1960s. Today, satellite images have made their way into the news and media, but the potential of using satellite images in the classroom has not yet been exhausted. Teachers often lack the technical knowledge of Earth observation (EO) or the technical requirements in schools. The Geo:spektiv e-learning platform used provides the opportunity to integrate EO into curricula as well as current environmental- and space-relevant topics. This study analyses the driving forces that determine the motivation of students and which factors contribute to the success of an e-learning platform. The basis for this study is a Geo:spektiv module about the endangered rainforest, established at an out-of-school learning place and designed for students in secondary education. A survey of 281 students on their motivation and learning behavior showed, that in addition to the topic and level of difficulty tailored to the students’ needs, the design of the modules, simple navigation, and the use of multimedia content are vital. Despite the small sampling size and restricted geographical location of sample selection, the results of this study can contribute to better integration of digital geo-media in school lessons.
1. Introduction
In recent decades, the popularity of digital geo-media technologies increased to an extraordinary level. Geo-spatial technologies such as geographic information systems (GIS), Earth observation (EO) and global navigation satellite system (GNSS) applications with portable geo-tools are widely and used in our society on a daily basis. The growing number of applications shows that digital geo-media are one of the central technologies of future societies. EO, as a central part of this, offers a large, yet unexhausted potential for educational purposes [1]. Based on the emergence of many EO satellites, almost all areas of the Earth´s surface can be observed in high spatial and temporal resolution. Therefore, EO data have become particularly significant for various scientific applications [2].
In terms of educational use, manifold geographical and environmental topics implemented in school curricula can be explored by using EO data. Awareness of key global issues in the 21st century, such as urbanization, decreasing biodiversity, environmental hazards and food security, can be enhanced by using satellite imagery. In particular, their graphic representation and timeliness demonstrate their didactic capability [1]. The student-centered and student-adapted use of digital geo-media in classrooms helps students to improve their spatial thinking, orientation competency, and expertise in the treated topic [3,4,5]. For many science, technology, engineering, and mathematics (STEM) disciplines, spatial thinking is an important cognitive skill [6]. Teaching with digital geo-media not only aids in building important competencies but can also promote a fascination in EO and can support interest in STEM disciplines [7,8].
Due to the growing importance of geo-spatial technologies in a large number of occupational fields and their potential in a competency-orientated curriculum, digital geo-media are embedded in federal school curricula in countries such as Germany, the UK and Switzerland [9,10,11]. To capitalize on EO, teachers need EO-specific technological pedagogical content knowledge (TPACK)—the knowledge needed to use EO technology with suitable content in a student-adapted way [12,13]—and proper technical infrastructure. Despite dynamic development in the EO market and its establishment in the curricula, EO is not yet firmly embedded in the field of teacher training. For this reason, EO-specific TPACK is not common knowledge [14,15,16]. Furthermore, required technical equipment, such as the nationwide availability of WIFI, and adequate equipment, is still lacking in Germany [17]. The latter is supposed to be tackled through the German strategy for digitalization in schools [18].
In a fast-developing sector such as EO, training is necessary to keep up to date [19]. In recent decades, many new, even freely available, tools for analyzing EO data were developed for experienced user groups (e.g., QGIS, SNAP, and the Science Toolbox Exploration Platform). In addition, a wide range of state-owned providers (e.g., the DLR and ESA), research institutes such as universities, and private institutions (e.g., Tama Group and Geo University) offer e-learning courses, massive open online courses (MOOCs) [20], and face-to-face trainings [21] on EO topics for advanced users groups and for higher education students. Consequently, in recent years, various attempts have been made to develop materials and teaching models for non-experts such as teachers and students. Intergovernmental organizations, space agencies, universities and institutes offer a wide range of platforms and training courses addressing students of different ages. Projects such as YCHANGE and EO4GEO aim to improve competences in EO at the European level. YCHANGE (YCHANGE—Young Scientists as Change Explorers (https://ychange.rgeo.de/)) offers free learning material in six different languages for different school classes and EO4GEO (EO4GEO—Skills development and capacity building in the EO (http://www.eo4geo.eu/)) bridges the gap between EO, geo-information and education through collaboration between various European partners [22]. Other international initiatives such as Eduspace and the various European Space Education Resource Offices (ESEROs) support the use of satellite imagery for educational purposes at the primary and secondary school levels in cooperation with national partners [23]. While teacher training has a long-term effect on the implementation of EO in schools, out-of-school learning places and ready to use material offer opportunities for teachers to include EO in classrooms, even if their EO-specific TPACK is lacking.
Out-of-school learning places can offer students new insights into methods, materials, and objects, which cannot be used or analyzed in classrooms. If students can work with methods, materials, and objects in out-of-school locations, such visits may arouse the interest of students in a topic and increase their methodological competence [24]. EO is a topic in several museums (e.g., Deutsches Museum and Deutsches Museum flight yard Schleißheim), but often reduced to the technical aspects of taking aerial photographs and satellites. At the Heidelberg University of Education, the GIS-Station, as a competence center and out-of-school learning place for digital geo-media, has been around since 2009, aiming to combine research, teacher training, and education by offering courses on topics in digital geo-media for students and teachers. Other methods of bringing EO into classrooms include e-learning and digital materials. Initiatives in this field range from interactive, web-based learning modules including digital materials such as FIS (FIS—Remote Sensing in Schools (http://www.fis.uni-bonn.de/en/node/22)) [15,25] and augmented-reality apps such as Columbus Eye (Colombus Eye App (http://columbuseye.rub.de/english/)) [26] up to e-learning platforms (Geo:spektiv (Earth observation for adolescents—Geo:spektiv (www.geospektiv.de))) with web-based EO application (BLIF (BLIF—Focus on Remote Sensing (https://server2.blif.de/login))). The last three initiatives offer ready to use materials to teachers in order to conveniently integrate EO into their school lessons. Websites such as Google Maps, Google Earth, and Bing-Maps grant easy access to integrate satellite images in lessons. The simple usage of satellite images merely as a substitute for topographic maps excludes many EO applications, whereas services such as FIS and BLIF offer students the possibility to use interactive EO applications such as false-color composites, classifications, and the usages of indices such as the Normalized Difference Vegetation Index (NDVI).
The use of geo-information technology does not automatically lead to higher learning success among students [27,28]. However, student-centered approaches facilitate an increase in student motivation [29], expertise [4], and specific competencies, such as spatial thinking [3]. Furthermore, different studies have indicated the positive effects (e.g., on performance, social presence, and enrollment rates) of using online learning resources according to gender differences in STEM education [30,31].
The learning success of students depends on their socio-cultural background, their level of general intelligence, and their teachers. In addition, motivation, self-concept and the absence of fear have a noticeable influence [32]. In terms of e-learning, motivation becomes a main factor in the success of learners. Motivation, itself, can be divided into extrinsic motivation, intrinsic motivation, and amotivation [33]. While extrinsic motivation is more restricted and artificial, intrinsic motivation is self-determined and autonomous and, therefore, more sustainable for long-term learning [34]. Ryan [34] further developed the concept of self-determination, pointing out that interest, enjoyment, autonomy, and perceived competence are important factors that influence intrinsic motivation [34,35]. Based on this theory, Wilde et al. [36] developed the short scale of intrinsic motivation (KIM), an easy to use measuring instrument for students’ intrinsic motivation during an activity [36]. A high level of intrinsic motivation, indicates that students feel successful. This is an important factor for their learning success [32].
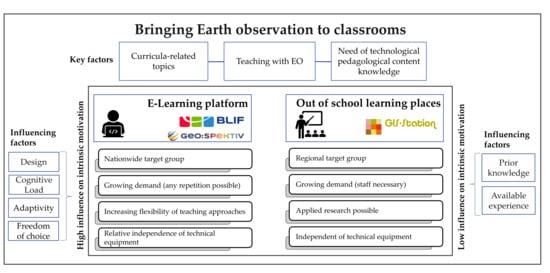
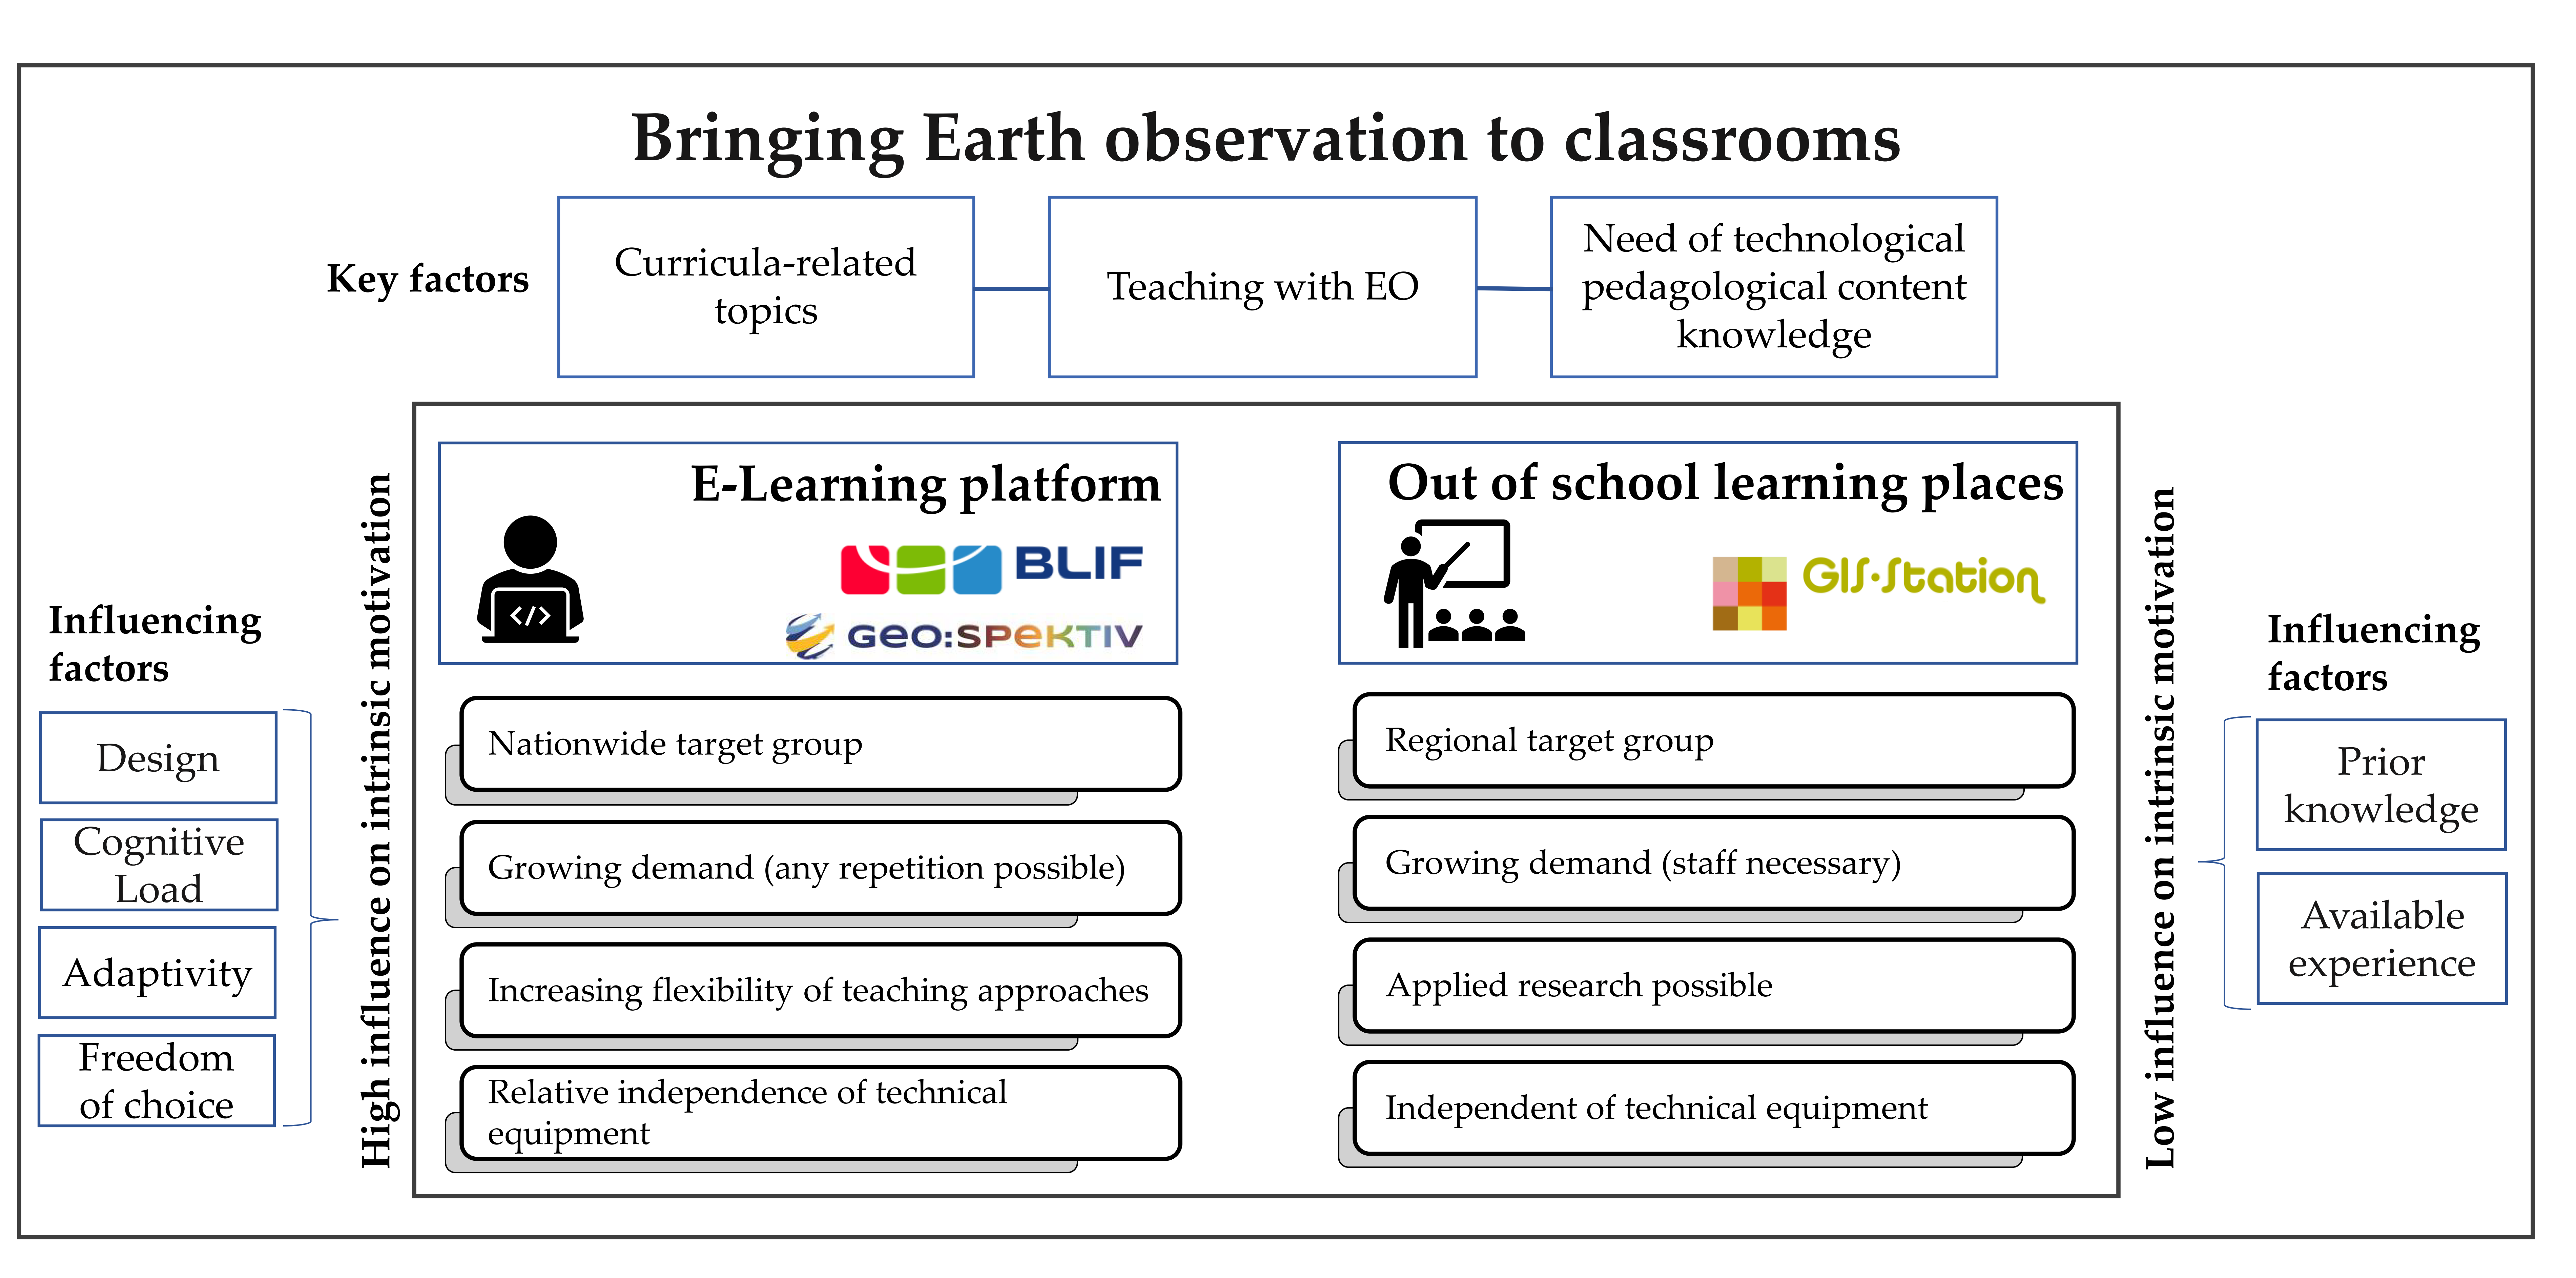
As mentioned above, the implementation of EO in classrooms is embedded in many curricula and comprises many added values and opportunities. However, there are many constraints in using such technologies in schools, including a lack of EO-specific TPACK among teachers as well as a lack of technical equipment. There is a need to highlight the factors that influence the successful use of diverse learning applications, how to increase the quality of these applications, and how to consolidate appropriate didactic concepts. This study reveals two available approaches to implementing EO in classrooms: (1) out-of-school learning places and (2) EO-specific e-learning platforms. With a focus on secondary education, the presented study describes how to successfully implement EO and digital geo-media with topics relevant to the curricula. First, an out-of-school learning place for digital geo-media is presented. Second, Geo:spektiv as a representative e-learning platform with its module ‘Rainforest in Danger’ is presented. Based on a standardized questionnaire completed by n = 73 students in secondary education, a detailed examination has been carried out on the motivation of students, with respect to design, level of difficulty, and interest in satellite images of the module. To cross check and validate our detailed results, we analyzed and compared the factors that influence the successful use of two additional Geo:spektiv learning modules (n = 208) among secondary school students.
2. Materials and Methods
2.1. Embedding Earth Observation in School Curricula
As already mentioned, the GIS-Station was initiated in 2009 as an out-of-school learning place and further education center. Since then, all student courses and teacher training have been evaluated and statistically recorded in order to determine how relevant the topics around digital geo-media are for everyday school life and which courses can be newly developed. The courses are divided into three sections—(1) Earth observation, (2) GIS and (3) mobile geo-tools.
To bring EO into classrooms and to reach schools nationwide, the free e-learning platform Geo:spektiv was developed in 2015 based on a comparative study of German curricula in secondary education to meet the needs of the teachers. The curricula in Germany are different for each federal state but overlap in many points. In order to be able to record spatial and thematic specifications uniformly and to examine them with regard to characteristics such as ‘class level’ and ‘federal state’, all entries in the curricula were recorded in tabular form, marked according to class level and assigned to a topic and a spatial category. The analysis showed that the extent, preciseness, and terminology of EO in each federal state differ according to the respective curriculum [9,37,38].
Based on these findings, practice-related case studies in relation to EO and EO data were created. The case studies, e.g., the tsunami disaster in Japan and the drought in California, were compiled in various problem-oriented and curriculum-relevant learning modules. The basic structure of all courses is similar and subject to the same quality management with corresponding testing and evaluation. Therefore, it is assumed that statements are transferable. As an example, the naming of educational curriculum-relevant content in relation to the topic of the rainforest is presented in Table 1. The ‘Rainforest in Danger’ module was designed on this basis.
This excerpt illustrates that the rainforest is a particularly relevant topic in geography lessons in grades 7, 8 and 9 (age 11–14) for secondary education and in the curricula of federal states. Based on the above-mentioned curricula analysis, ten learning modules were created.
The structure and design of the e-learning platform Geo:spektiv is currently unique in the field of education and EO, as the learning platform with its thematic content is linked with the web-based EO application BLIF. The students pass through a module of a specific topic and solve tasks to test their learning success. In addition to different types of quizzes, satellite images must be analyzed, processed and interpreted. In addition to false color images and classifications, the NDVI as a vegetation index can be calculated or the extent of areas can be measured. For correct answers to questions and quizzes, students receive points, which are awarded as a certificate at the end of the module.
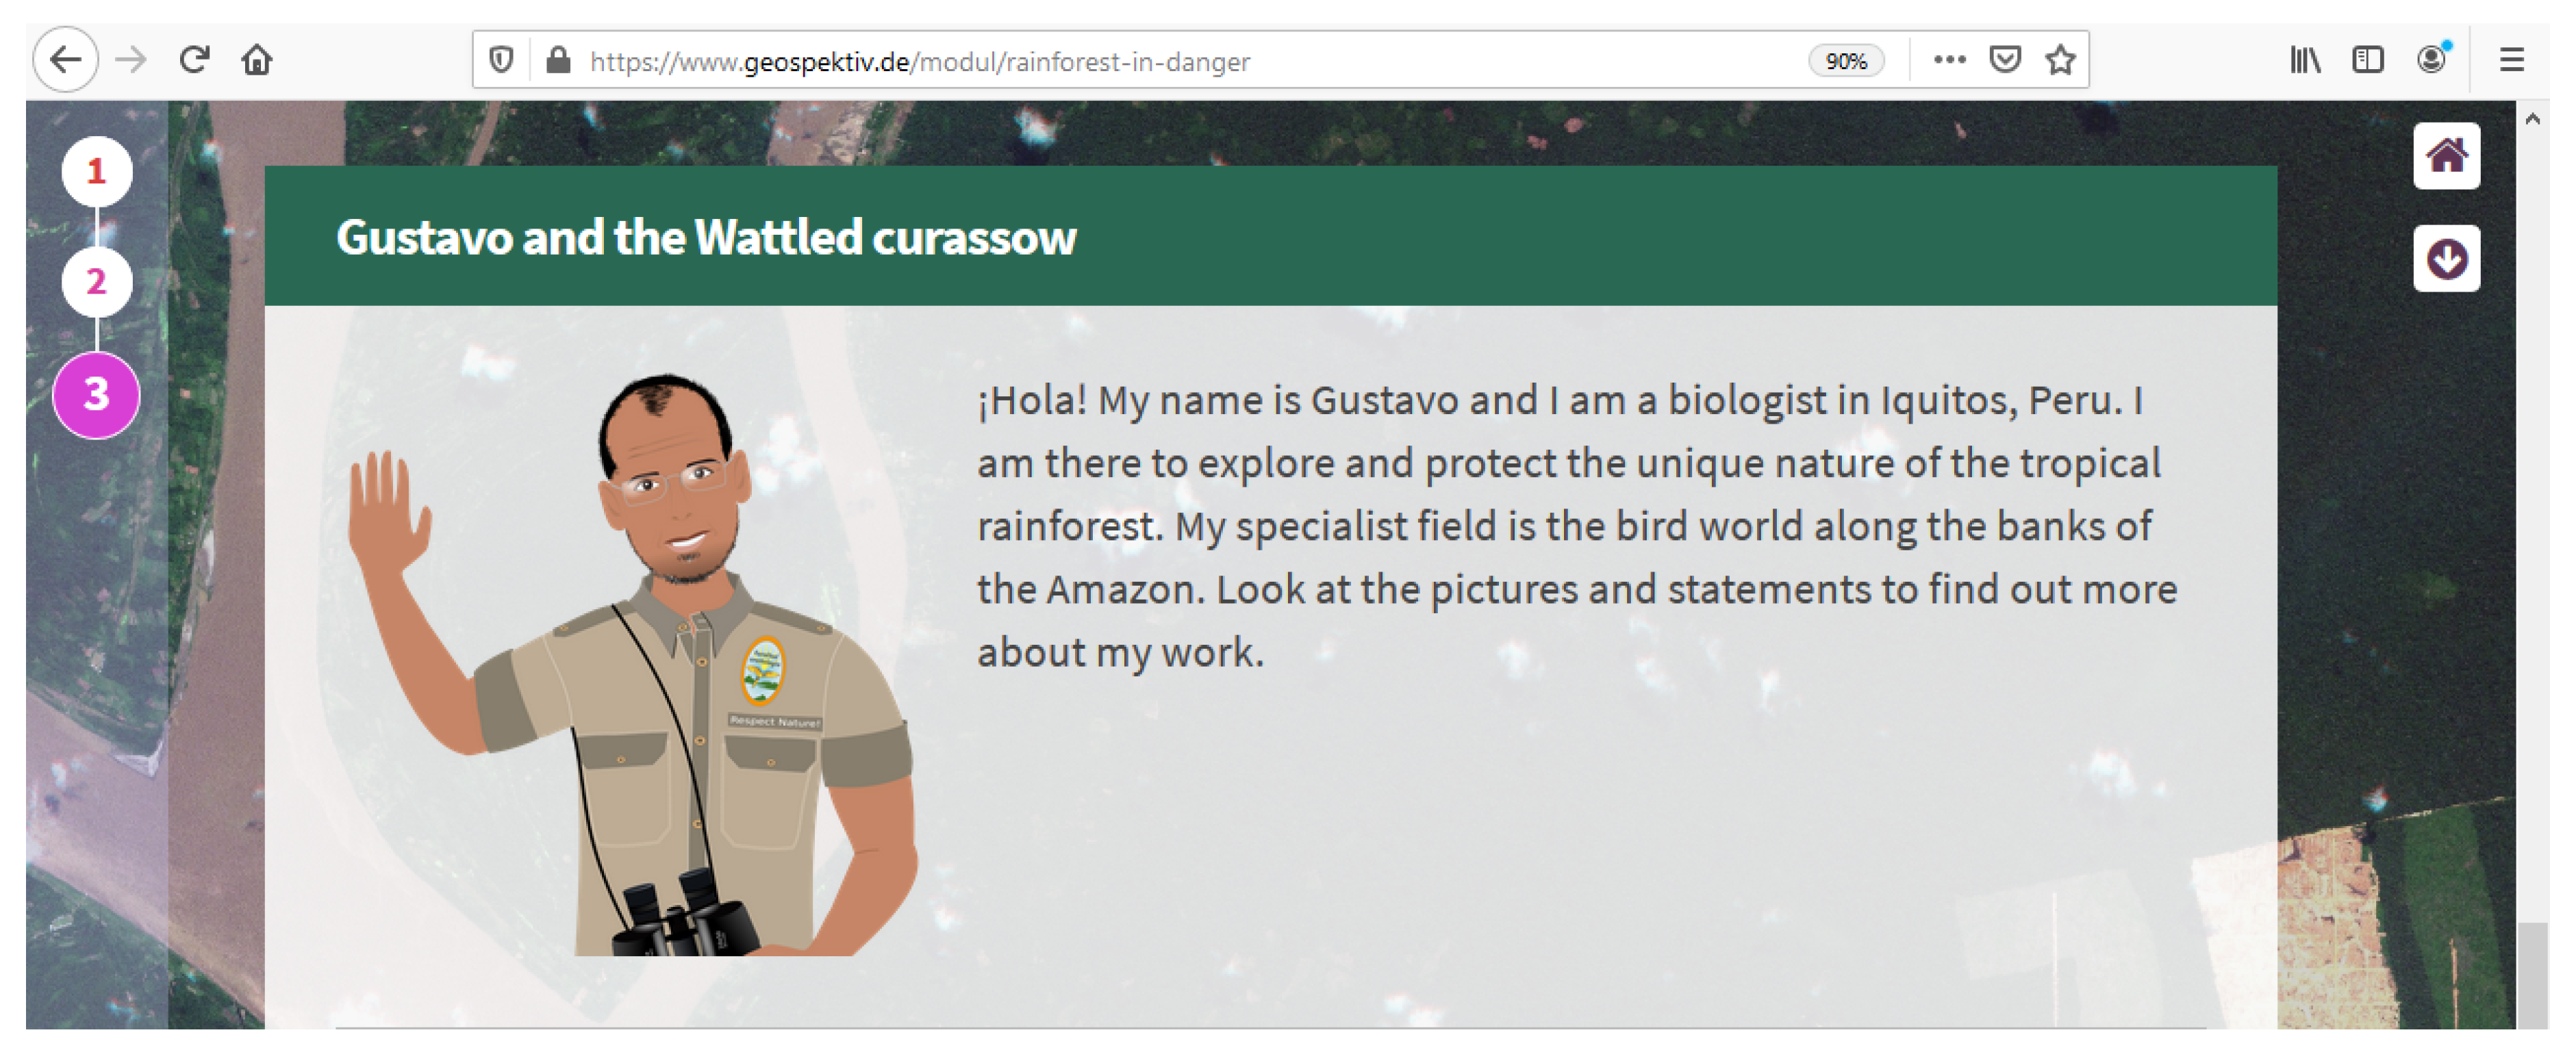
Special emphasis was placed on a student-friendly design: short learning units within the modules, different quiz formats, and video and interactive content in order to ensure variety for the students. For the lower class levels, a fictional character (see Figure 1) guides the students through the modules and accompanies them until successful completion (use of the personalization principle). Relevant images and graphics are also deliberately included in order to convey the learning content both textually and graphically (use of the multimedia principle). Following the coherence principle, only information and content necessary for the module are presented in order to maintain focus on the topic. Interactive maps, for example, are directly embedded in the module and do not have to be called up separately [43].
In terms of individual and self-reliant learning [44], potential adaptivity has been added to the learning modules as a unique feature in the current EO learning platform environment. For a more detailed description of how adaptivity of Geo:spektiv works and how it is implemented, see Matusch et al. [45]. The platform has been fully operational since 2018 and can be used by everyone for free. In addition, translations of the courses into English and Spanish also enable use in bilingual teaching.
2.2. The ‘Rainforest in Danger’ Module
In our study, the Geo:spektiv modules ‘Rainforest in Danger’, ‘Life at the Volcano’, and ‘Flood Disaster in Germany’ were evaluated. To depict the operation mode and adaptivity of Geo:spektiv, the ‘Rainforest in Danger’ module is described as an example in the following subsection. It is similar to all other modules in terms of composition, technical specifications, and adaptation possibilities. The module deals with the Peruvian rainforest as a specific biodiversity hotspot, its potential, threats, and how it can be observed using satellite images. According to the German curricula, the module is aimed at 12–13-year-old students (corresponds to class 7/8 in Germany) and lasts a duration of 90 minutes.
The fictional character ‘Gustavo’, a biologist from Peru, guides the students through the module (see Figure 1). The students are supposed to ‘support him’ in his everyday work to protect the rainforest and the home of the Wattled curassow (Crax globulosa). A dark green was chosen as the accent color to match the content. The background image consists of a section of the satellite scene to be edited later.
In the case study on the Peruvian rainforest, the students work with selected Landsat 8 scenes, showing the intact rainforest in comparison to the deforested areas for the plantations.
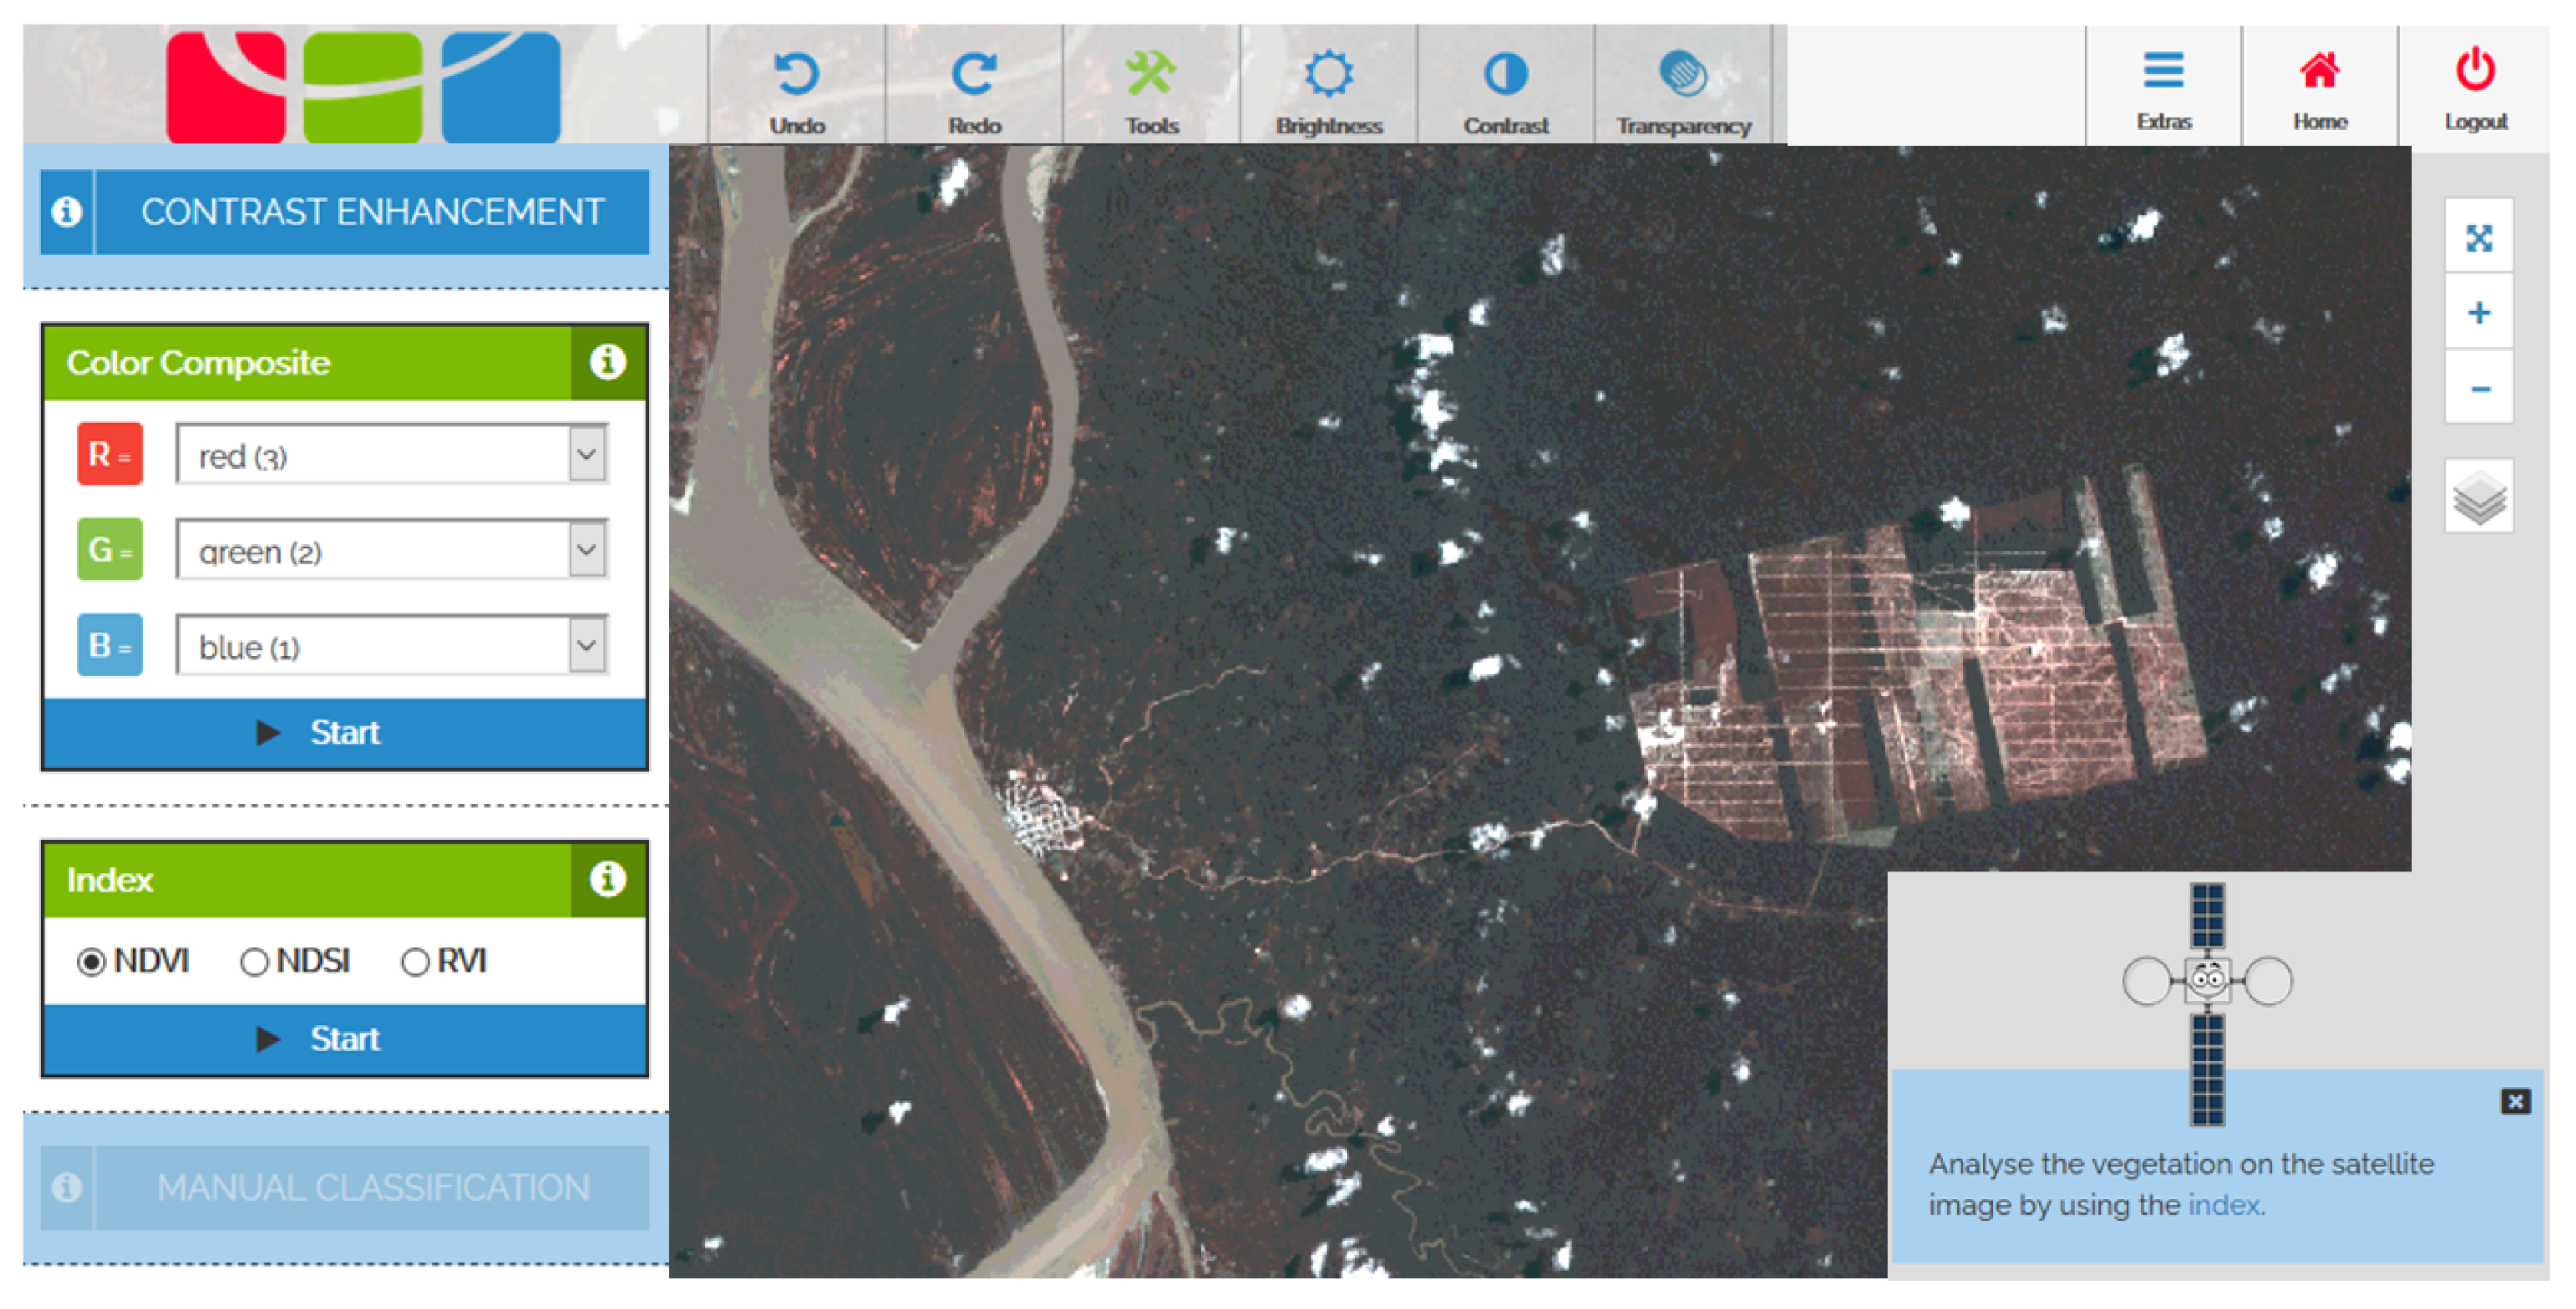
To enable the students to work with the satellite images, the learning platform Geo:spektiv is linked to the web-based EO application BLIF (as illustrated in Figure 2). Within the individual learning units, the students are guided to BLIF for the analysis and processing of satellite images. The Landsat images used offer the advantage of free availability at a global scale and a possible retrospective view of recent decades. In the web-based application, they are guided step by step and are accompanied by additional information throughout the exercise.
To enable later comparisons of students results, it is possible to export the edited satellite image, e.g., in false colors or the classification result, and save it in a common storage format. The students work their way through the module individually but will receive the same results and gain a certificate of their individual learning success afterwards.
2.3. Data collection
In 2017, the rainforest module was carried out by four classes—a total of total 73 secondary education students—at the DLR school lab in Oberpfaffenhofen, Germany. Subsequently, the students completed a standardized questionnaire with 22 closed items (5-point Likert scale) concerning their opinions on the topic, structure, usability, media used, and design of the learning module. In addition, 12 questions from the short scale on intrinsic motivation (KIM) from Wilde et al. [36] were added. The KIM includes three questions for each of the factors ‘interest/enjoyment’, ‘perceived competence’, ‘perceived choice’, and ‘pressure/tension’. All 34 questions can be found in the Appendix A (Figure A1).
All 73 questionnaires were completely filled. In most cases, the Likert scale runs from 1 ‘totally disagree’ to 5 ‘totally agree’; in other cases, the scale of the questions was aligned to obtain comparable results. Afterwards, the three questions for each of the factors of the KIM were grouped into the factors ‘interest/enjoyment’ (F1), ‘perceived competence’ (F2), ‘perceived choice’ (F3), and ‘pressure/tension’ (F4) [36]. Because other questions provided answers to similar issues, the items Q12, Q13, Q14, Q15, Q19, and Q20 were grouped into the factor ‘design’ (F5) and the items Q8, Q9, and Q10 into the factor ‘interest in satellite images’ (F6). For all grouped factors, the mean value of the items was calculated. Table 2 illustrates the grouped questions and Cronbach’s alpha for each factor.
A correlation analysis was carried out to determine indicators for interrelations between factors that can be modified in an e-learning module such as the design or the media used. Therefore, a correlation matrix with all one- and multidimensional variables was calculated using Pearson’s r (Figure A1). The p-values were calculated too.
In a second step, the students were twice divided into two groups, according to their prior knowledge on (i) the topic of the rainforest module, and (ii) their experience of working with satellite images. In the first group of the first division, 42 students had dealt with the topic of the rainforest module before, whereas 26 students from the second group did not. In the group of the second division, 39 students had dealt with satellite images at least once a month, whereas the second group (19 students) had dealt with satellite images less than once per month. As some students selected ‘unable to answer’, less than 73 students were in both divisions. To take a closer look at the similarities and differences for the above-mentioned factors, F1–F6, for boxplots were calculated these four groups (see Figure 8). Additionally, the mean value and the standard derivation were calculated. For a better understanding, all values were rounded to two digits. Data analysis and calculation were carried out using python 3.0 with the pandas, numpy, and scipy library.
For validation reasons of the obtained results from the first dataset, we analyzed two additional datasets. These two datasets contain the answers to the same questionnaire from secondary education students, completed after performing the learning modules ‘Life at the Volcano’ (n = 134) and ‘Flood Disaster in Germany’ (n = 74) at the DLR school labs. For both datasets, the values and correlations of the six factors, F1–F6, were calculated and compared to the values from the first dataset.
3. Results
With the growing importance of geo-technologies in many sectors, the described implementation of related competencies into the educational landscape is of vital importance.
3.1. Brief History of the Course Development at the GIS-Station
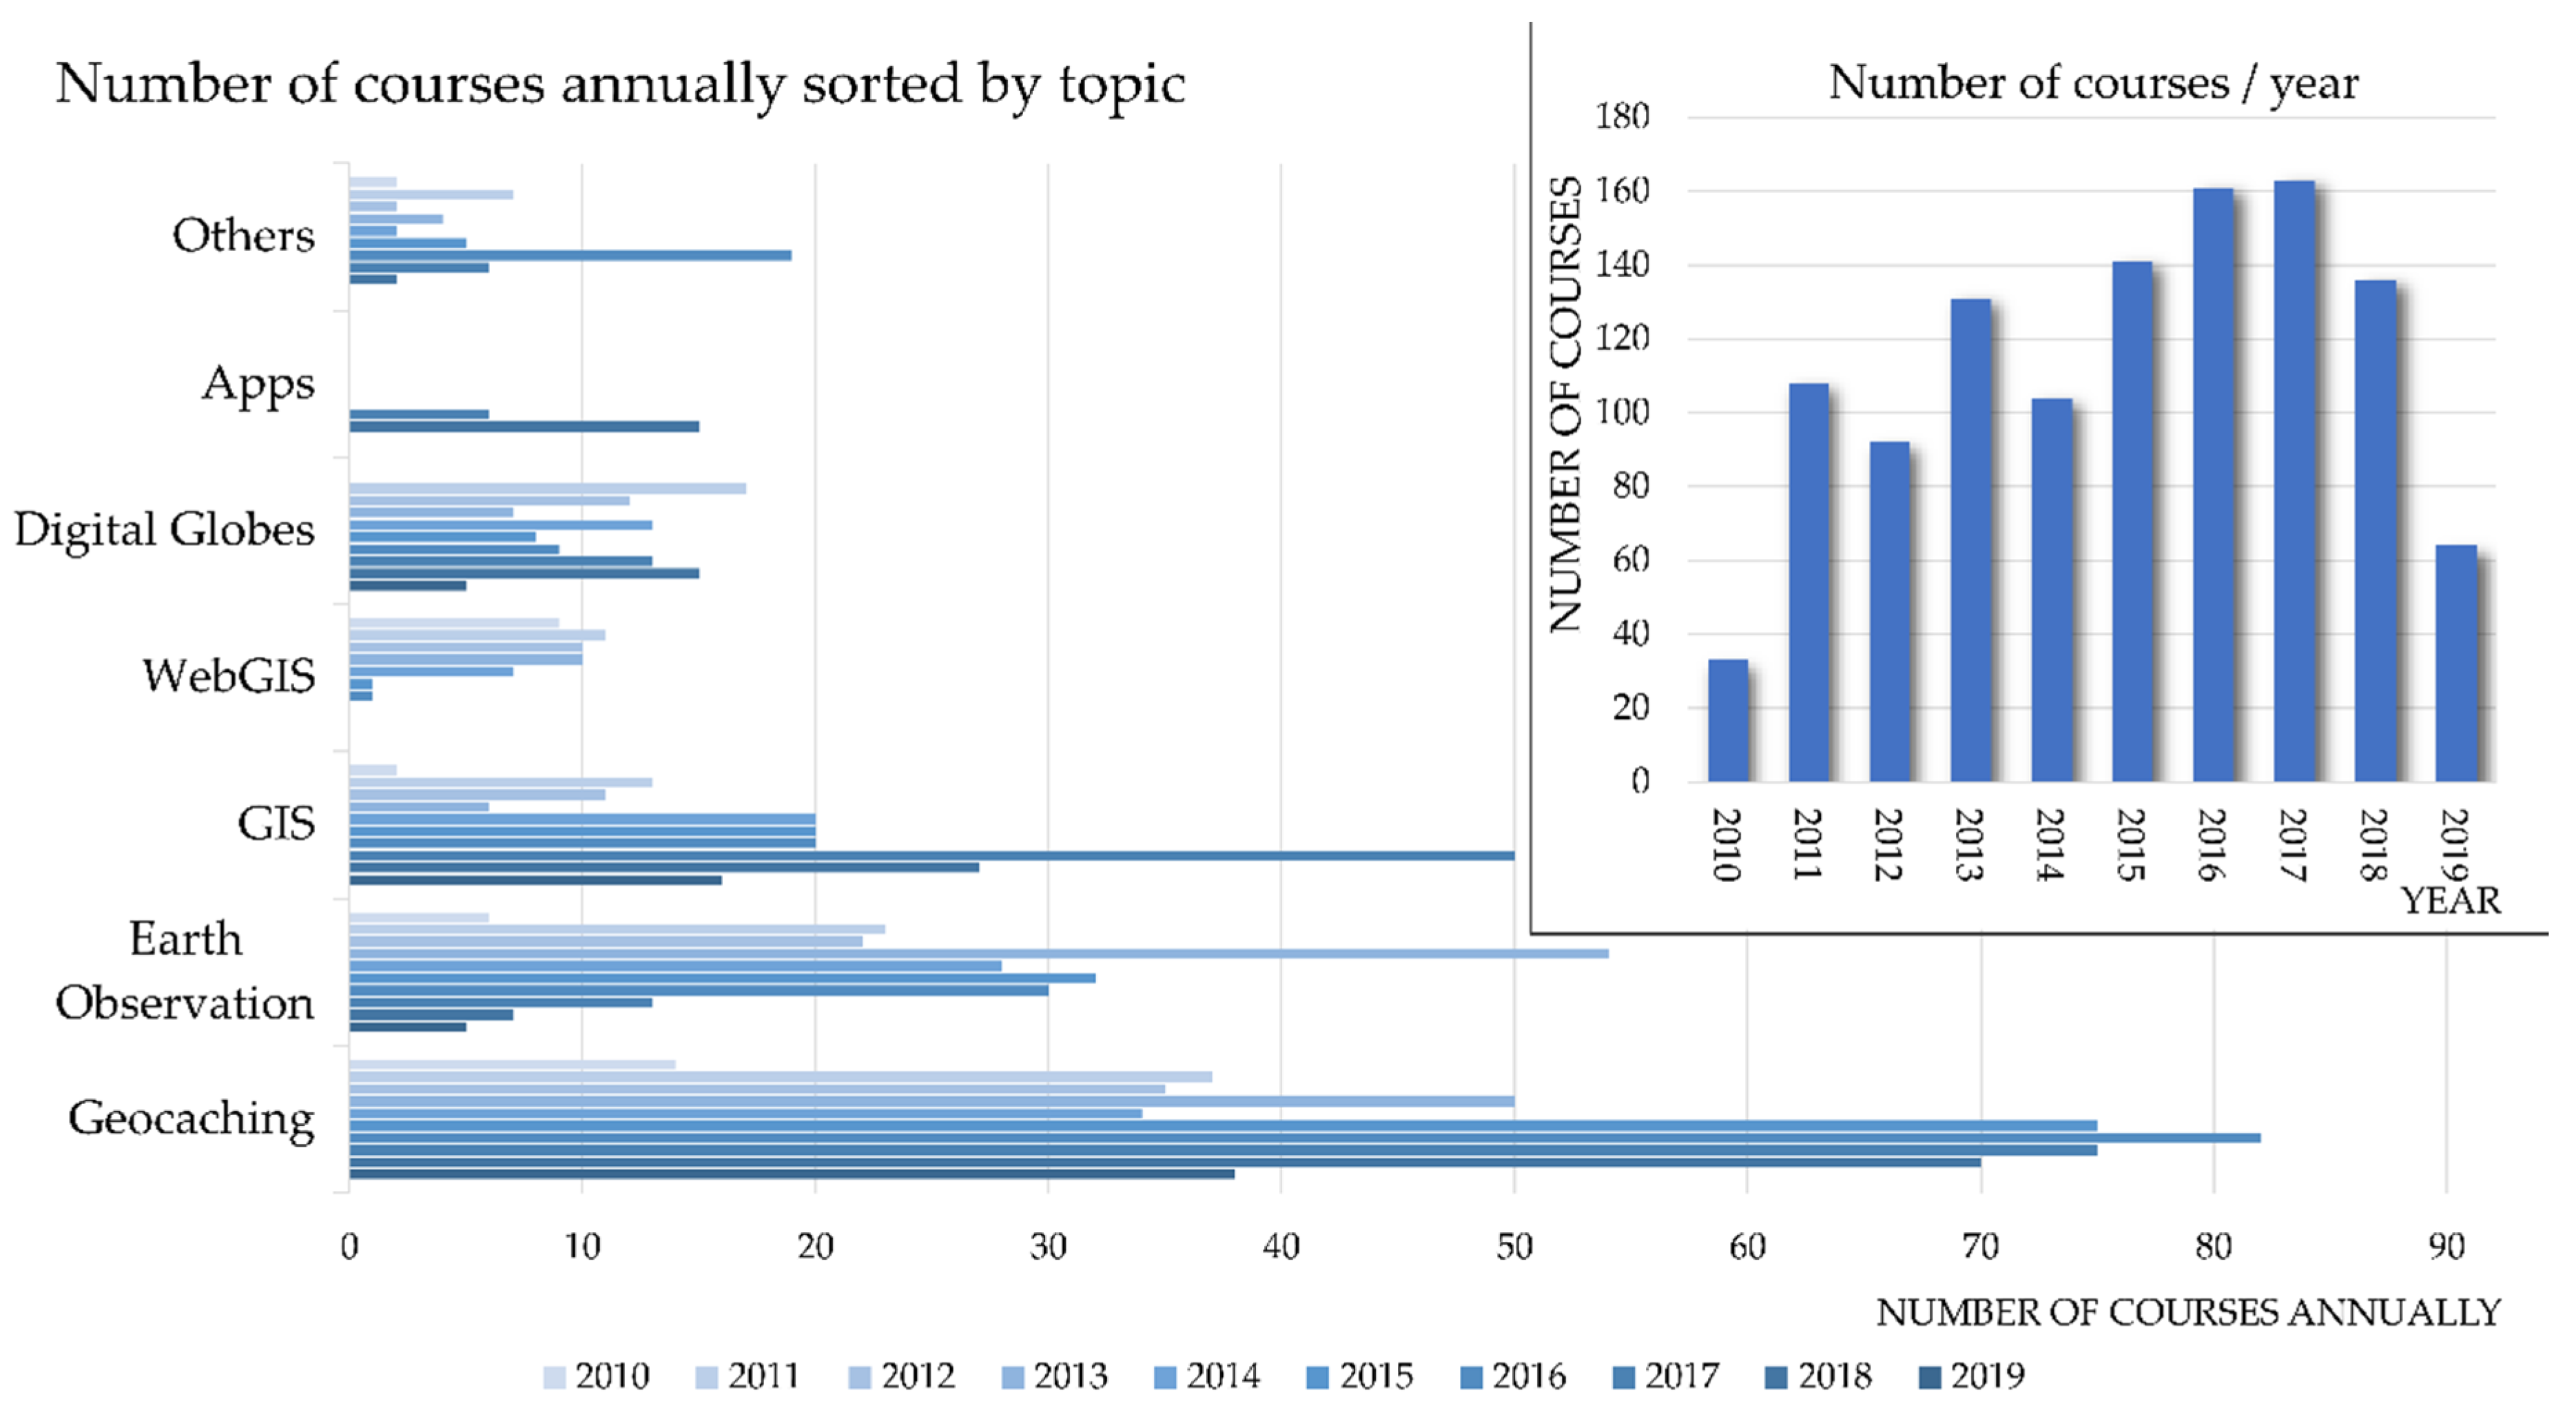
Activities carried out at the GIS-Station were motivated by the need to mitigate explained shortcomings and to build up the competences of teachers and multipliers. Since the establishment of the GIS-Station, more than 1100 courses with almost 20,000 participants were conducted. This included inter alia courses related to EO (221), GIS (244), digital globes (99), and geocaching (515). Due to a growing capacity and professionalism, a steady increase in conducted courses, especially between 2010 and 2017, has been recorded (see Figure 3). Currently, the out-of-school learning place offers 58 different courses on EO, GIS, and mobile geo-tools. As an extracurricular teaching and research institution, the main target groups are students (15,323) and teachers (642). However, other stakeholders also took part in the courses, e.g., trainee teachers (642), accompanying teachers (772), and multiplicators (3225). Taking a detailed look at the topics of conducted courses from 2010 to 2019, general trends become apparent. The demand for courses on digital geo-media has risen consequently over recent years. Geocaching was the topic of most conducted courses, dominating the list of topics since 2015. This is not surprising, since related competences such as competence in orientation, e.g., fostered through geocaches [5] and analysis, have already been implemented into several curricula. Additionally, the broad availability of mobile GPS devices facilitated this development.
Among other trends, the demand for WebGIS courses at the GIS-Station has gradually decreased, probably because of the launch of some comprehensive WebGIS applications in recent years in Germany (e.g., webgis.sachsen.schule and Diercke WebGIS). While the number of WebGIS courses decreased, the number of courses on digital globes as an introduction to GIS for the 5th and 6th grade classes remained stable. Here, a focus on competencies such as map reading and orientation skills for young students can be found. Most WebGIS applications are easy to handle and offer high availability even for poorly equipped schools with limited computation power. However, the number of GIS functionalities are limited in WebGIS applications [46]. The better the system requirements in the schools and the higher the class levels, the higher the demand for desktop GIS courses. Accordingly, in these courses, more complex technical and methodological competencies at the level of workplace and industry-wide technical competencies are integrated [47].
The number of EO courses increased up to a peak in 2013 and decreased afterwards to the lowest level in 2018. Surprisingly, this development is contrary to the growing importance of EO applications. The trigger was the establishment of the e-learning platform Geo:spektiv. Since its introduction, participants used the advantages of an online platform as a learning offer independent of time and place. Accordingly, the new online courses replaced the former EO courses up to a certain limit.
Based on the increasing availability of smartphones, the new topic of ‘Apps’ initially appeared in 2017 and increased in importance. This shows the growing importance of mobile devices such as GPS devices and smartphones for teaching issues. Furthermore, this illustrates the growing demand of online learning offers. Face-to-face training and direct communication remain essential but are increasingly supplemented by online offers. A guiding principle and factor of success at the GIS-Station is an interdisciplinary flexible arrangement of offered courses. The implementation of curricula is not in a linear fashion. Rather, the same competences can be acquired by students and teachers using different formats and courses.
In addition to services for school classes and students, specific courses were developed with a focus on trainee teachers, teachers, and educators in general. In these courses, methodological competences are especially imparted. By using the training of trainers (ToT) approach, it is possible to increase leverage and enable educators to conduct courses independently.
3.2. Assessment of the ‘Rainforest in Danger’ Module
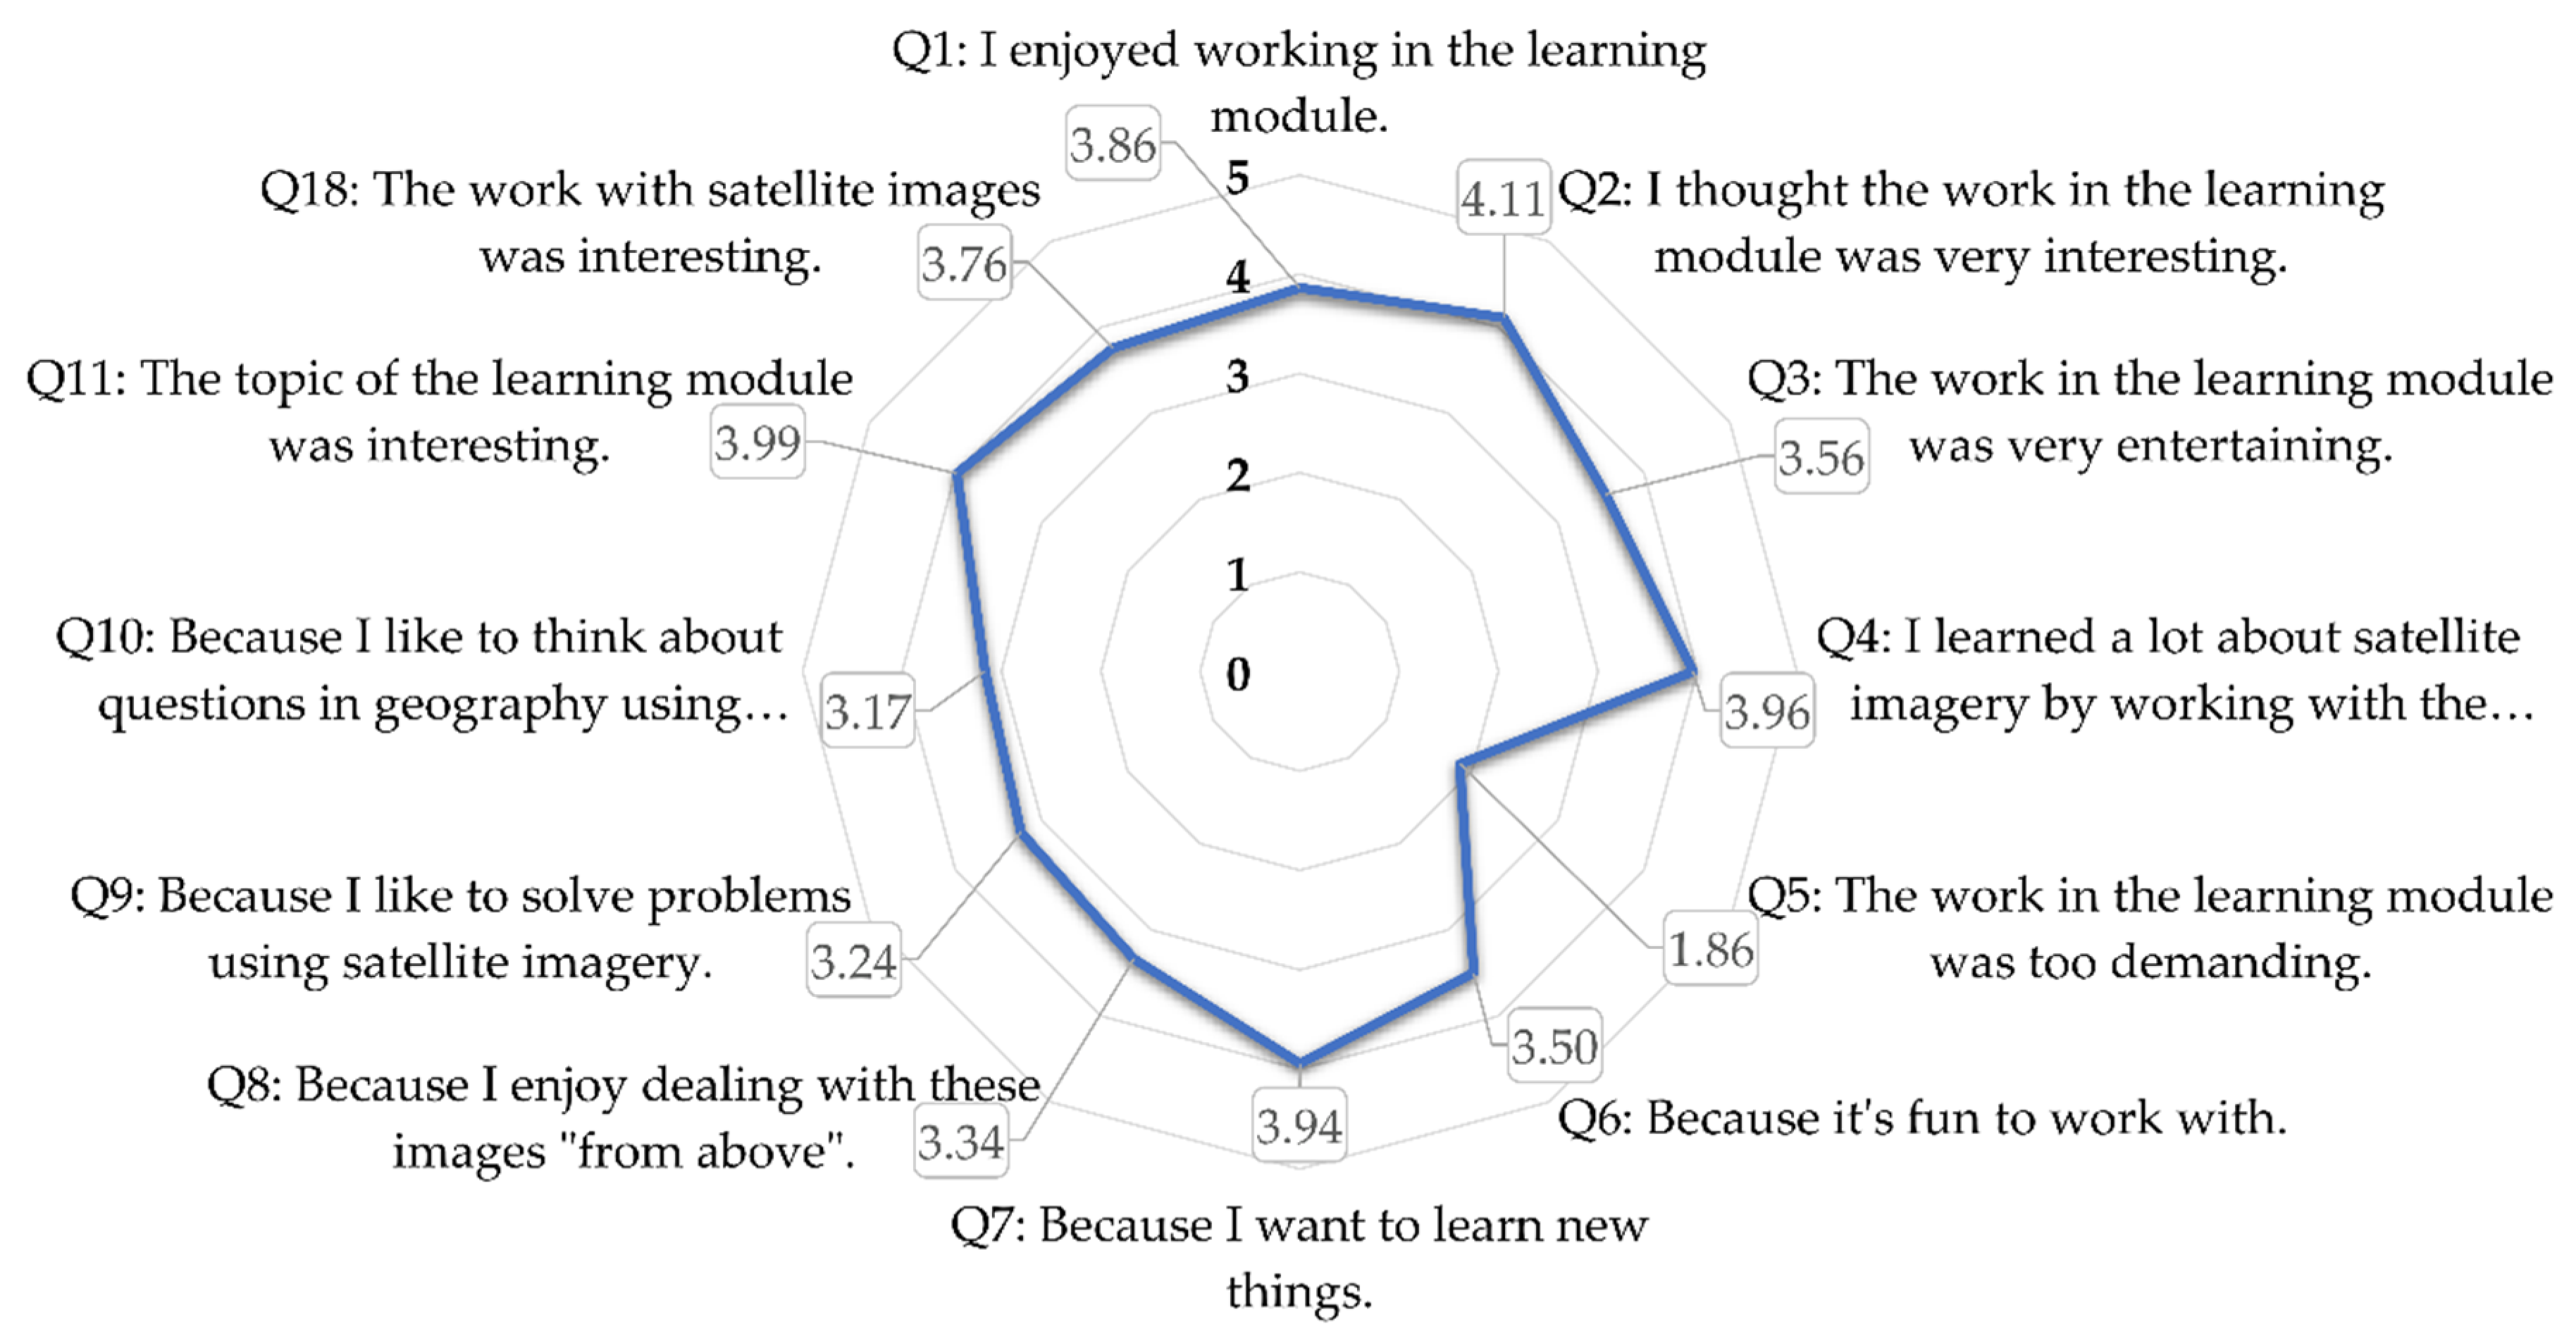
Taking a closer look at learning motivation in Figure 4, in addition to the topic of the learning module (3.99), the interest of students working with the learning module (4.11) was positively evaluated by the students. While most students stated that they have learned a lot about satellite imagery (3.96), they also stated that they enjoyed working in the learning modules (3.86). Solving problems with the help of satellite imagery was less important (3.24), but the visual appearance of the view ‘from above’ was a motivating factor (3.34). The majority of students were not overstrained by the module (1.86).
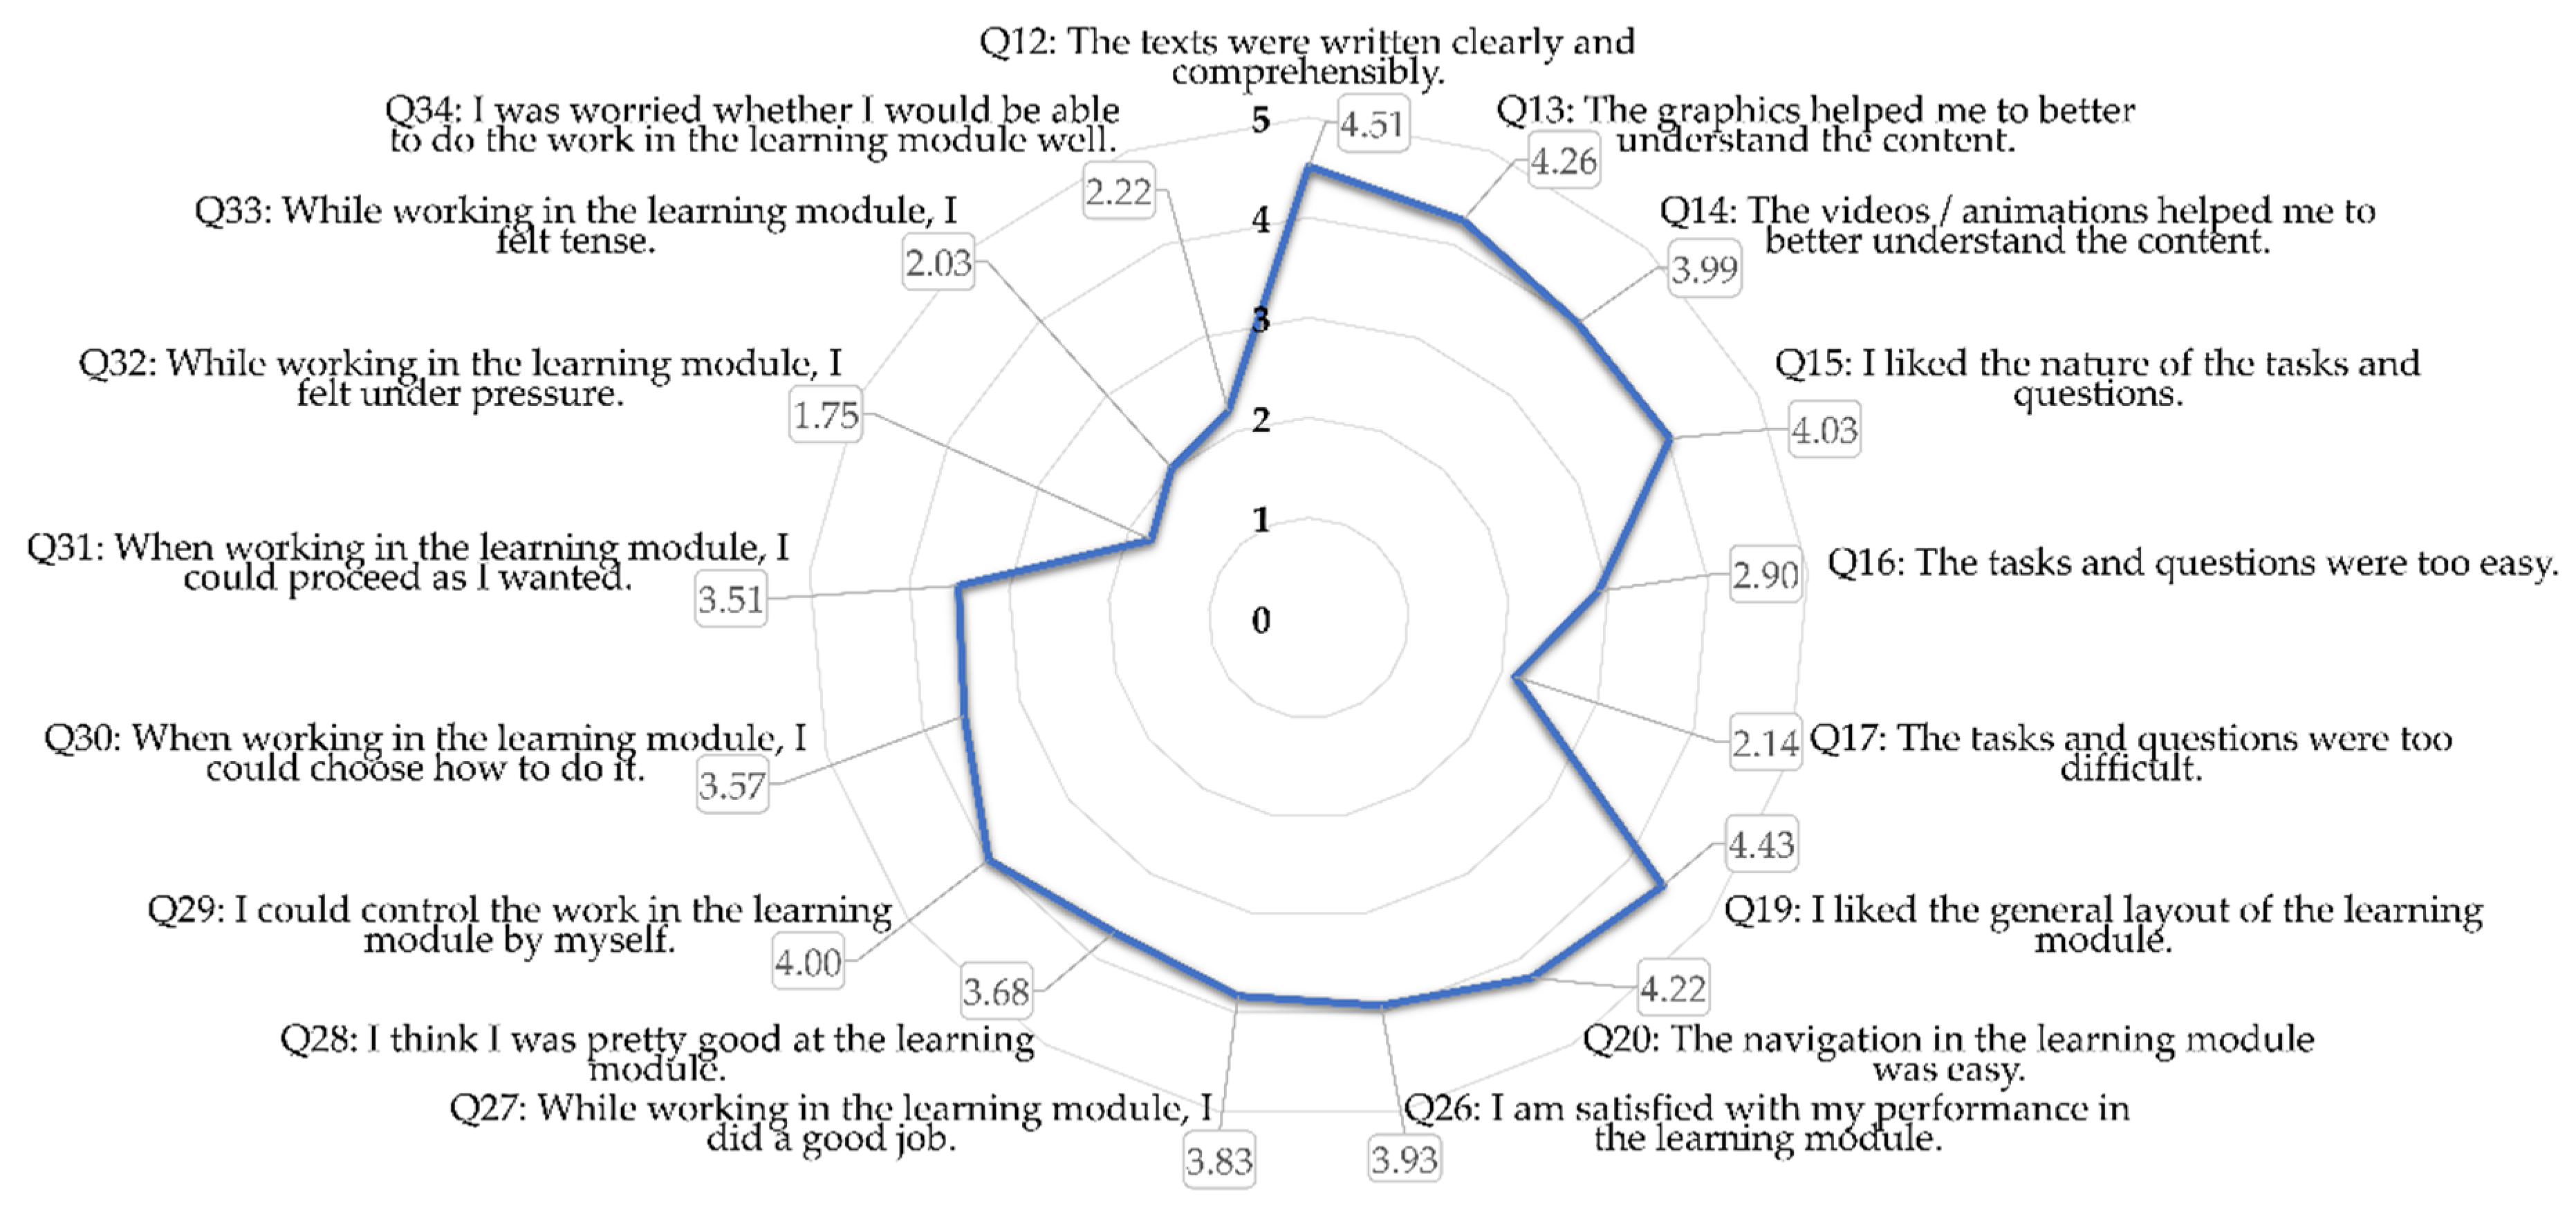
Detailed assessment of the module, as illustrated by Figure 5, reveals that, for most students, the texts were comprehensible (4.51) and the graphics as well as videos and animations helped to better understand the content (4.26). With an assessment of 2.90 and 2.14, respectively, questions were not too easy or too complicated. Again, there were very positive ratings for the layout (4.43), which also helped in navigating through the module (4.22). Accordingly, students felt quite independent and were able to control their own work (4.00). Most of the students felt no pressure or tense while working in the module (1.75/2.03). Eventually, students were mostly satisfied with their performance (3.93) and work that they had performed (3.83).
3.3. Correlation Analysis for the ‘Rainforest in Danger’ Module
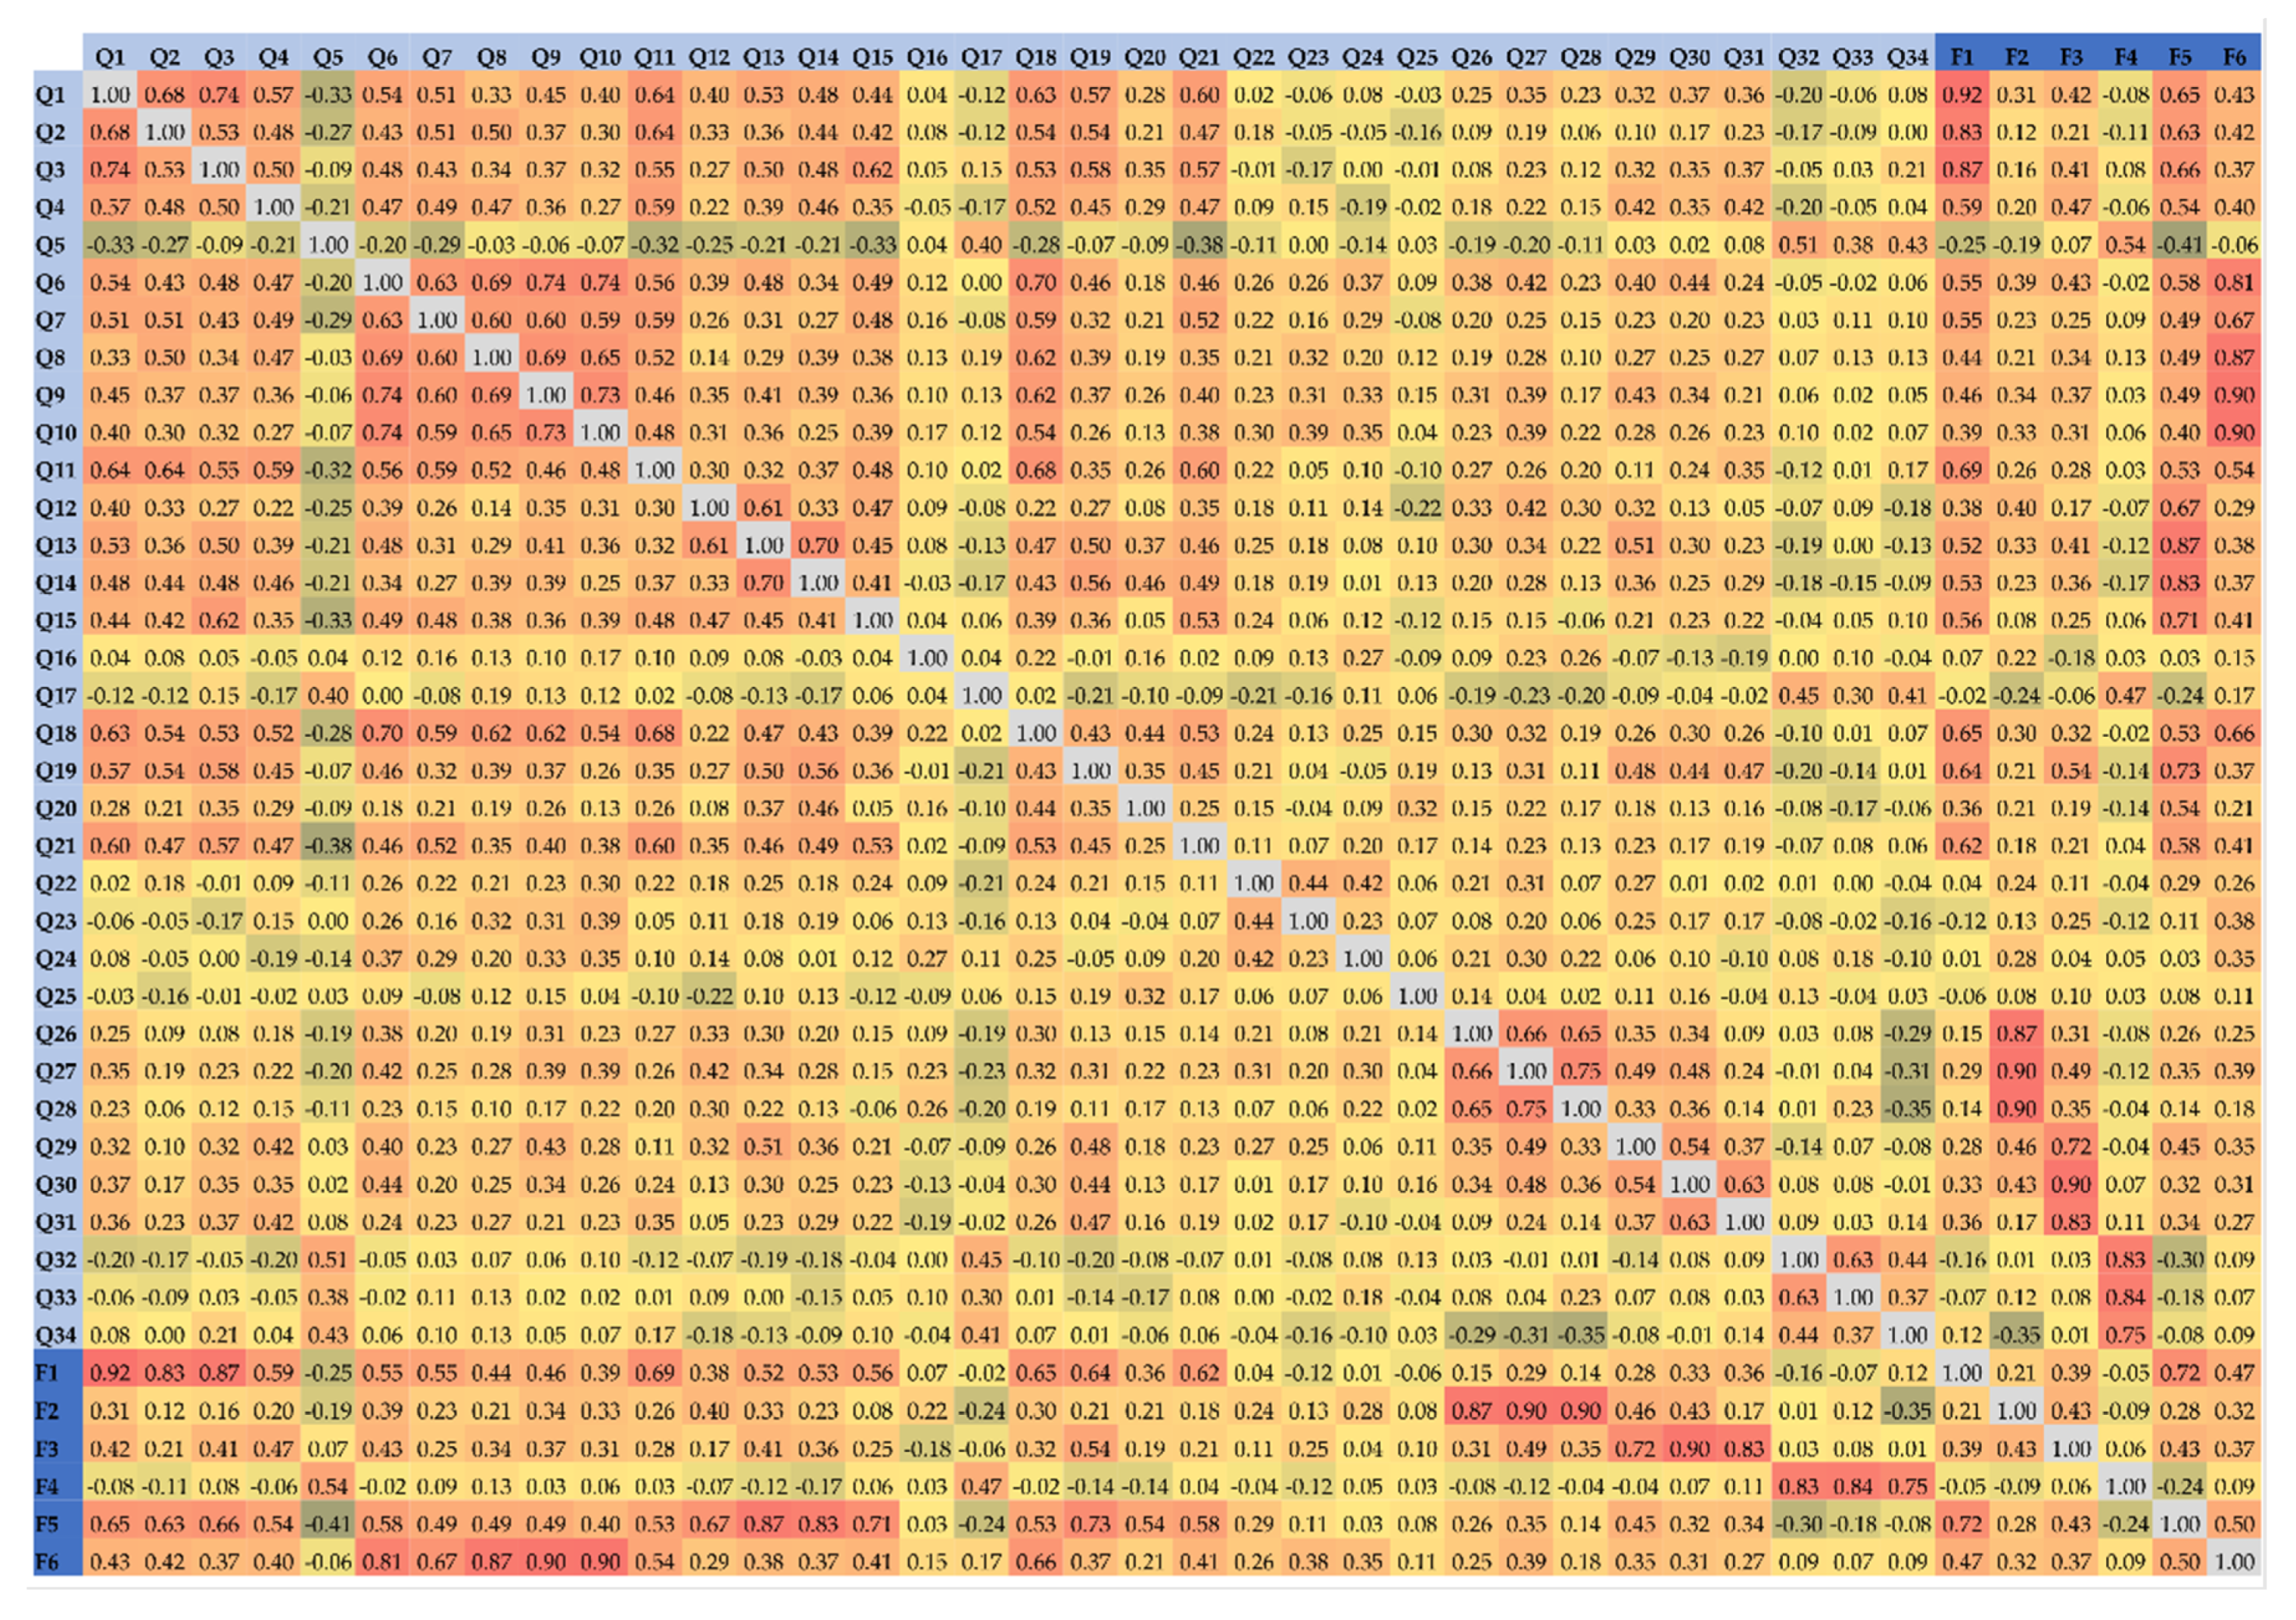
Based on the students’ assessment described in Section 3.2, it is important to find out the decisive catalyst of student’s motivation and learning success. The complete results of the correlation analysis are available in the Appendix A as Figure A1. They include the factors of the short scale of intrinsic motivation by Wilde et al. [36] and the two additional factors. The correlation analysis of 34 questions answered by the students and six calculated factors gives new insight into the relations between the different factors. As mentioned above, particularly strong correlations were assessed for questions focusing on the same factor. Those significant correlations indicate that the intrinsic motivation of learners is dependent on varying factors. Our analysis indicates that a few factors with major significance for the motivation of learners exist. According to Wilde et al. [36], the calculated factors (F1–F6) are particularly interesting for deriving general statements [36]. This is specified, e.g., for the topic of interest (Q1, Q2, and Q3) and competence (Q26, Q27, and Q28). All mentioned correlations have p-values under 0.05 and are, therefore, significant. As shown in Figure 6, focusing on the overstraining of students (Q5), a weak negative correlation (−0.33) was found with fun (Q1), interest in the topic (−0.32, Q11), or the nature of tasks and questions (−0.33, Q15). In contrast to this, a moderate correlation (0.51) was found with pressure (Q32). Almost strong correlations (0.68) were identified between an interest in working with satellite images (Q18), a general interest in the topic (Q11) and fun working with satellite images (0.70, Q6). A moderate correlation (0.54) was found between the design of (F5) and navigation within the learning module (Q20). Furthermore, the layout influenced the students perceived freedom of choice. There is a moderate correlation (0.54) between perceived choice (F3) and the question concerning the layout (Q19).
Keeping in mind that various questions were summarized into the six factors, several strong correlations are not specifically mentioned and illustrated in Figure 6. This includes correlation between F1 ‘interest/enjoyment’ (Q1, Q2, Q3), F2 ‘perceived competence’ (Q26, Q27, Q28), F3 ‘perceived choice’ (Q29, Q30, Q31), F4 ‘pressure/tension’ (Q32, Q33, Q34), F5 ‘design’ (Q12, Q13, Q14, Q15, Q19, Q20), and F6 ‘interest in satellite images’ (Q8, Q9, Q10), which are given in Figure A1 in the Appendix A. The first four factors (F1–F4) represent the above-mentioned short scale of intrinsic motivation by Wilde et al. (2009) [36], while design and interest in satellite images represent added factors, contributing additional value to the evaluation. Focusing only on these factors, the strongest correlation (0.72) can be found between ‘interest/enjoyment’ (F1) and the ‘design’ of the learning module (F5). Regarding the interest of students, further particular positive correlations were assessed with the topic (0.69, Q11) and the course, itself (0.62, Q21). The factor ‘pressure/tension’ (F4) does not correlate positively with any other factor. However, there is a weak negative correlation (−0.24) with the factor ‘design’ (F5).
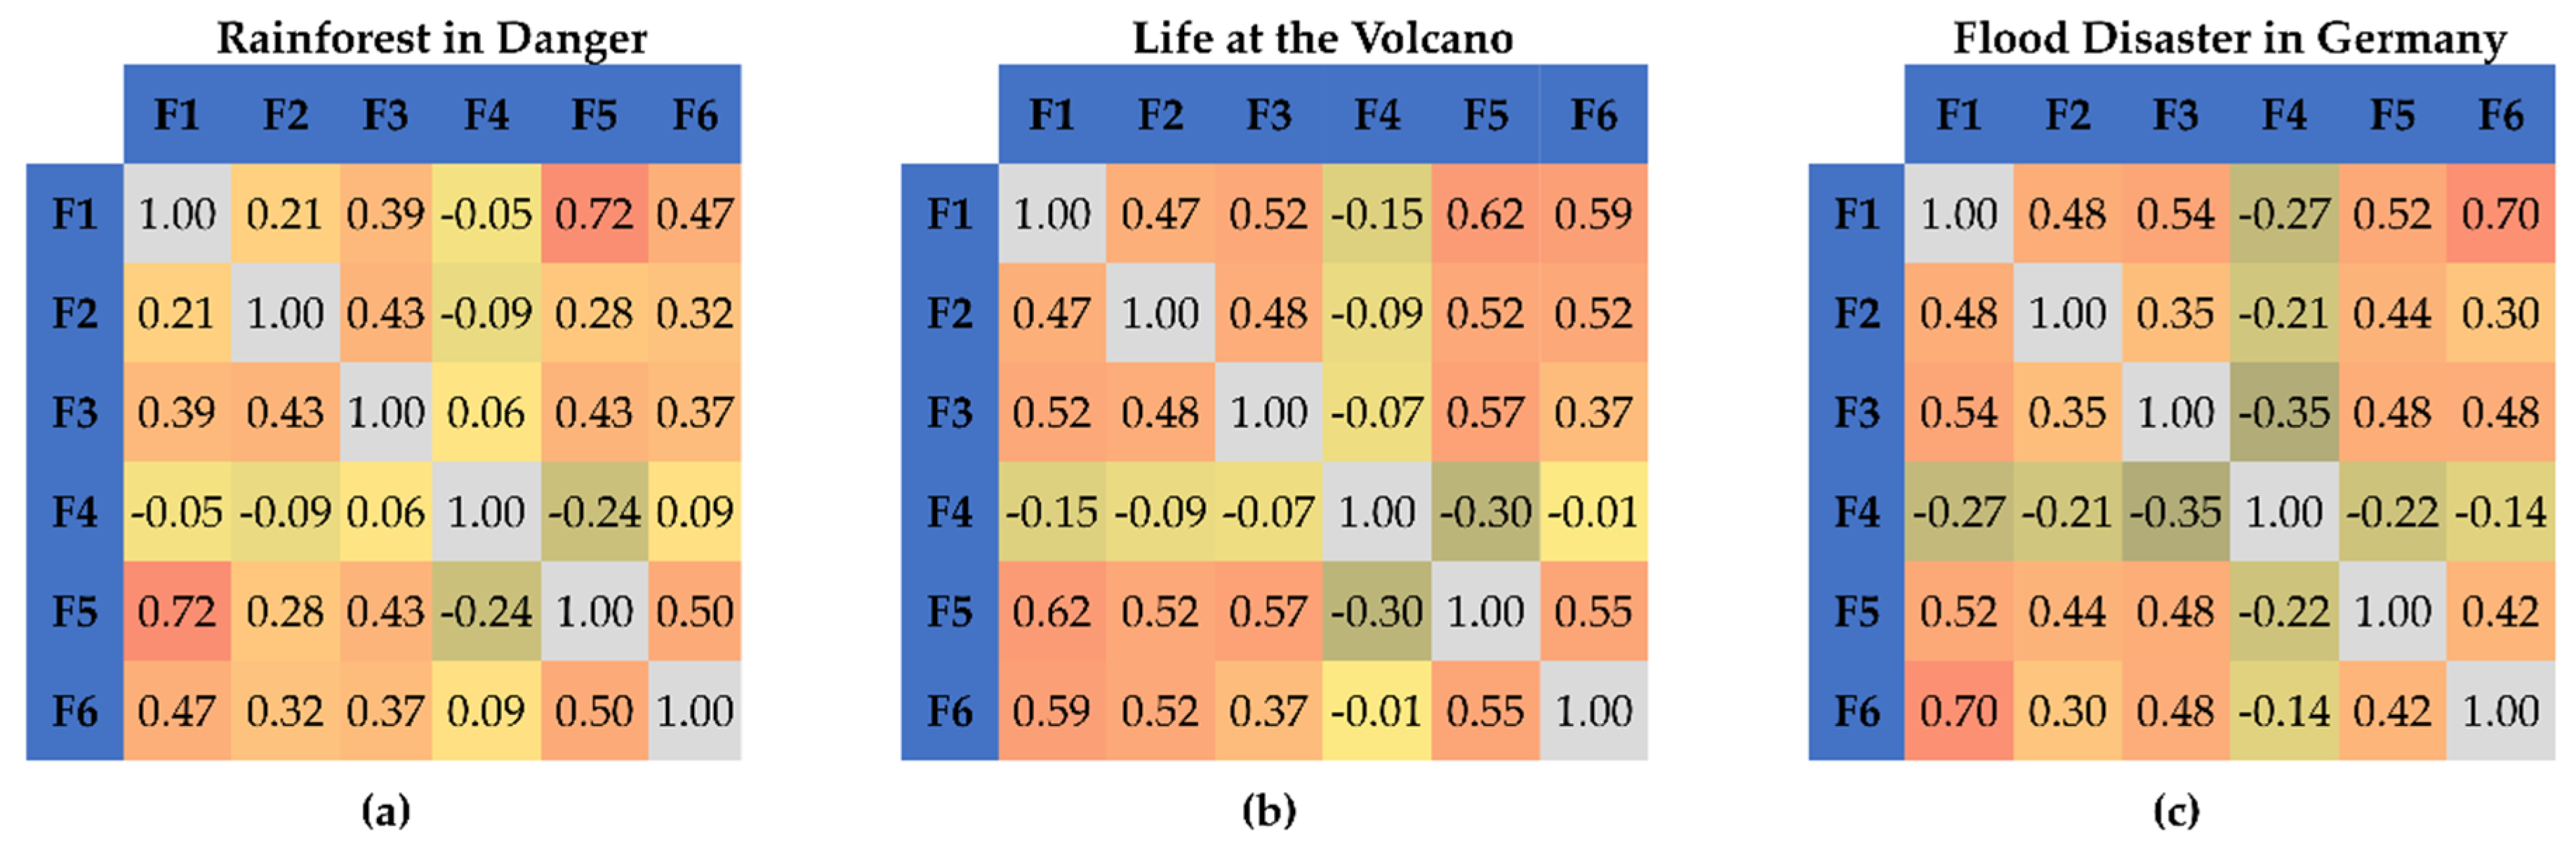
3.4. Comparison with other Learning Modules
To validate our findings, we compared the six calculated factors from the ‘Rainforest in Danger’ module with two other evaluated learning modules. Despite a few differences, the general statements remain constant. In the other examined learning modules, the ‘interest/enjoyment’ (F1) of the students is more important to achieve higher ‘perceived competence’ (F3) and ‘perceived choice’ (F4), visible by larger correlations between F1 and F2 as well as F3 in Figure 7. Further, ‘interest in satellite images’ (F6) is slightly more important for the other two analyzed learning modules. The factor ‘design’ (F5) remains important, but even more for ‘perceived competence’ (F3) and ‘perceived choice’ (F4). As desired when creating the learning modules, the factor ‘pressure/tension’ (F4) in the other two learning modules is slightly negatively correlated with ‘interest/enjoyment’ (F1), ‘perceived competence’ (F3) and ‘perceived choice’ (F4), and ‘design’ (F5).
Due to the limited sample size, thematic differences and corresponding contents of the learning modules as well as the correlations between the factors differ. However, by performing a cross check using the results of two other examined learning modules, findings from the ‘Rainforest in Danger’ module can be confirmed.
3.5. Influence of the Prior Knowledge
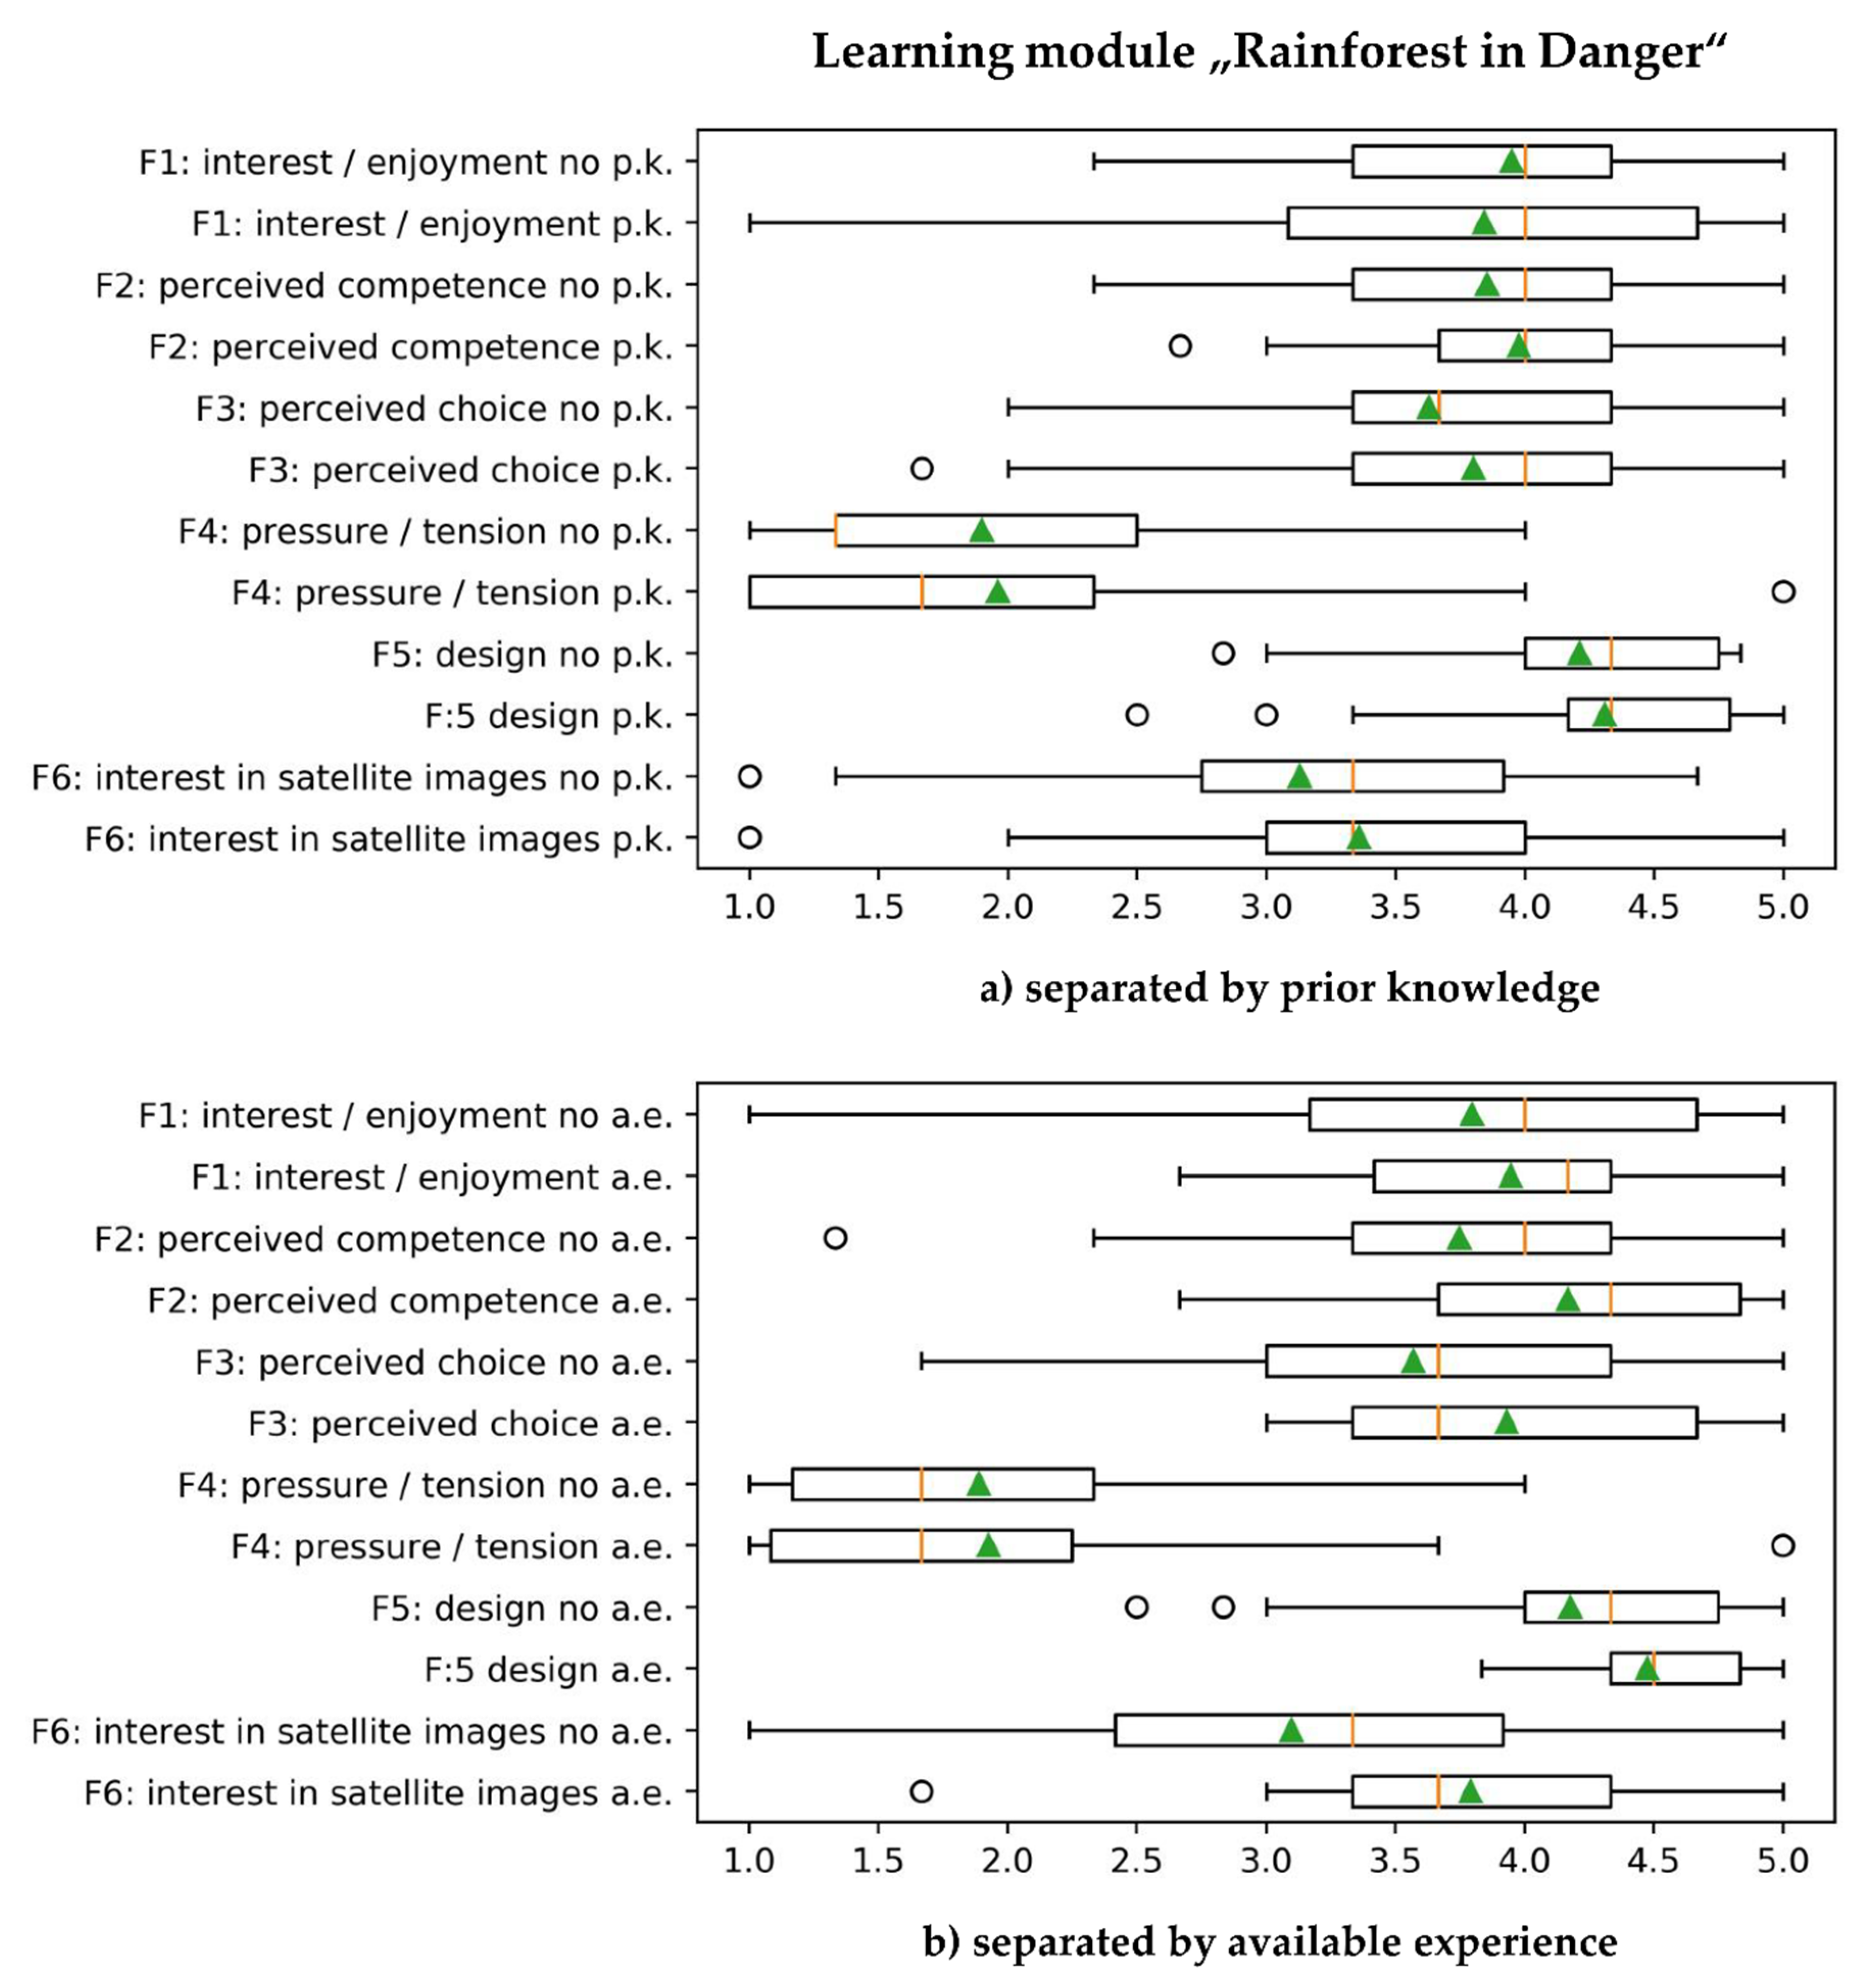
According to their prior knowledge (p.k.), students were divided into two groups. As illustrated by Figure 8, the mean values, first quantile, and median values are above three for all factors, except for F4 ‘pressure/tension’. As shown in the upper boxplot, for F1 (4), F2 (4), F5 (4.33), and F6 (3.33), the median values for both groups are similar. The values differ markedly only for F3 and F4. Students with prior knowledge evaluated ‘perceived choice’ higher (4) than students without prior knowledge (3.67). Further, students with prior knowledge felt slightly higher ‘pressure/tension’ (1.67) than students without prior knowledge (1.33). For all six factors, the standard derivation is below one.
When focusing on their available experience (a.e.) of working with satellite images and dividing students in two distinct groups, the mean values, first quantile, and median values for all factors are above three, except for F4 ‘pressure/tension’ (both groups) and F6 ‘interest in satellite images’ for the group with no experiences. For F1 (4.17, 4), F2 (4.33, 4), and F5 (4.5, 4.33), the median values for the experienced group are marginally higher. This also applies to F6 (3.67, 3.33), but in comparison with slightly lower median values. For the remaining factors, F3 (3.67) and F4 (1.67), the level of experience of working with satellite images had no significant impact on the evaluation by the students. For all factors, the standard derivation for both groups is below one, except for F4 for the group with experience (1.05) and for F6 for the group without experience (1.03).
For both divisions and groups, the values for F1, F2, and F3 are high and the values for F4 ‘pressure/tension’ are low. According to Wilde et al. [36], this can be summarized as a high intrinsic motivation among all groups [36]. Neither the prior knowledge nor the available experience of working with satellite images has a significant influence on the intrinsic motivation of students, their interest in satellite images or their positive perception of the design. Using the same approach, we also analyzed the students’ evaluation of the other two learning modules. The above-mentioned results were confirmed. The related boxplots are available in Figure A2 and Figure A3 in the Appendix A.
4. Discussion
The assessment of the motivation of students shows significant factors that play an essential role in developing and designing e-learning modules for students. Taking into account that the majority of students enjoyed working self-reliantly and achieved perceived considerable learning outcomes, we considered the evaluation in general as positive. Certainly, based on our small sample size of the detailed analysis (n = 73), our study is facing a considerable selection bias. To somewhat overcome these limitations, an additional evaluation of two other learning modules (n = 208) was performed. As illustrated in Section 3.4, the analysis showed comparable results across the learning modules and validates the general statements about the role of design, students´ prior knowledge, and available experience in relation to EO-specific e-learning. Nevertheless, these findings are of limited validity due to the geographical bias.
4.1. Influence on the Motivation of Learners
As mentioned above, the intrinsic motivation of learners is of vital importance for the success of e-learning offers. We observed high interest among students in working with satellite images. The correlation between the design of the module and the interest illustrates the importance of visual presentation, following the principles of Clark and Mayer [43]. According to the survey results, animations and videos, and graphics more so, helped to facilitate the students’ understanding. However, in addition to the visual presentation of an e-learning module, the design and structure are also crucial. The students assessed the layout of the module as ‘very positive’ and the navigation as being ‘easy’. A moderate correlation (0.43) between the ‘design’ (F5) and ‘perceived freedom of choice’ (F3) indicates an important relation, in particular between controlling their own work (Q29) and graphics (0.51, Q13) as well as the layout in general (0.48, Q19). This indicates that the design is an effective instrument to take pressure off the students and to enable self-guidance, in addition to stimulating the learning outcome and interest of students.
To maintain high motivation of students, the degree of difficulty has to be considered. Both overload as well as underload appear to be limiting thresholds [48]. As shown in the assessment, weak values for the related questions Q6, Q16 and Q17 indicate tasks and questions of the modules were neither too easy nor too difficult. A decisive factor could be the adaptivity of the platform [45], categorizing students into different groups according to their performance. Accordingly, high-achieving students are confronted with more complicated questions, whereas low-achieving students receive questions that are easier to answer. In order to assist the teacher, all groups end up with the same results, strengthening the common experience and enabling a subsequent exchange about the learning modules and its content. Moderate correlations between the overload of students (0.54, Q5) and too demanding questions (0.47, Q17) with ‘pressure/tension’ (F4) illustrate that instructional designers of e-learning modules need to be careful and adapt the materials to the needs and living conditions of students [48]. Furthermore, the need for student-adapted content is indicated by weak negative correlations between the overload of students (Q5) and enjoyment (−0.33, Q1) and interest (−0.32, Q11). Results of the tested adaptive learning module show that students did not feel any pressure or tension. The majority achieved satisfying results according to their own estimations.
Our study shows high interest among students in learning new things, obtaining information about the endangered rainforest and working with satellite images. Slightly less interest was measured regarding the satellite images themselves. Most students regularly work with Google Maps or similar applications, but do not really notice the satellite images and technical implementation. Moreover, our study shows that the intrinsic motivation is neither dependent on their topic-related prior knowledge, nor on how often they have worked with satellite images. Both statements indicate that teachers can conduct the module without advanced knowledge and preparation of the students. However, results from the boxplot analysis showed that interest in satellite images was considerably higher for students with available experience of working with satellite images.
4.2. E-learning Offers and Competence Development
As different studies show, e-learning offers can aid but cannot replace teaching in schools [49,50]. The tools and methods used differ considerably and, accordingly, so do the competences that students acquire through the interventions. The curricula of the German federal states provide a wide range of possibilities for acquiring process-based competences, e.g., in the fields of orientation or analysis. Students can utilize, for instance, digital geo-media and information from EO for spatial analysis in order to enhance their competences in elaborating, analyzing and characterizing geographical structures and processes as well as to illustrate systemic relations [9,51]. Digital offers such as Geo:spektiv provide an added value compared to the use of textbooks and printed aerial or satellite images. Accordingly, the handling of (Web)GIS and derivation of information from aerial or satellite images becomes increasingly important and widespread. Therefore, digital tools can be integrated into school lessons to increase the flexibility of teaching approaches. These are primarily the aforementioned analysis tools as well as interactive features that are not possible without the use of digital tools. This enables, e.g., the integration of reflexive approaches such as the examination of land-use changes and interpretation of associated circumstances [9] and also the systematic exploitation of areas of investigation in the context of sustainability issues [51].
4.3. Implementation in Schools and Curricula
Despite the various pilot projects and initiatives (e.g., FIS [15], Columbus Eye [26], and ArcGIS [52]), the scope of these applications on EO for students and teachers is still limited. In recent years, the use of digital geo-media has become an important factor in larger frameworks such as the digitization and strengthening of STEM subjects in all types of schools [1]. Due to different curricula in Germany and at an international level, requirements and implementation strategies vary between schools and individual teachers too. The integration and utilization of technology in school lessons and in the context of TPACK require an understanding of the technology and an estimation of the possibilities that this technology offers [53]. Höhnlein et al. [54] emphasized that, in addition to technical issues, the lack of technical and pedagogical knowledge of teachers limits the use of GIS in classrooms [54]. Therefore, trainee teachers and teachers in general need to become familiar with the new tools and learn how to integrate them appropriately into their teaching activities. The results of our study indicate that teaching with EO using a step-by-step approach is an appropriate approach to integrate EO into classrooms and to facilitate teachers during this process. Due to its spatial nature, the use of digital geo-media is particularly useful in geography lessons, but not limited to these. Due to the range of EO topics, courses can also be used in subjects such as biology, social studies, economics or physics, and thus be applied across subjects [55,56]. In particular, the ‘Rainforest in Danger’ module is suitable for biology lessons. The topic of tropical rainforest as an opportunity to assess an ecosystem, environmental factors, and human-environmental relations is embedded in the same course level as in geography [9].
Achievements made by out-of-school learning places show their immense importance [57]. For the development and evaluation of courses with new didactical approaches, out-of-school learning places with scientific supervision, both for the subject science and didactics, are of great relevance. This enables scientific research with relevance to school teaching and the impact on the wider community [14,28,29,51,58,59]. Results of associated research provide essential fundamental data for the further development of educational offers at the regional, national, and international level. Furthermore, out-of-school learning places can bridge the lack of technical infrastructure in schools in the short term. Thus, schools with below-average equipment can benefit from digitization as well. Nevertheless, these learning places are limited by the number of staff and the resulting course capacities. Accordingly, the institutions do only seem limited in suitability for the scale up of new approaches. In order to be able to guarantee quality learning, or these resources at all, financial means are necessary, which must come from third-party funding sources in the case of free offers.
5. Conclusions
Out-of-school learning places such as the GIS-Station are relevant institutions to familiarize students and teachers with EO and to impart related competences. Current social issues and future trends can be reflected on much faster than in comparatively rigid curricula and in a research-oriented manner. Thus, if necessary, appropriate interdisciplinary courses can be developed, even without long-term changes to relevant educational plans. This requires an indispensable intersection of GIS and EO expertise with didactic competences and skills, which is currently an unclosed gap in the training of experts. This study shows that the demand for students and teacher courses is constantly high. The current COVID-19 pandemic increased the demand of Geo:spektiv modules by a factor of 15 in an extremely short term. Hence, long-term established processes of knowledge transfer are discussed again. As geoinformation and maps are increasingly used in our society, students need required competences to critically work with them. Under the heading of spatial citizenship, the usage of digital geo-media in classrooms can contribute to this competence [60]. In future, these long-term trends will most likely be incorporated into education plans.
To meet the demand for courses and increase the impact of out-of-school learning places, training of trainers (ToT) approaches has become increasingly important. During the last decade, more than 2000 teachers were trained on digital geo-media-relevant topics and methods. Therefore, specially designed courses for a group of teachers were developed. For this purpose, there was a focus on the use of open source programs (e.g., QGIS) or free WebGIS. Thus, teachers can easily use such technologies in their respective schools. Based on the currently limited technical infrastructure in German schools, the German digitization strategy plays a decisive role in the implementation of digital geo-media in classrooms [18]. Here, it must be emphasized that, in addition to technical equipment, the applied applications and the training of users also play a major role. To reach this aim, teacher training should primarily focus on EO-specific technological pedagogical content knowledge of teachers. Training should not solely concentrate on technology but include best-practice examples for EO usages in school lessons.
Results of this study illustrate that e-learning with curricula-relevant topics offers the potential for bringing EO into classrooms. Therefore, the lack of technical and pedagogical knowledge of teachers, which limits the use of digital geo-media in general in classrooms, can be partially remedied. Bodzin et al. [55] showed that ready to use educative curriculum materials could support teachers in their efforts to use digital geo-media in their classrooms and foster their digital geo-media-specific technological pedagogical content knowledge [55]. In this study, three learning modules were analyzed. The ‘Rainforest in Danger’ module was analyzed in detail as an example for other modules of Geo:spektiv. Despite existing limitations related to the small sampling size, our analysis indicates that a few factors with major significance for the motivation of learners and success of e-learning offers exist. The design of e-learning modules plays an important role, especially for the motivation and interest of students. Integrated adaptivity, which responds individually to the needs of the students, leads to the reduction in overload and underload of students. Prior knowledge on EO and the topic, both technical and methodological, plays only a subordinate role. Accordingly, e-learning offers not only the potential to impart knowledge on EO and related competences such as orientation, analysis, and characterizing geographical structures and processes but also curricula-relevant topics, regardless of the prior knowledge of students, can be introduced through these offers. Despite the addition of evaluations of two other learning modules, a selection bias is limiting the results of this study. Based on the increasing availability of learning modules in English at Geo:spektiv, it is possible to conduct international studies in the future. These studies are vital to avoid the current geographically biased interpretations and to allow statements valid for the international context.
Although this study clearly shows ready to use online applications such as Geo:spektiv, FIS or Eduspace as multilingual offers by ESA and out-of-school learning places play an important role for the implementation of EO and GIS in classrooms.
Author Contributions
Conceptualization, L.D., T.M., and R.R.; methodology, L.D. and J.K.; data curation, T.M. and J.K.; writing—original draft preparation, L.D., T.M., and R.R.; writing—review and editing, L.D., T.M. and J.K.; visualization, L.D.; supervision, A.S.; project administration, A.S.; funding acquisition A.S. All authors have read and agreed to the published version of the manuscript.
Funding
The GIS-Station was founded by the ‘Klaus-Tschira-Stiftung’, grant number 00.283.2015. Geo:spektiv was founded by the German Aerospace Center (DLR), grant number 50R01301, through grants from the Federal Ministry for Economic Affairs and Energy.
Acknowledgments
We thank the Ebene 5 GmbH for the technical development and programming of Geo:spektiv and BLIF. Furthermore, we thank the DLR for their support in collecting the data in the school labs. We are grateful for the review of Anne Schneibel and colleagues from rgeo.
Conflicts of Interest
The authors declare no conflict of interest.
Appendix A
Figure A1.
Complete correlation matrix. Q1: I enjoyed working in the learning module. Q2: I thought the work in the learning module was very interesting. Q3: The work in the learning module was very entertaining. Q4: I have learned a lot about satellite imagery by working in the learning module. Q5: The work in the learning module was too demanding for me. Q6: Because it is fun to work with. Q7: Because I want to learn new things. Q8: Because I enjoy dealing with these images ‘from above’. Q9: Because I like to solve problems using satellite imagery. Q10: Because I like to think about questions in geography using satellite images. Q11: The topic of the learning module interested me. Q12: The texts were written clearly and comprehensibly. Q13: The graphics helped me to better understand the content. Q14: The videos/animations helped me to better understand the content. Q15: I liked the nature of the tasks and questions. Q16: The tasks and questions were too easy. Q17: The tasks and questions were too difficult. Q18: The work with satellite images was interesting. Q19: I liked the layout of the learning module as a whole. Q20: The navigation in the learning module was easy. Q21: What school grade do you give the learning module. Q22: How many times have you worked with satellite images at school. Q23: In what format were the satellite images used at school. Q24: How often have you been privately dealing with satellite images. Q25: Have you already dealt with the topic of the learning module in school lessons. Q26: I am satisfied with my performance in the learning module. Q27: While working in the learning module, I made a good job. Q28: I think I was pretty good at the learning module. Q29: I could control the work in the learning module by myself. Q30: When working in the learning module, I could choose how to do it. Q31: When working in the learning module, I could proceed as I wanted. Q32: While working in the learning module, I felt under pressure. Q33: While working in the learning module, I felt tense. Q34: I was worried whether I would be able to do the work in the learning module well. F1 Interest/enjoyment. F2: Perceived competence. F3: Perceived choice. F4: Pressure/Tension. F5: Design. F6: Interest satellite images.

Figure A2.
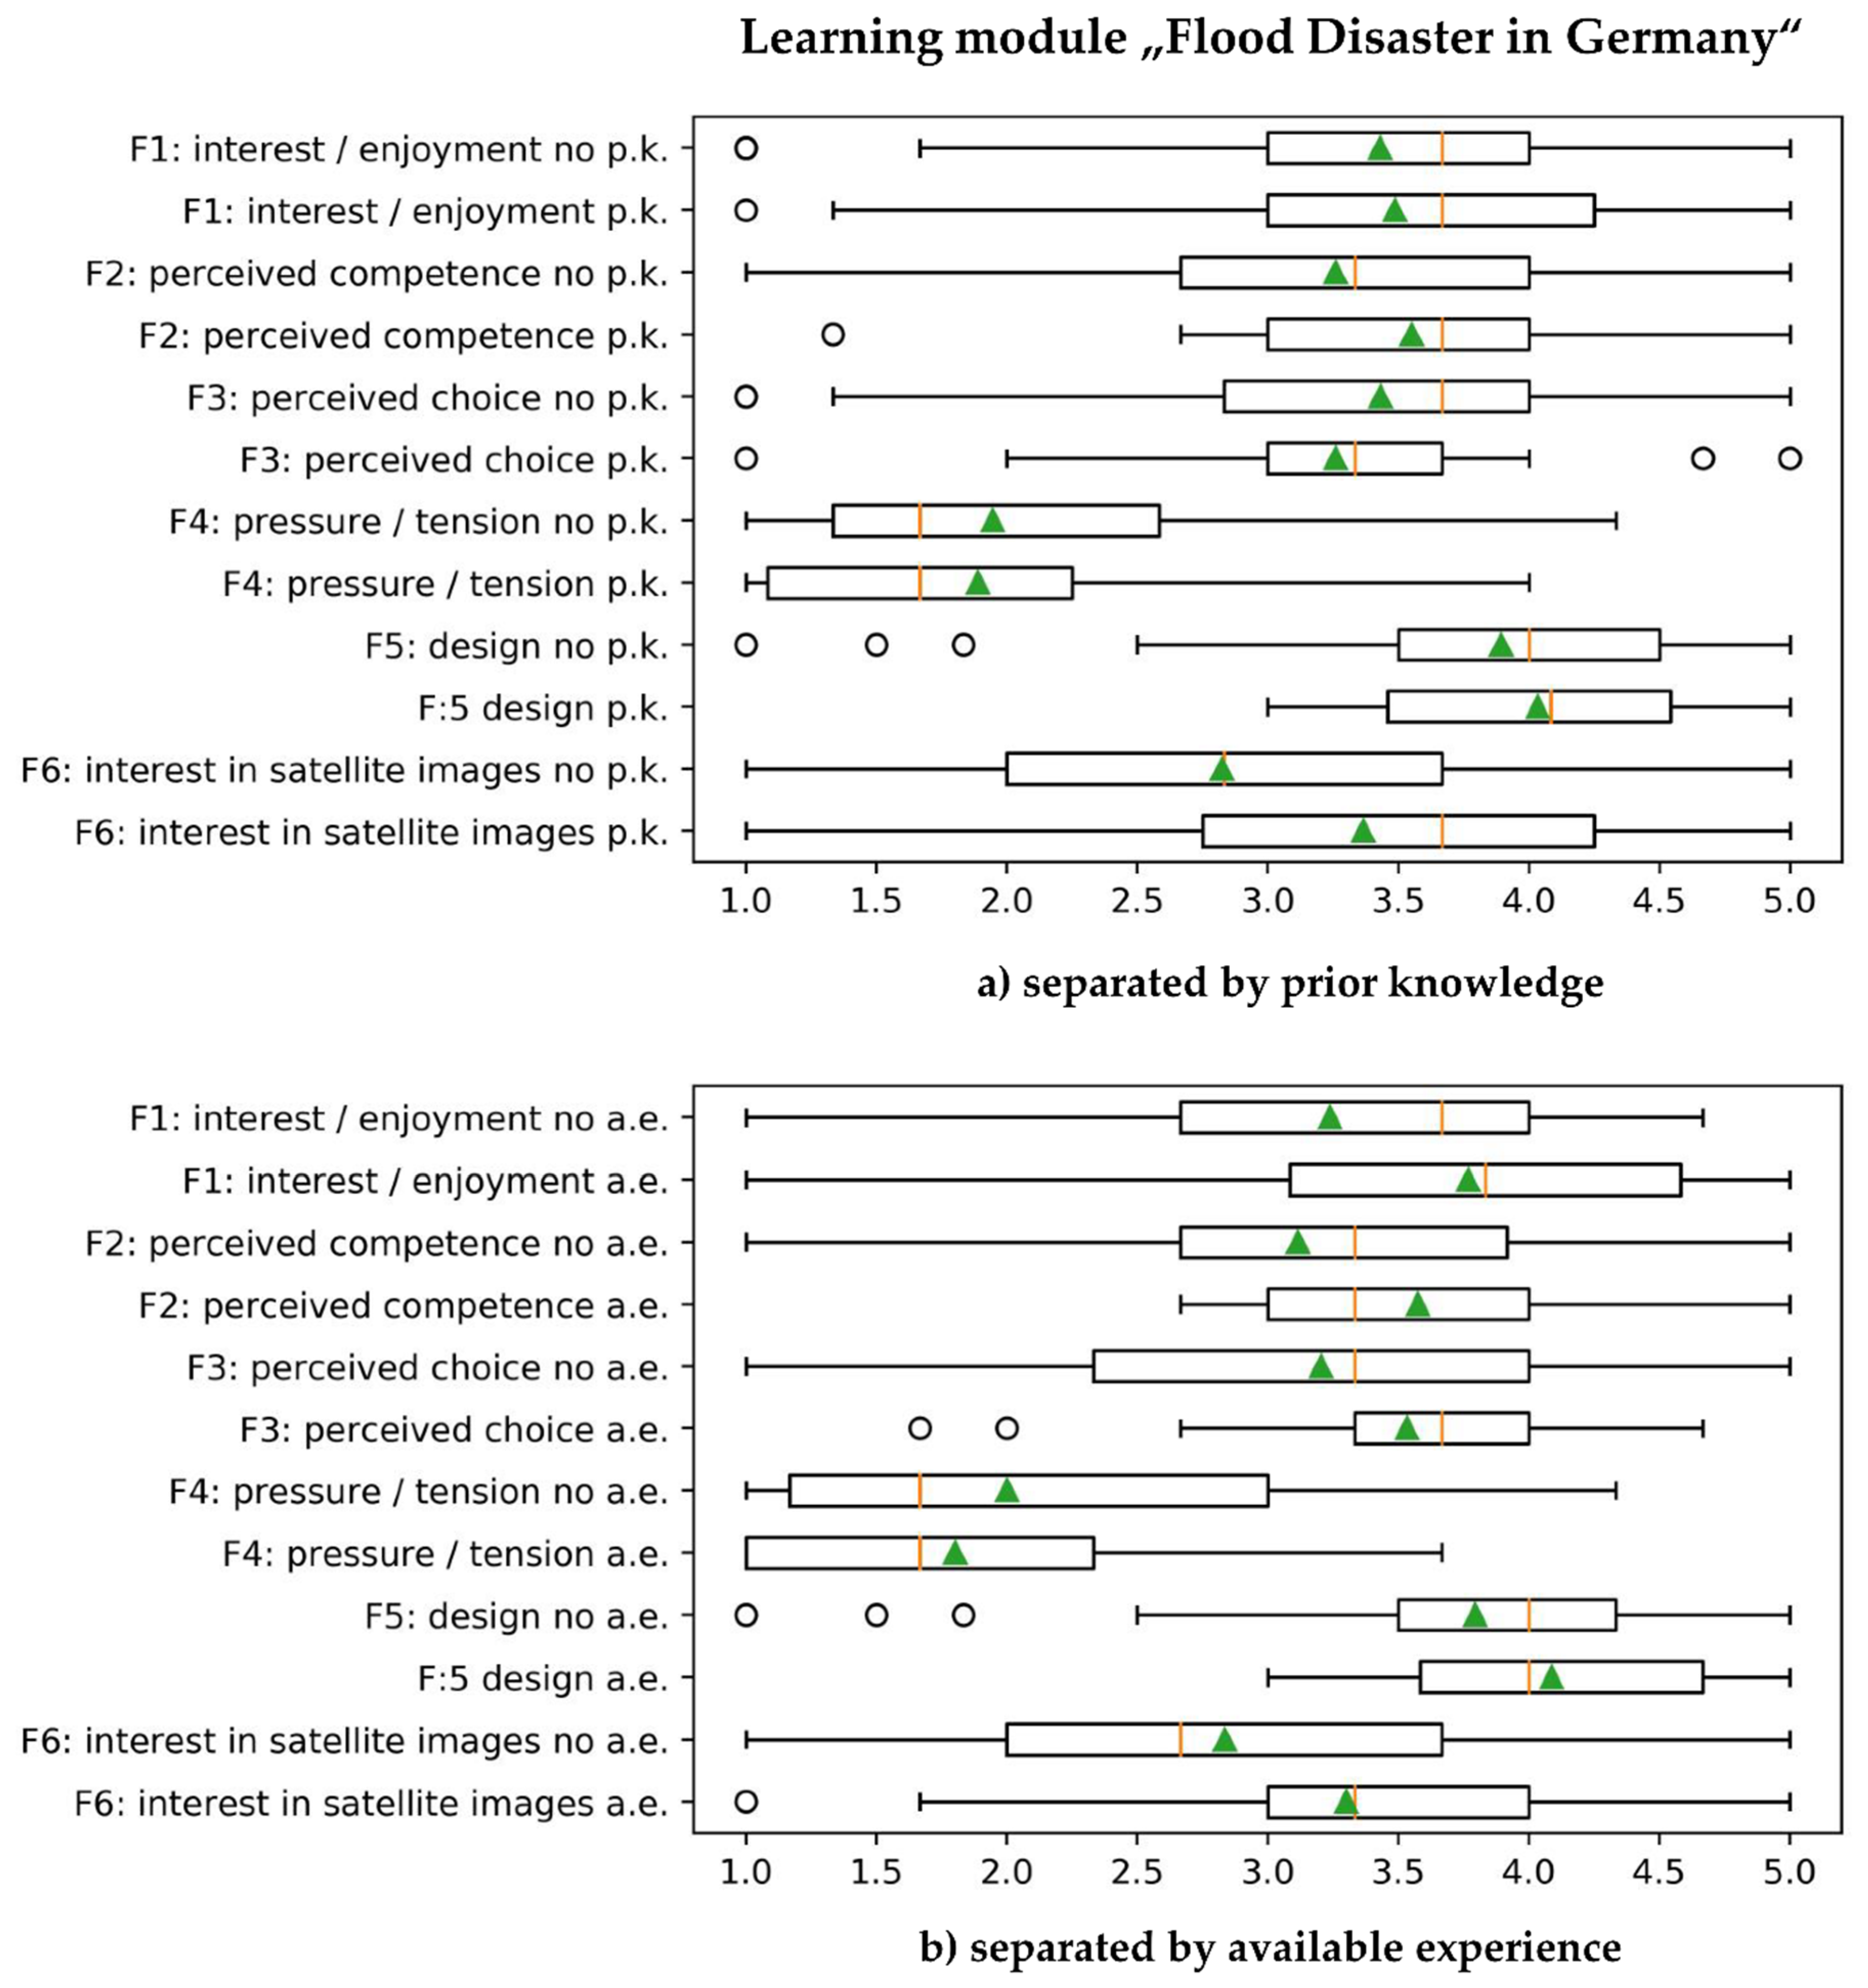
“Flood Disaster in Germany”—boxplots for the above-mentioned factors and students—(a) separated by their prior knowledge (p.k.) related to the topic of the module; (b) separated by their available experience (a.e.) of working with satellite images; green triangles indicate the mean value.
Figure A2.
“Flood Disaster in Germany”—boxplots for the above-mentioned factors and students—(a) separated by their prior knowledge (p.k.) related to the topic of the module; (b) separated by their available experience (a.e.) of working with satellite images; green triangles indicate the mean value.

Figure A3.
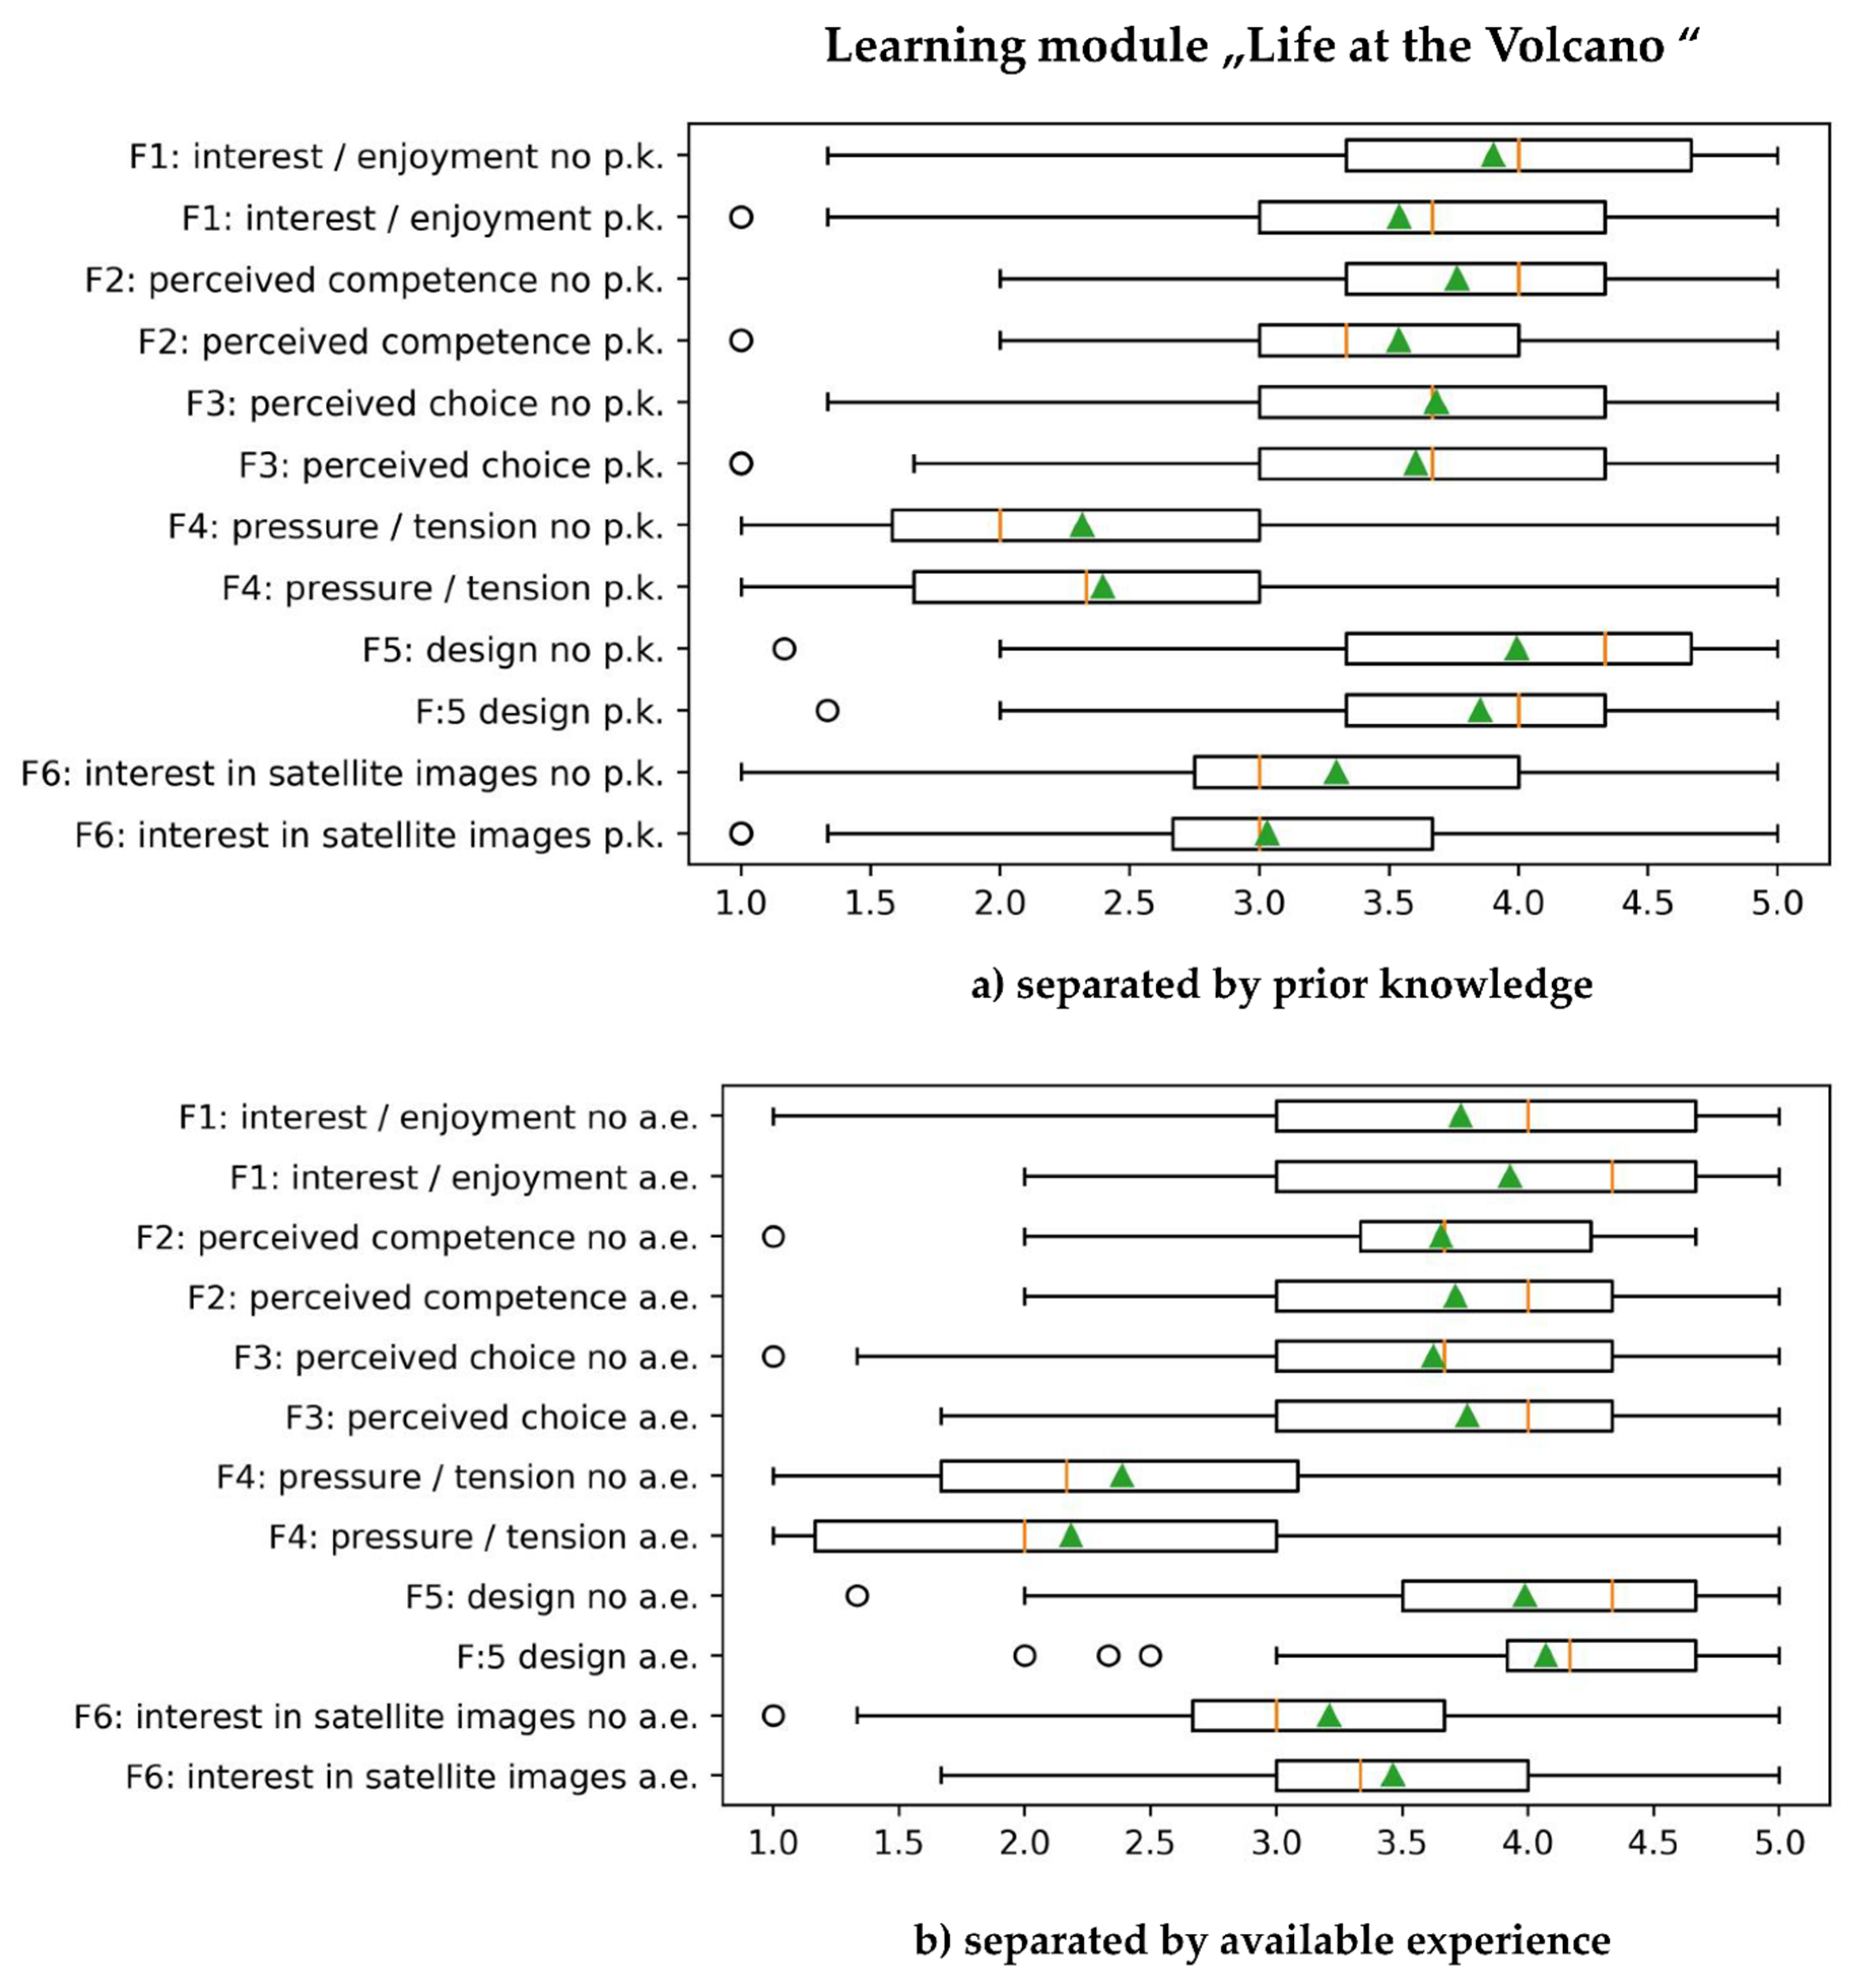
“Life at the Volcano”—boxplots for the above-mentioned factors and students—(a) separated by their prior knowledge (p.k.) related to the topic of the module; (b) separated by their available experience (a.e.) of working with satellite images; green triangles indicate the mean value.
Figure A3.
“Life at the Volcano”—boxplots for the above-mentioned factors and students—(a) separated by their prior knowledge (p.k.) related to the topic of the module; (b) separated by their available experience (a.e.) of working with satellite images; green triangles indicate the mean value.

References
- Muñiz Solari, O.; Demirci, A.; Schee, J. Geospatial Technologies and Geography Education in a Changing World: Geospatial Practices and Lessons Learned; Springer: Tokyo, Japan, 2015; ISBN 978-4-431-55518-6. [Google Scholar]
- Albertz, J. Einführung in Die Fernerkundung: Grundlagen der Interpretation von Luft- und Satellitenbildern, 5., Aktualisierte Auflage; WBG (Wissenschaftliche Buchgesellschaft): Darmstadt, Germany, 2014; ISBN 978-3-534-25863-5. [Google Scholar]
- Lee, J.; Bednarz, R. Effect of GIS Learning on Spatial Thinking. J. Geogr. High. Educ. 2009, 33, 183–198. [Google Scholar] [CrossRef]
- Bodzin, A.M.; Fu, Q.; Bressler, D.; Vallera, F.L. Examining the Enactment of Web GIS on Students’ Geospatial Thinking and Reasoning and Tectonics Understandings. Comput. Sch. 2015, 32, 63–81. [Google Scholar] [CrossRef]
- Neeb, K. Räumliche Orientierung mit GPS-(k)ein Mittel zum Erwerb räumlicher Orientierungskompetenz: Ergebnisse einer empirischen Studie zu den Kompetenzerwerbschancen im Geographieunterricht der Jahrgangsstufen 5,6, und 8. Geographie und ihre Didaktik 2013, 41, 123–142. [Google Scholar]
- NRC. Learning to Think Spatially; The National Academies Press: Washington, DC, USA, 2006.
- Mouratidis, A.; Koutsoukos, M. Use of Esa Earth Observation Educational Resources in Vocational Education and Training-Lifelong Learning: Towards Stem Promotion and Development of Skills. Geosociety 2017, 50, 1652. [Google Scholar] [CrossRef] [Green Version]
- Merchant, S.; Morimoto, E.T.A.; Khanbilvardi, R. High school initiative in Remote Sensing of the Earth Systems Science and Engineering (HIRES). In Proceedings of the 2015 IEEE Integrated STEM Education Conference (ISEC), Princeton, NJ, USA, 7 March 2015; IEEE: Piscataway, NJ, USA, 2015; pp. 164–170, ISBN 978-1-4799-1829-4. [Google Scholar]
- Bildungsplan. Gemeinsamer Bildungsplan für die Sekundarstufe 1, Baden-Württemberg; Ministerium für Kultus; Jugend und Sport Baden-Württemberg: Stuttgart, Germany, 2016. [Google Scholar]
- Department for Education. Geography Programmes of Study: Key Stage 3: National Curriculum in England. Available online: https://assets.publishing.service.gov.uk/government/uploads/system/uploads/attachment_data/file/239087/SECONDARY_national_curriculum_-_Geography.pdf (accessed on 13 July 2020).
- D-EDK. Lehrplan 21. Available online: https://v-fe.lehrplan.ch/container/V_FE_DE_Gesamtausgabe.pdf (accessed on 27 July 2020).
- MaKinster, J.; Trautmann, N. The Nature of Teacher Knowledge Necessary for the Effective Use of Geospatial Technologies to Teach Science. In Teaching Science and Investigating Environmental Issues with Geospatial Technology: Designing Effective Professional Development for Teachers; MaKinster, J., Trautmann, N., Barnett, M., Eds.; Springer Netherlands: Dordrecht, The Netherlands, 2014; pp. 333–353. ISBN 978-90-481-3931-6. [Google Scholar]
- Koehler, M.; Mishra, P.; Harris, J. What is Technological Pedagogical Content Knowledge? Contemp. Issues Technol. Teach. Educ. 2009, 9, 60–70. [Google Scholar] [CrossRef] [Green Version]
- Siegmund, A. Satellitenbilder im Unterricht-eine Ländervergleichsstudie zur Ableitung fernerkundungsdidaktischer Grundsätze. Ph.D. Thesis, University of Education, Heidelberg, Germany, 2011. [Google Scholar]
- Hodam, H.; Rienow, A.; Jürgens, C. Bringing Earth Observation to Schools with Digital Integrated Learning Environments. Remote Sens. 2020, 12, 345. [Google Scholar] [CrossRef] [Green Version]
- Fargher, M. GIS and other geospatial technologies. In Handbook of Secondary Geography; Jones, M., Ed.; Geographical Association: Sheffield, UK, 2017. [Google Scholar]
- Breiter, A.; Zeising, A.; Stolpmann, B.E. IT-Ausstattung an Schulen. In Kommunen Brauchen Unterstützung für Milliardenschwere Daueraufgabe; Bertelsmann Stiftung: Gütersloh, Germany, 2017. [Google Scholar]
- Bundesministerium für Bildung und Forschung. Digitalpakt Schule 2019 bis 2024. 2019. Available online: https://www.digitalpaktschule.de/files/VV_DigitalPaktSchule_Web.pdf (accessed on 16 September 2020).
- Copernicus. Copernicus Market Report; Publications Office if the European Union: Luxenburg, 2019. [Google Scholar]
- Eckardt, R.; Urbazaev, M.; Eberle, J.; Schmullius, C.; Pathe, C. eLearning in the Context of Earth Observation Best Practices, The EO College and the first MOOC on Radar Remote Sensing. Earth Observation Services GmbH: Jena, Germany, 2018. Available online: https://www.researchgate.net/publication/330856673_eLearning_in_the_Context_of_Earth_Observation_Best_Practices_The_EO_College_and_the_first_MOOC_on_Radar_Remote_Sensing (accessed on 16 September 2020).
- Palazzo, F.; Šmejkalová, T.; Castro-Gomez, M.; Rémondière, S.; Scarda, B.; Bonneval, B.; Gilles, C.; Guzzonato, E.; Mora, B. RUS: A New Expert Service for Sentinel Users. Proc. Int. Electronic Conf. Remote Sens. 2018, 2, 369. [Google Scholar] [CrossRef] [Green Version]
- EO4GEO. About EO4GEO. Available online: http://www.eo4geo.eu/about-eo4geo/ (accessed on 27 July 2020).
- Lichtenegger, J.; Sorensen, P.B.; Loret, E.; Stomsholm, B. EDUSPACE-The European Earth Observation Website for Secondary Schools. Int. Arch. Photogramm. Remote Sens. Spat. Inf. Sci. 2002, 34, 47–52. [Google Scholar]
- Brade, J.; Dühlmeier, B. Lehren und Lernen in außerschulischen Lernorten. In Hanbdbuch Didaktik des Sachunterrichts; Kahlert, J., Föllig-Albers, M., Götz, M., Hartinger, A., Miller, S., Wittkowske, Eds.; Verlag Julius Klinkhardt: Bad Heilbrunn, Germany, 2015; pp. 434–440. [Google Scholar]
- Goetzke, R.; Hodam, H.; Rienow, A.; Voss, K. Teaching materials, encyclopaedia, easy-to-use image processing—The FIS Learning Portal on remote sensing. EARSeL eProc. 2013, 12, 164–173. [Google Scholar] [CrossRef]
- Lindner, C.; Rienow, A.; Jürgens, C. Augmented Reality applications as digital experiments for education—An example in the Earth-Moon System. Acta Astronaut. 2019, 161, 66–74. [Google Scholar] [CrossRef]
- Bednarz, R.; Lee, J. What improves spatial thinking? Evidence from the Spatial Thinking Abilities Test. Int. Res. Geogr. Environ. Educ. 2019, 28, 262–280. [Google Scholar] [CrossRef]
- Viehrig, K. Exploring the Effects of GIS Use on Students’ Achievement in Geography. Ph.D. Thesis, University of Education, Heidelberg, Germany, 2014. [Google Scholar]
- Ditter, R. Die Wirksamkeit Digitaler Lernwege in der Fernerkundung: Eine Empirische Untersuchung zu Lernmotivation und Selbstkonzept bei Schülerinnen und Schülern der Sekundarstufe. Ph.D. Thesis, University of Education, Heidelberg, Germany, 2013. [Google Scholar]
- Jiang, S.; Schenke, K.; Eccles, J.S.; Xu, D.; Warschauer, M. Cross-national comparison of gender differences in the enrollment in and completion of science, technology, engineering, and mathematics Massive Open Online Courses. PLoS ONE 2018, 13, e0202463. [Google Scholar] [CrossRef] [PubMed]
- Johnson, R.D. Gender Differences in E-Learning. J. Organ. End User Comput. 2011, 23, 79–94. [Google Scholar] [CrossRef] [Green Version]
- Hattie, J. Visible Learning. A Synthesis of over 800 Meta-Analyses Relating to Achievement; Routledge: London, UK; New York, NY, USA, 2009. [Google Scholar]
- Vallerand, R.J.; Pelletier, L.G.; Blais, M.R.; Briere, N.M.; Senecal, C.; Vallieres, E.F. The Academic Motivation Scale: A Measure of Intrinsic, Extrinsic, and Amotivation in Education. Educ. Psychol. Meas. 1992, 52, 1003–1017. [Google Scholar] [CrossRef]
- Ryan, R.M.; Deci, E.L. An overview of self-determination theory: An organismic-dialectical perspective. In Handbook of Self-Determination Research; Deci, E.L., Ryan, R.M., Eds.; Rochester University: Rochester, NY, USA, 2002; pp. 3–33. [Google Scholar]
- Deci, E.L. Intrinsic Motivation and Self-Determination in Human Behavior, Softcover Reprint of the Original, 1st ed.; Springer Science+Business Media: New York, NY, USA, 1985; ISBN 1489922717. [Google Scholar]
- Wilde, M.; Bätz, K.; Kovaleva, A.; Urhahne, D. Überprüfung einer Kurzskala intrinsischer Motivation (KIM). Z. Didakt. Nat. 2009, 15, 31–45. [Google Scholar]
- Bildungsserver Berlin-Brandenburg. Teil C Geografie: Jahrgangstufe 7–10. Available online: https://bildungsserver.berlin-brandenburg.de/fileadmin/bbb/unterricht/rahmenlehrplaene/Rahmenlehrplanprojekt/amtliche_Fassung/Teil_C_Geografie_2015_11_10_WEB.pdf (accessed on 21 July 2020).
- Staatsministerium für Kultus Freistaat Sachsen. Lehrplan Gymnasium Geographie. Available online: https://www.schule.sachsen.de/lpdb/web/downloads/1425_lp_gy_geographie_2019.pdf?v2 (accessed on 16 September 2020).
- Niedersächsisches Landesinstitut für Schulische Qualitätsentwicklung. Erdkunde im Sekundarbereich 1. Available online: https://www.nibis.de/erdkunde-im-sekundarbereich-i_8284 (accessed on 16 September 2020).
- Hessisches Kultusministerium. Lehrplan Erdkunde: Gymnasialer Bildungsgang Jahrgangstufen 5G bis 8G. Available online: https://kultusministerium.hessen.de/sites/default/files/media/g8-erdkunde.pdf (accessed on 10 July 2020).
- Ministerium für Bildung und Kultur Saarland. Lehrplan Erdkunde: Gymnasium, Klassenstufe 7. Available online: https://www.saarland.de/SharedDocs/Downloads/DE/mbk/Lehrplaene/Lehrplaene_Gymnasium/Erdkunde/Erdkunde_7_Gym_2014.pdf?__blob=publicationFile&v=3 (accessed on 20 July 2020).
- Staatsinstitut für Schulqualität und Bildungsforschung München. Lehrplan Geographie: Jahrgangsstufe 8. Available online: http://www.gym8-lehrplan.bayern.de/contentserv/3.1.neu/g8.de/id_26283.html (accessed on 8 July 2020).
- Clark, R.C.; Mayer, R.E. E-learning and the science of instruction. In Proven Guidelines for Consumers and Designers of Multimedia Learning, 4th ed.; Wiley: Hoboken, NJ, USA, 2016; ISBN 9781119158660. [Google Scholar]
- Fischer, C.; Rott, D. Individuelle Förderung als Schulische Herausforderung, 3rd ed.; Friedrich-Ebert-Stiftung Abt. Studienförderung: Berlin, Germany, 2015; ISBN 9783864988059. [Google Scholar]
- Matusch, T.; Schneibel, A.; Dannwolf, L.; Siegmund, A. Implementing a Modern E-Learning Strategy in an Interdisciplinary Environment—Empowering UNESCO Stakeholders to Use Earth Observation. Geosciences 2018, 8, 432. [Google Scholar] [CrossRef] [Green Version]
- Kerski, J.J.; Baker, T.R. Infusing Educational Practice with Web GIS. In Geospatial Technologies in Geography Education; de Miguel González, R., Donert, K., Koutsopoulos, K., Eds.; Springer: Cham, Switzerland, 2019; pp. 3–19. ISBN 978-3-030-17782-9. [Google Scholar]
- DiBiase, D.; Corbin, T.; Fox, T.; Francia, J.; Green, K.; Jackson, J.; Heffress, G.; Jones, B.; Mennis, J.; Schuckman, K.; et al. The News geospatial Technology Competency Model: Bringig Workforece Needs into Focus. URISA J. 2010, 22, 55–72. [Google Scholar]
- Paas, F.; Renkl, A.; Sweller, J. Cognitive Load Theory: Instructional Implications of the Interaction between Information Structures and Cognitive Architecture. Instr. Sci. 2004, 32, 1–8. [Google Scholar] [CrossRef] [Green Version]
- Nortvig, A.-M.; Petersen, A.K.; Balle, S.H. A Literature Review of the Factors Influencing E-Learning and Blended Learning in Relation to Learning Outcome, Student Satisfaction and Engagement. Electron. J. e-Learn. 2018, 16, 46–55. [Google Scholar]
- Zhang, D.; Zhao, J.L.; Zhou, L.; Nunamaker, J.F. Can e-learning replace classroom learning? Commun. ACM 2004, 47, 75–79. [Google Scholar] [CrossRef]
- Jahn, M. Digitale Luft- und Satellitenbilder in der Bildung für Nachhaltige Entwicklung: Eine Empirische Untersuchung mit Kursstufenschüler/Innen zur Wirksamkeit für die Systemische Erschließung von Erdräumen am Beispiel des Braunkohleabbaus im Rheinland. Ph.D. Thesis, University of Education, Heidelberg, Germany, 2020. [Google Scholar]
- Kerski, J.J. Understanding Our Changing World through Web-Mapping Based Investigations. J. Res. Didact. Geogr. 2013, 2, 11–26. [Google Scholar]
- Harris, J.B.; Hofer, M.J. Technological Pedagogical Content Knowledge (TPACK) in Action. J. Res. Technol. Educ. 2011, 43, 211–229. [Google Scholar] [CrossRef]
- Höhnlein, S.; Schubert, J.-C.; Uphues, R. Barriers to GI(S) Use in Schools: A Comparision of International Empirical Results. In Learning with GI 2011: Implementing Digital Earth in Education, Proceedings of the Result of the Conference, Held within the Framework of AGIT and the GI-Forum, Salzburg, Austria, 4–8 July 2011; Jekel, T., Koller, A., Eds.; Wichmann: Berlin, Germany, 2011; pp. 124–134. ISBN 9783879075102. [Google Scholar]
- Bodzin, A.M.; Peffer, T.; Kulo, V. The Efficacy of Educative Ecurrculum Materials to Support Geospatial Science Pedagogical Content Knowledge. J. Technol. Teach. Educ. 2012, 20, 361–386. [Google Scholar]
- Crawford, M.R.; Holder, M.D.; O’Connor, B.P. Using Mobile Technology to Engage Children with Nature. Environ. Behav. 2017, 49, 959–984. [Google Scholar] [CrossRef]
- Tal, T. Out-of-School: Learning Experiences, Teaching and Students’ Learning. In Second International Handbook of Science Education; Fraser, B.J., Tobin, K., McRobbie, C.J., Eds.; Springer Science+Business Media, B.V.: Dordrecht, The Netherlands, 2012; pp. 1109–1122. ISBN 978-1-4020-9040-0. [Google Scholar]
- Koller, I. Die Satellitenbild-Lesekompetenz: Empirische Überprüfung Eines Theoriegeleiteten Kompetenzstrukturmodells für das “Lesen” von Satellitenbildern. Ph.D. Thesis, University of Education, Heidelberg, Germany, 2012. [Google Scholar]
- Wabnitz, M. Blickbewegungen Beim Lesen von Satellitenbildern: Eine Vergleichende Studie zur Visuellen Wahrnehmung Zwischen Schülern der Sekundarstufe I und Experten. Ph.D. Thesis, University of Education, Heidelberg, Germany, 2019. [Google Scholar]
- Jekel, T.; Gryl, I.; Schulze, U. Education for Spatial Citizenship. In Geospatial Technologies and Geography Education in a Changing World: Geospatial Practices and Lessons Learned; Muñiz Solari, O., Demirci, A., Schee, J., Eds.; Springer: Tokyo, Japan, 2015; pp. 35–49. ISBN 978-4-431-55519-3. [Google Scholar]
Figure 1.
Presentation and design example of Geo:spektiv modules.

Figure 2.
Surface of the web-based EO application BLIF. On the left side, basic EO tools are provided for contrast enhancement and the creation of color composites. More tools such as transparency or an area-measuring tool can be found in the bar at the top. In the upper right corner, there is a zoom function and the activation of an Open Street Map background map for better orientation. On the lower right, a child-friendly avatar provides useful information and a step-by-step guide. For better readability, the menu bars in the picture were enlarged.

Figure 3.
Number of conducted courses at the GIS-Station between 2010 and 2019 in total and sorted by topic.
Figure 3.
Number of conducted courses at the GIS-Station between 2010 and 2019 in total and sorted by topic.

Figure 4.
Spider diagram on the feedback of students regarding their motivation and interest (n = 73; 1 = no consent at all; 5 = complete consent).
Figure 4.
Spider diagram on the feedback of students regarding their motivation and interest (n = 73; 1 = no consent at all; 5 = complete consent).

Figure 5.
Spider diagram regarding the assessment of the learning modules and self-assessment of learning success of students (n = 73; 1 = no consent at all; 5 = complete consent).
Figure 5.
Spider diagram regarding the assessment of the learning modules and self-assessment of learning success of students (n = 73; 1 = no consent at all; 5 = complete consent).

Figure 6.
Calculated Pearson’s correlation coefficients of selected questions from the students’ assessment; from red (1) to green (-1). Q1—I enjoyed working in the learning module. Q5—the work in the learning module was too demanding. Q6—...because it is fun to work with. Q11—the topic of the learning module was interesting. Q15—I liked the nature of the tasks and questions. Q18—the work with satellite images was interesting. Q19—I liked the layout of the general learning module. Q20—the navigation in the learning module was easy. Q21—what school grade do you give the learning module? Q32—while working in the learning module, I felt under pressure. F1—interest/enjoyment (factor, KIM). F2—perceived competence (factor, KIM). F3—perceived choice (factor, KIM). F4—pressure/tension (factor, KIM). F5—design (factor). F6—interest in satellite images (factor).

Figure 7.
Comparison of the six analyzed factors for all three learning modules ((a) ‘Rainforest in Danger’, (b) ‘Life at the Volcano’, and (c) ‘Flood Disaster in Germany’). F1—interest/enjoyment (factor, KIM). F2—perceived competence (factor, KIM). F3—perceived choice (factor, KIM). F4—pressure/tension (factor, KIM). F5—design (factor). F6—interest in satellite images (factor).

Figure 8.
“Rainforest in Danger”—boxplots for the above-mentioned factors and students—(a) separated by their prior knowledge (p.k.) related to the topic of the module; (b) separated by their available experience (a.e.) of working with satellite images; green triangles indicate the mean value.
Figure 8.
“Rainforest in Danger”—boxplots for the above-mentioned factors and students—(a) separated by their prior knowledge (p.k.) related to the topic of the module; (b) separated by their available experience (a.e.) of working with satellite images; green triangles indicate the mean value.


Table 1.
Excerpt of the relevant topics in the curricula on the topic of tropical rainforests, based on secondary education.
Table 1.
Excerpt of the relevant topics in the curricula on the topic of tropical rainforests, based on secondary education.
| Educational Plan Content | Category | Class Level | Federal State | Curricula |
|---|---|---|---|---|
| Tropical rainforest ecosystem | Ecosystem/Vegetation | 7,8 | Lower Saxony | [39] |
| Problem area tropical rainforest | Agriculture/Nutrition | 8 | Hesse | [40] |
| Tropical rainforest ecosystem | Ecosystem/Vegetation | 8 | Lower Saxony | [39] |
| The hot and humid zone in the tropical rainforest | Atmosphere/Climate Change/Ecosystem/Vegetation | 7 | Saarland | [41] |
| The hot and humid zone in the tropical rainforest | Environmental Problems/Natural Disasters | 7 | Saarland | [41] |
| Climate and vegetation zones of the earth—tropics and subtropics | Atmosphere/Climate Change | 8 | Bavaria | [42] |
| Analysis of specific areas in different geo-zones | Ecosystem/Global Vegetation | 7,8,9 | Baden-Württemberg | [9] |
| Life in the humid and semi-humid tropics | Orientation/Classification of Natural Areas | 9,10 | Berlin | [37] |
| Regional effectiveness of economic activity | Economics/Politics/Globalization | 7,8,9 | Baden-Württemberg | [9] |
Table 2.
The six calculated factors with the associated questions and the calculated Cronbach’s alpha.
Table 2.
The six calculated factors with the associated questions and the calculated Cronbach’s alpha.
| Factor | Questions | Cronbach’s Alpha |
|---|---|---|
| F1: interest/enjoyment | Q1: I enjoyed working in the learning module. Q2: I thought the work in the learning module was very interesting. Q3: The work in the learning module was very entertaining. | 0.85 |
| F2: perceived competence | Q26: I am satisfied with my performance in the learning module. Q27: While working in the learning module, I made a good job. Q28: I think I was pretty good at the learning module. | 0.87 |
| F3: perceived choice | Q29: I could control the work in the learning module by myself. Q30: When working in the learning module, I could choose how to do it. Q31: When working in the learning module, I could proceed as I wanted. | 0.76 |
| F4: pressure/tension | Q32: While working in the learning module, I felt under pressure. Q33: While working in the learning module, I felt tense. Q34: I was worried whether I would be able to do the work in the learning module well. | 0.72 |
| F5: design | Q12: The texts were written clearly and comprehensibly. Q13: The graphics helped me to better understand the content. Q14: The videos/animations helped me to better understand the content. Q15: I liked the nature of the tasks and questions. Q19: I liked the general layout of the learning module. Q20: The navigation in the learning module was easy. | 0.80 |
| F6: interest in satellite images | Q8: Because I want to learn new things. Q9: Because I enjoy dealing with these images ‘from above’. Q10: Because I like solve problems using satellite imagery. | 0.86 |
© 2020 by the authors. Licensee MDPI, Basel, Switzerland. This article is an open access article distributed under the terms and conditions of the Creative Commons Attribution (CC BY) license (http://creativecommons.org/licenses/by/4.0/).
Share and Cite
MDPI and ACS Style
Dannwolf, L.; Matusch, T.; Keller, J.; Redlich, R.; Siegmund, A. Bringing Earth Observation to Classrooms—The Importance of Out-of-School Learning Places and E-Learning. Remote Sens. 2020, 12, 3117. https://doi.org/10.3390/rs12193117
AMA Style
Dannwolf L, Matusch T, Keller J, Redlich R, Siegmund A. Bringing Earth Observation to Classrooms—The Importance of Out-of-School Learning Places and E-Learning. Remote Sensing. 2020; 12(19):3117. https://doi.org/10.3390/rs12193117
Chicago/Turabian StyleDannwolf, Lisa, Tobias Matusch, Johannes Keller, Ronja Redlich, and Alexander Siegmund. 2020. "Bringing Earth Observation to Classrooms—The Importance of Out-of-School Learning Places and E-Learning" Remote Sensing 12, no. 19: 3117. https://doi.org/10.3390/rs12193117
Note that from the first issue of 2016, this journal uses article numbers instead of page numbers. See further details here.