Effects of Soil Microbes on Forest Recovery to Climax Community through the Regulation of Nitrogen Cycling

College of Life Science, Northeast Forestry University, Harbin 150040, China
*
Author to whom correspondence should be addressed.
Forests 2020, 11(10), 1027; https://doi.org/10.3390/f11101027
Submission received: 31 August 2020
/
Revised: 20 September 2020
/
Accepted: 21 September 2020
/
Published: 23 September 2020
(This article belongs to the Special Issue Carbon and Nutrient Accumulation and Decomposition in Forests)
Abstract
:Microbes, as important regulators of ecosystem processes, play essential roles in ecosystem recovery after disturbances. However, it is not clear how soil microbial communities and functions change and affect forest recovery after clear-cutting. Here, we used metagenome sequencing to systematically analyse the differences in soil microbial community composition, functions, and nitrogen (N) cycling pathways between primary Korean pine forests (PF) and secondary broad-leaved forests (SF) formed after clear-cutting. Our results showed that the dominant phyla of the two forest types were consistent, but the relative abundance of some phyla was significantly different. Meanwhile, at the genus level, the fold-changes of rare genera were larger than the dominant and common genera. The genes related to microbial core metabolic functions, virulence factors, stress response, and defence were significantly enriched in SF. Additionally, based on the relative abundance of functional genes, a schema was proposed to analyse the differences in the whole N cycling processes between the two forest types. In PF, the stronger ammoniation and dissimilatory nitrate reduction (DNRA) and the weaker nitrification provided a genetic explanation for PF dominated by ammonium (NH4+) rather than nitrate (NO3−). In SF, the weaker DNRA, the stronger nitrification and denitrification, the higher soil available phosphorus (AP), and the lower nitrogen to phosphorus ratio (N/P) comprehensively suggested that SF was faced with a greater degree of N limitation. These results offer insights into the potential relationship between soil microbes and forest recovery, and aid in implementing proper forestry management.
1. Introduction
Forest ecosystems provide important ecological services. In recent years, research on in situ forest ecological functions affected by human interference (fire, logging) has drawn much attention. Soil is a highly dynamic and heterogeneous environment, and its changes are of great significance for forest ecological functions. During ecological succession, soil habitat, vegetation, and microbial communities all undergo synergistic changes. Soil microbial community structure and functions present signs of resilience during the recovery of disturbed forest [1]. The impacts of soil microbes on the microhabitats of woodlands become more complicated due to the diversity of vegetation, litter, climate, terrain, and landforms. During forest transitions, changes in aboveground vegetation drive variation in soil microbial community composition and functions [2]. Conversely, soil microbes are an important link between aboveground and underground ecosystem processes [3], governing the biogeochemical cycling [4,5] and affecting plant growth and community succession.
The Korean pine and broad-leaved mixed forests located in north-eastern China are important components of boreal forests in the world [6]. They represent a typical independent dominant forest type with the most complicated community structure. In the 1960s, as zonal vegetation, large areas of primary Korean pine and broad-leaved mixed forests were cleared. After nearly 60 years of recovery succession, some of them have been replaced by young and middle-aged secondary broad-leaved forests. Understanding the recovery process of secondary broad-leaved forests and their changes in ecological functions is a focus of current research. Soil N supply limits net primary productivity of forests and affects the capacities for recovery of forests after disturbances [7]. In fact, temperate forests, including Korean pine and broad-leaved mixed forests, are generally limited by N [8,9]. There are differences in the degree of N limitation at different forest stand composition and community succession stages [10]. In addition, regeneration of constructive species is the key to the restoration of zonal community in the process of forest recovery. In the case of sufficient seed sources, the soil nutrition habitat of establishment of seedlings is a key limiting factor for the regeneration of constructive species.
Changes in soil microbial community structure and functions affect the stability of forest communities and forest resilience to various disturbances [4]. Deforestation and disturbances alter N transformations [2], including nitrification [11], dissimilatory nitrate reduction (DNRA), and denitrification [12], which affect the available N supply and N balance among plants, microbes, and ecosystems. N cycling is a key process supporting forest productivity and ecosystem functions and services [13,14]; its restoration is essential for the recovery of forest ecosystems. However, studies regarding changes in soil microbial community composition and functions, and their effects on forest recovery after disturbances, are still limited. Therefore, we proposed two hypotheses: (1) There are differences in the soil microbial community composition between primary Korean pine forests (PF) and secondary broad-leaved forests (SF), and shifts in the community structure may mean potential functional changes, and (2) the changes in microbial community structure and functions of the two different forest types provide an explanation for soil nutrition habitat of constructive species. In order to test the above hypotheses, we compared PF and SF, focusing on soil microbial community composition and functions, especially the key processes of N cycling, and evaluating the effects of soil microbes on forest ecological functions. These results offer insights into soil microbes in maintaining forest productivity and driving forest recovery.
2. Materials and Methods
2.1. Experimental Sites
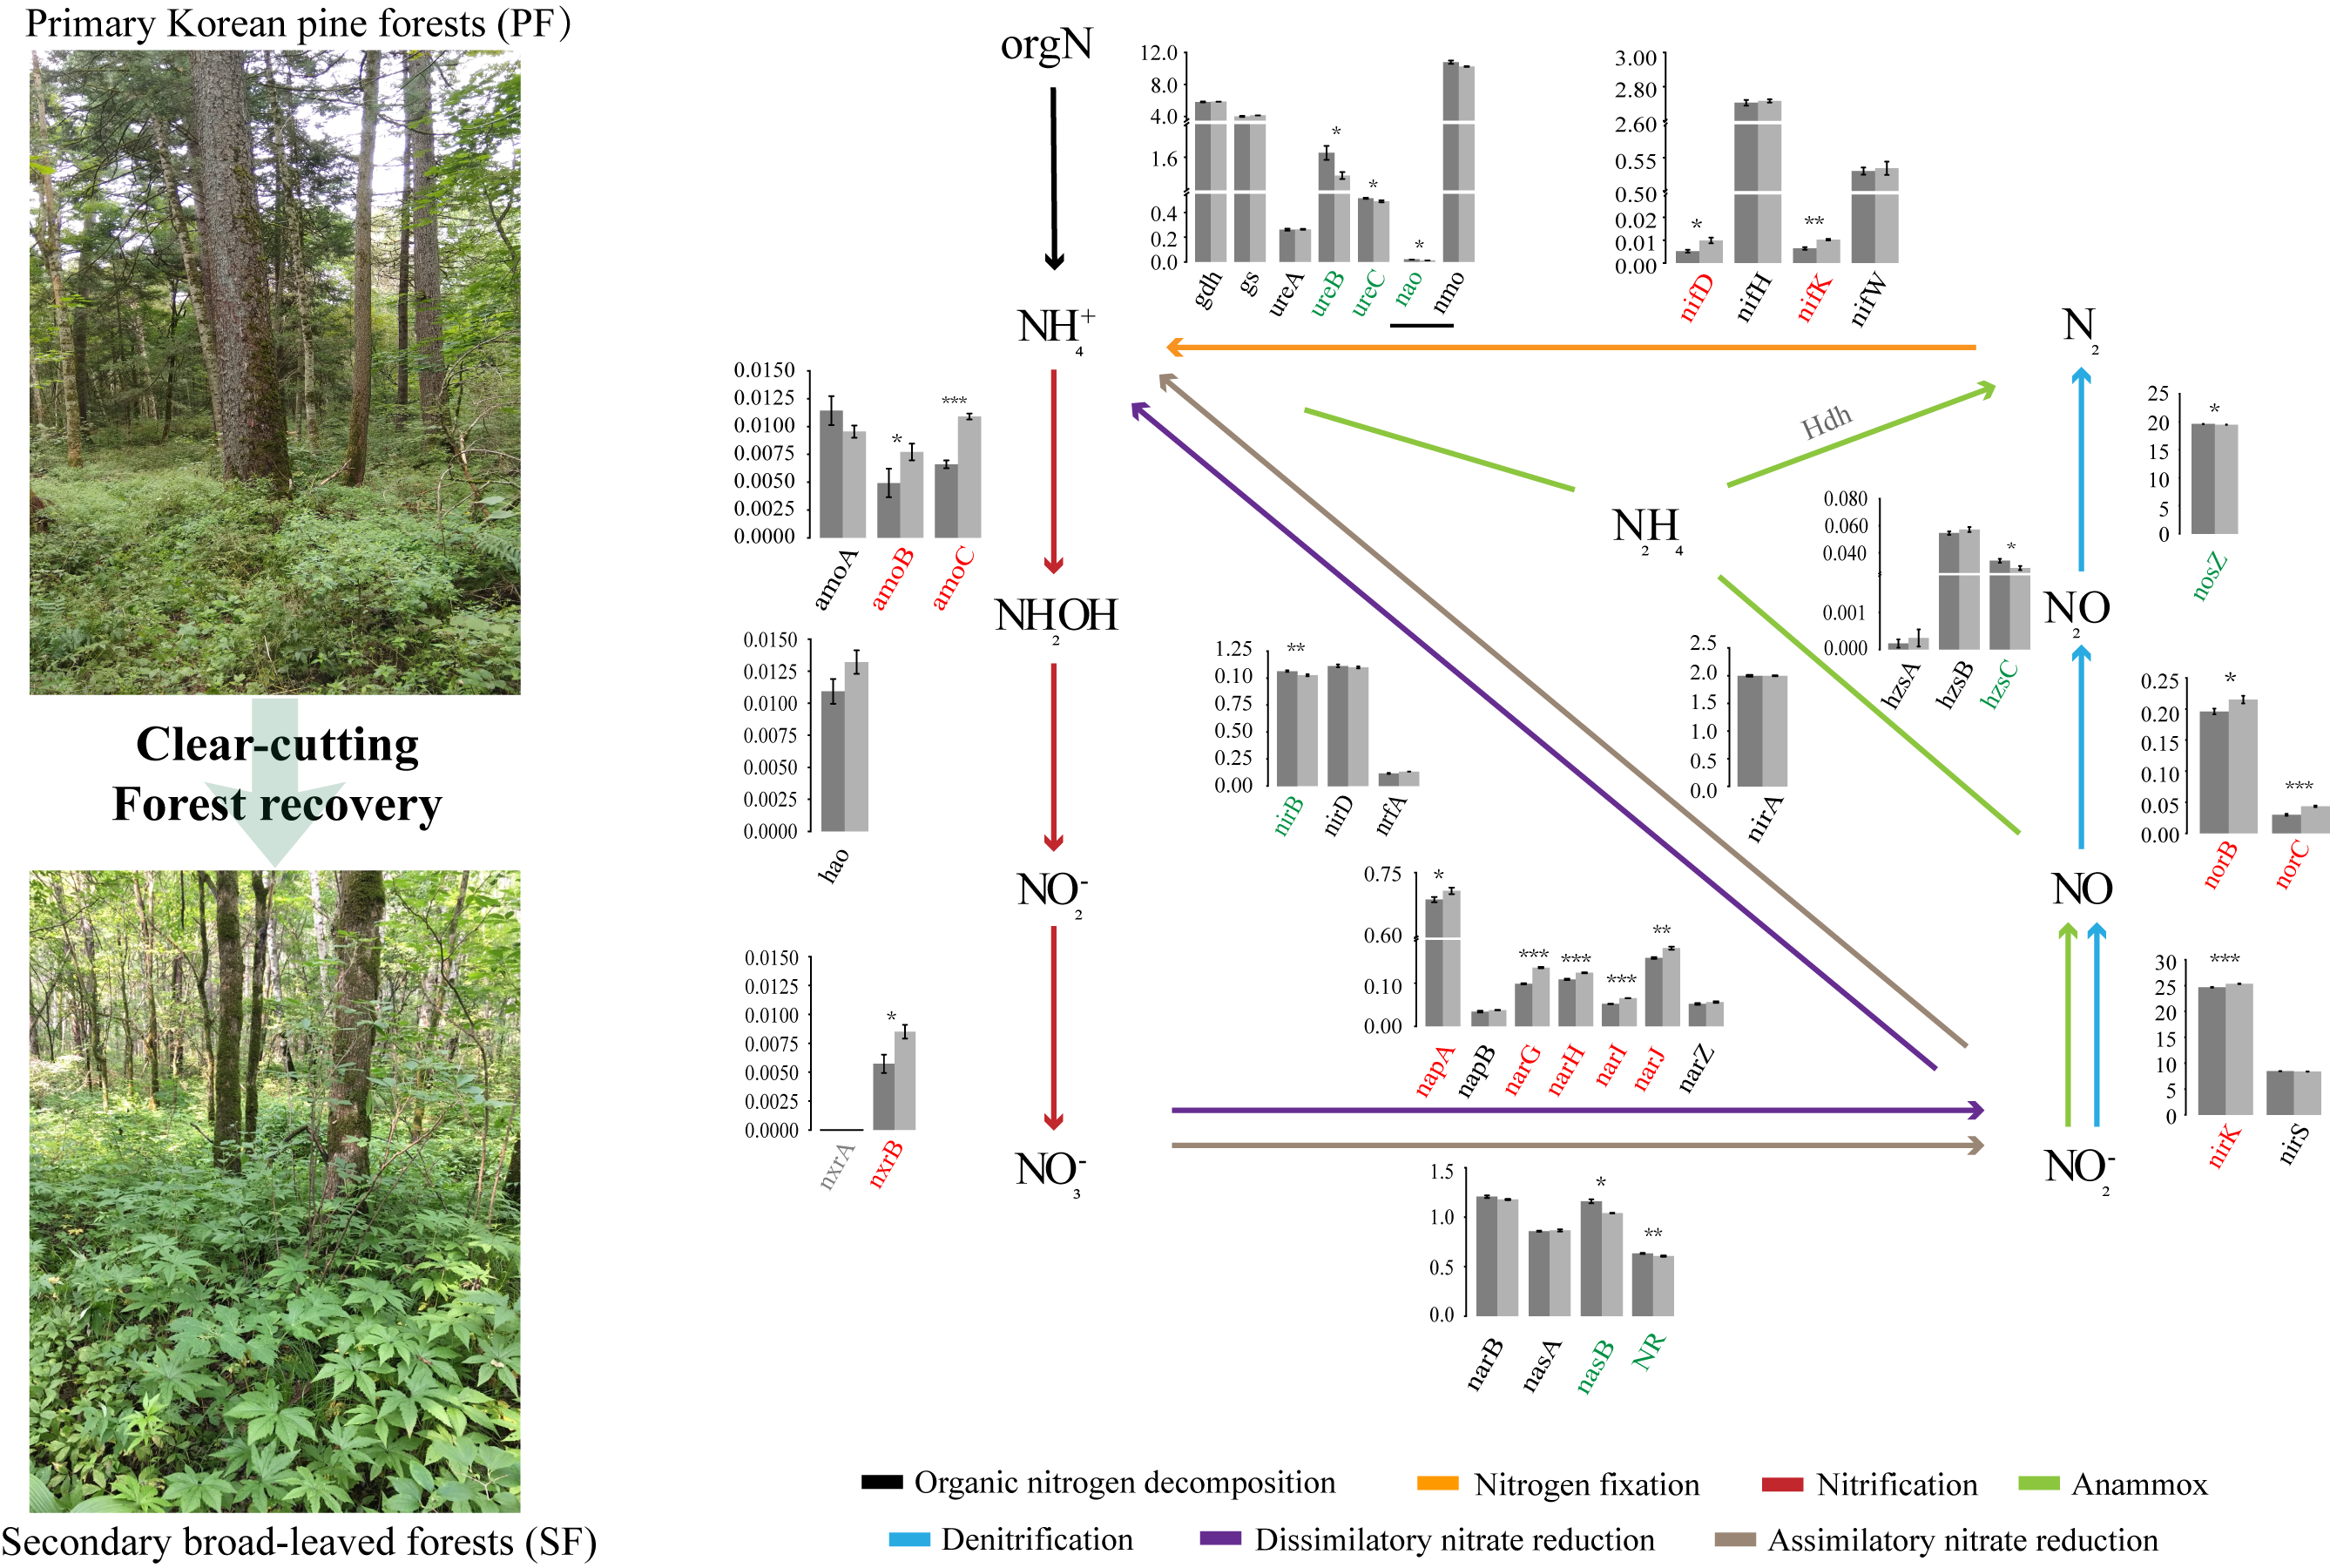
Soil samples were collected from Liangshui National Natural Reserve of Yi Chun City in Heilongjiang Province. The region is located in the southeast of the Lesser Khingan Mountains (47°12′57″ N–128°52′17″ E, 47°12′49″ N–128°52′12″ E). PF and SF were a continuous region with primary Korean pine forests before the 1960s. However, in 1961, due to clear-cutting, virtually all trees and shrubs at SF site were removed. The current secondary broad-leaved forests (Korean pine (Pinus koraiensis Siebold et Zuccarini) disappeared) at SF site had been formed over nearly 60 years. This region had not been significantly disturbed since clear-cutting occurred in 1961. The basic information of sample sites (location, altitude, area, and major tree species) is described in Table 1. The two sites are adjacent to each other, and their ecological factors such as climatic conditions, elevation, slope, and soil parent material are similar.
This region has a temperate continental monsoon climate with windy and low precipitation in the spring. Due to the higher latitude, the mean annual air temperature is −0.3 °C, and the mean annual maximum and minimum air temperatures are 7.5 °C and −6.6 °C, respectively. The annual typical precipitation period ranges from 120 to 150 d, and the mean annual rainfall is 676 mm. The mean annual evaporation is 805 mm, and the mean annual relative humidity is 78%. The snow period lasts from 130 to 180 d. According to American Soil Taxonomy, the forest soil is classified as Humaquepts or Cryoboralfs. The detailed information regarding monthly rainfall amount and air temperature of the sample sites in 2018 is shown in Figure S1.
2.2. Sample Collection, Soil Physicochemical Analyses, and In Situ Soil N Mineralization
In May 2018, five 20 m × 20 m independent plots were designed at each site (PF and SF); typical tree species, canopy cover, and typical understory vegetation were considered in the plot to avoid unrepresentative areas [15]. Ten sampling cores were randomly selected from each plot; mineral soil was taken from 0 to 10 cm depth and composited into a sample for better catching within-plot heterogeneity [2] (two sites × five replicates per site × six sampling periods). Sampling was conducted once a month and at the end of each month from May to October. All fresh samples were placed in sterile bags, transported to the lab on ice, and then sieved to 2 mm to remove litter, roots, and stones. Each soil sample was divided into two subsamples. Subsamples for molecular analyses were frozen at −80 °C. Subsamples for soil physicochemical analyses were air dried. Only samples collected in July were used for subsequent molecular analyses. First, high-throughput 16S rRNA sequencing was performed on ten soil samples. Then, six representative samples which best reflected the overall differences between the two forest types were selected for metagenome sequencing using MicroPITA analysis (microbiomes: Picking Interesting Taxonomic Abundance) [16] (Figure 1).
The main soil physicochemical properties were determined, such as soil moisture content (Mc), pH, soil bulk density (Bd), total carbon (TC), total nitrogen (TN), soil organic matter (SOM), NH4+, NO3−, total phosphorus (TP), available phosphorus (AP), and dissolved organic carbon (DOC). The detailed methods for extraction and determination are described in the Supplementary Material. The soil properties of the two forest types are shown in Table S1.
In May–October 2018, two points were randomly selected in each plot, and two PVC tubes (25 cm in height and 5 cm in diameter) were simultaneously inserted into the soil to a depth of 20 cm at each point (the organic layer was removed). One was taken out immediately and brought back to the laboratory for indoor analyses. The original structure of the soil in the second tube was preserved as much as possible; the upper mouth was covered with breathable and non-water permeable file, the lower mouth was wrapped with gauze and tied with a thin iron wire, and the tube was re-inserted into the original hole and retrieved after 30 d (Figure S2). Simultaneously, the next batch of tubes was arranged near the previous culture point as described above. The NH4+ and NO3− content to calculate net ammonification rate, net nitrification rate, and net N mineralization rate was determined from the top 10 cm of soil collected from each soil core [17,18].
2.3. Metagenome Sequencing
Microbial total DNA was extracted from 0.5 g fresh soil through the FastDNA® SPIN Kit for Soil (MP Biomedicals, Santa Ana, CA, USA) following manufacturer’s instructions. The DNA concentration, purity, and integrity were detected by TBS-380 (Turner BioSystems, Sunnyvale, CA, USA), NanoDrop2000 (Thermo Fisher Scientific, Waltham, MA, USA), and 1% agarose gel electrophoresis, respectively. The genomic DNA of soil samples was sheared to approximately 300 bp fragments using the Covaris M220 Ultrasonic Crusher (Gene Company Limited, Hong Kong, China). Subsequently, a paired-end library of metagenome was constructed using the NEXTFLEX Rapid DNA-Seq Kit (Bioo Scientific, Austin, TX, USA) with relevant instructions and sequenced on the Illumina NovaSeq platform (Illumina, San Diego, CA, USA).
2.4. Raw Sequences Processing
After quality control, clean reads were assembled to contigs for subsequent gene prediction based on open reading frames (ORFs) of each contig. The predicted gene sequences of all samples were clustered for construction of a non-redundant gene catalogue. The method of reads per kilobase per million mapped reads (RPKM) was used to calculate gene abundance, which reduced the impact of different sequencing depth and gene length between samples [19]. The non-redundant gene catalogue was aligned to related databases for taxonomic annotations and functional annotations. Detailed descriptions are shown in the Supplementary Material.
In this study, six soil samples were used for metagenome sequencing, which resulted in about 108 Gbp raw base, 764,170,458 clean reads, 14,473,672 contigs, and 18,241,758 ORFs. The constructed non-redundant gene catalogue had 12,250,083 genes. Raw data of the metagenome were stored in the NCBI Sequence Read Achieve database (SRA) with an accession number (SRP250876).
2.5. Data Analysis
The data were checked for normality (Shapiro–Wilk test) and homogeneity of variance (Levene test) before statistical analysis. The differences in soil physicochemical properties, inorganic N content (NH4+, NO3−), N transformation rates, microbial community and functional alpha diversity, abundance of genes related to stress response and defence, and abundance of total functional genes of VFDB database between two forest types were compared by Student’s t-test. The influences of forest types, months, and their interactives effects on NH4+, NO3−, net ammonification rate, net nitrification rate, and net mineralization rate were estimated by two-way ANOVA. Statistical significance of differences in the relative abundance of microbial composition (microbial bacterial domain and phyla, order involved in N cycling), functional categories of EggNOG, metabolic pathways of KEGG level3, and functional genes related to N cycling between the two forest types were evaluated using Welch’s t-test with Benjamini–Hochberg FDR correction. The differences in soil microbial community structure, functions, and metabolic pathways between the two forest types were analysed using Principal Coordinates Analysis (PCoA) based on Bray–Curtis distances with permutational multivariance analysis of variance (PERMANOVA) test (999 permutations). Statistical significance level was fixed to p < 0.05. The analyses were performed using the SPSS 20.0 (SPSS Inc., Chicago, IL, USA) and R version 4.0.0.
3. Results
3.1. Seasonal Dynamics of Soil Inorganic N and N Transformation Rates
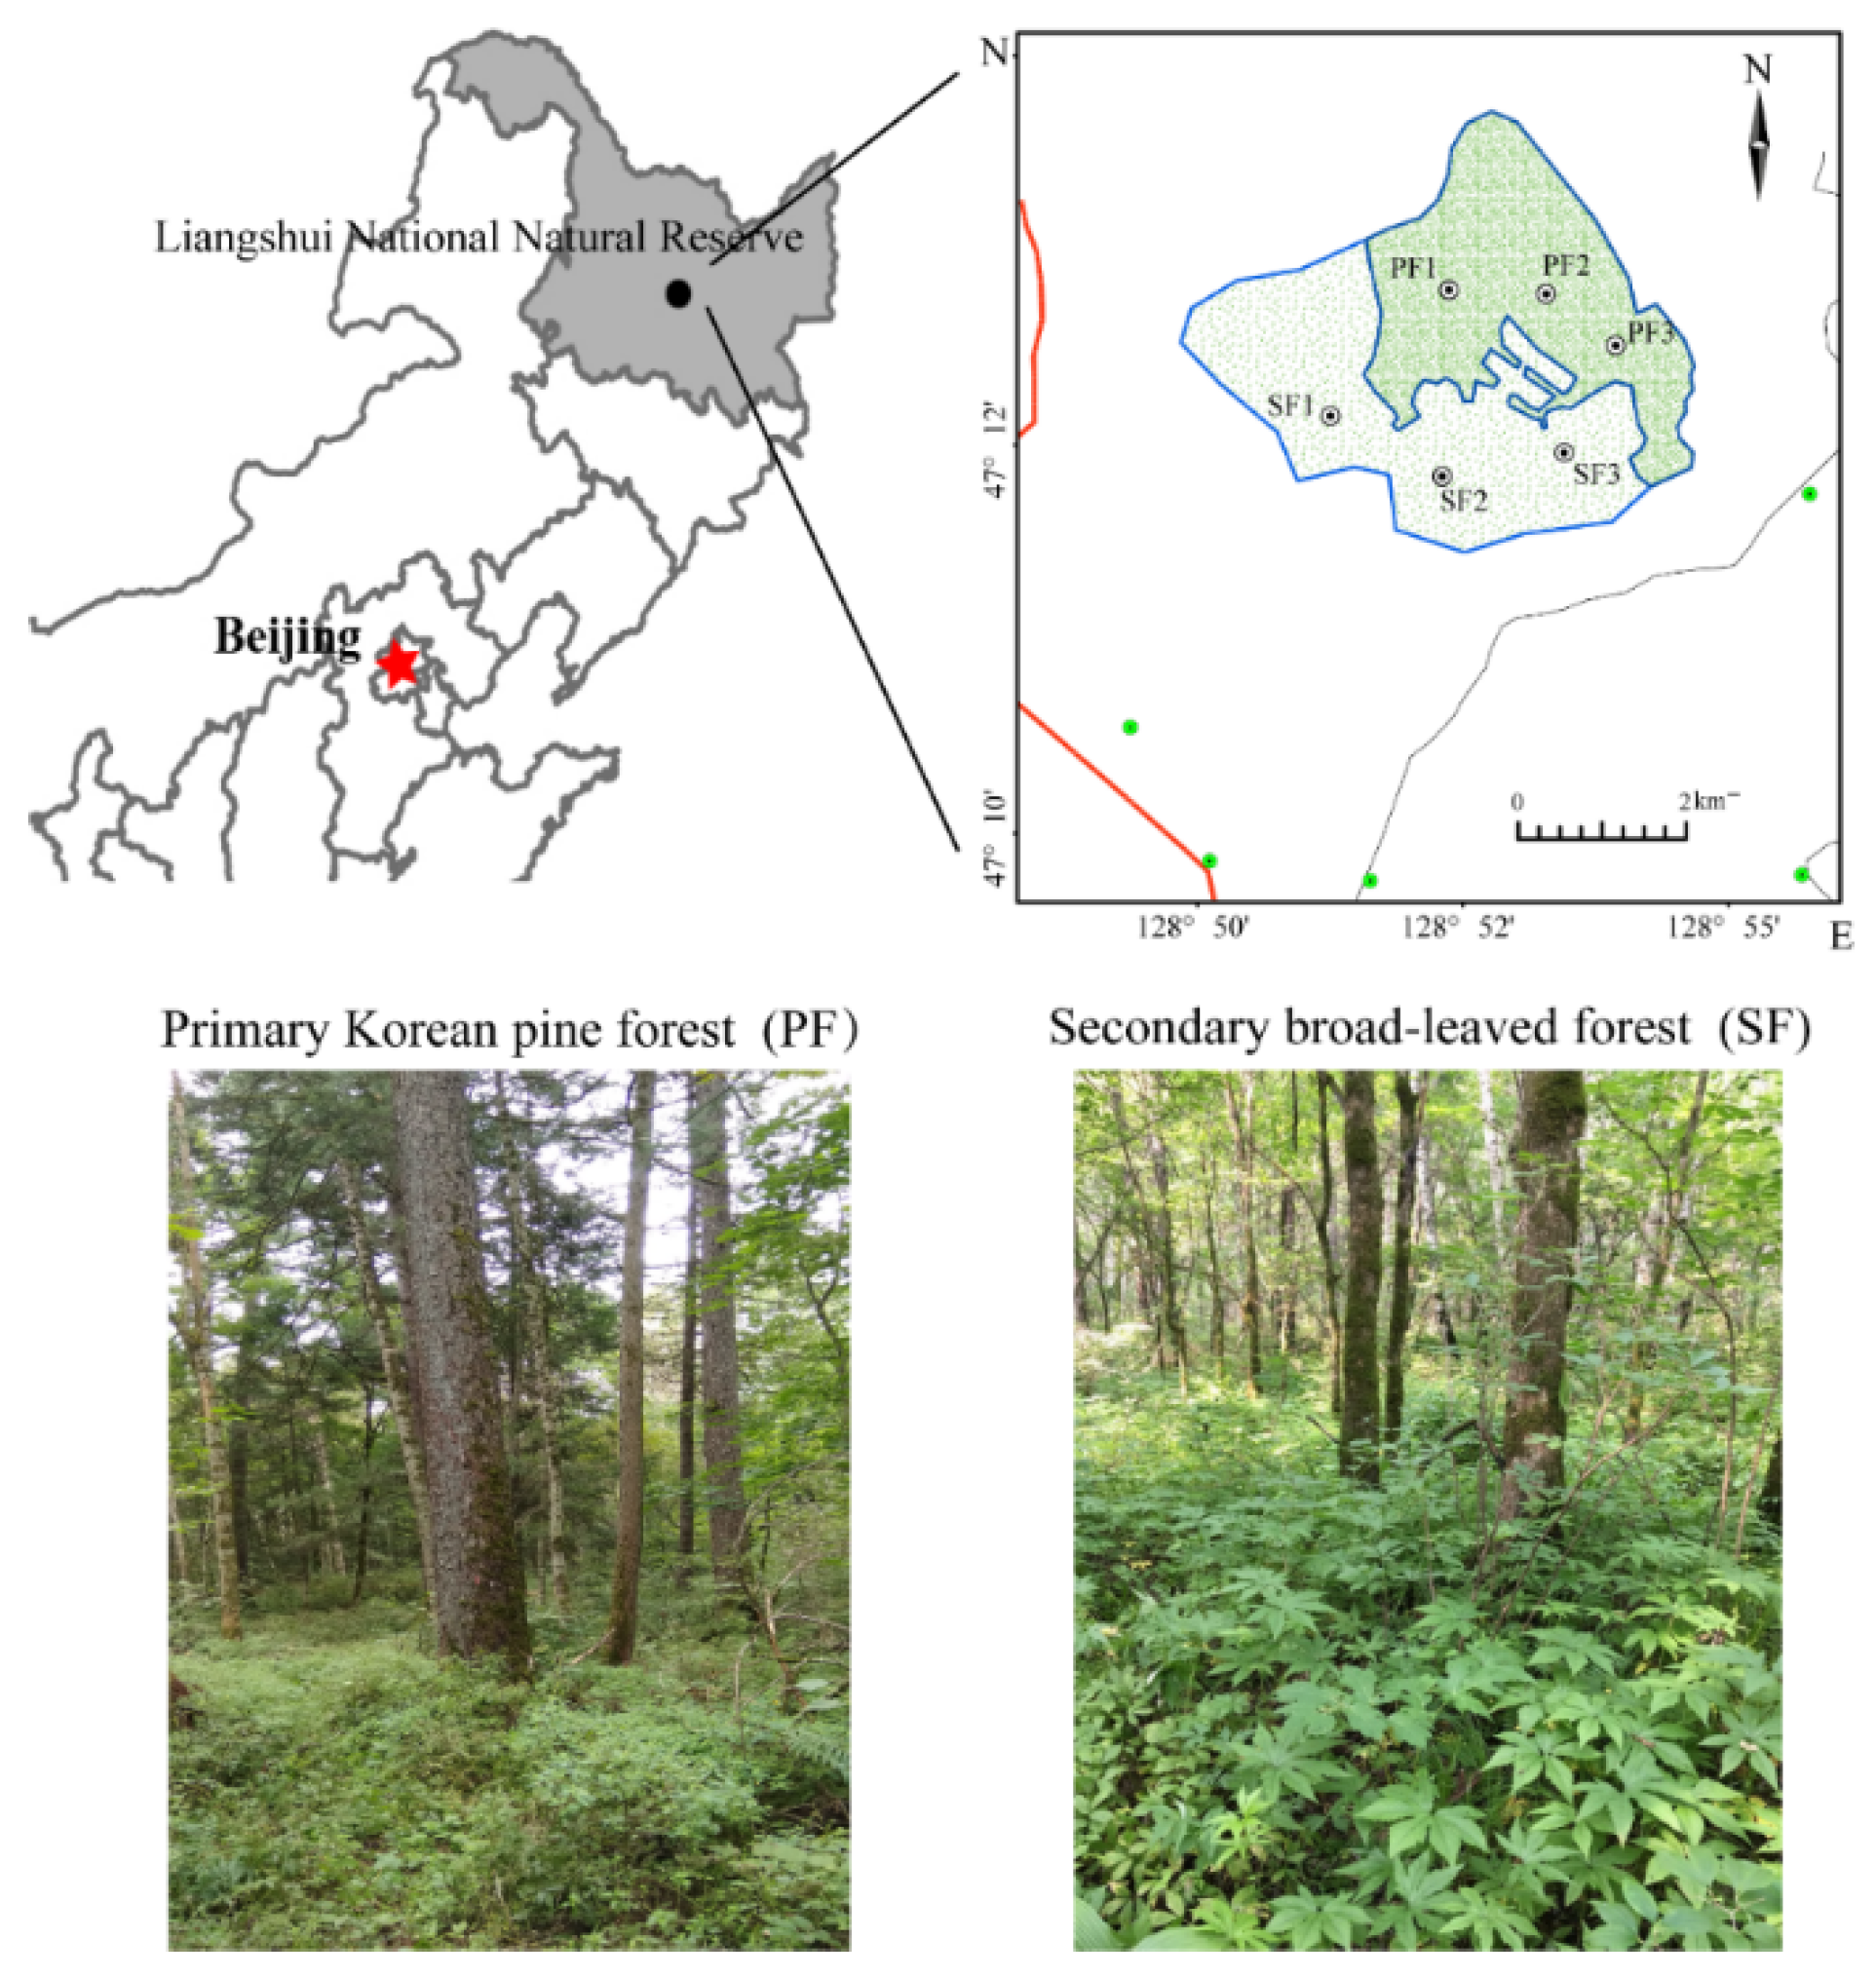
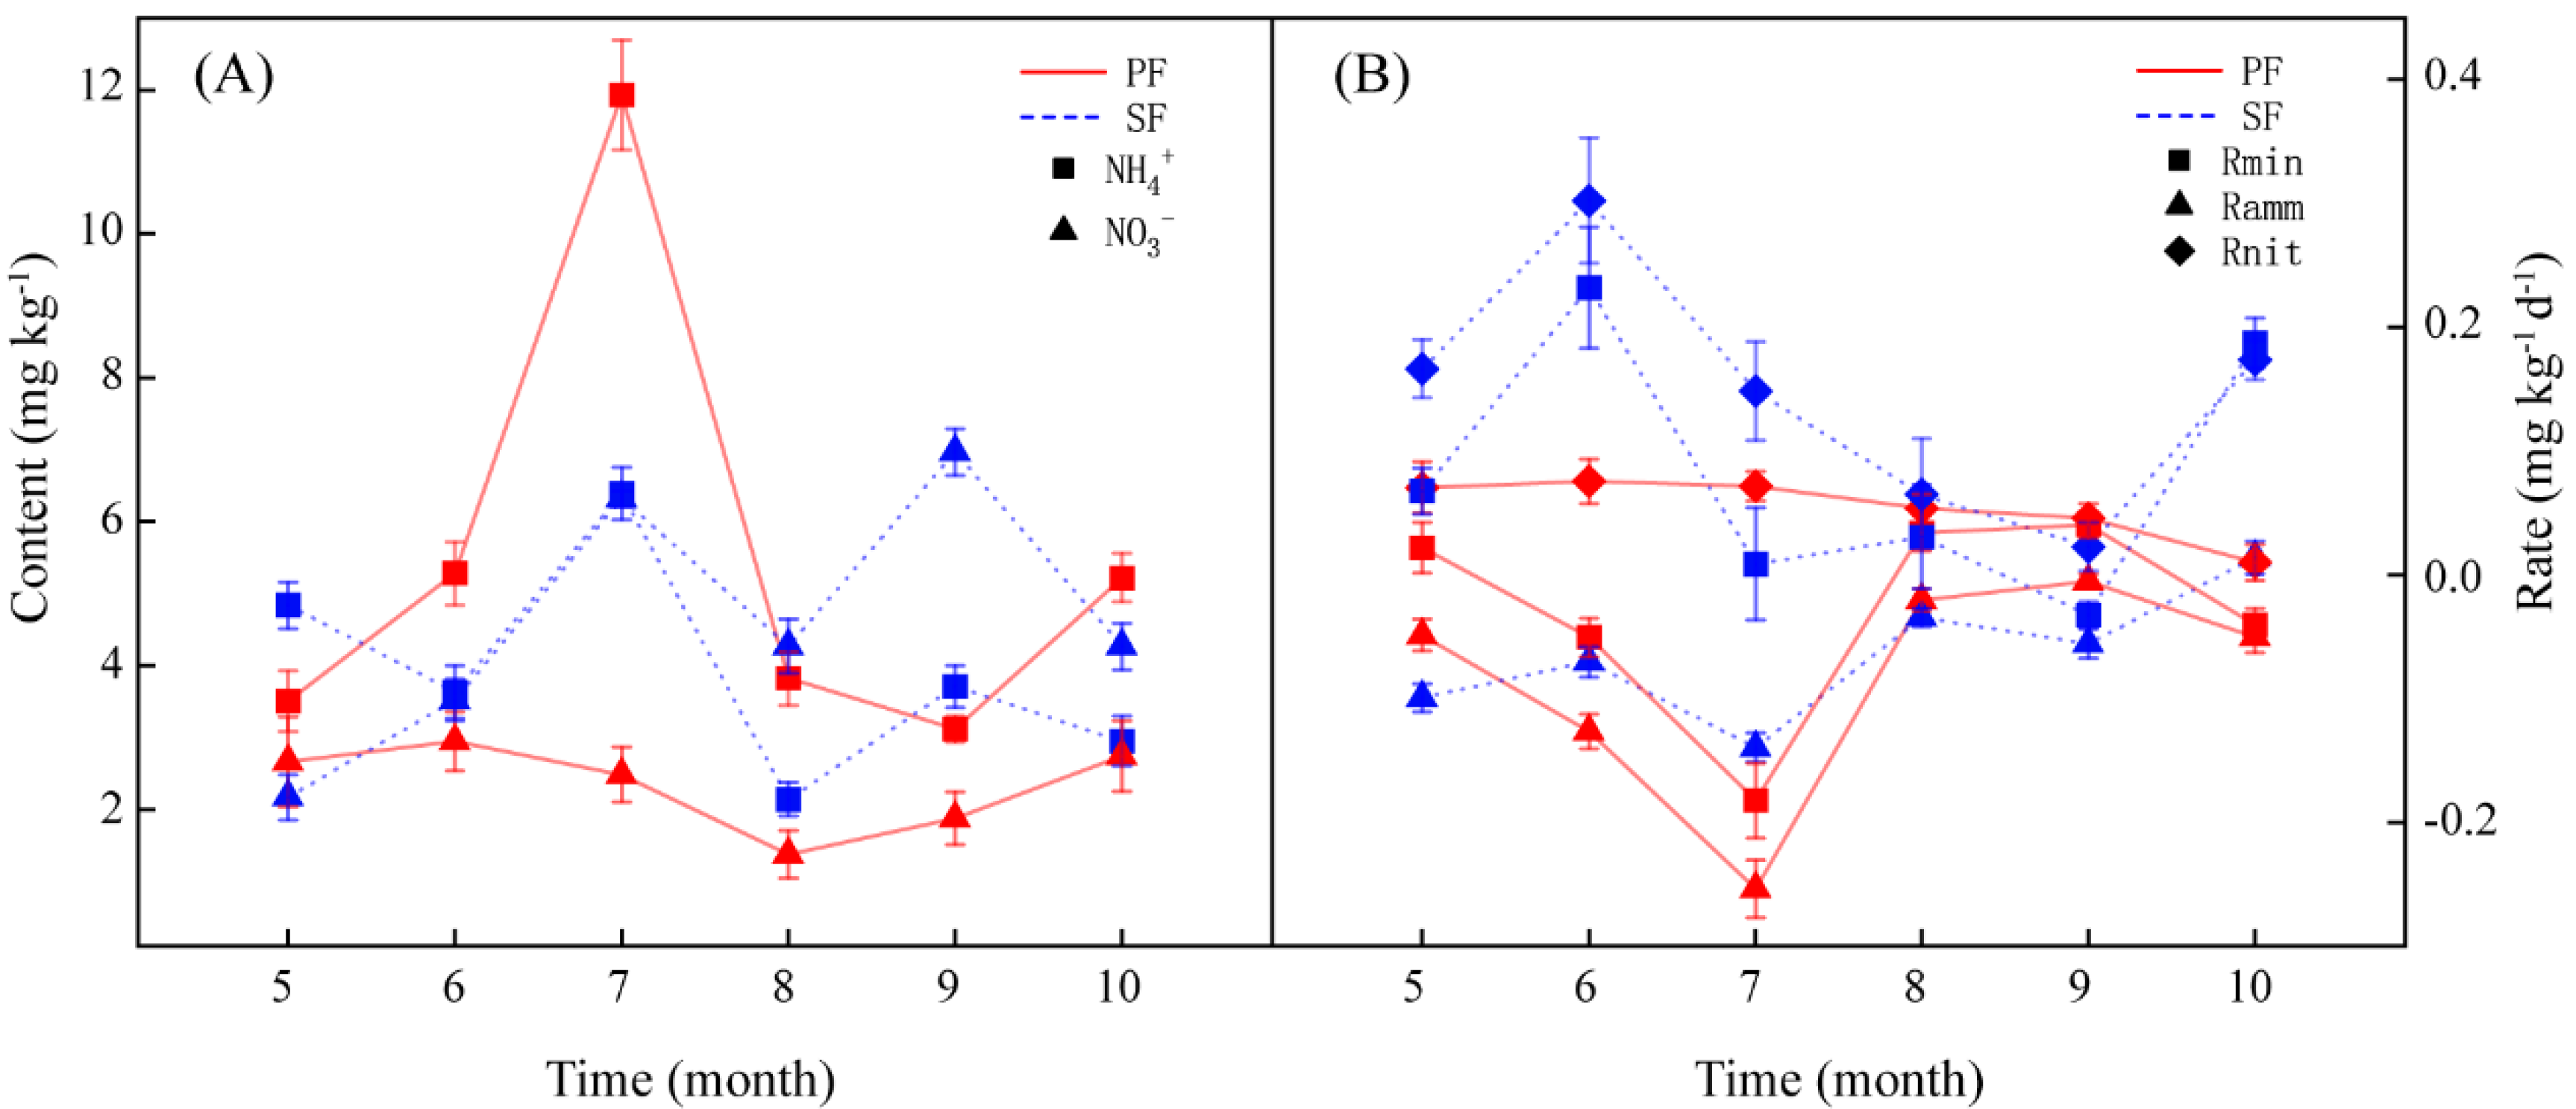
During the period from May to October, the soil NH4+ content of PF and SF varied with the month. However, they all reached the peak in July. The difference of NH4+ between the two forest types was the largest, and the NH4+ of PF was significantly higher than that of SF in July (Table S2). The changes in the NO3− content of the two forest types with the month also differed, but the NO3− from July to September differed greatly between the two forest types and reached significant levels (Table S2), all of which were higher in SF (Figure 2A). The forest types, the months, and their interactions had a significant effect on soil inorganic N dynamics (Table S3).
This study analysed the seasonal dynamics of in situ soil N transformation rates in the two forest types (Figure 2B). The soil N transformation rates of the PF and SF varied with the month and fluctuated more greatly in the early period of growth (May–July). The forest types, the months, and their interactions had a significant effect on soil N transformation rates (Table S3).
3.2. Variations in Soil Microbial Community Composition and Potential Functions between Two Forest Types
Taxonomic and functional alpha diversity (Shannon) of microbial communities differed significantly between the two forest types (p < 0.05, p < 0.01). The higher taxonomic diversity and the lower functional diversity were observed in SF. However, there was no significant difference in soil microbial richness (p > 0.05) (Figure S3). Soil microbial community structure (genus), functions (genes, eggNOG), and metabolism pathways (level 3, KEGG) differed between the two forest types (Figure S4).
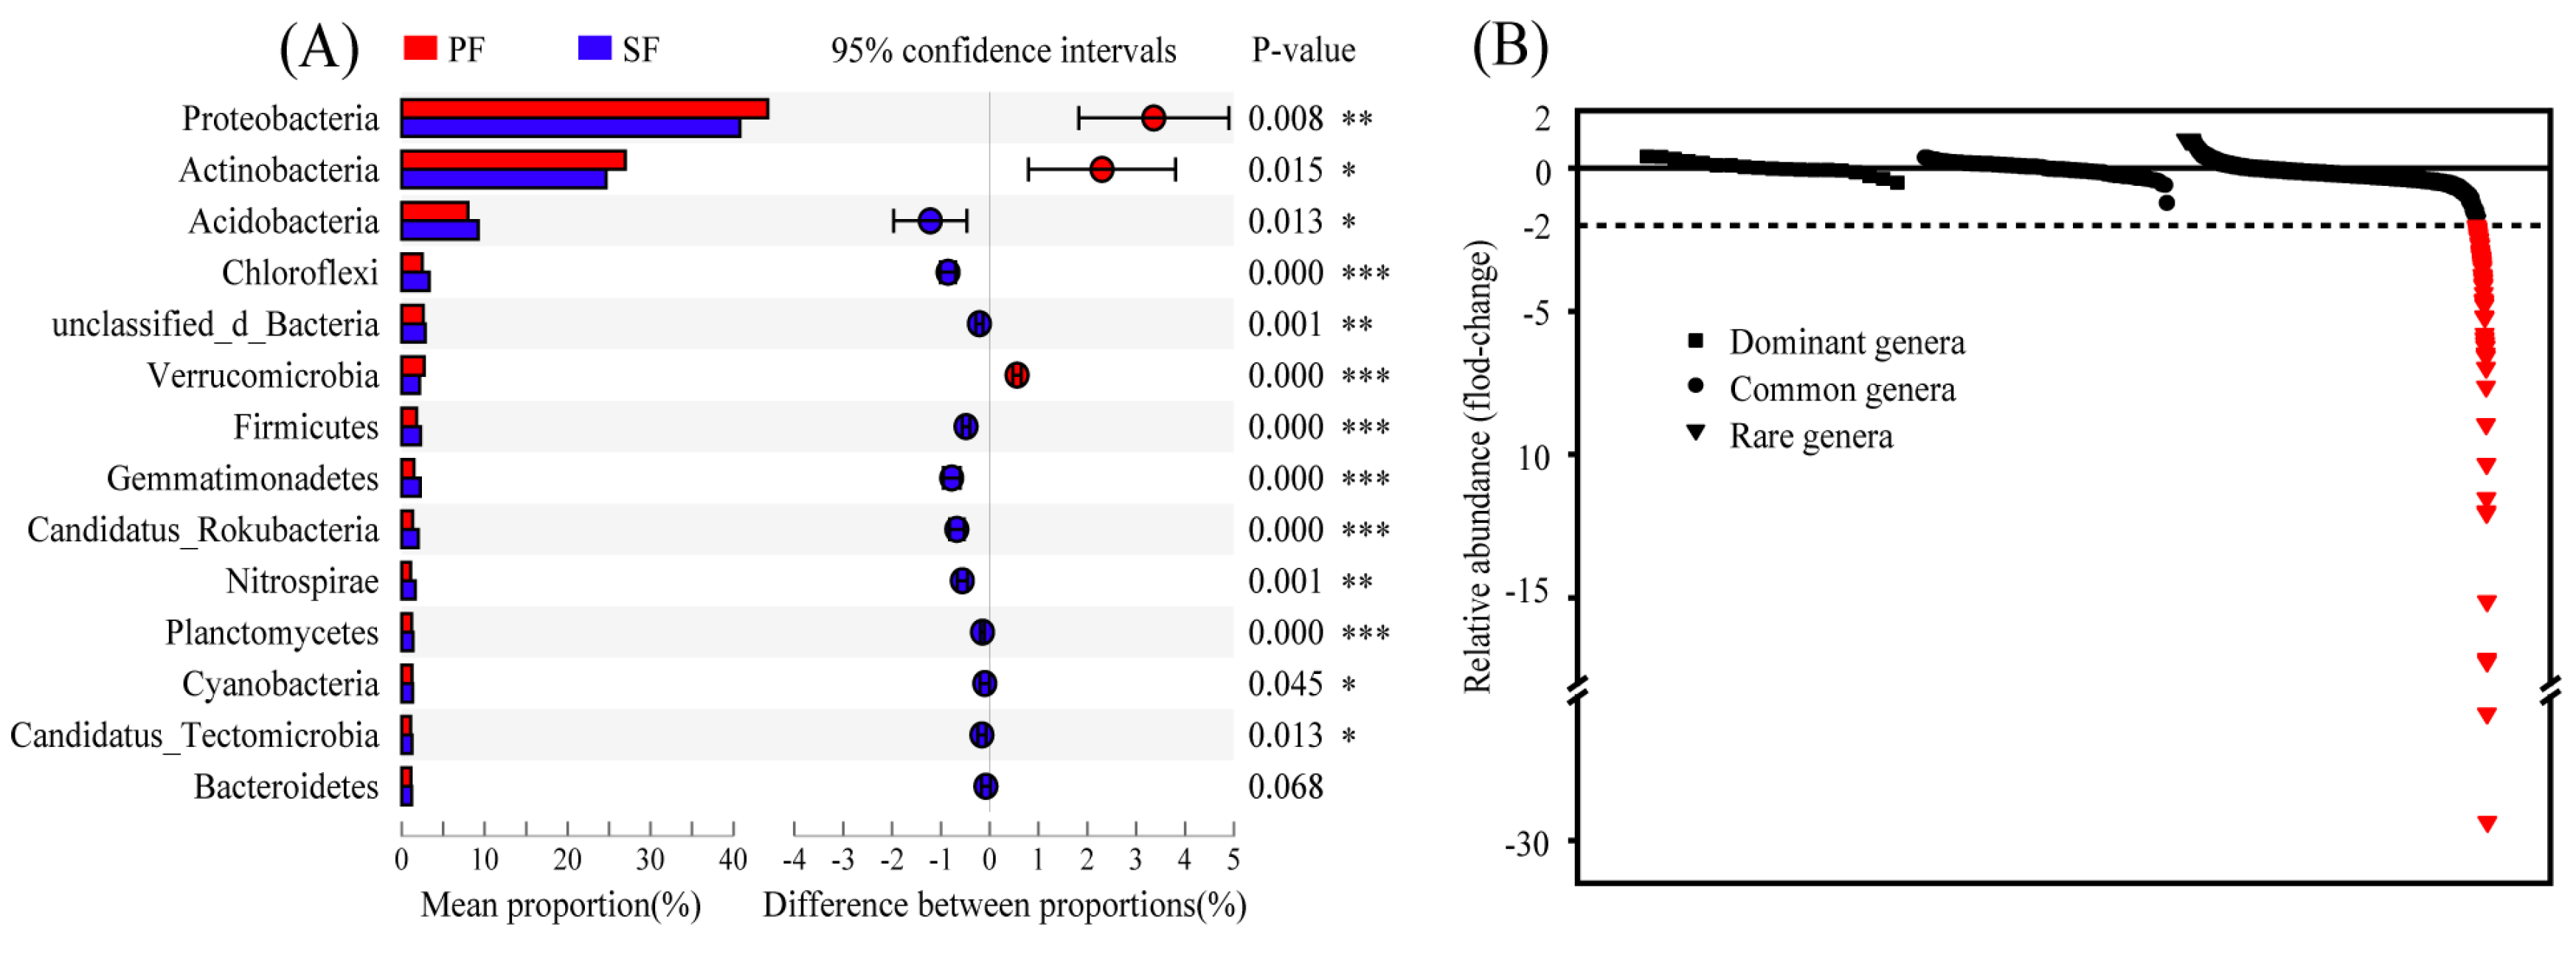
Bacteria of PF and SF determined by metagenome sequencing accounted for 98.92% and 98.48% of the total microbiome, respectively, and the differences in the relative abundance of bacteria between the two forest types were significant (Table S4). A total of 128 phyla were detected in the two forest types, and the dominant phyla were nearly identical, but the relative abundance of these phyla was slightly different. Further analysis of the top 14 phyla with relative abundance greater than 1% revealed that 13 were significantly different in the relative abundance between PF and SF. Proteobacteria, Actinobacteria, and Verrucomicrobia were significantly enriched in PF; however, Acidobacteria, Chloroflexi, unclassified_d_Bacteria, Firmicutes, Gemmatimonadetes, Candidatus_Rokubacteria, Nitrospirae, Planctomycetes, Cyanobacteria, and Candidatus_Tectomicrobia were significantly enriched in SF (Figure 3A). Proteobacteria (44.15%, 40.79%), Actinobacteria (26.96%, 24.66%), and Acidobacteria (7.99%, 9.21%) were the most abundant categories in the two forest types, accounting for 79.46% and 74.66% of the total microbiome, respectively. Similar results were observed in the taxonomic classification of 16S rRNA sequencing data with spearman correlation coefficient r > 0.80 (Figure S5). At the genus level, a total of 2939 genera were detected and divided into dominant genera (>1%), common genera (0.1–1%), and rare genera (<0.1%) based on their relative abundance [20]. Fold-changes calculated based on relative abundance of genera were compared. We found that the fold-changes in the dominant genera and the common genera were smaller (−1 < fold-changes < 1), while the fold-changes of some rare genera were larger. Among the rare genera, considerable increases (fold-changes < −2) were seen in the relative abundance of 96 rare genera in SF, and even included a fold-change of <−29 (Figure 3B).
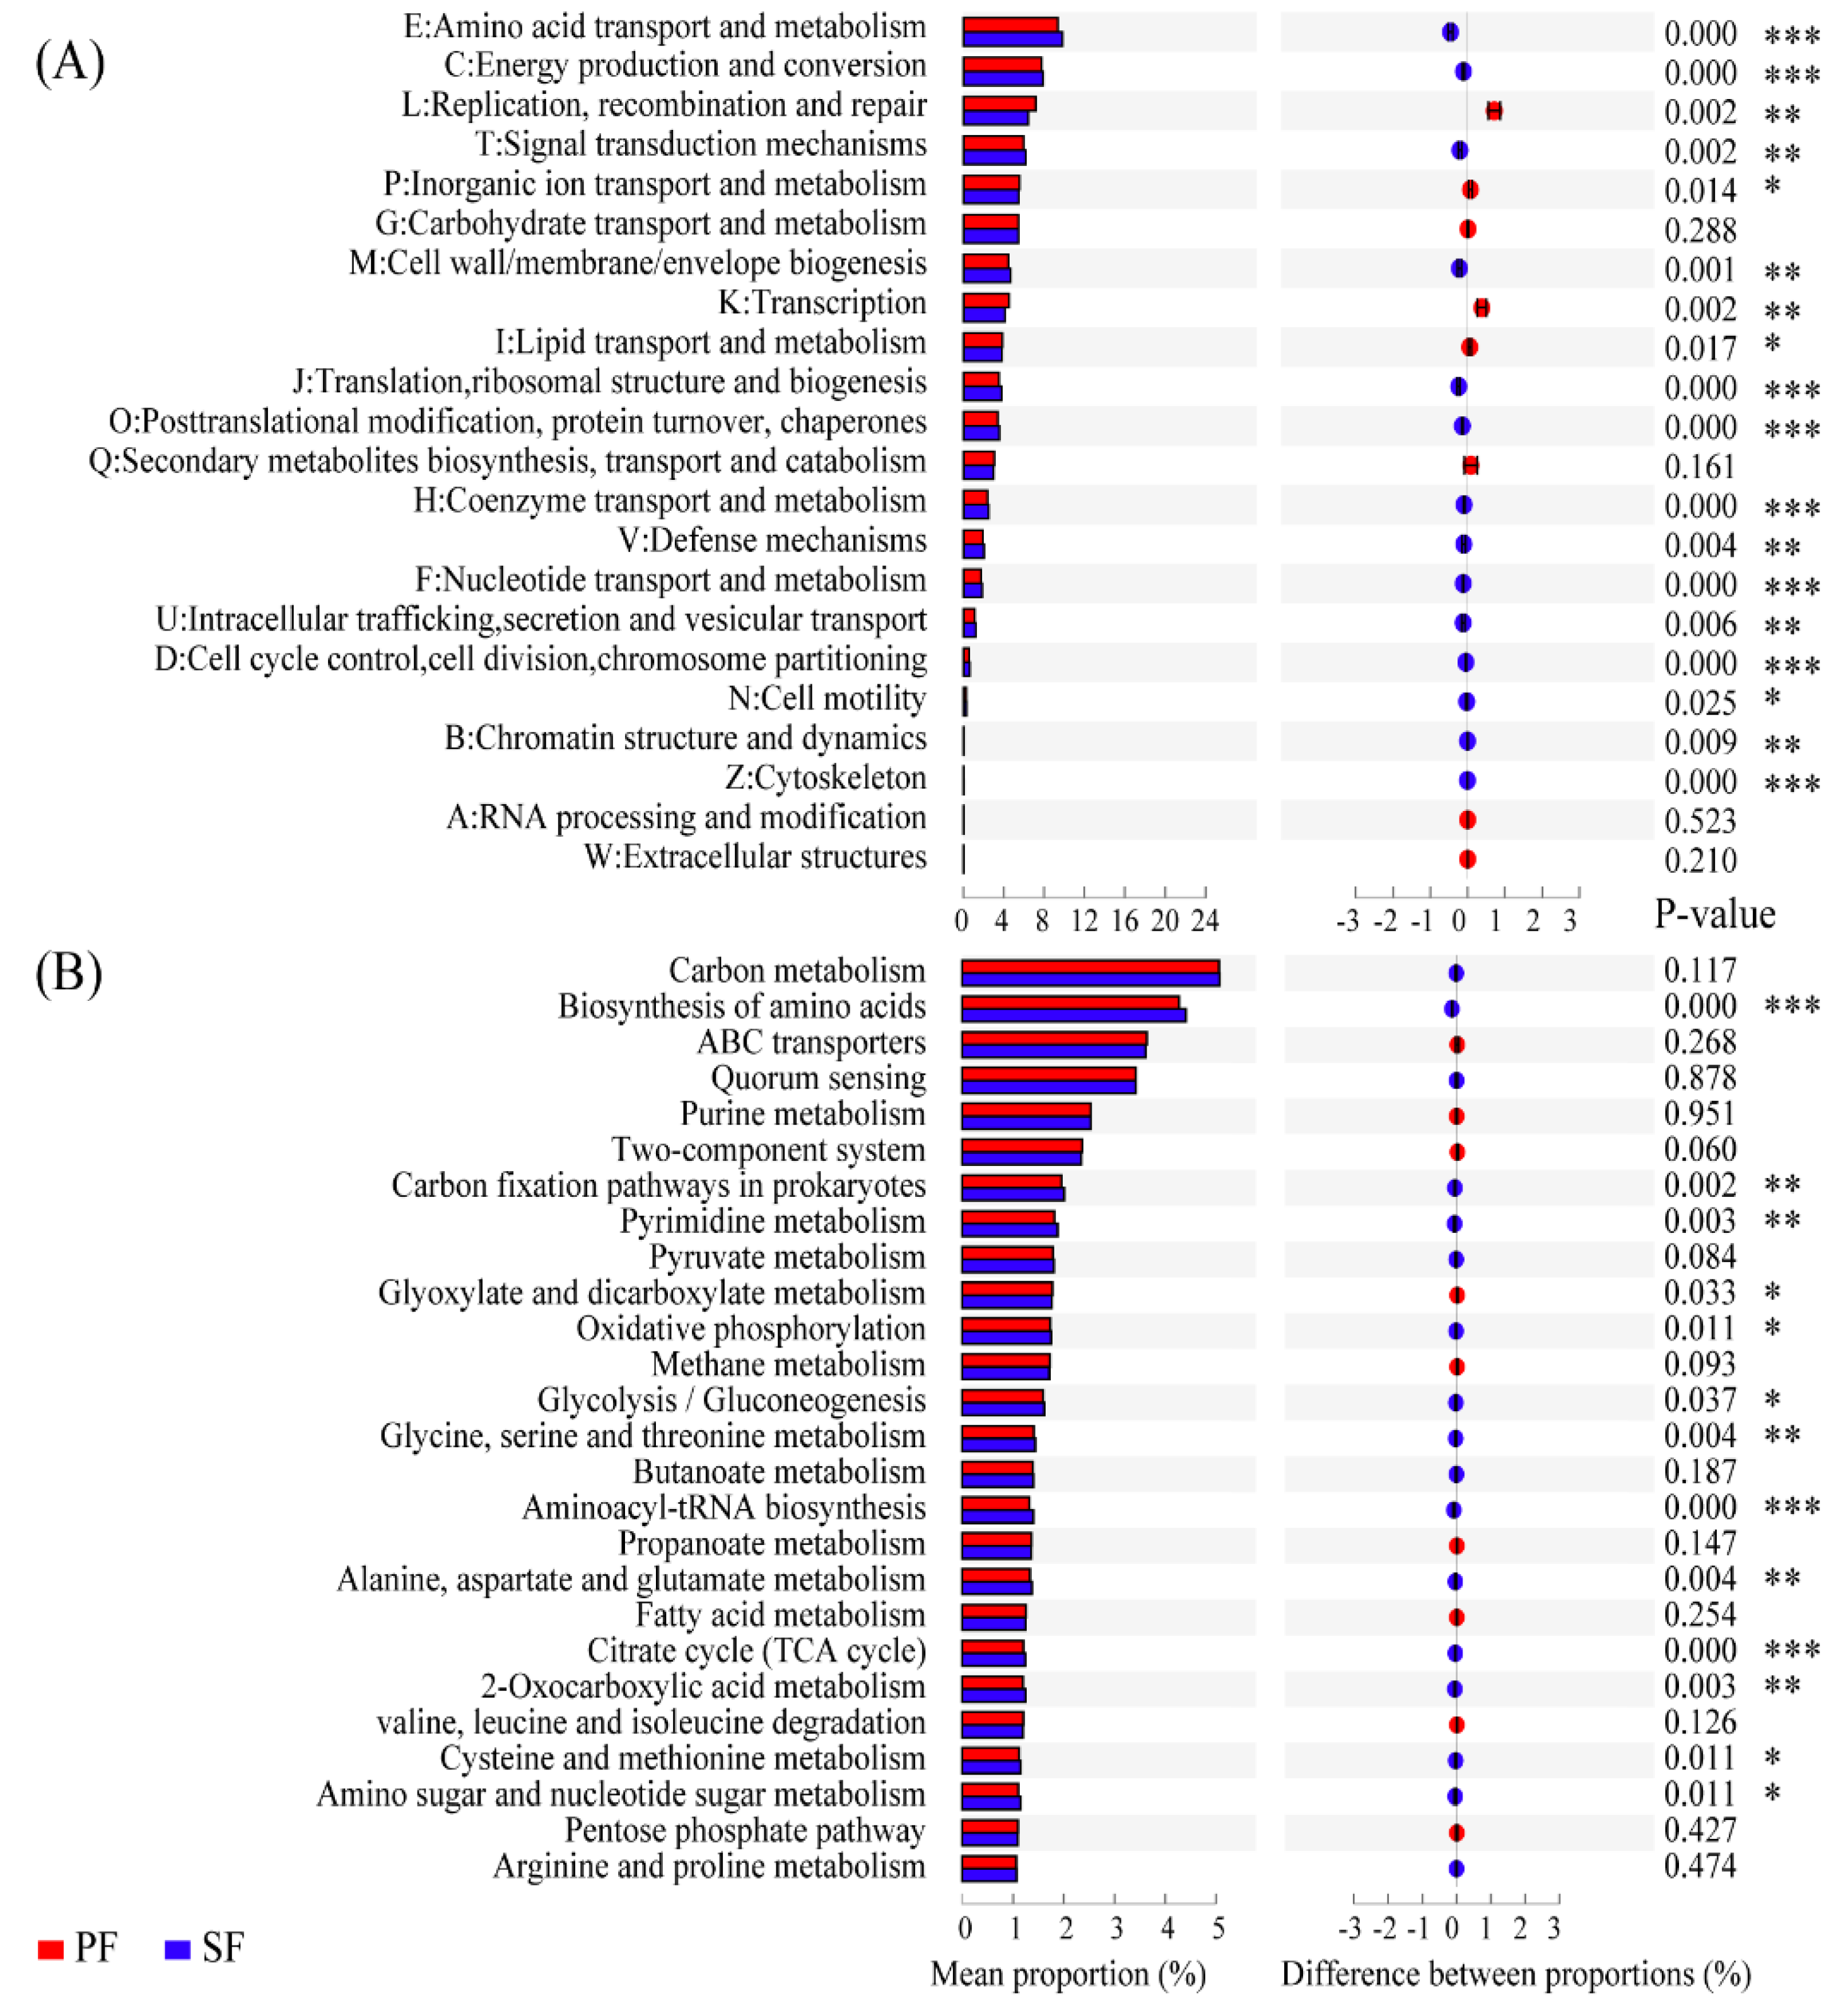
To identify soil microbial functional categories, all reads were annotated by means of categories in the eggNOG, KEGG, and VFDB database. Firstly, in functional categories of the eggNOG database, there were 39.25% and 39.80% of the total reads in PF and SF associated with metabolism, respectively, and the differences between the two forest types reached significance (p < 0.01). Further analyses showed that there were 22 functional categories, 18 of which were significantly different in percentage abundance between PF and SF (p < 0.05). Amino acid transport and metabolism (E), energy production and conversion (C), signal transduction mechanisms (T), cell wall/membrane/envelope biogenesis (M), translation, ribosomal structure, and biogenesis (J), post-translational modification, protein turnover, chaperones (O), coenzyme transport and metabolism (H), defence mechanisms (V), nucleotide transport and metabolism (F), intracellular trafficking, secretion, and vesicular transport (U), cell cycle control, cell division, chromosome partitioning (D), cell motility (N), chromatin structure and dynamics (B), and cytoskeleton (Z) were significantly enriched in SF. However, replication, recombination and repair (L), inorganic ion transport and metabolism (P), transcription (K), and lipid transport and metabolism (I) were significantly enriched in PF (Figure 4A). Secondly, at the metabolic pathways of KEGG level 3, there were a total of 26 metabolic pathways with the percentage abundance greater than 1%, 13 of which were significantly different in the percentage abundance between the two forest types. Glyoxylate and dicarboxylate metabolism was significantly overexpressed in PF. While, the biosynthesis of amino acids, carbon fixation pathways in prokaryotes, pyrimidine metabolism, oxidative phosphorylation, glycolysis/gluconeogenesis, glycine, serine and threonine metabolism, aminoacyl-tRNA biosynthesis, alanine, aspartate and glutamate metabolism, TCA cycle, 2-oxocarboxylic acid metabolism, cysteine and methionine metabolism, and amino sugar and nucleotide sugar metabolism were overexpressed significantly in SF (Figure 4B). Overall, most of the gene sequences related to the microbial core metabolic functions were significantly enriched in SF, indicating that soil microbes in SF exhibited stronger metabolic capabilities. Finally, in the VFDB database, the virulence factor-related genes of PF and SF accounted for 9.18% and 9.29% of the total annotated genes, respectively, and the differences in the percentage abundance between the two forest types were significant (p = 0.035). Furthermore, the genes related to stress response (0.45%, 0.45%) and defence (1.97%, 2.08%) were more abundant in SF (p = 0.037, p = 0.003). These results indicated that interspecific competition of soil microbes was more intense in SF.
3.3. Variations in Soil Microbial N Cycling between the Two Forest Types
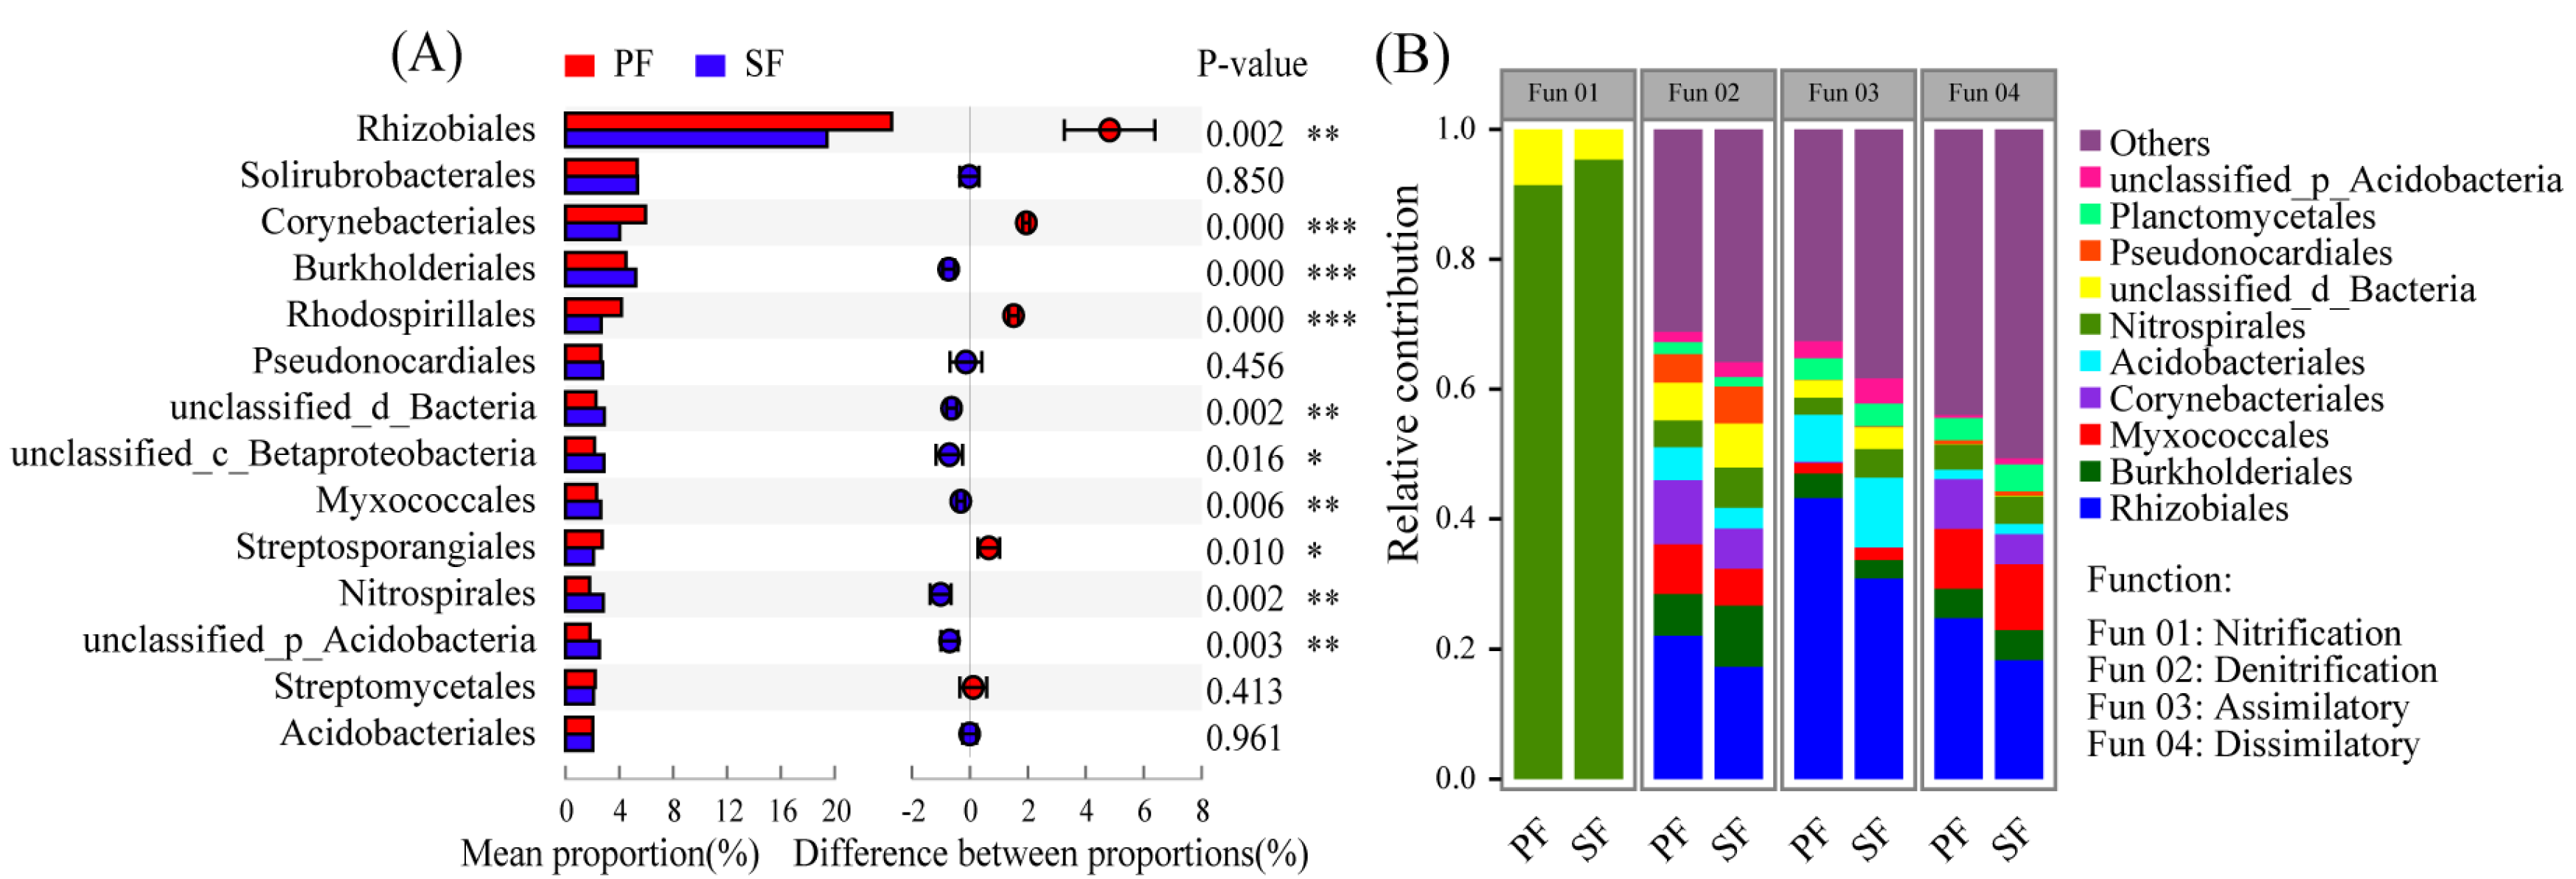
At the order level, there were a total of 14 orders involved in N cycling with the relative abundance greater than 2%, 10 of which were significantly different in the relative abundance between the two forest types (Figure 5A, Table S5). Rhizobiales were the dominant groups responsible for N cycling and the relative abundance was the highest. Moreover, the relative abundance of orders involved in each process of N cycling was also significantly different between the two forest types (Figure 5B, Figure S6). Rhizobiales were responsible for denitrification, assimilatory nitrate reduction, and DNRA. Burkholderiales, Myxocaccales, Acidobacteriales, and Nitrospirales, etc. were also responsible for multiple N cycling processes, and their contributions in different processes were different. However, the Nitrospirales contributed up to 90% of the total detected genes in nitrification, and their relative abundance might determine the strength of nitrification. Microbes involved in N fixation with low abundance were not shown in Figure 5B.
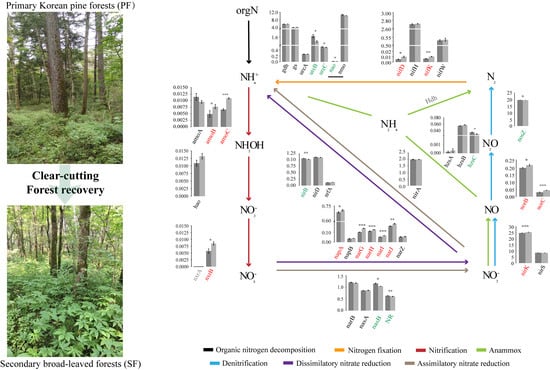
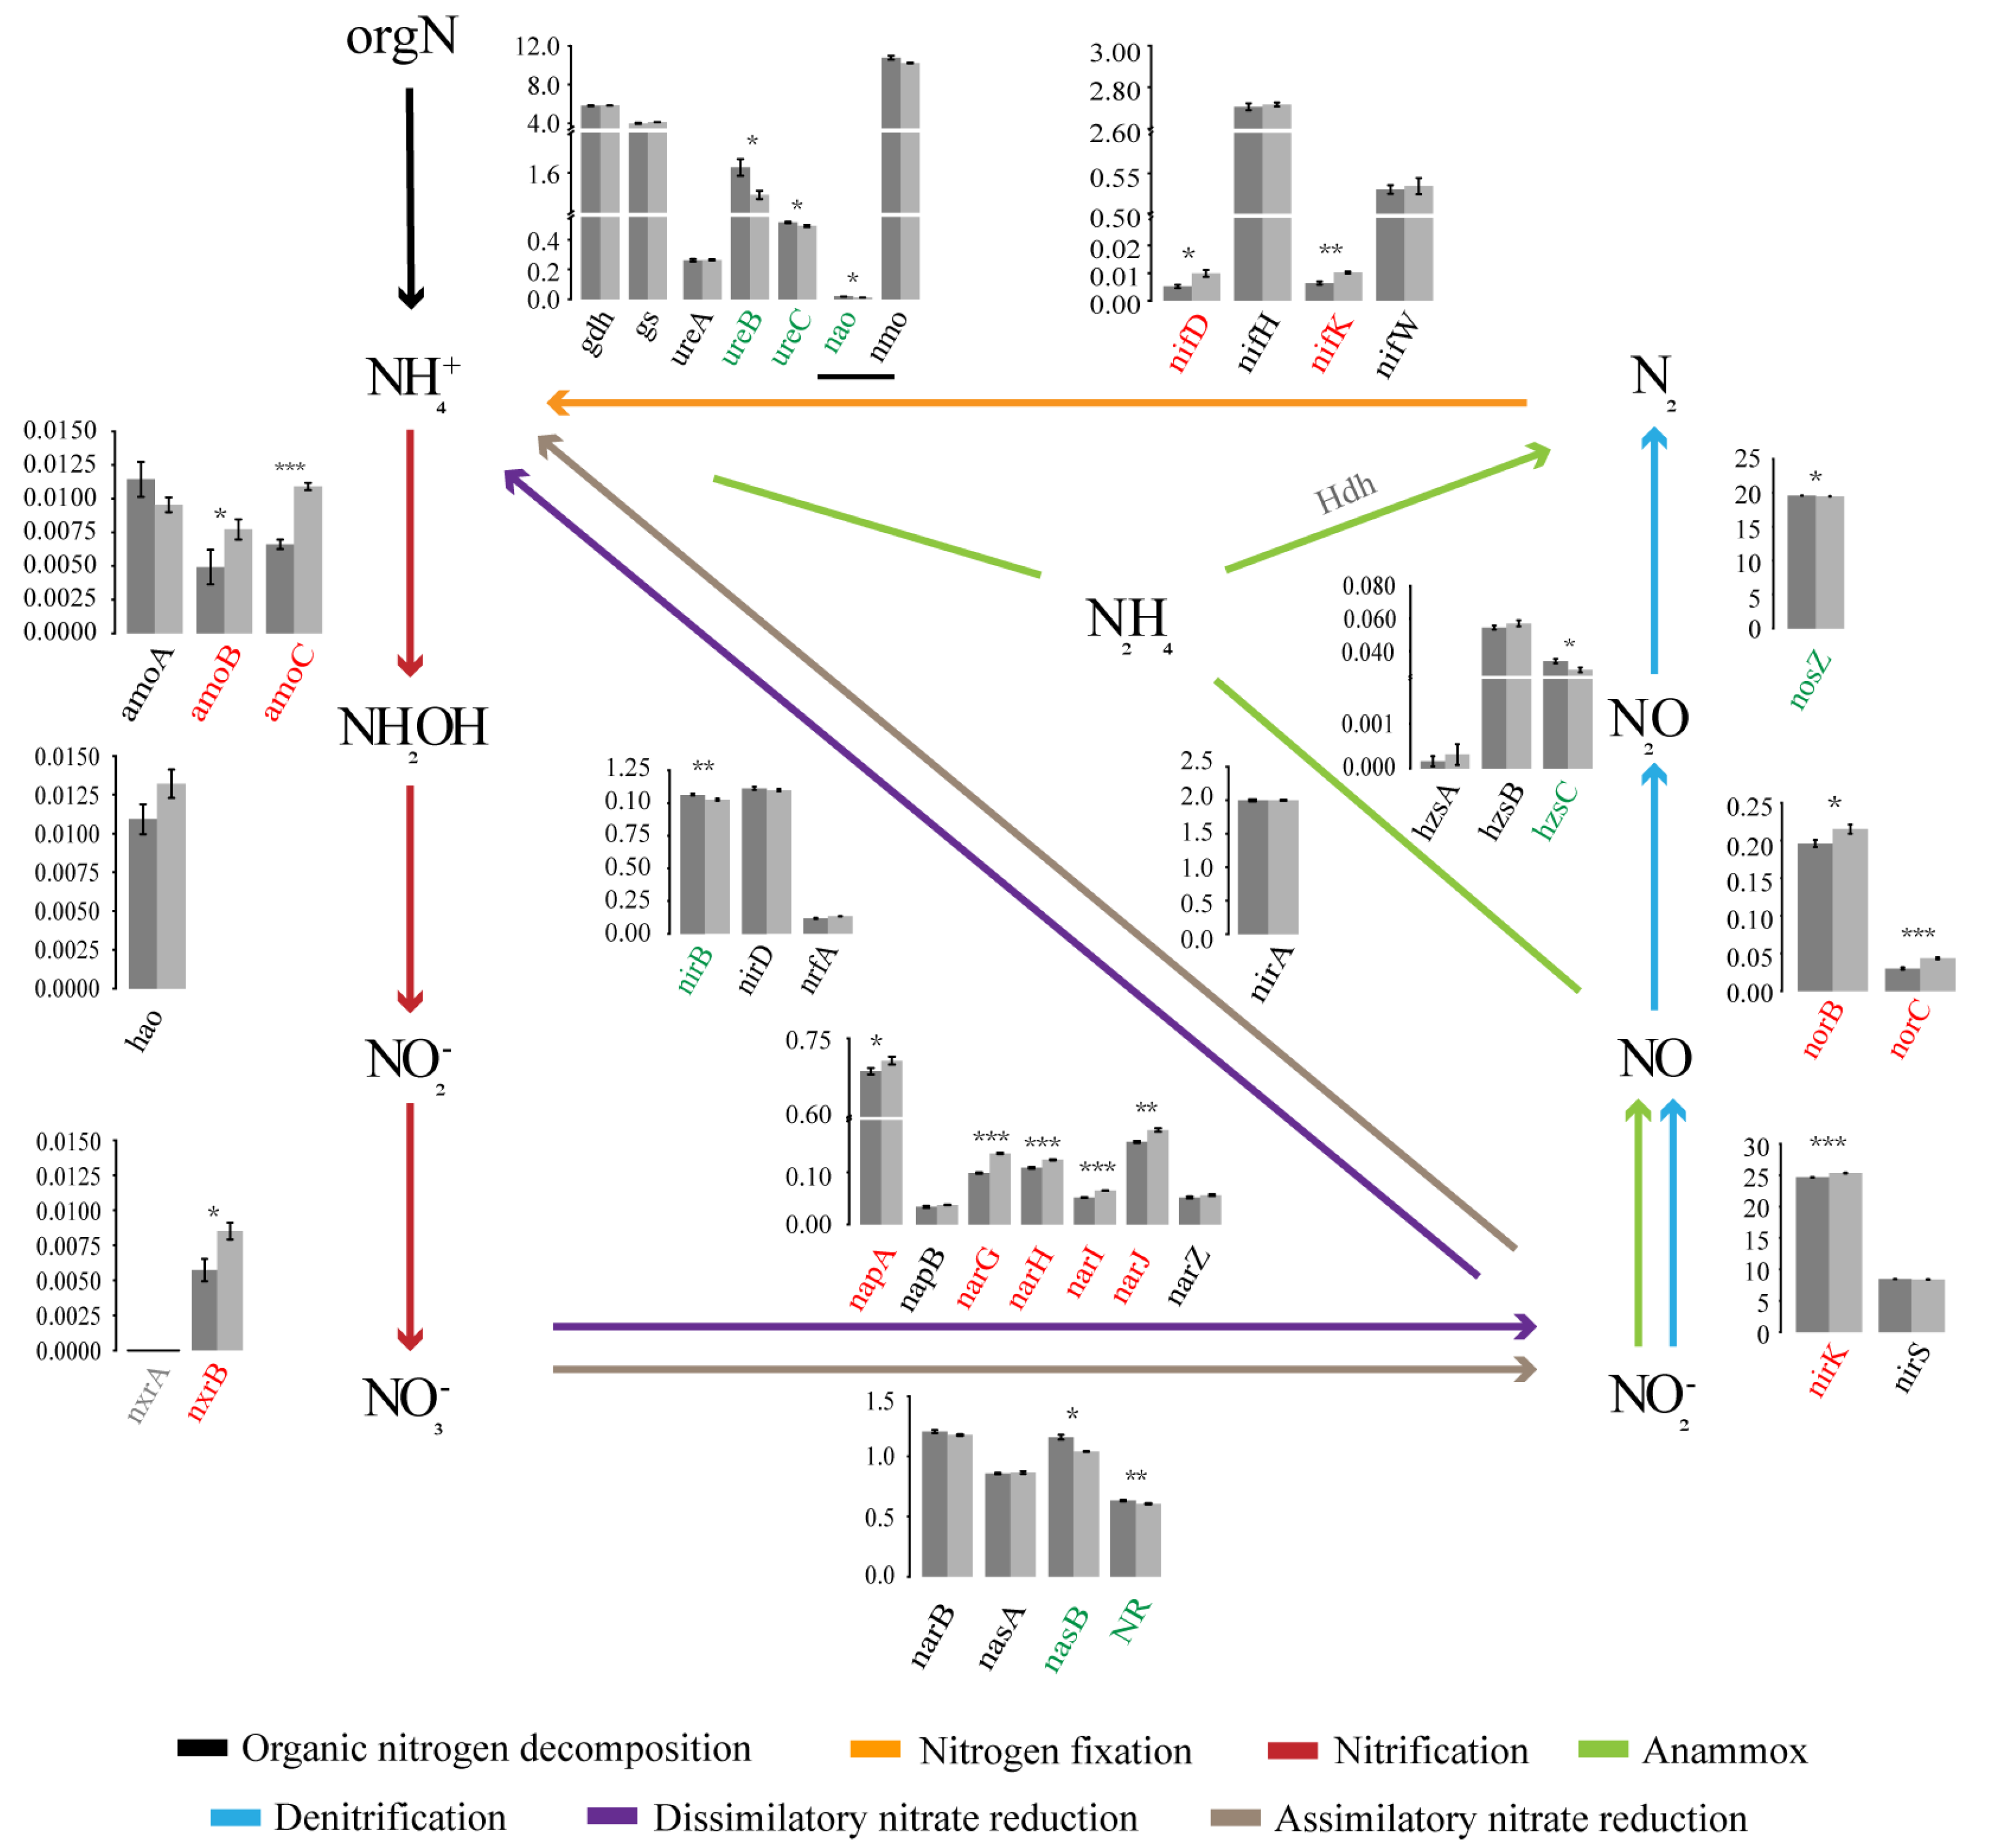
In the NCycDB database (a curated integrative database for fast and accurate metagenomic profiling of N cycling genes) [21], a total of 39 functional genes related to N cycling were annotated, 21 of which were significantly different in the relative abundance between the two forest types. We proposed a schema to analyse the whole N cycling (Figure 6), including organic N metabolism, N fixation, nitrification, denitrification, assimilatory nitrate reduction, DNRA, and anammox. Five gene families directly related to organic N metabolism were analysed, including nitroalkane oxidase (NAO), nitrate monooxygenase (NMO), Glutamate dehydrogenase (GDH), urease (URE), and glutamine synthetase (GS). Among them, GDH, URE, and GS mainly catalysed ammoniation. Compared with SF, the relative abundance of nao, ureB, and ureC in PF was significantly higher, and other genes did not change significantly between them. In this study, we only found the molybdenum dependent nitrogenase system regulated by the NIF gene families to catalyse N fixation. nifD and nifK were more abundant in SF, while nifH did not change significantly between PF and SF. Nitrification and denitrification are a series of biological processes that oxidize NH4+ to NO3−, and then reduce it to gaseous N compounds (NO, N2O, and N2). The abundance of amoBC and nxrB involved in nitrification and narGHIJ, napA, nirK, and norBC involved in denitrification in PF were significantly lower than those in SF, while the nosZ responsible for denitrification was the opposite, and other genes were not significantly changed between them. The abundance of nasB and NR responsible for assimilatory nitrate reduction and nirB responsible for DNRA were significantly higher in PF. The abundance of hzsC involved in anammox was significantly higher in PF, while Hdh was not detected.
3.4. Relationship between Soil Microbial Community Composition and Functions
Linear regression analysis was used to analyse the correlation of soil microbial functional similarity and community composition similarity. The results showed that there was a significant correlation between functional similarity and community composition similarity (p < 0.001), and the fitting degree was very high (Figure S7A). The same results also applied to microbes involved in N cycling (Figure S7B). The changes in microbial community composition might alter the functional composition. The results of PERMANOVA showed that AP, TP, TN, NH4+, NO3−, and pH were the major environmental factors which were closely related to soil microbial community structure and functional composition (including microbes involved in N cycling) (Table S6).
4. Discussion
4.1. The Characteristics of Soil Microbial Communities and Functional Changes in the Two Forest Types
Changes in soil microbial community composition and functions are closely related to forest recovery after disturbances [22]. We analysed the phyla, genera, and microbial potential functions in the two forest types. Forest soil microbial dominant phyla are generally consistent [23], which is in agreement with our findings. The significant differences attracted our attention in the relative abundance of Proteobacteria, Actinobacteria, and Acidobacteria between PF and SF. Proteobacteria and Actinomycota are mostly eutrophic groups [24,25], while Acidobacteria has a large number of oligotrophic members [26], which are more abundant in soil with low available carbon [27]. In SF, Proteobacteria and Actinomycota were relatively less, while Acidobacteria were significantly enriched, indicating that the soil in SF had a lower available carbon content. This was supported by the lower SOM and DOC content measured in SF (Table S1).
A large number of highly diverse and low-abundant populations constituted the so-called “rare biosphere”. These rare taxa have been increasingly recognized as the driver of key functions in the terrestrial ecosystems, and their ecological roles may be more important than abundant taxa [28]. It is those low-abundance populations that determine biodiversity and have the potential to occupy a particular ecological niche [29]. The higher the genetic diversity of the community, the greater the ability to combat disturbance events. This directly implies that low-abundance taxa have profound implications in maintaining and enhancing ecosystem functions [20]. At the genus level, we found that the fold-changes in the rare genera were larger than that in dominant genera and common genera (Figure 3B). Although shotgun metagenome sequencing has certain limitations for determining the relative abundance of rare taxa, we paid more attention to the comparison of fold-changes of different microbial taxa. Therefore, we speculated that the rare genera might be the key to microbial community recovery of SF in the future.
The study found that there were significant differences in the relative abundance of 18 functional categories and 13 metabolic pathways between the two forest types. Compared with PF, the gene sequences related to the microbial core metabolic functions (nucleotide, amino acid metabolism, energy metabolism, glycolysis/gluconeogenesis, TCA cycle, oxidative phosphorylation, coenzyme transport and metabolism, cell division, and cell cycle) were significantly enriched in SF, indicating that soil microbes in SF exhibited stronger metabolic capabilities. Compared with primary forests, core metabolic genes are more abundant in disturbed environments [30]. This may be related to the environmental conditions (light and humidity) after clear-cutting [31]. In addition, the greater abundance of the genes related to virulence factors, stress response, and defence in SF implied that interspecific competition of soil microbes was fiercer. The intense soil microbial competition increases with the restoration of forest ecosystems after disturbances [2]. The above results indicated there were some important changes in microbial composition and metabolic functions that could not be ignored and supported our first hypothesis.
4.2. The Characteristics of Soil Microbial N Cycling Processes Changes in the Two Forest Types
Each process of soil N cycling is mediated by a series of highly diverse microbes [32]. The close relationship between the microbial community composition and functions was observed (Figure S7B). The differences in microbial community composition (Figure 5A and Figure S6) implied potential changes in their functions. In addition, we found that the relative abundance of 21 N cycling functional genes was significantly different between the two forest types, which were involved in organic N metabolism, N fixation, nitrification, denitrification, assimilatory nitrate reduction, DNRA, and anammox.
The availability of N is regulated by distinct N transforming processes with vastly different fluxes. In PF, the ammoniation (ureB + 0.068%, ureC + 0.024%) and DNRA (nirB + 0.039%) were stronger and generated more NH4+, while nitrification (amoB − 0.003%, amoC − 0.004%, nxrB − 0.003%) was weaker and slowed the conversion of NH4+ to NO3−. Other N cycling processes had small differences in the relative abundance of genes between the two forest types and low N fluxes [33], their contributions to soil inorganic N were negligible. Therefore, above results provide an explanation for the differences in net accumulation of NH4+ and NO3− between the two forest types (PF soil was dominated by NH4+, SF soil was dominated by NO3−, Figure 2A, Table S1). After clear-cutting and nearly 60 years of recovery, no seedlings of constructive species (Korean pine) have been found in SF. The lack of seed sources [34,35] and the limitation of soil nutrition habitat of establishment of seedlings [36,37] are the common reasons for the difficulty of natural regeneration of Korean pine. Obviously, in this study, there is no shortage of seed sources of constructive species in the surrounding environment, so soil nutrition habitat becomes the primary consideration. Korean pine typically shows the apparent preference for NH4+ during long-term adaptation of “N nutrition habitats” [38]. Therefore, SF was dominated by NO3− rather than NH4+, which meant that lower NH4+ content might cause certain nutritional restriction on the establishment of Korean pine seedlings [39] and inhibit the natural regeneration of constructive species. This study provided a good explanation for the changes in the soil nutrition habitat of establishment of seedlings of constructive species from the perspective of microbiology.
NH4+ formed by DNRA is released to the environment; it is not only absorbed and utilized by plants and microbes for alleviating the N limitation of the ecosystems [40], but also consumes excessive reducing power for redox balance [41]. Therefore, DNRA affects the supply of N to a certain extent. In this study, compared with PF, the DNRA decreased significantly in SF, which indicated that the ability of SF to alleviate the N limitation of the ecosystem and maintain the balance of N cycling declined. Temperate forests, especially disturbed forests, are generally faced with N limitation [42,43]. During forest recovery, plant growth provides more carbon sources to microbes and requires more available N [44]. In SF, the high P availability and low N/P ratios of soil (Table S1) reflected the high microbial demand for N [45]. Soil microbial communities competing with trees for limited N exacerbate the N limitation of aboveground vegetation [46,47,48,49]. Additionally, we found that stronger nitrification in SF increased the conversion of NH4+ to NO3−. It might aggravate the risk of NO3− leaching [50]. The stronger nitrification and denitrification in SF enhanced N2O production, and further increased soil N loss [51]. In summary, the changes in soil N cycling pathways indicated that the SF might face a greater degree of N limitation compared with PF, which usually affects forest primary productivity [8,43,52] and may be a limiting factor for the recovery succession of SF. This was also used to explain why the above-mentioned soil microbial species competition was more intense in SF, namely, the limited N supply intensified the competition for N between microbial species. This study also found that community structure and functions of soil microbes, including microbes involved in N cycling, were mainly regulated by pH and nutrients (N and P) (Table S6), which is consistent with the results of similar studies [53]. Obviously, with forest restoration succession, changes in forest types cause shifts in the composition of litter and root metabolites, leading to the variation in soil nutrient content [54], and affecting soil microbial communities and their ecological service functions. However, soil microbes regulate the recovery of disturbed forests through their own adaptability and maintain the balance of forest ecosystems.
Metagenome sequencing was used to systematically analyse the differences in soil microbial community structure, functions, and relative abundance of functional genes of N cycling between the two forest types. After nearly 60 years of forest recovery, a balance was expected to be achieved among ecosystem, plant, and microbial communities [55,56]. The metagenome sequencing analysis was done from soil samples taken in July because the monthly rainfall amount and the monthly mean maximum and minimum temperature were the highest (Figure S1), and soil microbial activities were generally the strongest [57,58,59]. Additionally, the differences between the soil NH4+ and NO3− content of the two forest types were the largest and reached significant levels. The N transformation rates also showed significant differences in July (Table S2). Therefore, changes of microbial community composition and functions should provide insights into its potential response to the forest recovery after clear-cutting. Of course, sampling at one time-point and fewer samples might have a certain effect on statistical results. More accurate conclusions could be drawn from long-term observations of the forest recovery process.
5. Conclusions
In summary, after clear-cutting and nearly 60 years of forest recovery, important significant differences in the soil microbial community composition and metabolic functions were observed between the primary Korean pine forests and secondary broad-leaved forests. Compared with the dominant genera and common genera, the rare genera with larger fold-changes were key to the recovery of soil microbial communities in the secondary broad-leaved forests. Soil microbes had a stronger metabolic capacity and more intense interspecific competition in the secondary broad-leaved forests. The differences in the whole N cycling pathways between the two forest types not only provided a microbiological explanation for changes in the soil nutrition habitat that affected the establishment of constructive species (Korean pine) seedlings, but also indicated that the secondary broad-leaved forests faced a greater degree of N limitation, which was likely a limiting factor for forest recovery.
Supplementary Materials
The following are available online at https://www.mdpi.com/1999-4907/11/10/1027/s1, Supplementary Material 1: Determination of soil physicochemical properties, Supplementary Material 2: Sequence quality control, assembly, gene prediction, and annotation, Figure S1: Climatic conditions of the study sites in 2018. Line chart represents air temperature. The monthly highest and lowest mean temperatures are coloured red and blue, respectively. The histogram represents rainfall from May to September, Figure S2: In situ N mineralization experiment in the study suites, Figure S3: The histogram characterizes the differences of soil microbial richness (Species) (A), community diversity (Species) (B), and functional diversity (eggNOG) (C) between the two forest types. Dark grey and light grey represent the PF and SF, respectively. Asterisks indicate the significant differences of variable means between the PF and SF. PF: Primary Korean pine forests, SF: Secondary broad-leaved forests, Figure S4: The PCoA of soil microbial community structure (genus) (A), functions (genes, eggNOG) (B), and metabolism pathways (level 3, KEGG) (C) between the two forest types based on Bray-Curtis distances. PF: Primary Korean pine forests, SF: Secondary broad-leaved forests, Figure S5: Pie plot of the average composition resulting from 16S rRNA sequencing data and metagenome sequencing data (MG). The percentage values in the legend are the relative abundance of the primary Korean Pine forests (PF, up) and the secondary broad-leaved forests (SF, down), respectively, Figure S6: The heatmap of species (order) and functional contribution analysis. The comparison of taxonomic groups involved in the major N cycling processes between PF and SF, following by Welch’s t-test with Benjamini-Hochberg FDR correction. Only the top 10 most abundant microbial orders are shown in the figure. Values indicate the relative abundance of order species in PF and/or SF. PF: Primary Korean pine forests, SF: Secondary broad-leaved forests. Assimilatory: Assimilation nitrate reduction, Dissimilatory: Dissimilatory nitrate reduction. p < 0.05 *, p < 0.01 **, p < 0.001 ***, Figure S7: Linear regression analysis of the correlation of soil microbial functional (KEGG Module) similarity and community composition (genus) similarity, based on β diversity. (A) soil microbes, (B) soil microbes involved in N cycling. The higher determination coefficient R2, the higher consistency of β diversity between community and function, Table S1: Results of Student’s t-test of the soil properties between the two forest types in July 2018, Table S2: The significance of differences in inorganic N content and N transformation rates between the two forest types assessed by Student’s t-test, Table S3: Two-way ANOVA analysis results of NH4+, NO3−, net ammonification rate, net nitrification rate and net mineralization rate, Table S4: Comparative analysis of the relative abundance of Archaea, Bacteria, Eukarya, Viruses, and Unclassified in primary Korean pine forests and secondary broad-leaved forests, Table S5: The comparison of orders with the contribution greater than 1% to N cycling between the two forest types, Table S6: Permutational multivariance analysis of variance (PERMANOVA) on the explanation of soil physicochemical properties to the differences in soil microbial community structure and functional composition (including microbes involved in N cycling).
Author Contributions
Performing experiments, D.Q., X.J., and X.L.; data analysis, D.Q. and Y.F.; writing—original draft, D.Q.; writing—review and editing, D.Q. and F.F. All authors have read and agreed to the published version of the manuscript.
Funding
This work was supported by the National Natural Science Foundation of China [grant number 31670496] and the Fundamental Research Funds for the Central Universities [grant number 2572018AA26].
Acknowledgments
The authors would like to sincerely thank Qijiang Xu from College of Life Science, Northeast Forestry University, and Xin Sui from College of Life Science, Heilongjiang University, for guidance in molecular research, Pengfei Zheng from Institute of Deep-sea Science and Engineering, Chinese Academy of Sciences, for assistance in data analysis, and Xiaoxu Fan from College of Life Science, Heilongjiang University, for language editing. The authors also would like to thank anonymous reviewers who gave valuable suggestion that has helped to improve the quality of the manuscript.
Conflicts of Interest
The authors declare no conflict of interest.
References
- Pedrinho, A.; Mendes, L.W.; Merloti, L.F.; Fonseca, M.D.C.D.; Cannavan, F.D.S.; Tsai, S.M. Forest-to-pasture conversion and recovery based on assessment of microbial communities in Eastern Amazon rainforest. FEMS Microbiol. Ecol. 2018, 95. [Google Scholar] [CrossRef] [Green Version]
- Sun, S.; Badgley, B.D. Changes in microbial functional genes within the soil metagenome during forest ecosystem restoration. Soil Boil. Biochem. 2019, 135, 163–172. [Google Scholar] [CrossRef]
- Bardgett, R.D.; De Vries, F.T.; Van Der Putten, W.H.; Tate, K.R. Soil Biodiversity and Ecosystem Functioning. In Microbial Biomass; World Scientific Pub Co Pte Ltd.: London, UK, 2017; pp. 119–140. [Google Scholar]
- Jansson, J.K.; Hofmockel, K.S. Soil microbiomes and climate change. Nat. Rev. Genet. 2019, 18, 35–46. [Google Scholar] [CrossRef] [PubMed]
- Crowther, T.W.; Hoogen, J.V.D.; Wan, J.; Mayes, M.A.; Keiser, A.D.; Mo, L.; Averill, C.; Maynard, D.S. The global soil community and its influence on biogeochemistry. Science 2019, 365, eaav0550. [Google Scholar] [CrossRef] [PubMed]
- Wang, C. Biomass allometric equations for 10 co-occurring tree species in Chinese temperate forests. For. Ecol. Manag. 2006, 222, 9–16. [Google Scholar] [CrossRef]
- Vitousek, P.; Howarth, R.W. Nitrogen limitation on land and in the sea: How can it occur? Biogeochemistry 1991, 13, 87–115. [Google Scholar] [CrossRef]
- Lebauer, D.S.; Treseder, K.K. Nitrogen limitation of net primary productivity in terrestrial ecosystems is globally distributed. Ecology 2008, 89, 371–379. [Google Scholar] [CrossRef] [Green Version]
- Groffman, P.M.; Driscoll, C.T.; Duran, J.; Campbell, J.L.; Christenson, L.M.; Fahey, T.J.; Fisk, M.C.; Fuss, C.; Likens, G.E.; Lovett, G.; et al. Nitrogen oligotrophication in northern hardwood forests. Biogeochemistry 2018, 141, 523–539. [Google Scholar] [CrossRef]
- Du, E.; Terrer, C.; Pellegrini, A.F.A.; Ahlström, A.; Van Lissa, C.J.; Zhao, X.; Xia, N.; Wu, X.; Jackson, R.B. Global patterns of terrestrial nitrogen and phosphorus limitation. Nat. Geosci. 2020, 13, 221–226. [Google Scholar] [CrossRef]
- Mushinski, R.M.; Gentry, T.J.; Dorosky, R.J.; Boutton, T. Forest harvest intensity and soil depth alter inorganic nitrogen pool sizes and ammonia oxidizer community composition. Soil Boil. Biochem. 2017, 112, 216–227. [Google Scholar] [CrossRef]
- Mushinski, R.M.; Zhou, Y.; Gentry, T.J.; Boutton, T. Bacterial metataxonomic profile and putative functional behavior associated with C and N cycle processes remain altered for decades after forest harvest. Soil Boil. Biochem. 2018, 119, 184–193. [Google Scholar] [CrossRef]
- Schimel, J.P.; Schaeffer, S.M. Microbial control over carbon cycling in soil. Front. Microbiol. 2012, 3, 1–11. [Google Scholar] [CrossRef] [PubMed] [Green Version]
- McGuire, K.L.; Treseder, K.K. Microbial communities and their relevance for ecosystem models: Decomposition as a case study. Soil Boil. Biochem. 2010, 42, 529–535. [Google Scholar] [CrossRef] [Green Version]
- Avera, B.N.; Strahm, B.D.; Burger, J.A.; Zipper, C.E. Development of ecosystem structure and function on reforested surface-mined lands in the Central Appalachian Coal Basin of the United States. New Forest 2015, 46, 683–702. [Google Scholar] [CrossRef]
- Tickle, T.L.; Segata, N.; Waldron, L.; Weingart, U.; Huttenhower, C. Two-stage microbial community experimental design. ISME J. 2013, 7, 2330–2339. [Google Scholar] [CrossRef] [Green Version]
- Vazquez, E.; Benito, M.; Espejo, R.; Teutscherova, N. Effects of no-tillage and liming amendment combination on soil carbon and nitrogen mineralization. Eur. J. Soil Boil. 2019, 93, 103090. [Google Scholar] [CrossRef]
- Hart, S.C.; Stark, J.M.; Davidson, E.A.; Firestone, M.K.; Bottomley, P.; Angle, J.; Weaver, R. Nitrogen Mineralization, Immobilization, and Nitrification. In SSSA Book Series; Soil Science Society of America: Madison, WI, USA, 2018; pp. 985–1018. [Google Scholar]
- Lawson, C.E.; Wu, S.; Bhattacharjee, A.S.; Hamilton, J.J.; McMahon, K.D.; Goel, R.; Noguera, D.R. Metabolic network analysis reveals microbial community interactions in anammox granules. Nat. Commun. 2017, 8, 15416. [Google Scholar] [CrossRef]
- Lynch, M.D.J.; Neufeld, J.D. Ecology and exploration of the rare biosphere. Nat. Rev. Genet. 2015, 13, 217–229. [Google Scholar] [CrossRef]
- Tu, Q.; Lin, L.; Cheng, L.; Deng, Y.; He, Z. NCycDB: A curated integrative database for fast and accurate metagenomic profiling of nitrogen cycling genes. Bioinformatics 2018, 35, 1040–1048. [Google Scholar] [CrossRef]
- Shade, A.; Peter, H.; Allison, S.D.; Baho, D.L.; Berga, M.; Bürgmann, H.; Huber, D.H.; Langenheder, S.; Lennon, J.T.; Martiny, J.B.H.; et al. Fundamentals of Microbial Community Resistance and Resilience. Front. Microbiol. 2012, 3, 417. [Google Scholar] [CrossRef] [Green Version]
- Freedman, Z.B.; Zak, D.R. Soil bacterial communities are shaped by temporal and environmental filtering: Evidence from a long-term chronosequence. Environ. Microbiol. 2015, 17, 3208–3218. [Google Scholar] [CrossRef] [PubMed] [Green Version]
- Eilers, K.G.; Lauber, C.L.; Knight, R.; Fierer, N. Shifts in bacterial community structure associated with inputs of low molecular weight carbon compounds to soil. Soil Boil. Biochem. 2010, 42, 896–903. [Google Scholar] [CrossRef]
- Chen, L.; Zhang, J.; Zhao, B.; Zhou, G.; Ruan, L. Bacterial community structure in maize stubble-amended soils with different moisture levels estimated by bar-coded pyrosequencing. Appl. Soil Ecol. 2015, 86, 62–70. [Google Scholar] [CrossRef]
- Pascault, N.; Ranjard, L.; Kaisermann, A.; Bachar, D.; Christen, R.; Terrat, S.; Mathieu, O.; Levêque, J.; Mougel, C.; Hénault, C.; et al. Stimulation of Different Functional Groups of Bacteria by Various Plant Residues as a Driver of Soil Priming Effect. Ecosystems 2013, 16, 810–822. [Google Scholar] [CrossRef]
- Fierer, N.; Bradford, M.A.; Jackson, R.B. Toward an ecological classification of soil bacteria. Ecology 2007, 88, 1354–1364. [Google Scholar] [CrossRef] [PubMed]
- Zhou, L.; Zhou, Y.; Yao, X.; Cai, J.; Liu, X.; Tang, X.; Zhang, Y.; Jang, K.-S.; Jeppesen, E. Decreasing diversity of rare bacterial subcommunities relates to dissolved organic matter along permafrost thawing gradients. Environ. Int. 2020, 134, 105330. [Google Scholar] [CrossRef]
- Sogin, M.L.; Morrison, H.G.; Huber, J.A.; Welch, D.M.; Huse, S.M.; Neal, P.R.; Arrieta, J.M.; Herndl, G.J. Microbial diversity in the deep sea and the underexplored “rare biosphere”. Proc. Natl. Acad. Sci. USA 2006, 103, 12115–12120. [Google Scholar] [CrossRef] [Green Version]
- Tripathi, B.M.; Edwards, D.P.; Mendes, L.W.; Kim, M.; Dong, K.; Adams, J.M. The impact of tropical forest logging and oil palm agriculture on the soil microbiome. Mol. Ecol. 2016, 25, 2244–2257. [Google Scholar] [CrossRef]
- Fierer, N.; Leff, J.W.; Adams, B.J.; Nielsen, U.N.; Bates, S.T.; Lauber, C.L.; Owens, S.M.; Gilbert, J.A.; Wall, D.H.; Caporaso, J.G. Cross-biome metagenomic analyses of soil microbial communities and their functional attributes. Proc. Natl. Acad. Sci. USA 2012, 109, 21390–21395. [Google Scholar] [CrossRef] [Green Version]
- Nelson, M.B.; Martiny, A.C.; Martiny, A.C. Global biogeography of microbial nitrogen-cycling traits in soil. Proc. Natl. Acad. Sci. USA 2016, 113, 8033–8040. [Google Scholar] [CrossRef] [Green Version]
- Kuypers, M.M.M.; Marchant, H.K.; Kartal, B. The microbial nitrogen-cycling network. Nat. Rev. Genet. 2018, 16, 263–276. [Google Scholar] [CrossRef] [PubMed]
- Zhao, F.; He, H.S.; Dai, L.; Yang, J. Effects of human disturbances on Korean pine coverage and age structure at a landscape scale in Northeast China. Ecol. Eng. 2014, 71, 375–379. [Google Scholar] [CrossRef]
- Hayashida, M. Seed dispersal by red squirrels and subsequent establishment of Korean pine. For. Ecol. Manag. 1989, 28, 115–129. [Google Scholar] [CrossRef]
- Omelko, A.M.; Ukhvatkina, O.N.; Zhmerenetsky, A.; Sibirina, L.A.; Petrenko, T.; Bobrovsky, M. From young to adult trees: How spatial patterns of plants with different life strategies change during age development in an old-growth Korean pine-broadleaved forest. For. Ecol. Manag. 2018, 411, 46–66. [Google Scholar] [CrossRef]
- Zhou, G.; Liu, Q.; Xu, Z.; Du, W.; Yu, J.; Meng, S.; Zhou, H.; Qin, L.; Shah, S. How can the shade intolerant Korean pine survive under dense deciduous canopy? For. Ecol. Manag. 2020, 457, 117735. [Google Scholar] [CrossRef]
- Cui, X.; Song, J. Soil NH4+/NO3—Nitrogen characteristics in primary forests and the adaptability of some coniferous species. Front. For. China 2007, 2, 1–10. [Google Scholar] [CrossRef]
- Axelsson, E.P.; Lundmark, T.; Högberg, P.; Nordin, A. Belowground Competition Directs Spatial Patterns of Seedling Growth in Boreal Pine Forests in Fennoscandia. Forests 2014, 5, 2106–2121. [Google Scholar] [CrossRef] [Green Version]
- Tu, Q.; He, Z.; Wu, L.; Xue, K.; Xie, G.; Chain, P.; Reich, P.B.; Hobbie, S.; Zhou, J. Metagenomic reconstruction of nitrogen cycling pathways in a CO2-enriched grassland ecosystem. Soil Boil. Biochem. 2017, 106, 99–108. [Google Scholar] [CrossRef] [Green Version]
- Moreno-Vivián, C.; Cabello, P.; Martiínez-Luque, M.; Blasco, R.; Castillo, F. Prokaryotic Nitrate Reduction: Molecular Properties and Functional Distinction among Bacterial Nitrate Reductases. J. Bacteriol. 1999, 181, 6573–6584. [Google Scholar] [CrossRef] [Green Version]
- Fang, Y.; Gundersen, P.; Mo, J.M.; Zhu, W.X. Input and output of dissolved organic and inorganic nitrogen in subtropical forests of South China under high air pollution. Biogeosciences 2008, 5, 339–352. [Google Scholar] [CrossRef] [Green Version]
- Davidson, E.A.; De Carvalho, C.J.R.; Figueira, A.M.; Ishida, F.Y.; Ometto, J.P.H.B.; Nardoto, G.B.; Sabá, R.T.; Hayashi, S.N.; Leal, E.C.; Vieira, I.C.G.; et al. Recuperation of nitrogen cycling in Amazonian forests following agricultural abandonment. Nature 2007, 447, 995–998. [Google Scholar] [CrossRef] [PubMed]
- Scott, C.E.; Rap, A.; Spracklen, D.V.; Forster, P.M.D.F.; Carslaw, K.; Mann, G.; Pringle, K.J.; Kivekäs, N.; Kulmala, M.; Lihavainen, H.; et al. The direct and indirect radiative effects of biogenic secondary organic aerosol. Atmospheric Chem. Phys. Discuss. 2014, 14, 447–470. [Google Scholar] [CrossRef] [Green Version]
- Tang, Y.; Yu, G.-R.; Zhang, X.; Wang, Q.; Ge, J.; Liu, S. Changes in nitrogen-cycling microbial communities with depth in temperate and subtropical forest soils. Appl. Soil Ecol. 2018, 124, 218–228. [Google Scholar] [CrossRef]
- Thébault, A.; Clement, J.-C.; Ibanez, S.; Roy, J.; Geremia, R.A.; Pérez, C.A.; Buttler, A.; Estienne, Y.; Lavorel, S. Nitrogen limitation and microbial diversity at the treeline. Oikos 2014, 123, 729–740. [Google Scholar] [CrossRef] [Green Version]
- Rennenberg, H.; Dannenmann, M.; Gessler, A.; Kreuzwieser, J.; Simon, J.; Papen, H. Nitrogen balance in forest soils: Nutritional limitation of plants under climate change stresses. Plant Boil. 2009, 11, 4–23. [Google Scholar] [CrossRef] [PubMed]
- Kaye, J.P.; Hart, S.C. Competition for nitrogen between plants and soil microorganisms. Trends Ecol. Evol. 1997, 12, 139–143. [Google Scholar] [CrossRef]
- Moreau, D.; Bardgett, R.D.; Finlay, R.D.; Jones, D.L.; Philippot, L. A plant perspective on nitrogen cycling in the rhizosphere. Funct. Ecol. 2019, 33, 540–552. [Google Scholar] [CrossRef] [Green Version]
- Che, R.; Wang, Y.; Li, K.; Xu, Z.; Hu, J.; Wang, F.; Rui, Y.; Li, L.; Pang, Z.; Cui, X. Degraded patch formation significantly changed microbial community composition in alpine meadow soils. Soil Tillage Res. 2019, 195, 104426. [Google Scholar] [CrossRef]
- Fang, Y.; Koba, K.; Makabe, A.; Takahashi, C.; Zhu, W.; Hayashi, T.; Hokari, A.A.; Urakawa, R.; Bai, E.; Houlton, B.Z.; et al. Microbial denitrification dominates nitrate losses from forest ecosystems. Proc. Natl. Acad. Sci. USA 2015, 112, 1470–1474. [Google Scholar] [CrossRef] [Green Version]
- Wieder, W.R.; Cleveland, C.C.; Smith, W.K.; Todd-Brown, K. Future productivity and carbon storage limited by terrestrial nutrient availability. Nat. Geosci. 2015, 8, 441–444. [Google Scholar] [CrossRef]
- Banning, N.C.; Gleeson, D.B.; Grigg, A.H.; Grant, C.D.; Andersen, G.L.; Brodie, E.L.; Murphy, D.V. Soil Microbial Community Successional Patterns during Forest Ecosystem Restoration. Appl. Environ. Microbiol. 2011, 77, 6158–6164. [Google Scholar] [CrossRef] [PubMed] [Green Version]
- Veen, G.F.; Fry, E.L.; Hooven, F.C.T.; Kardol, P.; Morriën, E.; De Long, J.R. The Role of Plant Litter in Driving Plant-Soil Feedbacks. Front. Environ. Sci. 2019, 7, 168. [Google Scholar] [CrossRef]
- Köster, K.; Berninger, F.; Lindén, A.; Köster, E.; Pumpanen, J. Recovery in fungal biomass is related to decrease in soil organic matter turnover time in a boreal fire chronosequence. Geoderma 2014, 235, 74–82. [Google Scholar] [CrossRef]
- Jin, X.; Liu, Y.; Hu, W.; Wang, G.; Kong, Z.; Wu, L.; Ge, G. Soil bacterial and fungal communities and the associated nutrient cycling responses to forest conversion after selective logging in a subtropical forest of China. For. Ecol. Manag. 2019, 444, 308–317. [Google Scholar] [CrossRef]
- Allison, S.D. Cheaters, diffusion and nutrients constrain decomposition by microbial enzymes in spatially structured environments. Ecol. Lett. 2005, 8, 626–635. [Google Scholar] [CrossRef]
- Venugopal, P.; Junninen, K.; Linnakoski, R.; Edman, M.; Kouki, J. Climate and wood quality have decayer-specific effects on fungal wood decomposition. For. Ecol. Manag. 2016, 360, 341–351. [Google Scholar] [CrossRef]
- Bani, A.; Pioli, S.; Ventura, M.; Panzacchi, P.; Borruso, L.; Tognetti, R.; Tonon, G.; Brusetti, L. The role of microbial community in the decomposition of leaf litter and deadwood. Appl. Soil Ecol. 2018, 126, 75–84. [Google Scholar] [CrossRef]
Figure 1.
Distribution of the two sample sites. PF: Primary Korean pine forests, SF: Secondary broad-leaved forests.
Figure 1.
Distribution of the two sample sites. PF: Primary Korean pine forests, SF: Secondary broad-leaved forests.

Figure 2.
Dynamics of soil NH4+ and NO3− content (A), and N transformation rates (B) from May to October in the two forest types. Red and blue represent the primary Korean pine forests (PF) and secondary broad-leaved forests (SF), respectively. Ramm: Net ammonification rate. Rnit: Net nitrification rate. Rmin: Net mineralization rate.

Figure 3.
(A) The comparison of phyla with the relative abundance greater than 1% between primary Korean Pine forests (PF) and secondary broad-leaved forests (SF). Different colours denote different forest types. (B) Fold-changes in the relative abundance of genera. Fold-change is defined as (PF-SF)/PF, in which PF is the relative abundance of genera in the primary Korean Pine forests and SF is the relative abundance of genera in the secondary broad-leaved forests. Red, fold-changes > 2. Dominant genera: > 1%, Common genera: 0.1–1%, Rare genera: < 0.1%. p < 0.05 indicates significant differences between the two different forest types. p < 0.05 *, p < 0.01 **, p < 0.001 ***.

Figure 4.
Comparison of functions between primary Korean pine forests (PF) and secondary broad-leaved forests (SF) in the eggNOG and KEGG databases. (A) Functional categories of the eggNOG. (B) Metabolic pathways with relative abundance greater than 1% at the KEGG level-3. p < 0.05 denotes significant differences between the two forest types. p < 0.05 *, p < 0.01 **, p < 0.001 ***.

Figure 5.
(A) Comparison of orders involved in N cycling with relative abundance greater than 2% between primary Korean pine forests (PF) and secondary broad-leaved forests (SF). (B) Taxonomic groups involved in the major N cycling processes. Only the top 10 most abundant microbial orders are shown in the figure. Assimilatory: Assimilatory nitrate reduction. Dissimilatory: Dissimilatory nitrate reduction. p < 0.05 *, p < 0.01 **, p < 0.001 ***.

Figure 6.
The schema characterizes soil microbial N cycling network. The histogram denotes the differences of the relative abundance of functional genes involved in N cycling pathways between the two different forest types. Dark grey and light grey represent the PF and SF, respectively. The gene families on the abscissa are marked in different colours. Red indicates that the gene is significantly enriched in SF. Green indicates that the gene is significantly enriched in PF. The values on the ordinate represent the percentage abundance of functional genes in total N cycling genes (%). Different colours of lines represent different N cycling processes. PF: Primary Korean pine forests, SF: Secondary broad-leaved forests. p < 0.05 *, p < 0.01 **, p < 0.001 ***.


Table 1.
Overview of the sample sites.
| Forest Type | Location | Altitude (m) | Area (hm2) | Main Tree Species |
|---|---|---|---|---|
| PF | 47°12′57″ N, 128°52′17″ E | 402 | 11.7 | Pinus koraiensis Siebold & Zucc., Fraxinus mandschurica Rupr., Tilia mandschurica Rupr. & Maxim., Tilia amurensis Rupr., Acer mono (Maxim.) H.Ohashi, Acer ukurunduense Trautv. & Mey., Acer tegmentosum Maxim., Ulmus laciniata (Trautv.) Mayr, Syringa reticulata (Blume) H.Hara, Padus racemosa L., Betula costata Trautv., Abies nephrolepis (Trautv.) Maxim. |
| SF | 47°12′49″ N, 128°52′12″ E | 390 | 9.3 | Fraxinus mandschurica, Tilia amurensis, Phellodendron amurense Rupr., Acer mono (Maxim.) H.Ohashi, Padus racemosa L., Syringa reticulata (Blume) H.Hara, Ulmus laciniata (Trautv.) Mayr |
PF: Primary Korean pine forests, SF: Secondary broad-leaved forests.
© 2020 by the authors. Licensee MDPI, Basel, Switzerland. This article is an open access article distributed under the terms and conditions of the Creative Commons Attribution (CC BY) license (http://creativecommons.org/licenses/by/4.0/).
Share and Cite
MDPI and ACS Style
Qi, D.; Feng, F.; Fu, Y.; Ji, X.; Liu, X. Effects of Soil Microbes on Forest Recovery to Climax Community through the Regulation of Nitrogen Cycling. Forests 2020, 11, 1027. https://doi.org/10.3390/f11101027
AMA Style
Qi D, Feng F, Fu Y, Ji X, Liu X. Effects of Soil Microbes on Forest Recovery to Climax Community through the Regulation of Nitrogen Cycling. Forests. 2020; 11(10):1027. https://doi.org/10.3390/f11101027
Chicago/Turabian StyleQi, Dandan, Fujuan Feng, Yanmei Fu, Ximei Ji, and Xianfa Liu. 2020. "Effects of Soil Microbes on Forest Recovery to Climax Community through the Regulation of Nitrogen Cycling" Forests 11, no. 10: 1027. https://doi.org/10.3390/f11101027
Note that from the first issue of 2016, this journal uses article numbers instead of page numbers. See further details here.