


Abstract
The city of Berlin has significantly expanded public charging infrastructure for electric vehicles. As a result of this investment, real-world charging data for the city of Berlin are available for the first time. In addition to other metrics, this dataset contains specific information about carsharing vehicles. This research letter offers numerous insights into public charging demand and infrastructure. The results are only now available due to a sufficient fleet size of electric vehicles.
The analysis shows that the distribution of charging stations is very unequal in Berlin. The data also show that the infrastructure network is much denser in the city center. While there is an unequal distribution of infrastructure, we see that the utilization of infrastructure is relatively equal. This reflects unequal charging demand, as can be expected based on the location of the infrastructure. We also determine that the majority of public charging events come from free-floating carsharing vehicles. The analysis of infrastructure use shows that the edge of the city center has the highest rates of stations occupied by vehicles after completing charging. Carsharing users occupy infrastructure after charging significantly more than individual private and commercial users. However, if the pricing scheme allows, individual users also occupy infrastructure after completing charging.
The research letter provides several policy recommendations for the build-up and operation of charging infrastructure. These focus on charging demand from individual users, infrastructure efficiency, and carsharing operators and their business models. The results are timely as decisions on public charging infrastructure must be made now to meet electric vehicle demand.
Export citation and abstract BibTeX RIS

Original content from this work may be used under the terms of the Creative Commons Attribution 4.0 license. Any further distribution of this work must maintain attribution to the author(s) and the title of the work, journal citation and DOI.
1. Introduction and motivation
Electric vehicles can play a central role in reducing greenhouse gas (GHG) emissions when using electricity from renewable sources [1, 2]. In Germany, the transportation sector must reduce GHG emissions by 40% in 2030 and 95% in 2050 (compared to 1990 values) [3]. As of 1 January 2020, a total of 136.617 battery electric vehicles (BEVs) and 102.175 plug-in hybrid electric vehicles (PHEVs) were in stock in Germany [4]. Research on charging infrastructure in Germany has shown that current electric vehicles users want additional public charging infrastructure [5]. Furthermore, the lack of sufficient charging infrastructure has been shown to hinder the adoption of electric vehicles [6, 7]. Thus additional infrastructure is required to ensure the success of electric vehicles and hence environmental goals.
Research to date focuses primarily on planning charging infrastructure. Significant research relies on indirect data (i.e. GPS travel data, historic travel data, laboratory tests) or very limited charging data. These data are then extrapolated to make estimates for future infrastructure and provide policy recommendations. Overarching analysis of charging infrastructure requirements across multiple countries was conducted by Funke et al [8]. The authors also analyze the framework conditions for infrastructure [8]. Approaches to determine infrastructure can be classified as either demand-oriented (i.e. simulation-based) or supply-oriented (i.e. optimization-based) [9]. Numerous data sources aside from just real-world charging data have been utilized by researchers. These data are typically used in subsequent models to estimate charging, analyze infrastructure needs, and provide policy recommendations.
The first source of real-world data is GPS travel data. These data may origin from both EVs and internal combustion engine vehicles. Weldon et al generate charging profiles based on GPS travel data from electric vehicles during a demonstration period [10]. To do this the authors develop a probabilistic charging model and use a stochastic simulation method. Brady and O'Mahony use GPS travel data within a stochastic methodology to simulate charging profiles [11]. Dong et al similarly use GPS-based travel survey data in a genetic algorithm to optimally site charging infrastructure [12]. Shahraki et al determine optimal charging station locations with the help of GPS data from vehicles [13]. Cai et al again use GPS travel data from taxis for placing public stations with a focus on how people travel [14]. The relevance and history of using GPS data for analysis of electric vehicles was shown by Gonder et al and their assessment of real-world energy use of plug-in hybrid electric vehicles [15].
The second source of real-world data in the literature is from electric vehicles. These data include many more attributes specific to using EVs rather than geolocations. Neaimeh et al utilize EV driving and charging events data to study the impact on electricity networks [16]. Tao et al use data from real-world EVs within a model to optimize infrastructure siting [17]. Zhang et al also use data from EVs to find usage patterns of the vehicles [18]. Pan et al similarly use real travel data of electric vehicles (driving data) to design charging infrastructure [19]. De Cauwer et al similarly use data from real-world trips and charging data from an EV fleet [20]. Wang et al use historical EV load data for predictive scheduling of the vehicles [21].
The third source of real-world data is travel survey data without geolocations. Soylu et al utilized the German household travel survey data to determine charging infrastructure requirements for one million electric vehicles [22]. Brooker and Qin similarly determine infrastructure location utilizing the US national travel household travel survey [23].
The fourth source of real-world data is miscellaneous data sources. Pevec et al use a wide range of real-world data (i.e. business data, geographical data, and driving distances) to estimate infrastructure use for planning purposes [24]. In another study Arias and Bae utilized historical traffic data and weather data to forecast charging demand [25]. Soylu et al develop a GIS-tool to determine placement of fast-charging infrastructure using an agent-based microsimulation travel demand model [26]. Arias and Bee used real-world traffic distribution data and weather conditions [25].
The fifth and final source of real-world data is charging data. First off, there is a large subgroup of research utilizing real-world charging demand data for tangential charging infrastructure issues (e.g. determining charging demand profiles, estimating the impact on electricity networks). Xydas et al utilized over 21 000 charging events from 255 different charging stations to characterize charging demand in a geographical area [27]. Using this characterization and weather data, they propose a modeling framework to determine charging demand profiles. Khoo et al analyzed over 4900 charging events to understand the impact of different EV user categories and vehicle models on electricity networks [28].
However, for our purpose the more interesting research is focused on real-world charging data for the build-up of infrastructure. In this regard, the first category of research uses limited charging data that is then extrapolated. Shuanglong et al use historical charging data to estimate charging demand [29]. In another paper, Gnann et al use real-world driving data and limited charging data to create a queuing model to estimate charging infrastructure needs [30]. However, they only look at charging data from fast charging across entire countries (i.e. Norway and Sweden) and thus do not offer insights for urban areas.
In comparison, Wolbertus et al move beyond the limitation of small data sets and investigate factors influencing connection times at charging stations [31]. Here the authors analyze an impressive 3.7 million charging sessions from four major Dutch cities between 2014 and 2017. Although, the real-world charging data is colossal, they do not provide insights into the build of infrastructure.
The studies described above dramatically increase our understanding of infrastructure demand and provide valuable approaches for the build-up and expansion of public charging infrastructure. Nevertheless, these approaches using indirect data have limitations. Furthermore, the current status of the market allows for the use of real-world data to reveal actual observations from the field. Consequently, there is a research gap on real-world charging data from a large urban area for insights regarding the build-up and practical implications of infrastructure. Thus for the first time, we present a study showing real-world charging data to provide insights into the building of future infrastructure. We aim to provide insights and lessons learned from these charging events for the continued planning of urban infrastructure. The paper examines the urban area of Berlin, which has a well-developed charging infrastructure. The research is relevant to validate existing scientific models as well as to support decision-makers in policy recommendations. This research focuses specifically on topics of high relevance for practice. Hence we examine three main areas: infrastructure supply, infrastructure utilization, and infrastructure efficiency. Infrastructure efficiency refers to the amount of charging done at a station compared to the amount of time a fully charged vehicle occupies (i.e. blocks) the station preventing other vehicles from charging. The analysis considers both individual and carsharing users. Individual users use privately or commercially owned vehicles, while carsharing users use various vehicles from a shared fleet. In addition, different pricing models for charging and the influence of parking fees are examined. We then provide policy recommendations based on the analysis to provide insights for all applicable decision-makers.
2. Data and methodology
2.1. Data
Starting in 2015 the city of Berlin began expanding public charging infrastructure using a structured approach based on an infrastructure location concept to fulfill a necessary condition for the uptake of electric mobility [32]. At this point in time all new charging stations were required to fulfill the requirements of the so called Berlin Model: infrastructure must be accessible to all EV users regardless of the infrastructure operator. Resulting from this change, all these charging stations also record charging information. For this paper we obtained data collected from this newly installed charging infrastructure collected between December 2016 and March 2018 from two operators. These charging stations are within the administrative borders of Berlin. However, in addition to the Berlin Model stations, there are additional charging stations within the city, which were previously installed. These stations have a variety of different access rules relating to connection type or tariff models, which in turn exclude certain users. Furthermore, there is no charging data available for these stations. Thus, there are also numerous charging stations without available data and there was no official count of charging stations until the introduction of the Berlin Model. Further, some other publically accessible charging stations (e.g. at supermarkets) are also found in Berlin.
A charging station can have a single charging point or multiple charging points. For each charging station, we have its location and information about each charging event. Charging event information includes the charging technology utilized, user information, the start and end time of the energy transfer (charging time), the start and end time of the plug connection (connection time), the quantity of energy transferred, and costs.
There are three connector types for different charging technologies in the data set. First, there is the Type 2 connector for AC-charging (Type 2). Second, there is the CCS Combo connector, which also allows for fast DC-charging (Combo). Third, there are CHAdeMO connectors for DC-charging (CHAdeMO).
For user information, we have an anonymized identification number for each user (ID), which changes for each session. These IDs allow us to assign one of two user groups: individual or carsharing. Individual users can be either private or commercial users, but do not use a carsharing vehicle. On the other hand, carsharing users may use any vehicle in their operators' fleet. These fleets are run in a free-floating model. That means that the vehicles are parked in public spaces and are accessible online for spontaneous one-way trips. After each trip, the vehicles are parked and may be used by another carsharing member. These users pay a fee per minute, which includes all costs for the vehicle (e.g. parking, maintenance, charging). Charging and connection time are self-explanatory. For the charging event costs, it should also be noted that the pricing model for charging infrastructure was changed from a time-related price to a fixed session fee on 15 July 2017. Another aspect of costs is parking costs. Within a considerable part of the city center of Berlin parking is not free. We refer to this area as the paid parking zone. This includes fees ranges between one and three Euros per hour. However, EV users do not have to pay these parking fees when charging. In order to analyze differences regarding the utilization of the infrastructure, we compare paid parking zones to the rest of the city center, where parking is free of charge.
2.2. Methodology
In this section we present the methodology of the analysis. First, we describe the data cleaning and preprocessing. Second, we combine the real-world charging event dataset with additional relevant data including user group, spatial information, and temporal information to create a supplemented dataset. Third, we describe the data analysis. Here we evaluate the supplemented dataset for the topics infrastructure supply, infrastructure utilization, and infrastructure efficiency.
First, we clean and preprocess the real-world charging data. For charging power, we remove any values that are further than four times the inter-quartile range above the mean as these are recording errors. Afterwards we obtain a plausible distribution of charging power with peak power of 3.6 kW, 11 kW, and around 40 kW. These represent the specifications of the connector types currently in use in Berlin. There are also chargers, which are inactive for long periods of time. Spot tests of the data show that construction or maintenance could explain this inactivity. Therefore, we remove any gaps where the infrastructure is not used for more than 30 d. We also only use data starting 15 d after commissioning the charging station. Thereby removing any distortions for newly installed chargers as this could be caused by a lack of awareness of newly installed charging station by the users.
After completing these steps the dataset contains 234 unique charging stations, each identified with a unique ID. From this, eight seem to be at the same location and another five are within 20 meters of each other. For this case it seems that the charging station was commissioned under a new ID, while the old ID became inactive. Thus the data for the two IDs are merged together. Having completed the data cleaning and preprocessing we are left with 221 charging stations with a total of 50 491 charging events.
Second, we combine the real-world charging event dataset with additional relevant data. The additional data covers user group information, spatial information, and temporal information. For each charging event we assign one of two user groups: individual or carsharing. Based on the login IDs we can assign 80% of the charging events to one of these user groups. For the remaining 20% of the events we have no login information and thus we cannot assign a user group. Next we assign spatial data to each charging event. Two spatial attributes are assigned. The first spatial attribute is their location inside or outside the city center. The second spatial attribute is their location inside or outside a paid parking zone. Finally, we supplement the charging events with temporal data: we examined the use of charging infrastructure three months before and three months after the charging fee change on 15 July 2017.
Third, the data has been evaluated, as shown in the next section. For the analysis we focus on three areas of interest: infrastructure supply, infrastructure utilization, and infrastructure efficiency. The first area, infrastructure supply, deals with the analysis of the network of public charging infrastructure present in the city. Voronoi polygons are developed to calculate the coverage area of each station [33]. To measure the inequity of coverage area by an individual charging station we calculate the Gini coefficients [34]. The Gini coefficient is typically used in economics as a measure of wealth inequality. However, its use for charging infrastructure is also of value. The coefficient evaluates the statistical dispersion regarding equity and ranges from 0 to 1, where 0 indicates maximum equity. In the context of area covered by charging stations, this would mean that each area covered has the same size, while a value of 1 means maximum inequity. The second area is infrastructure utilization. For this analysis, both the charging events as well as the energy delivered at each charger are evaluated. Comparisons between connector type and user groups are drawn. We also develop a timeseries to analyze the development over the observation period focusing on the importance of user groups.
The third area of analysis is infrastructure efficiency. The efficiency of a charging station can be reduced when the station is blocked. We define blocking time as the time when a vehicle is connected to the charging station, but the active charging process is completed. This thus 'blocks' the charging station from being used by another vehicle. We specify two metrics for analysis. The first metric, average daily blocking time per charging station over the whole observation period, is defined as the sum of blocking time divided by the number of available days. The second, average blocking, is defined as blocking time divided by connection time per each charging event. This is a relative measure allowing us to compare individual charging events in percent. For the analysis we then examine and draw comparisons between the user groups. We also add a spatial analysis to compare efficiency in areas with and without paid parking zones. Finally, we conduct a time related comparison to examine the impact of the charging tariff change on 15 July 2017. In the next section the analysis and results are presented and discussed.
3. Results and discussion
3.1. Infrastructure supply
There are 221 unique charging stations within the data set for public charging infrastructure in Berlin. Each charging station has one of three types of connections. There are 221 AC-chargers (Type 2), 9 fast DC-chargers (Combo), and 9 CHAdeMo DC-chargers (CHAdeMO). The two latter chargers are also backwards compatible, which means that they allow for AC charging at the same location. The charging stations and their distribution within Berlin are presented in figure 1. The chargers are distributed unequally in the administrative area of Berlin as seen in figure 1. The polygons display the area covered by each charger. The mean distance between charging stations is 7.5 km. The lower, middle, and upper quartiles are 4.4 km, 6.9 km, 10 km, respectively. The Gini analysis results in a coefficient of 0.71 for the polygon areas. This means that in Berlin the distribution of charging stations is more unequal than equal. As seen clearly in the figure, the infrastructure network is much denser in the city center. This distribution follows the demand-driven approach of locating charging stations [32]. An alternative concept would be to distribute charging stations equally throughout the city or using a bottom-up approach as outlined in Hardinghaus et al [9].
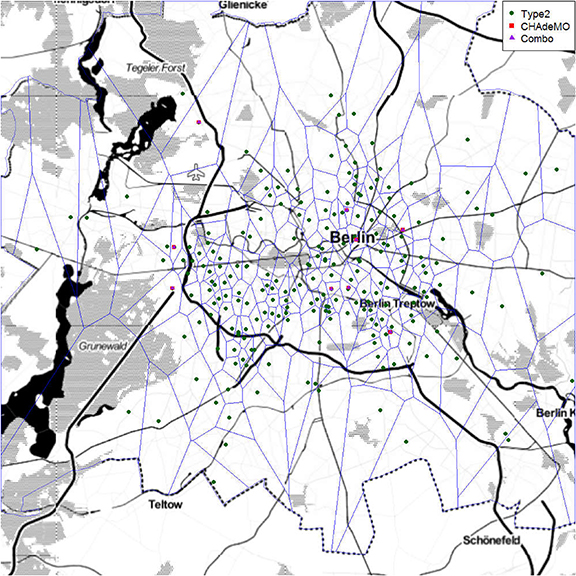
Figure 1. Infrastructure charging stations per connection type. The polygons represent the area of coverage for each station.
Download figure:
Standard image High-resolution image3.2. Infrastructure utilization
Next we analyze the utilization of the charging stations. Per charging event, the average energy delivered for all chargers is 3.7 kWh. When differing between connector types an inbalance is seen. While Type 2 connectors deliver an average of only 3.3 kWh per event, Combo and CHAdeMO deliver an average of 17.9 and 23.3 kWh, respectively. On the other hand, when looking at the number of charging events, an average of only 4.2 events per month can be found for Combo connectors. Type 2 and CHAdeMO connectors are used more frequently (10.9 and 15.2 events per month, respectively). While Type 2 connectors have limited charging power, they are used often, but deliver relatively little energy per event. In comparison, Combo connectors are used only for a few events, but deliver much more energy per charging event. CHAdeMO connectors are used often and deliver a significant amount of energy per event. Hence, overall these chargers deliver the most energy per month (353.1 kWh on average) followed by Combo connectors (74.5 kWh) and Type 2 connectors (36.3 kWh). Table 1 provides an overview of all relevant information regarding the infrastructure utilization. The imbalance between the two DC connector types can be explained by the composition of the fleet regarding different fast charging options the vehicles provide. Figure 2 shows the distribution of charging events in Berlin with average events per month per station over the observation period. For comparison, Muratori et al define a scenario with an existing 50 kW direct current fast charging station in the United States of America [35]. They assume one charging event per day with an associated energy demand of 8.8 kWh, which corresponds to 11 min of charging. In Norway the system of electric mobility is much more developed and there are many more vehicles per charger. Here the typical daily energy demand is 9 kWh [36].
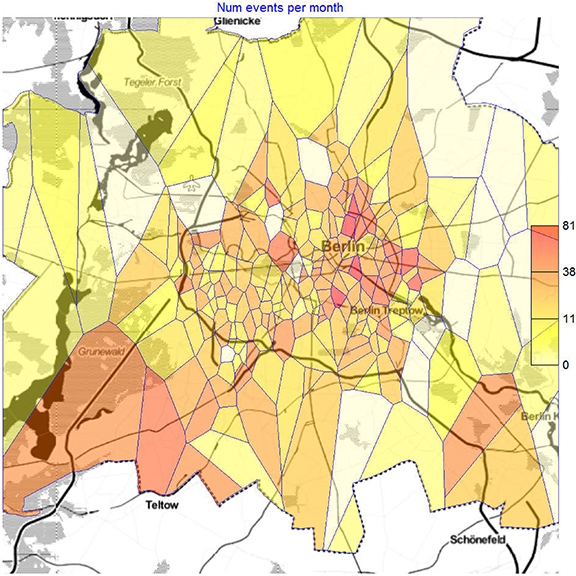
Figure 2. Utilization rate of charging stations (charging events per month per station).
Download figure:
Standard image High-resolution imageTable 1. Infrastructure utilization per connector type in detail.
| Connector Type | Infrastructure utilization | |||
|---|---|---|---|---|
| kWh per month | ||||
| P25 | P50 | P75 | Avg. | |
| CHAdeMO | 53.3 | 126.4 | 298.5 | 353.1 |
| Type 2 | 16.3 | 29.7 | 48.7 | 36.3 |
| Combo | 31.6 | 47.7 | 92.6 | 74.5 |
| kWh per event | ||||
| CHAdeMO | 11.7 | 19.5 | 36.9 | 23.3 |
| Type 2 | 2.6 | 3.0 | 3.3 | 3.3 |
| Combo | 7.5 | 15.6 | 26.4 | 17.9 |
| Events per month | ||||
| CHAdeMO | 2.5 | 6 | 19 | 15.2 |
| Type 2 | 5.0 | 9 | 15 | 10.9 |
| Combo | 1.0 | 3 | 5 | 4.2 |
The analysis of the energy delivered per month per charging station yields a Gini coefficient of 0.4. Thus the Gini coefficient for coverage area (0.71) is much higher compared to the Gini coefficient for energy demand (0.4). This justifies the unequal distribution in space. When looking at all charging stations and the events per day, the data show an interquartile range from 0 to 6 charging events per day. That means the mean 50% of the values are located inside this range. On average there is one event per charging station every third day for all stations. When we differ the utilization by the defined user groups, 66% of events are assigned to carsharing users, 14% to individual users (i.e. private or commercial users), and 20% cannot be assigned. Hence carsharing results in 0.47 events per charger and day, while individual users and non-assigned users results in 0.11 and 0.14 events per charger per day, respectively.
Thus the majority of charging events in public space results from the fleet of free-floating carsharing vehicles. This is in line with earlier research [5, 8, 37]. These papers also show that until now almost all private EV users have a private charging infrastructure and public charging infrastructure is used only for occasional and intermediate charging. Hence, the expansion of public charging infrastructure also works as encouragement for electric carsharing.
In order to create a timeseries of charging station utilization, we define the utilization rate as sum of daily connected time divided by the number of hours in a week (7 x 24) divided by total number of distinct connectors. The results are aggregated weekly and the time series is presented in figure 3. It is clear that the utilization rate for carsharing vehicles decreases over the observation period, while the utilization rate of individual as well as non-identified users increases. In numbers, the utilization rate for carsharing decreases from 6.76 in the first three month of the observation period to 3.76 in last three month of the observation period. At the same time the utilization from individual users and those who cannot be assigned increases from 0.4 to 1.15 and 0.94 to 1.39, respectively. This is plausible as one of the three operators of electric free floating carsharing stopped operating on 30 October 2017. Prior to this the fleet size as well as the number of users decreased continuously. At the same time, the stock of EVs in private and commercial use slowly increased. Thus, one can see a slow increase in public infrastructure use that goes hand in hand with the market development. In the observation period, the stock of EVs in Berlin increased by about 20% with a total of 2007 vehicles in 2018 [38]. In contrast, the larger share of utilization coming from carsharing vehicles strongly relies on actions of operators and cannot be foreseen. As seen, the infrastructure is not utilized to capacity yet. Given the role of the charging infrastructure as a necessary precondition for the success of electric vehicles, private charging as the backbone of the system, and the low ratio between electric vehicles and chargers, relatively low utilization is not surprising in this market phase.

Figure 3. Utilization rate of charging stations per user groups for the dataset over the observation time.
Download figure:
Standard image High-resolution image3.3. Infrastructure efficiency
In this section we analyze the efficiency of the infrastructure. The expansion of the public charging infrastructure is associated with high investment costs from the public sector. To ensure appropriate use of public funds, municipalities mostly build upon demand estimation and demand-driven location concepts prior to the expansion. Nevertheless, the efficiency of installed stations can be massively reduced if infrastructure is blocked by parked vehicles, which are not charging. Hence, the theoretic capacity of the infrastructure would not be reached. This reduced capacity is of high importance because it strongly increases the amount of infrastructure necessary to ensure a reliable supply for a given fleet.
There are two types of infrastructure blocking. First, all vehicles, irregardless of their engine type, can park illegally at the charging station. This blocking is controlled and fined by the police or local administrative authorities. In this case, the vehicle is also towed. For this case, there is no data available on illegal parking at the infrastructure. Second, users of EVs may block the charging infrastructure and use it just for parking. This situation is harder to identify and harder to address. Since the data includes both information for connection time and information regarding the charging process, we can identify the time when a vehicle is parked at the infrastructure longer than the charging requirement and therefore blocking the infrastructure. Hence we investigate blocking time caused by EVs. Figure 4 shows the distribution of the average daily blocking time as an absolute measure. This is defined as the sum of all blocking times per connector averaged over each charging station divided by the number of total available days. In mean over all chargers, in the observation period blocking time accounts for 595 h per charger, while charging time accounts for 651 h. As seen in the figure, the highest values of blocking seem to be on the edge of the city center.

Figure 4. Average daily blocking time for each charging station.
Download figure:
Standard image High-resolution image
Blocking infrastructure for parking may have several causes. In Berlin there is a paid parking zone in public areas with the highest parking demand. However, in most areas of the city parking is free of charge (figure 4). Some charging stations are located in prioritized locations (e.g. in front of the town hall or at the entrance of a shopping center) and there are no additional parking fees for EV users (charging fees still exist). Hence, it is possible that these spaces are blocked for parking to a larger extent than areas outside of paid parking zones. We analyze the blocking time in paid parking zones and compare these values in the rest of the city center (figure 4). The data show that the blocking time is lower in paid parking zones. In paid parking zones, the average relative blocking (blocking time divided by connection time per each charging event) is 140%, while outside of paid parking zones the average relative blocking is 180%. One explanation for this can be a higher utilization of carsharing vehicles in paid parking zones, which causes the majority of blocking time.
In addition, operational measures such as regulating the maximum parking time at stations or pricing models for charging are a relevant influence for blocking time. The real-world data covers such a change in the pricing model for EV users. On 15 July 2017 the pricing model was changed from a time-based fee to a session fee. We evaluate the impact of this tariff change on the blocking time by evaluating it over a period of three months before and after the tariff change and differ between user groups. The results show that the average blocking caused by individual users almost doubled from 0.12 to 0.2 after the tariff change. That proves that individual users cause significantly more blocking when the pricing model allows them to do so. Assuming that an increasing market penetration of EVs leads to more utilization by individual users, this finding is of significant importance. At the same time, the data show that blocking by private users is only an issue for AC-charging. When high charging power is delivered at DC chargers (i.e. CCS Combo and CHAdeMO) no blocking occurs. This is compared to an average blocking of more than 0.25 caused by individual users at Type 2 chargers, given that the vast majority of events are performed at Type 2 chargers.
Even though this is a considerable development, when comparing the blocking time between user groups, the blocking caused by carsharing users is much more problematic. The average blocking caused by carsharing users is many times higher than the one of individual users. The duration of blocking the infrastructure by carsharing users is not affected by the tariff change. The blocking time for carsharing users remained practically unchanged (1.74 prior to the change compared to 1.8 after the change). For carsharing users the tariff has no direct implications as these fees are included in the use of carsharing costs as determined by the operators.
3.4. Recommendations
The analysis of real-world charging data from Berlin provides numerous insights for the build-up and use of charging infrastructure. We evaluate the data based on the infrastructure supply, infrastructure utilization, and infrastructure efficiency. Based on the analysis there are three overarching areas of recommendations for charging infrastructure. These areas are blocking time, carsharing operators and their business models, and charging demand from individual users.
First, the results show the importance of charging demand from individual users. In particular, we see an increasing demand from these users over the study timeframe. This demand at public charging infrastructure is expected to increase as more electric vehicles enter the fleet. With the goal of 10 million electric vehicles by 2030, this will result in a dramatic increase in charging demand for Germany. As the data show, even when individual EV users charge mainly at home at private infrastructure, there is still additional charging demand that must be met with public infrastructure. Infrastructure planning and expansion must start now in order to prepare for this forthcoming demand from individual users.
Second, the blocking of charging stations by fully charged EVs is of high importance for the efficiency of the infrastructure. The results show that fully charged EVs block charging stations to a large extent. On average, chargers are not usable for charging due to being blocked almost as long as they are used for charging. This leads to an enormous reduction of the theoretically capacity of the infrastructure. As a consequence, more charging stations are necessary to ensure the supply of any given fleet. We also see large differences in the blocking time when looking at different user groups. In particular, carsharing users cause more blocking than individual users. In addition, the results show a considerable impact of pricing models on blocking charging stations by individual users. The results prove that individual users block the infrastructure more when the pricing model encourages such a behavior. Finally, charging power is of enormous importance for the blocking caused by individual users. When high charging power is delivered, drivers seem to wait similar to refueling at gas stations and cause no blocking. As demand from individual users is increasing, such interrelations will be of increasing importance and should be taken into account when developing business models for charging infrastructure. Thus, to improve the efficiency of the infrastructure, a time-based tariff seems clearly more appropriate to nudge desired behavior compared to a session fee. Even a progressive pricing model with increasing costs could be tried to level the maximum blocking time. A stronger focus on DC charging, where charging is not combined with parking seems possible. This could reduce the issue of blocking, but has other limitations as installation efforts are much higher, not all electric vehicles allow for DC charging, and the suitability for carsharing seems limited. These changes need careful consideration.
Third, carsharing operators and their business models have a significant impact on charging infrastructure. The majority of charging events, as well as delivered energy come from carsharing vehicles. This justifies focusing on carsharing usage for the future expansion strategy of charging infrastructure as municipalities aim to support electric free floating carsharing as a sustainable mode of individual transport. A consequence of the high demand from carsharing users illustrates that public infrastructure mainly supports and enables the private business model of free-floating carsharing. That means that the overall charging demand is directly related to the decisions of carsharing operators. Furthermore, carsharing users are currently responsible for a significantly higher share of blocking time, both relatively and absolutely. This in turn strongly reduces the efficiency of the public infrastructure. This also reveals that carsharing usage cannot directly be managed by the infrastructures pricing model. Given the particularly important role carsharing plays in the utilization of the infrastructure, operators should be closely integrated into the planning, construction, and operating the infrastructure. In particular, operators have to reduce public burdens caused by high blocking times. For example, dynamic pricing could be an option to increase the efficiency of the infrastructure. In a dynamic pricing model, the price for renting a specific vehicle drops as soon as it is fully charged and blocks a public charger. Alternatively, users could be rewarded with credits for moving a fully charged carsharing vehicle from the infrastructure—similar to the strategy some operators use to charge empty vehicles. In doing so, users are incentivized to vacate the infrastructure. These dynamics need to be developed in order to achieve a sustainable solution for an optimized efficiency of the infrastructure without being too expensive for the operators.
4. Conclusion
Currently there is a lack of knowledge about public charging infrastructure based on real-world insights. In order to fill this research gap, we analyze real-world data for the city of Berlin. The analysis shows that the distribution of charging stations is very unequal in Berlin. The data also show that the infrastructure network is much denser in the city center. While there is an unequal distribution of infrastructure, we see that the utilization of infrastructure is relatively equal. This reflects unequal charging demand, as can be expected based on the location of the infrastructure. We also determine that the majority of public charging events come from free-floating carsharing vehicles.
Results show that the infrastructure is by far not utilized to capacity in the early market phase. This corresponds with the political intention of providing infrastructure as a precondition for the uptake of electric vehicles. The analysis of the use of charging infrastructure shows that the edge of the city center has the highest rates of stations occupied by vehicles not charging. The analysis of the change in charging fees reveals that individual users cause significantly more blocking when the pricing model allows them to do so. When comparing blocking time between user groups, the blocking caused by carsharing users is much more problematic. The average blocking caused by this user group is many times higher than such from individual users. Based on the result, we provide recommendations for three areas: tariff models, carsharing operators and their business models, and charging demand from individual users.
The research also has limitations. First, the exact number of electric vehicles for each user group (i.e. private, commercial, carsharing) is not known. This is due to limitations in the official statistics and information provided by the carsharing operators. Second, blocking the infrastructure is not only done by fully charged EVs, but also by illegally parked internal combustion engine vehicles. Based on data limitations we were not able to evaluate this impact. Third and finally, we did not consider the change in infrastructure stock beyond the infrastructure belonging to the Berlin Model. These are mainly chargers which have been installed in public space before the introduction of the Berlin Model. In addition we did not evaluate additional infrastructure within publically accessible space (e.g. at supermarkets) as there is not data on this infrastructure. The dataset we use describes only a sample of all chargers that are available to users. The entire supply of charging stations cannot be assessed at this time. Future research should examine these charging stations as well.
Acknowledgments
The authors would like to thank Daniel Krajzewicz for his review and feedback on the paper. We also thank the city of Berlin for providing the data for the analysis.
Data availability statement
The data that support the findings of this study are available upon reasonable request from the authors.
Author contributions
M Hardinghaus was responsible for the development of the research idea and methodology. He also contributed to writing the original draft of the paper, and reviewing and editing the final paper. J Anderson was responsible for the background investigation of the topic, writing the original paper draft, and reviewing and editing the final paper. M Löcher was responsible for the data analysis, methodology, and visualization.