

Abstract
Peatlands typically act as carbon sinks, however, increasing wildfire severity and annual area burned may challenge this carbon sink status. Whilst most peat resistance to wildfire and drought research is based on deep peatlands that rarely lose their water table below the peat profile, shallow peatlands and peat deposits may be most vulnerable to high peat burn severity and extensive carbon loss. To examine the role of pre-fire peat depth on peat burn severity, we measured the depth of burn (DOB) in peat of varying depths (0.1–1.6 m) within a rock barrens landscape. We found that DOB (0–0.4 m) decreased with increasing pre-fire peat depth, and that there was a strong correlation between the percent of the profile that burned and pre-fire peat depth. Breakpoint analysis indicates a threshold depth of 0.66 m where deeper peat deposits experienced little impact of wildfire, whereas shallower peat typically experienced high peat burn severity (median percent burned = 2.2 and 65.1, respectively). This threshold also corresponded to the loss of the water table in some nearby unburned peatlands, where water table drawdown rates were greater in shallower peat. We suggest that peat depth may control peat burn severity through feedbacks that regulate water table drawdown. As such, we argue that the identification of a critical peat depth threshold could have important implications for wildfire management and peatland restoration aiming to protect vulnerable carbon stores.
Export citation and abstract BibTeX RIS

Original content from this work may be used under the terms of the Creative Commons Attribution 4.0 license. Any further distribution of this work must maintain attribution to the author(s) and the title of the work, journal citation and DOI.
1. Introduction
While covering only 3% of Earth's land surface, peatlands represent globally important carbon sinks currently storing approximately one-third of Earth's organic soil carbon (Gorham 1991, Yu et al 2008). As climate change progresses and air temperatures rise, northern peatlands are predicted to experience increases in evapotranspiration that exceed increases in precipitation, leading to enhanced drying (Helbig et al 2020) and greater water table depths (WTDs) (Roulet et al 1992, Granath et al 2016). These drier conditions increase peatland vulnerability to carbon loss through decreased moss productivity (Moore and Waddington 2015) and enhanced decomposition (Freeman et al 1993, Strack et al 2006). Drier peat also increases the likelihood of peatland wildfire (Thompson et al 2019) and increases combustion losses from peat smouldering (Benscoter et al 2011; Turetsky et al 2011, Wilkinson et al 2018) especially when peatlands are disconnected from regional groundwater systems (Hokanson et al 2016, 2018).
Wildfire is of particular concern for peatland carbon balances as natural and degraded peatlands can experience up to 1 m depth of burn (DOB), emitting >80 kg C m−2 through peat smouldering combustion, equating to hundreds to thousands of years of carbon accumulation (Davies et al 2013, Lukenbach et al 2015b, Wilkinson et al 2018). Several studies suggest that northern peatlands are resilient (and may be resistant) to wildfire (Shetler et al 2008, Wieder et al 2009), due to both the water regulating traits of some peatland mosses and multiple negative (self-regulating) ecohydrological feedbacks (Waddington et al 2015) that maintain a high water table position and high near-surface peat moisture contents (Waddington et al 2015). However, while there is evidence that some peatlands are resilient to high peat burn severity and can return to a net carbon sink in 20 years (Wieder et al 2009), there is a concern that peatlands may switch from carbon sinks to carbon sources due, in part, to high or increasing combustion losses (Turetsky et al 2015, Ingram et al 2019). The vulnerability of peat to wildfire may be a function of pre-fire peat depth; an idea presented conceptually by Johnstone and Chapin (2006) and Davies et al (2013), however, this has not yet been explicitly tested despite the water table regulation function of many of the aforementioned ecohydrological feedbacks being stronger in deeper peatlands (e.g. Morris and Waddington 2011, Waddington et al 2015).
Shallow peatlands and peat deposits are often understudied in comparison to their deeper counterparts although they have been documented in most peat-accumulating regions of the world, including both northern and tropical regions (e.g. Cannell et al 1993, Jaenicke et al 2008, JNCC, 2011, Vompersky et al 2011), and can represent more spatial coverage (Vompersky et al 2011) and denser carbon stores (Cannell et al 1993), than deeper deposits. Although definitions of 'shallow' peat can vary depending on country, region, and organization, most include peat of 0.1–1 m depth (JNCC 2011). Hereafter, we refer to areas of peat at least 0.4 m deep (but typically less than 1 m) as shallow peatlands, and areas of peat or peaty soils (>25% organic matter) between 0.1 and 0.4 m deep as shallow peat deposits (JNCC 2011).
The depth of peat directly affects water storage (Price and Schlotzhauer 1999), and when a water table is present, the strong capillary forces in peatland mosses (such as Sphagnum spp.) enable vertical moisture transport to the surface from depth (e.g. ∼0.8 m; Lukenbach et al 2015a). However, there is a greater likelihood that the water table in shallow peatlands and peat deposits will drop below the bottom of the peat profile, and in many cases be completely lost during periods of drought (Dixon et al 2017). As the WTD increases, the near-surface peat moisture content decreases (Moore and Waddington 2015, Lukenbach et al 2015a), thereby increasing peat matrix compression (Price 1997, Price and Schlotzhauer 1999) and peat decomposition (Freeman et al 1993). This leads to both temporary and long-term increases in peat bulk density (Whittington et al 2007) and decreases in specific yield (Sy) (Waddington et al 2015) due to alterations to peat buoyancy (Price and Schlotzhauer 1999) and pore size distribution (Boelter 1968). Sy represents the amount of water required to increase/decrease WTD by one-unit depth (Hillel 1998) where lower values represent a 'flashier' water table and an increased susceptibility to water table drawdown (e.g. Sherwood et al 2013). As such, shallow peat is more likely to have rapid water table decline (due to lower Sy) during a period of drought, concomitantly increasing peat bulk density (Whittington and Price 2006) and decreasing near-surface moisture content (Thompson and Waddington 2008, Moore and Waddington 2015).
Moisture content and peat bulk density are major controls on the peat combustion reaction (Van Wagner 1972, Frandsen 1987, Benscoter et al 2011), whereby low moisture content coupled with high peat bulk density likely makes shallow peat more vulnerable to high peat burn severity during wildfire (Prat-Guitart et al 2016, Huang and Rein 2017, Wilkinson et al 2019). Similarly, the presence of legacy carbon (carbon that avoided combustion during the previous wildfire) typically increases with greater organic soil depth (Walker et al 2019). Hence, the interaction of peat depth and water table position may be an important factor explaining high peat burn severity in recently burned (typically shallower) organic soils in Alaska (2019), and shallow, transitional, peatland margin ecotones in the Boreal Plains, Alberta, where carbon losses from combustion were found to exceed carbon accumulation since the previous wildfire (Ingram et al 2019, Walker et al 2019).
No study to date has explicitly tested the relation between pre-fire peat depth and peat burn severity, hence the objective of this study is to examine the role of pre-fire peat depth on peat burn severity (i.e. DOB) due to smouldering combustion. We hypothesized that pre-fire peat depth has a significant effect on peat burn severity through its relation to water availability. Moreover, we hypothesized that deeper peatlands have slower water table drawdown rates compared to shallower peatlands and peat deposits, where deeper peatlands have an increased capacity to store water and are better able to maintain a water table in the peat profile during dry periods, due to the relative strength of some ecohydrological feedbacks. These hydrological characteristics may make deeper peat more resistant to high peat burn severity and carbon losses, enabling them to maintain a carbon sink status over time. Developing an understanding of the control that peat depth, as a surrogate for ecohydrological processes and properties, has on peat burn severity could prove essential to the protection of peatlands from climate change and enhanced wildfire regimes by targeting the most vulnerable peatlands for conservation and restoration practices (e.g. Granath et al 2016).
2. Methods
2.1. Study area
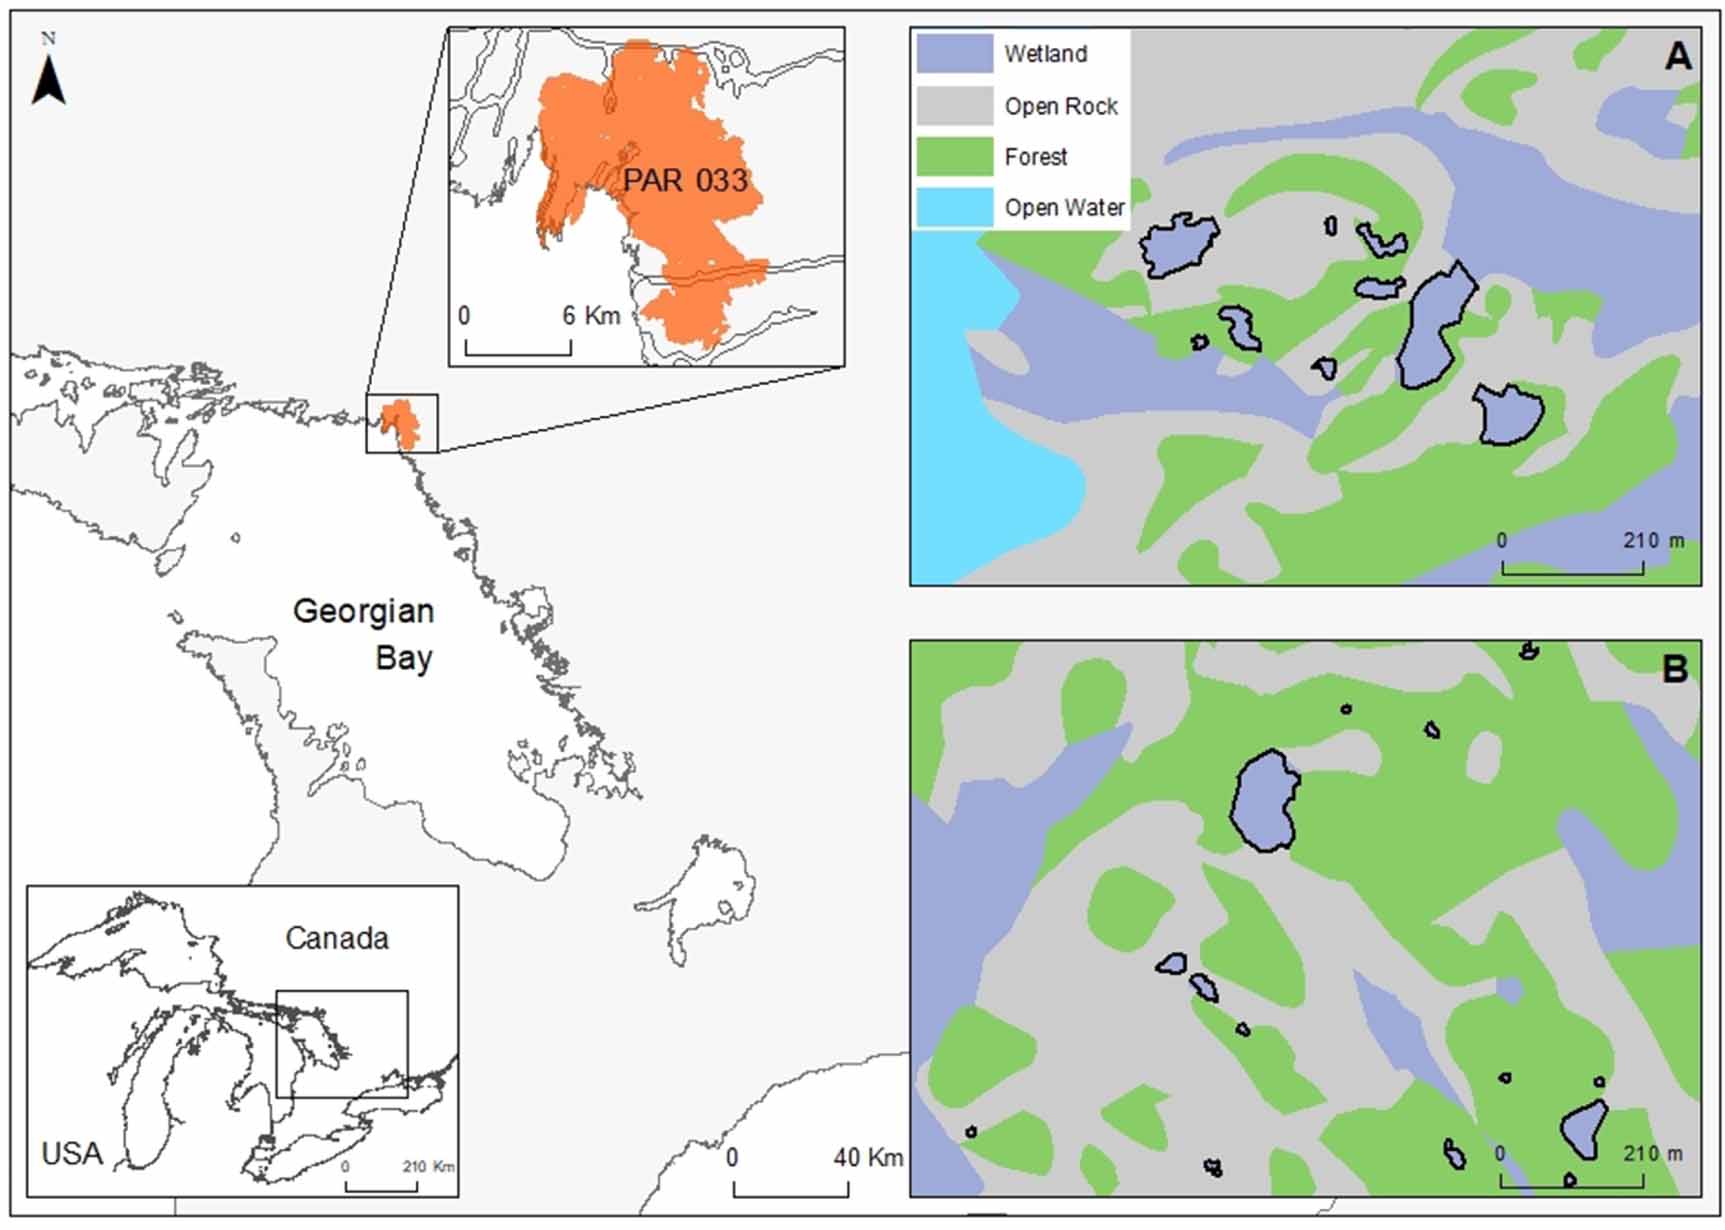
The study area is in the UNESCO Georgian Bay Biosphere Reserve (GBBR) in Ontario, Canada. Over 11 000 ha of the GBBR burned between July 18 and October 31, 2018 in the Parry Sound #33 wildfire (figure 1). The area is characterized by granite bedrock ridges and valleys, with abundant bedrock depressions of various depths along the ridges. The low bedrock permeability in these depressions supports peat accumulation, where a thin layer of organic/mineral soil is overlaid with peat and a living moss layer (typically Sphagnum spp.; Moore et al 2018). The rock barrens hydrogeological setting allows for frequent hydrological isolation of peat deposits of varying depth; where hydrological connectivity is dependent on fill-and-spill events, when water inputs exceed the storage capacity of the depression (Spence and Woo 2003). The surface cover of the surrounding bedrock ridge tends to consist of exposed bedrock, moss (Polytrichum spp.) cushions, and lichen (Cladonia spp.) mats, while the intervening valleys more commonly consist of deeper mineral soil, open water ponds, or deep peatlands. Common tree species in the area include tamarack (Larix laricina), black spruce (Picea mariana), white pine (Pinus strobus), and jack pine (Pinus banksiana).

Figure 1. The Georgian Bay ecoregion on the southern portion of the Canadian Shield in Ontario, Canada, highlighting the location of the Parry Sound #33 (PAR 033) wildfire. (A) Study area within the fire footprint, burned peatland landscape units surveyed in June 2019 are outlined in black, (B) study area outside the fire footprint, unburned sites are outlined in black.
Download figure:
Standard image High-resolution imageThe region may have previously experienced low-severity cultural burning, however, there are no large wildfires documented in recent records for this area (records since 1950 for the Ontario Shield ecozone; Stocks et al 2002, Natural Resources Canada 2018). The climate is humid continental with a relatively drier summer (June–August) compared to wetter shoulder seasons (Environment Canada 2019). In 2018, the study area received approximately 130%, 30%, and 46% of the average precipitation for April, May, and June, respectively, compared to 1981–2010 climate normals (Environment Canada 2019). At the time of wildfire ignition (July 18, 2018) the area had received only 0.25% of the typical precipitation for July (Environment Canada 2019).
Our research was carried out at nine different sites within the Parry Sound #33 fire footprint (figure 1(A)). Peat burn severity was analysed using a stratified-random approach to ensure the distribution of both peat depths and DOB on the landscape was captured, based on a priori knowledge of the unburned landscape. Each site was visually divided into two landscape units defined as: (i) the peatland; subdivided into the peatland middle (Pmid) and peatland margin (Pmarg, along the perimeter of the peatland), and (ii) the upland; forested areas on the adjacent upland rock barrens, with peaty soils and a thin, underlying mineral soil layer. Hence each 'site' contains a peatland middle, peatland margin and upland landscape unit that are referred to by their respective abbreviation, given above, and site ID (table S1 (available online at stacks.iop.org/ERL/15/104032/mmedia)). A range of peatland areal extents were assessed, including three sites containing relatively large peatlands (0.62–1.11 ha), three with medium peatlands (0.14–0.20 ha), and three with small peatlands (0.03–0.06 ha), where maximum peat depth in peatland middles was ⩾0.4 m and peat depth in peatland margins was typically, but not always, <0.4 m. Uplands had variable depths, usually <0.4 m. Dominant tree species were tamarack, black spruce and jack pine for Pmid, Pmarg, and upland landscape units, respectively.
2.2. Peat burn severity and carbon loss
At each site we randomly selected 10 plots in each of the Pmid, Pmarg, and upland landscape units for a total of 270 plots across the nine sites. DOB was estimated 7 months post-fire by assuming that the pre-fire surface between two reference points (tree roots and/or surfaces unaltered by the fire) was flat prior to fire. Post-fire vegetative recovery was minimal during this time, which was predominantly winter months characterised by the presence of frozen ground and a snowpack. Further, one to two year time lags in ground cover re-establishment are typical in northern peatlands (Benscoter and Vitt 2008; Lukenbach et al 2015a). The difference between the burned surface and the estimated pre-fire surface was taken to be the DOB, similar to several studies (e.g. Kasischke and Johnstone 2005, Mack et al 2011). Tree root reference points were calibrated by determining the average depth of peat and/or the live moss layer above roots in two unburned sites located approximately 1.5 km from the study sites, similar to Lukenbach et al (2015b). A total of five DOB measurements were made in each plot, n = 150 per site (1350 total). We also made three remnant peat depth measurements per plot using a peat probe, n = 90 per site (810 total). We estimated pre-fire peat depth in each plot by summing the average post-fire peat depth and average DOB, n = 30 per site (270 total) and this was used to calculate the proportion of the peat profile that burned.
To demonstrate how combustion impacts peatland carbon balances, the median value of peatland DOB measurements (Pmid and Pmarg) was applied across the areal extent of each peatland giving an estimate of the total mass of carbon combusted from each peatland. Carbon loss was estimated using peat bulk density and organic matter content (0.05–0.1 m depth increments) from peat cores at nearby unburned peatlands (table S2). Organic matter was converted to organic carbon using the 42.3% estimate for Sphagnum peat from Loisel et al (2014). The areal extent of each of the nine peatlands was digitized in ArcGIS 10.6.1 using 0.2 m resolution imagery from the 2016 Central Ontario Orthophotography Project (COOP; OMNRF, 2016).
2.3. Water table depth
WTD was continuously monitored at 14 unburned sites (peatlands to shallow peat deposits) located ∼60 km south of the burned sites. The unburned sites are also located within the rock barrens hydrogeological setting and experience similar hydroclimatological conditions to the burned sites (figure 1(B)), where WTD is responsive to changes in short-term climate due to isolation from large-scale groundwater systems (Spence and Woo 2003). Water table measurements were taken for the period between the end of snow melt (April 6, 2018) and the beginning of the wildfire (July 18, 2018). Solinst Levelogger pressure transducers recorded WTD in 0.05 m diameter PVC wells installed in the deepest part of the unburned sites, typically reaching bedrock at the base. The water table drawdown rate (mm day−1) for all 14 unburned sites was calculated for the longest rain-free period preceding the wildfire from May 26 to June 12, 2018.
2.4. Statistical analyses
All statistical analyses were conducted in R 3.6.1 (R Core Team 2018). Linear regressions were conducted to examine relationships between pre-fire peat depth and DOB, percent burned, and percent carbon loss. A breakpoint analysis using a piecewise linear regression (segmented—R; Muggeo 2008) was conducted to determine the pre-fire peat depth at which the slope of the linear relation between the percent burned and pre-fire peat depth changed. Data tended to be non-normal, hence, non-parametric Kruskal–Wallis (KW) tests were conducted to determine whether the median DOB and percent burned differed significantly between the Pmid, Pmarg and upland, or between plots deeper and shallower than the identified breakpoint. Similarly, KW tests were employed to test the difference between water table drawdown rates in unburned sites. Median values ± interquartile range are displayed unless stated.
3. Results
3.1. Peat burn severity
DOB was significantly different between Pmid, Pmarg, and upland landscape units (χ2 = 147.42, df= 2, p < 0.001). DOB values were 0.02 ± 0.06, 0.18 ± 0.09 and 0.12 ± 0.07 m for Pmid, Pmarg and upland, respectively. Pmarg had the largest range of DOB values (0.002–0.40 m), while Pmid was the only landscape unit which contained any plots with DOB values of 0 m. Relationships between DOB and pre-fire peat depth varied between the landscape units (figure 2). In the upland, DOB (m) and pre-fire peat depth (m) had a strong positive correlation (DOB = 0.59(peat depth) + 0.02, adjusted R2 = 0.65, p < 0.001). In contrast, in Pmid DOB decreased as pre-fire peat depth increased (DOB = −0.05(peat depth) + 0.08, adjusted R2 = 0.13, p < 0.001) and Pmarg showed no significant relationship between DOB and pre-fire peat depth (p = 0.42). However, when analysing all landscape units together, DOB (m) was found to decrease significantly with increasing pre-fire peat depth (m) (DOB = −0.11(peat depth) + 0.17, adjusted R2 = 0.19, p < 0.001) (figure 2).

Figure 2. The relationship between depth of burn (m) and pre-fire peat depth (m), separated by landscape unit. The solid black line represents a 1:1 relationship between depth of burn and pre-fire peat depth.
Download figure:
Standard image High-resolution imageThe proportion of the profile that burned (percent burned) varied significantly between the landscape units (χ2 = 164.1, df = 2, p < 0.001), where uplands had the highest percent burned (73.1 ± 20.2), followed by Pmarg (61.3 ± 35.7), and Pmid had the lowest (2.4 ± 8.3). Within the peatland (Pmid and Pmarg), the percent burned decreased significantly with increasing pre-fire peat depth (for n = 8/9 sites) (table S3), differing in slope based on their pre-fire peat depth distributions (figure S1). A piecewise linear regression (adjusted R2 = 0.75, p < 0.001) showed that the percent burned (%) decreased sharply with increasing pre-fire peat depth (m) (percent burned = −129.43(peat depth) + 95.56) until a breakpoint of 0.66 ± 0.04 m pre-fire peat depth, where, whilst still significant, this relationship changed (percent burned = −14.01(peat depth) + 19.88; figure 3). A piecewise linear regression model was selected over a general linear regression based on Akaike information criterion values that were 2271.7 and 2355.6 for piecewise and generic linear regressions, respectively. Percent burned was significantly greater at plots where pre-fire peat depth was below the breakpoint (i.e. <0.66 m; χ2 = 117.8, df = 1, p < 0.001). Median percent burned was 2.2 and 65.1% for peat deeper than and shallower than the breakpoint, respectively.

Figure 3. Piecewise linear regression between the percent of the profile burned (percent burned) and the pre-fire peat depth (m). Slope 1 = −129.430, slope 2 = −14.014, adjusted R2 = 0.75, p < 0.001. Breakpoint estimated at 0.66 ± 0.04 m pre-fire peat depth.
Download figure:
Standard image High-resolution image3.2. Carbon loss
Mean (± std) carbon loss from the peatlands (Pmid and Pmarg) was 1.61 ± 0.97 kg C m−2, ranging from 0.24–3.12 kg C m−2. The percent carbon loss (%) decreased significantly with increasing median peat depth (m) (carbon loss = −48.39(peat depth) + 40.76, adjusted R2 = 0.48, p < 0.05). Site 111, with a median peat depth of 0.26 m (maximum 0.4 m), had the greatest proportional carbon loss, losing an estimated 45% of its total stored organic carbon (figure S2). The site with the deepest peat (site 102), with a median peat depth of 0.98 m, had the third lowest percent carbon loss, with an estimated 2.0% of its total stored carbon being combusted (figure S2).
3.3. Water table depth
Unburned sites with a maximum peat depth shallower than the breakpoint (0.66 m) had water tables near the base of the peat profile or not present at the time of the wildfire (figure 4). Conversely, unburned sites with a maximum peat depth greater than the breakpoint had water tables present in the peat profile (figure 4). For the May 26–June 12 rain-free period the rate of water table drawdown (mm day−1) decreased with increasing maximum peat depth (m) per site (figure 5). A log-linear curve describes the relationship reasonably well (drawdown rate = −8.788ln(max peat depth) + 13.560; R2 = 0.702) and water table drawdown rate was significantly greater for peatlands that lost their water table prior to the start of the wildfire (maximum peat depth below breakpoint) compared to those which did not (χ2 = 8.0, df = 1, p < 0.01; maximum peat depth above breakpoint), over the same time period.

Figure 4. The water table depth (WTD) on July 18, 2018 of 14 unburned sites compared to their maximum peat depth (m). The grey lines represent the location of the pre-fire peat depth breakpoint at 0.66 ± 0.04 m. The open and filled symbols represent sites where the water table was below and within the peat profile, respectively.
Download figure:
Standard image High-resolution image
Figure 5. Water table (WT) drawdown rate (mm day−1) in 14 unburned peatlands/peat deposits during a rain-free period from May 26 to June 12, preceding the Parry Sound #33 wildfire. WT drawdown rate = −8.788ln(x) + 13.560, adjusted R2 = 0.702, p < 0.001.
Download figure:
Standard image High-resolution image
4. Discussion
4.1. Peat depth, burn severity, and carbon loss
Our results support our hypothesis that shallower peat is more vulnerable to high peat burn severity, where DOB decreases with increasing pre-fire peat depth, albeit with variability (figure 2). We identified a threshold pre-fire peat depth of 0.66 ± 0.04 m, where profiles deeper than this were generally resistant to deep combustion (figure 3). In peat deeper than the threshold, median percent burned was 2.2% and 27/67 plots had an average DOB of <0.01 m. Conversely, in peat shallower than the threshold we recorded up to 98% of the profile burned in some plots, where the median was 65%. Although vertical peat combustion is typically moisture-limited rather than fuel-limited (Usup et al 2004, Prat-Guitart et al 2016), our results show that shallow peat deposits can burn through almost their entire profile, suggesting that the combustion of the majority of the organic matter present was the cause of the cessation of the smouldering reaction in the shallowest peat (see 1:1 line; figure 2), similar to shallow peat profiles studied by Miyanishi and Johnson (2002). Shallow peat deposits have also been found to burn deeply in the transitional margin ecotones of peatlands in the Boreal Plains, Alberta (Hokanson et al 2016), and in Alaska with up to 86% of the pre-fire organic soil profile lost to combustion (Walker et al 2019). However, a threshold of pre-fire peat depth describing the vulnerability of peat to severe burning has not previously been established.
The resistance of deeper peat to combustion may be due to the increased water storage capacity of deeper peat deposits (Price and Schlotzhauer 1999), and the ability of deeper peatlands to maintain a water table within the peat profile during the summer dry period. In fact, on the day the 2018 Parry Sound #33 wildfire started, we found that only unburned sites with a maximum peat depth deeper than the threshold had a water table within the peat profile, whereas shallower sites had water tables below their peat profiles (figure 4). The strong capillary forces in peat enable water to be transported from the water table towards the surface (Mccarter and Price 2014) whilst the water table is less than ∼0.8 m deep (Lukenbach et al 2015a), maintaining hydrostatic equilibrium in the peat profile. When the WTD increases past this depth, or is lost from the peat profile, water content in the upper layers can become decoupled from the water table (e.g. Lukenbach et al 2015a) causing surface peat to be rapidly driven towards residual water content (Moore and Waddington 2015, Dixon et al 2017).
Maintaining moisture in the peat profile, especially the near-surface, is crucial to limit the ignition of peat and propagation of the smouldering reaction (Van Wagner 1972, Frandsen 1987, Benscoter et al 2011, Prat-Guitart et al 2016). Because of the high latent heat of vaporisation of water, peat moisture acts as the main energy sink in the combustion reaction (Benscoter et al 2011) where water must be evaporated before the peat fuel is heated to combustion temperature, enabling the propagation of smouldering (Van Wagner 1972). The critical peat moisture content limiting peat smouldering has been found to vary between 125 and 395 g g−1 where samples with high peat density experienced smouldering at a higher moisture content (Rein et al 2008, Benscoter et al 2011). Under continued atmospheric demand the loss of the water table in shallow peat (figure 4) will cause decreasing moisture content in near-surface peat and increase peat smouldering potential (Van Wagner 1972, Rein et al 2008, Benscoter et al 2011).
In nearby unburned peatlands, we found that water table drawdown rate (mm day−1) decreased with increasing maximum peat depth during a rain-free period preceding the Parry Sound #33 wildfire (figure 5). By extension, the regulation of water table drawdown in deeper peatlands in the burned landscape likely helped maintain a water table within the peat profile, leading to lower peat burn severity. Higher water table drawdown rates in shallow peatlands and peat deposits could be a result of lower Sy due to greater decomposition. Frequent oxidation of the peat profile likely increases peat decomposition (Freeman et al 1993, Strack et al 2006) leading to increased peat bulk density that is associated with decreasing specific yield (Sy) and greater water table fluctuations, promoting further decreases in Sy (Waddington et al 2015). Similar mechanisms have been suggested to increase the smouldering potential of peat in the margins of treed peatlands in the Boreal Plains (Wilkinson et al 2019). Because higher density peat can burn at a higher moisture content (Frandsen 1987, Rein et al 2008, Benscoter et al 2011) this could help further explain the high peat burn severity recorded across this landscape, although specific pre-fire peat characteristics are unknown for these burned sites.
Despite the prevalence of shallow peat in the study sites, average carbon loss from the peatlands (1.61 ± 0.97 kg C m−2) was within the typical range of carbon loss from northern peatlands (e.g. Benscoter and Wieder 2003, Hokanson et al 2016). However, the impact on the carbon balance is dependent on net carbon accumulation rate, which for northern peatlands is ∼0.029 kg C m−2 yr−1, but is strongly controlled by the rate of decomposition (Gorham 1991). Moreover, due to the shallow depths of peat deposits and the high percent of the profiles experiencing combustion (figure 3), the proportion of pre-fire carbon combusted from individual peatlands (max = 45%; figure S2) was much higher than other undisturbed northern peatlands (e.g. 2.8%; Wilkinson et al 2018), and more similar to heavily-drained peatlands (e.g. 51%; Wilkinson et al 2018). Furthermore, the exposure of mineral soil promotes the recruitment of deciduous species and non-peat-accumulating vegetation (Johnstone and Chapin 2006) that are detrimental for the re-accumulation of long-term carbon stores and can result in an altered wildfire regime (Kettridge et al 2015). Overall, we find that deeper peat is more resistant to high peat burn severity and excessive carbon loss, owing the ability to regulate water table position within the peat profile to a number of complex and interacting ecohydrological feedbacks. This is an important finding given the extensive distribution and cover of shallow peat across regions experiencing both natural and managed fire regimes (Jaenicke et al 2008, JNCC 2011, Vompersky et al 2011).
4.2. Implications for peatland carbon storage, wildfire management, and restoration
We suggest that peat depth can act as a key indicator for vulnerability of peat deposits to high peat burn severity. In-situ measurements of peat depth do not require continuous monitoring, such as precipitation or WTD, making it an efficient and simple indicator to be used in fire vulnerability mapping as part of broader fire management strategies. Additionally, peat depth can be used conceptually to identify the types of peatlands and peat deposits which may be at the greatest risk of not maintaining their carbon sink function over successive fire disturbances (cf Ingram et al 2019;, Walker et al 2019), such as: younger and/or slow-accumulating peatlands (Vardy et al 2000), recently restored peatlands (Granath et al 2016), and moss and lichen mats on the upland rock barrens (Moore et al 2018). Regional and pan-regional risk assessments based on peat depth will require advances in peat depth mapping techniques by utilizing remote sensing approaches, leading to improved estimates of northern peat depths, which are currently limited (Yu 2012).
The identification of the pre-fire peat depth threshold allows for a classification of fire risk based on peat depth where, in this region, deposits >∼0.7 m deep are at lower risk of high peat burn severity, and peat deposits shallower than this have a higher risk of peat smouldering leading to high peat burn severity. Given that our pre-fire peat depth threshold for peat resistance to deep combustion is controlled by a number of interacting factors, we suggest that while the specific resistance threshold will vary between ecozones and landscapes due to the interactive effects of hydroclimate, hydrogeological setting, and land-use and land-cover change (e.g. Hokanson et al 2018, Wilkinson et al 2019), this 'survival of the deepest' concept is widely applicable. We encourage further field research and coupled hydrological and combustion modelling (e.g. Thompson et al 2019) studies to examine peat burn severity thresholds in other landscapes and climates.
In addition to improving the targeting of fire management strategies, these results also highlight the value of proactive restoration. Restoration efforts should be designed to accumulate peat quickly, particularly through the establishment of Sphagnum moss (Granath et al 2016). Efficient methodologies have been developed to successfully restore peatlands after harvesting and drainage, i.e. the moss layer transfer technique (Rochefort et al 2003), with more recent work focusing on shallow peat deposits (Grand-Clement et al 2015). Furthermore, we suggest that similar practices could be applied to burned peatlands to promote a quicker return to a carbon-accumulating system and to limit future smouldering potential (Granath et al 2016), thereby supporting a return to a net carbon sink status and protecting globally significant carbon stores.
Acknowledgments
This research was carried out in the Georgian Bay Biosphere, a UNESCO biosphere reserve, situated within the Robinson-Huron Treaty of 1850 and Williams Treaty of 1923, and located on Anishinabek territory. We give our sincere thanks to Greg Verkaik, Alex Furukawa, Hope Freeman, Danielle Hudson, Taylor North, Kieran Lehan, and Renée McDonald for their assistance in the field. This research was funded by a NSERC Discovery grant (#289514) and a Global Water Futures—Boreal Water Futures grant to JMW. The authors have no conflict of interest. >
Data availability statement
The data that support the findings of this study are available upon reasonable request from the authors.