Multi-Sensor Evaluating Effects of an Ecological Water Diversion Project on Land Degradation in the Heihe River Basin, China
 Xiang Song
 Jie Liao
 Xian Xue
 Youhua Ran2
- 1Key Laboratory of Desert and Desertification, Chinese Academy of Sciences, Lanzhou, China
- 2Northwest Institute of Eco-Environment and Resources, Chinese Academy of Sciences, Lanzhou, China
To deal with the increasingly severe land degradation in the downstream of the Heihe River Basin (HRB) in northwest China, an Ecological Water Diversion Project (EWDP) was implemented since 2000. A comprehensive analysis of the effects associated with the project on land degradation is necessary. According to the concept of Land Degradation Neutrality (LDN), multi-sensor data has been used to extract information on Land Use/Land Cover (LULC), Aeolian desertification, and vegetation dynamics, which were chosen as monitoring indices to reveal the process of land degradation in the HRB. Then, these results were combined with meteorological data, socio-economic statistics, and hydrological data to discuss the main driving factors influencing the land degradation process to evaluate the effects of the EWDP on land degradation in the HRB. The results showed that the process of land degradation in the HRB could be divided into two stages, in which the degradation trend was dominant from 1990 to 2000, and the rehabilitation trend was dominant from 2000 to 2015. Although both climate variation and human activities have been favorable to land degradation development in the HRB, climate factors have no significant influence on land degradation in the midstream and downstream in the HRB. The decrease of available water resources is the dominant driving factor of a series of ecological environment problems in the downstream of the HRB, and the land degradation process of the HRB has been stopped and reversed, mainly attributed to the EWDP. The EWDP facilitated the recovery of the deteriorated ecosystem by improving the efficiency of surface water resources reallocation in the downstream. Still, the EWDP indirectly led to the sink of the groundwater table in the midstream, resulting in local vegetation degradation.
Introduction
Land, as a non-renewable and essential natural resource, is the material basis for human survival, and its rational exploitation and utilization improve social and economic development (Liu, 1995). However, under the background of global warming, population expansion, and rapid growth of the social economy, land degradation, which refers to the decrease of biological productivity of land (UNCCD, 1994), caused by the excessive and irrational use of land resources, became one of the most pressing problems causing widespread concern in the international community (Romm, 2011; Kakembo et al., 2012).
In arid and semi-arid regions, water is the single most important limiting factor for the growth and productivity of vegetation (Inman-Bamber et al., 2012). Most of those regions have been facing a growing severe shortage of water resources (Zhang and Xia, 2009), especially the inland river basin that is overly sensitive to climate variation and human activities (Mi et al., 2016). In the inland river basin, water resources are essential for maintaining the ecological balance and economic development of oases located in the midstream and downstream (Ma et al., 2005). The upstream inflow is the primary water source available to maintain the ecological environment and for the development of the whole river basin (Zhou et al., 2018). However, because of climate variation and increasing water consumption in the midstream (e.g., increased arable land irrigation, rapid urbanization, economic development, and population expansion, etc.), the amount of water that enters the downstream in many inland rivers has decreased over the past 60 years (Cheng and Li, 2015). As a result, this led to severe eco-environmental problems, such as reducing ecosystem stability, rivers and lakes drying up, declining vegetation cover, severe sandstorms, and land degradation. Therefore, integrated watershed water resource management is the critical solution to the urgent conflict of the regulation between water demand and available water resources in the present and the future in the inland river basin (Pereira et al., 2012), which is vitally essential for the protection of inland river ecosystems and regional sustainable development (Cheng et al., 2014).
The Heihe River Basin (HRB) is the second largest inland river basin in northwestern China and has all the essential characteristics of an inland river in the desert region. In the HRB, the conflict among ecological, societal, and economical water demands is foremost (He et al., 2009; Wang et al., 2009; Zhang et al., 2015). As the center of economic activities in the HRB, more than 95% of the arable land of the whole basin is distributed in the midstream oasis, which consumes about 80% of the water resources over whole HRB (Cheng et al., 2006; Zhang et al., 2006). With the rapid economic development and continuous population boom, the more substantial increase in water consumption in the midstream of the HRB dramatically reduces the discharge entering the downstream used to maintain ecological balance, which results in river breakdown, the lake drying up, groundwater level decline, wetland shrinkage, vegetation degradation, land desertification, etc. (Liu Z. et al., 2002; Xiao and Xiao, 2004; Guo et al., 2009; Cheng et al., 2014). Due to accelerated and sustained deterioration of the ecosystem, the downstream of the HRB has become one of the primary dust storm sources in China (Wang and Cheng, 1998).
In 1997, China’s State Council approved the Ecological Water Diversion Project (EWDP) in different water years to ensure that the oasis in the downstream would be restored to the level of the mid 1980s by reasonably allocating the water resources between midstream and downstream. According to the EWDP, when the water quantity of the YLX station reaches 15.8 × 10⁸ m3, the environmental water supply of the whole basin must be guaranteed to arrive at 7.3 × 10⁸ m3. As implementation of the EWDP since 2000, responses on the groundwater, lakes, wetlands, evapotranspiration, vegetation, hydrological and environmental process, and socio-economic effects have been reported (Ao et al., 2012; Cheng et al., 2014; Wang et al., 2014; Huang et al., 2016; Luo et al., 2016; Mi et al., 2016; Zhang et al., 2017; Zhou et al., 2018). However, the status and dynamics of land degradation in the HRB after the implementation of the EWDP are still unknown. Therefore, in this study, we used multi-sensor data to assess the effects of the EWDP on land degradation in the HRB.
Land degradation has been monitored via different methodologies through various indicators on regional scales. For example, Wang et al. (2011) used Landsat as the data source to extract the Aeolian desertification data of northern China by a visual interpretation method based on vegetation coverage and sand sheets coverage. Wang et al. (2020) analyzed the patterns of land degradation and restoration during 1990–2015 by using fine-resolution land cover data in Mongolia. Jiang L. et al. (2019) monitored the land degradation according to NDVI and ALBEDO by applying change vector analysis. Duan et al. (2019) identified land degradation based on the Modified Soil Adjusted Vegetation Index (MSAVI), the Fractional Vegetation Cover (FVC), Land Surface Temperature (LST), ALBEDO, and Modified Temperature Vegetation Dryness Index (MTVDI) via the QUEST (quick, unbiased, and efficient statistical tree) classification method. Feng et al. (2016) analyzed the spatial-temporal change of Aeolian desertification in northern China by the Normalized Difference Desertification Index (NDDI).
However, most of these studies on land degradation depend on data with a coarse spatial resolution (e.g., 1 km or 8 km spatial resolution), which cannot provide detailed information on the spatial-temporal patterns of the land degradation. Fewer studies have used higher-resolution images (e.g., Landsat series with 30 m resolution), which focused on one aspect of land degradation. The UNCCD considered Land Degradation Neutrality (LDN) as a Sustainable Development Goal and offered the concept of LDN as a standard quantitative method for determining degradation states in the framework of three aspects that included land cover, land productivity, and carbon storage (Akhtar-Schuster et al., 2017; Cowie et al., 2018). Therefore, we chose Land Use/Land Cover (LULC), vegetation dynamics (reflecting land productivity), and Aeolian desertification (the main form of land degradation in the HRB) as monitoring indices to reveal the process of land degradation in the HRB. The objective of this research included: ➀ to illuminate the dynamics of land degradation in the HRB by using multi-sensor data; ➁ to analyze the driving factors behind land degradation; and ➂ to discuss the effects of the EWDP on land degradation. The results provide a reference for combating and control land degradation and the basis for regional economic development and economic restructuring as well as promoting basin ecosystem stability and sustainable development.
Materials and Methods
Study Region
The HRB, lying between 37.5–43.5°N and 96–104.3°E, is the second largest inland river basin in the arid zone of northwestern China (Figure 1), with a total drainage area of 271,000 km2 and a full length of 821 km. Geographically, the HRB can be divided into three distinct geomorphological units from south to north, including the southern Qilian Mountains in the upstream region, the middle Hexi Corridor, and the northern Alxa Plateau in the downstream. Due to severe elevation fluctuation among the up-, mid-, and downstream (800–5,500 m), the HRB has substantial spatial heterogeneity with diverse ecosystems, including an ice-snow zone, frozen soil, mountain forest, oasis, desert, and desert riparian forest (Kang et al., 2005).
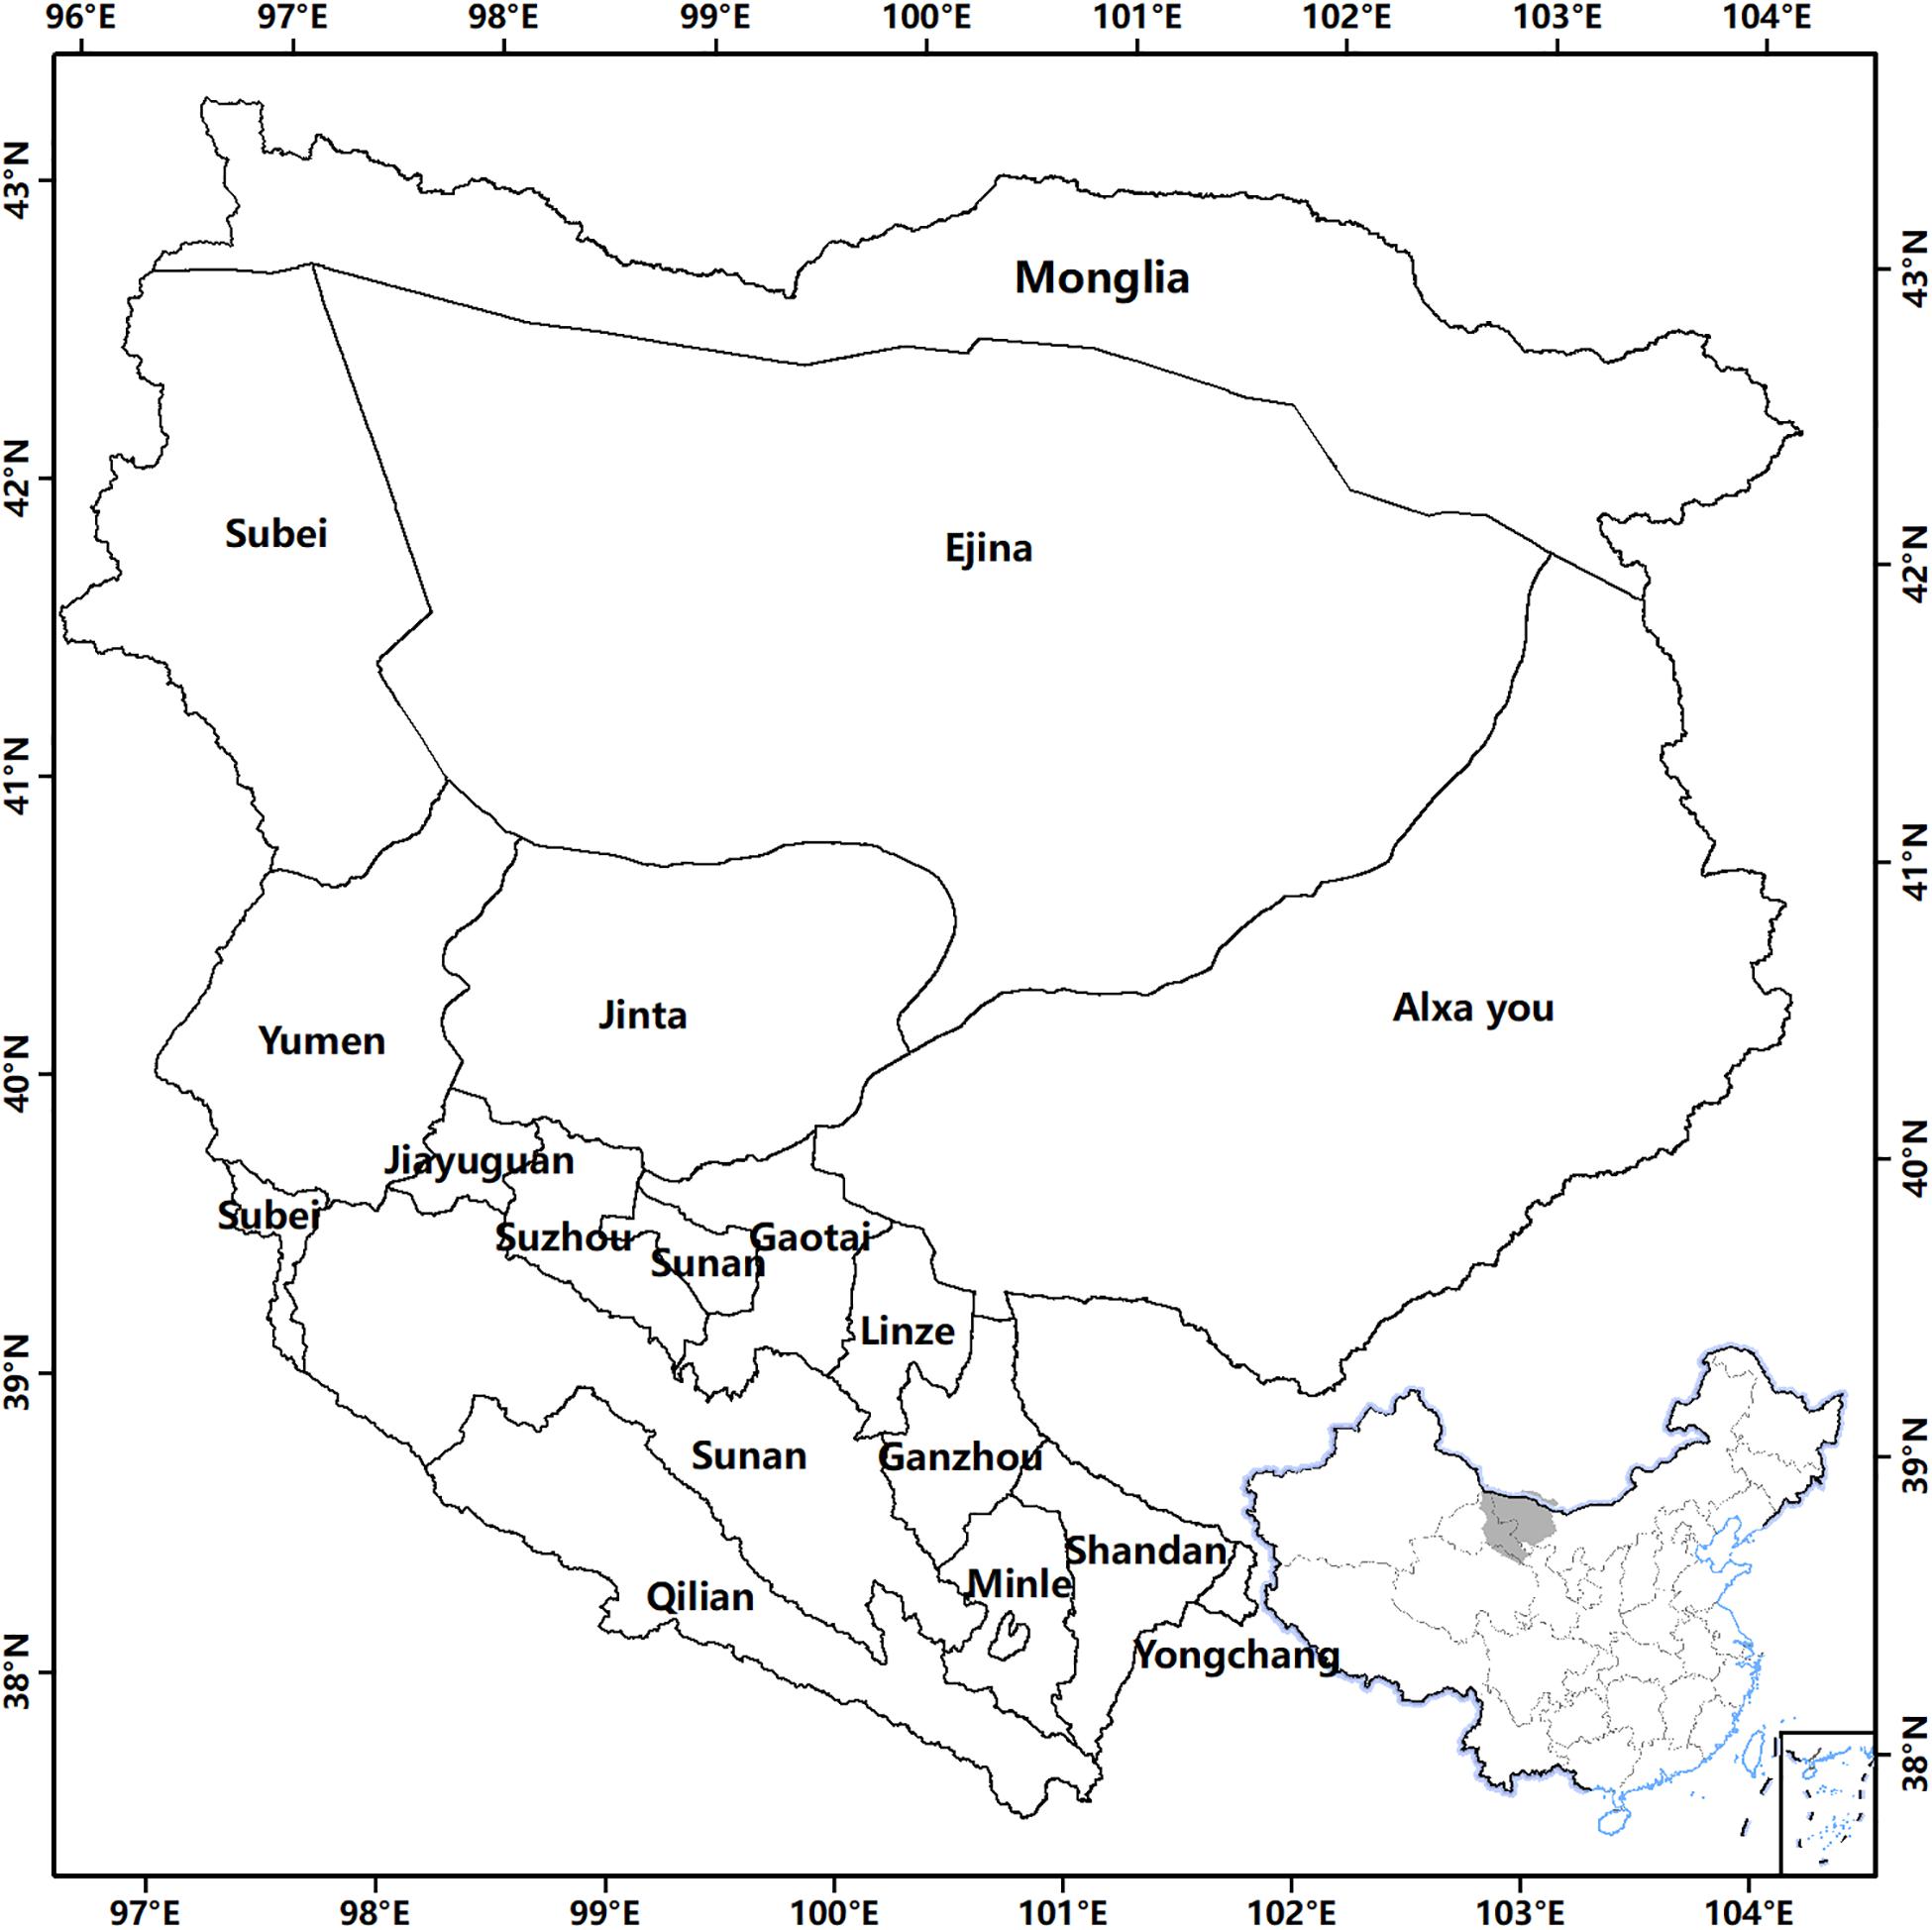
Figure 1. Location of the Heihe River Basin.
The HRB was situated in the interior of the Eurasian continent and dominated by arid hydrological features. Depending on the location, the temperature, precipitation, and evaporation in the HRB vary dramatically at both temporal and spatial scales. The upstream is in the middle part of the Qilian Mountains, which have an annual mean temperature ranging between 2 and 3°C, and yearly precipitation increased from about 250 mm in the low hill zone to about 500 mm in the high mountain region (Qi and Luo, 2005). The midstream with intense evaporation and little precipitation is in the Hexi Corridor. The annual mean temperature is 6–8°C, and yearly rainfall is 120–200 mm (Qi and Luo, 2005). Oasis agriculture is the main irrigated area and a substantial commodity grain base in China (Xie et al., 2015), which comprises about 97.3% of the population of the HRB and produces most of the GDP of the whole basin (Fang, 2002). The downstream adjacent to the Badain Jaran Desert is the Ejina banner and Alxa right banner, which is mainly covered by the Gobi Desert. Here, the annual mean temperature is 8–10°C, and yearly precipitation is less than 50 mm, but potential annual evaporation is >3000 mm (Liao et al., 2015a). Due to strong wind, the downstream is one primary source of sandstorms in northern China.
By the end of 2014, the total population of the HRB was 2,527,500, with an average population density of 10.64 people/km2, of which the agricultural population accounted for 56.9% of the total population. The people of the HRB are mainly distributed in the midstream, accounting for 95.3% of the total population. The overall economic development of the HRB is in a backward position. The GDP of the HRB was 115.1 billion yuan in 2014.
Data Acquisition and Pre-processing
Multi-Sensor Data
The Landsat images represent the longest temporal record of space-based land observations; those used in our study included TM (1990, 1995, 2005, and 2010), ETM (2000), and OLI (2015) images with spatial resolutions of 30 m. The principles of image selection included the following: ➀ the image was acquired from July to September, in which period vegetation typically reaches its maximum extent, and ➁ the percentage of cloud coverage must be less than 10%. Acquired cloud-free images that encompassed the entire area within a given year were complicated, attributed to the broad field of the study region. Therefore, some images from previous or subsequent years were chosen as replacements for unavailable images in the target years. A total of 132 images were downloaded from the US Geological Survey1. All those Landsat images were projected to uniform Albers Conical Equal Area/WGS84 coordinate system and were pre-processed including a radiometric and atmospheric correction to eliminate the radiometric error caused by atmospheric influences. Finally, the Landsat images were clipped and mosaicked to synthesize a cloudy free image covering the HRB.
Due to a fragment of AVHRR data at 1 km, satellite data consisting of a Global Area Coverage (GAC) 4 km AVHRR top of atmosphere reflectance database were chosen for this study. Data between 1990 and 2000 with a temporal resolution of 1 day were processed in this study, which includes AVHRR observations from the NOAA-11 (1990/01/01-1994/12/31) and NOAA-14 (1995/01/01-2000/12/31) satellites. The raw AVHRR images were calibrated following the latest recommendations by NOAA, and atmospheric correction was performed by using the Quick Atmospheric Correction (QUAC) provided by ENVI 5.3. Then, the Minimum red band criterion was used to generate daily composites (Latifovic et al., 2005). After pro-processing, all AVHRR images were reprojected to uniform the Albers Conical Equal Area/WGS84 coordinate system, and the Red band and NIR bands were used to calculate NDVI.
MODIS standard land products provided by NASA and vegetation indices 16-Day L3 Global 1 km (MOD13A2) were used in this study to supplement AVHRR data to cover the entire research period. Data between 2000 and 2015 with a temporal resolution of 16 days and a spatial resolution of 1 km were processed in this study. The MODIS product was downloaded from the NASS’s LAADS DAAC2 and reprojected to the Albers Conical Equal Area/WGS84 coordinate system and resampled to resolutions of 4 km by using MRT (MODIS Reprojection Tool).
The Harmonic Analysis of Time Series (HANTS) method was used to process the NDVI series calculated from AVHRR and MODIS to eliminate the influence of clouds and atmosphere, as well as remove the outliers, smooth the data, and interpolate the missing data. After this process, the mean NDVI in the growing season calculated from 1990 to 2015 was used to extract the information on vegetation dynamics.
Ancillary Data
Meteorological data (1975–2015), including precipitation, annual mean temperature, and annual mean wind velocity were obtained from the China Central Meteorological Bureau3. Three weather stations, including Ejina Banner in Alxa League of Inner Mongolia, Zhangye in the Hexi Corridor of Gansu Province, and Qilian in the Qinghai Province, were taken as representative of the climate of the different zone of watersheds. The hydrological data used in this study were collected from the Heihe River Bureau. Three hydrological stations were included in the data set [Yingluoxia (YLX), Zhengyixia (ZYX), and Langxinshan (LXS)].
LULC Classification and Measurement of Changes
Assessing impacts of the EWDP on LULC changes is the basis for watershed management and control land degradation. Dynamic change analysis of LULC is a practical approach to understand the process, extent, and trend of land degradation. In this study, LULC transfer analysis has been used to derive the transition among different LULC classes with the aid of GIS, which provides more details of LULC change information, as well as some necessary data for land degradation process analysis.
According to China Land Cover Classification System and National Land Use Remote Sensing Mapping Classification System (Zhang et al., 2014), a classification system of six primary LULC types (included woodland, grassland wetland, cropland, artificial land, and bare land) was employed in this study, which was divided into 16 secondary types (Table 1). The spatial and temporal dynamics of the different LULC classes were investigated using remote the sensing data of the period from 1990 to 2015, covering 25 years. Based on the availability of reliable Landsat data, the study period was divided into five intervals (1990–1995, 1995–2000, 2000–2005, 2005–2010, and 2010–2015). The 2015 LULC Data Set (with a spatial resolution 30 m) of the HRB is produced by using Landsat OLI images, and the Automatic Object-Oriented Classification Based on Decision Tree was used to derive the LULC information. The Dataset in other periods were produced by using the Object-Oriented Vector Similarity Change Detection Method. The details for the Classification and Change Detection Method were described in Song and Yan (2014) and Wu et al. (2014).
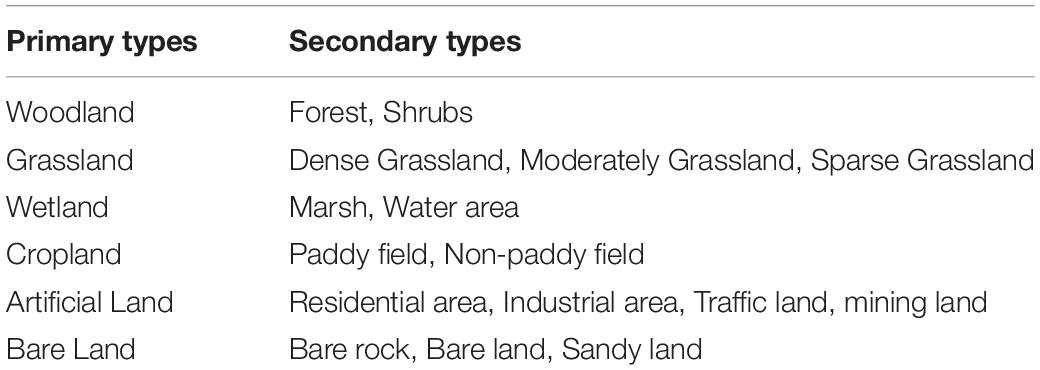
Table 1. The LULC classification system used in the HRB.
Aeolian Desertification Mapping
In the HRB, Aeolian desertification is the dominant form of land degradation. patchy or dispersed vegetation interlace with sand sheets/dune characterizes Aeolian Desertified Land (ADL); the coverage ratios of shifting sand, wind-eroded regions, and vegetation which can be measured not only by field survey but also by remote sensing data were selected as the crucial indices for deriving the severity of ADL. Based on classification criteria proposed in previous studies (Yan et al., 2009; Wang et al., 2012; Song et al., 2015), ADL intensity was classified into four levels: Slight (SL), Moderate (M), Server (S), and Extremely Severe (ES). Details of ADL classification indices are provided in Table 2.
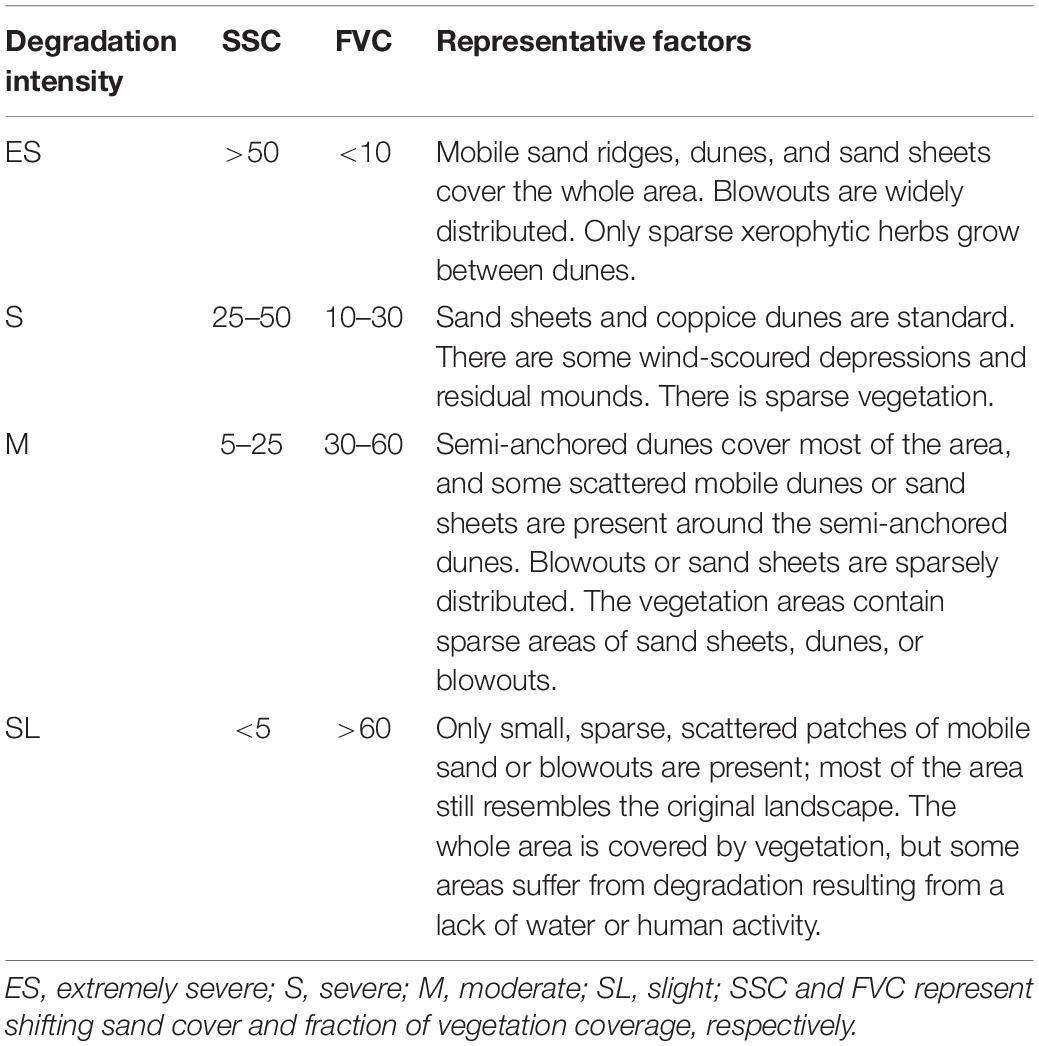
Table 2. Indices used for the classification of Aeolian desertified land in the HRB.
Because of excellent flexibility and high precision (Kang and Liu, 2014), we performed a visual interpretation method to generate the ADL status information. When interpreting, we also used TGSI (Topsoil Grain Size Index) (Xiao et al., 2006) and FVC (Fraction of Vegetation Cover) derived by using the Linear Spectral Mixture Model (Li et al., 2013) as auxiliary to identify the degree of ADL. The details of the visual interpretation method are provided in Wang et al. (2013). The spatial resolution of the ADL dataset is 30 m.
Vegetation Change Trend Monitoring
Monitoring changes in NDVI induced by land degradation has been widely employed and proven an effective method of identifying land degradation at global, regional, and national scales. In this study, we converted NDVI data into more easily understandable representations of relative greenness (RG) (Burgan and Hartford, 1993), which expresses how green each pixel currently is with the range of greenness observations for that pixel since 1990. It is calculated as:
Where,
NDVIo = mean NDVI values in each growing season.
NDVImin = minimum of mean NDVI in the growth period for that pixel between 1990 and 2015.
NDVImax = maximum of mean NDVI in the growth period for that pixel between 1990 and 2015.
Validation
To obtain the ground validation data for estimating the accuracy of the LUCC and Aeolian desertification database, a field survey was carried out in the HRB from July 20 to August 1 in 2015. Three hundred thirty-four field verification points with landscape photograph accurate positioning by GPS were obtained to assess its accuracy, and coverage photographs obtained with fisheye lenses from 69 samples were used to evaluate the accuracy of FVC calculated by remote sensing. We evaluated the accuracy of the LULC database and the ADL database by combined field verification points and random sampling methods. The results show that the total accuracy of LULC and ADL is more than 95%, the classification performance is satisfactory. Moreover, a significant correlation exists between the measured values and calculated values of FVC (Figure 2).
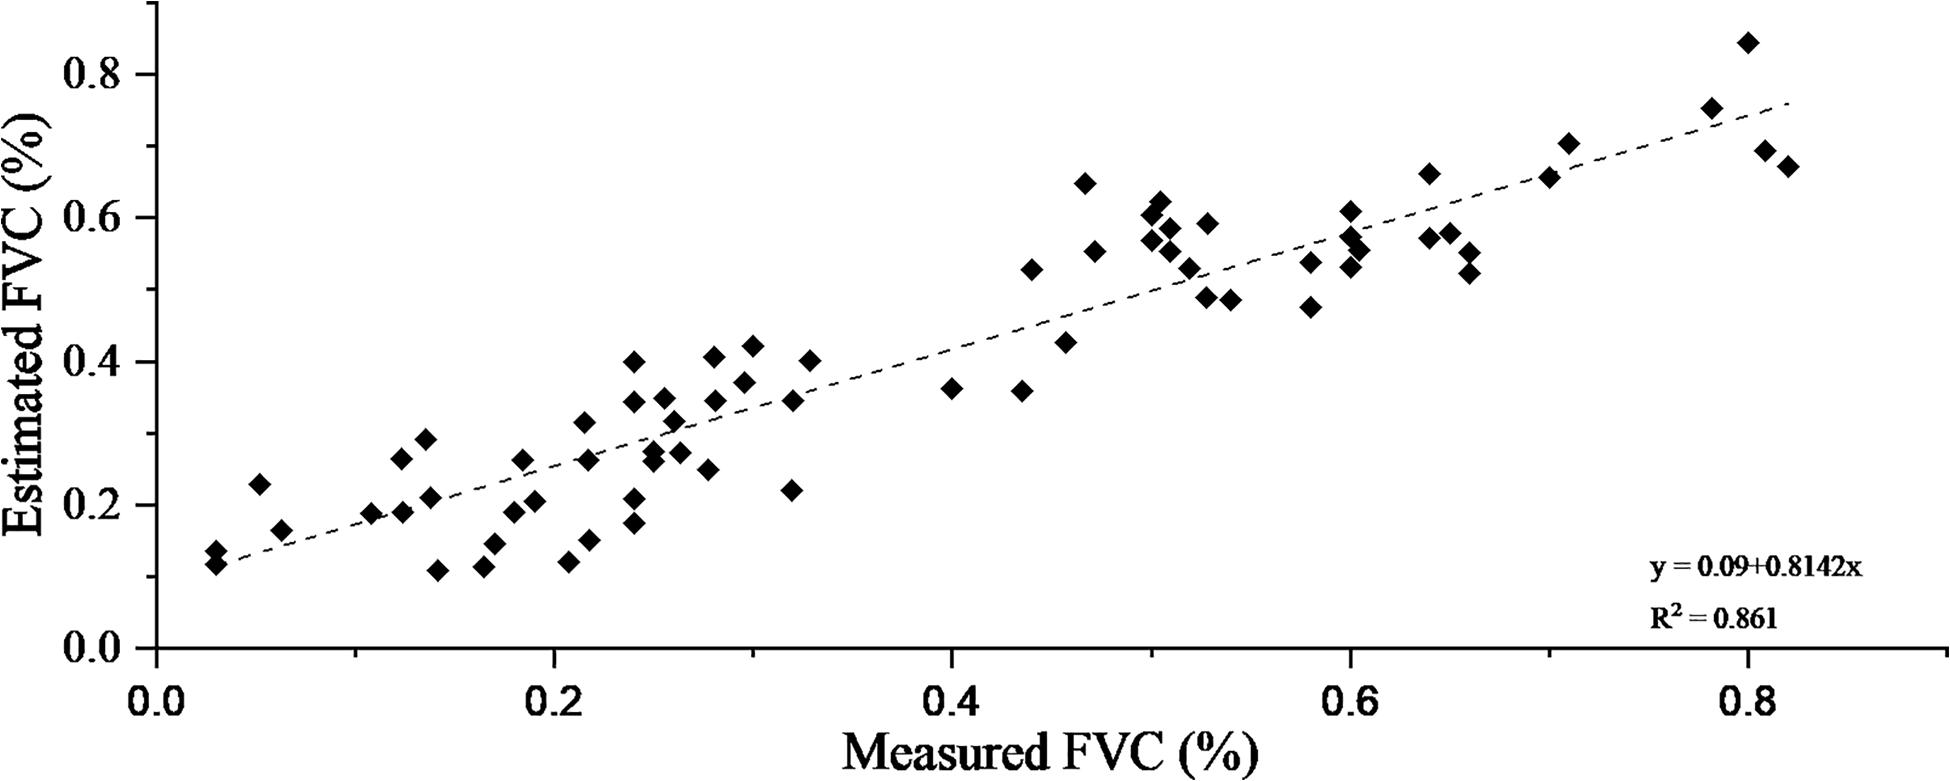
Figure 2. Scatter plot correlation between the field-measured and LSMM-estimated vegetation fraction in 2015.
Results
Characteristic of LULC Change in 1990–2015
The status of LULC in 2015 is shown in Figure 3. As a result of economic development, changes in the LULC mainly occurred around the oasis in the midstream of the HRB; fewer changes appeared in the upstream, and the downstream only occurred in wetlands surrounding riverbanks and the Ejina oasis. In 1990, bare land was the most significant percentage of the land area throughout the study period, which covered 89.22% of total area (Table 3). Although analysis of six time periods (1990–1995–2000–2005–2010–2015) revealed the continuous decline of bare land, it is also the dominant land use type in the HRB. Over the entire study period, the coverage of cropland, forest, shrubs, water area, marsh, and artificial land increased by 28.60, 1.41, 5.92, 36.53, 10.32, and 99.15%, respectively, while grassland and bare land declined by 0.48 and 1.05%, respectively.
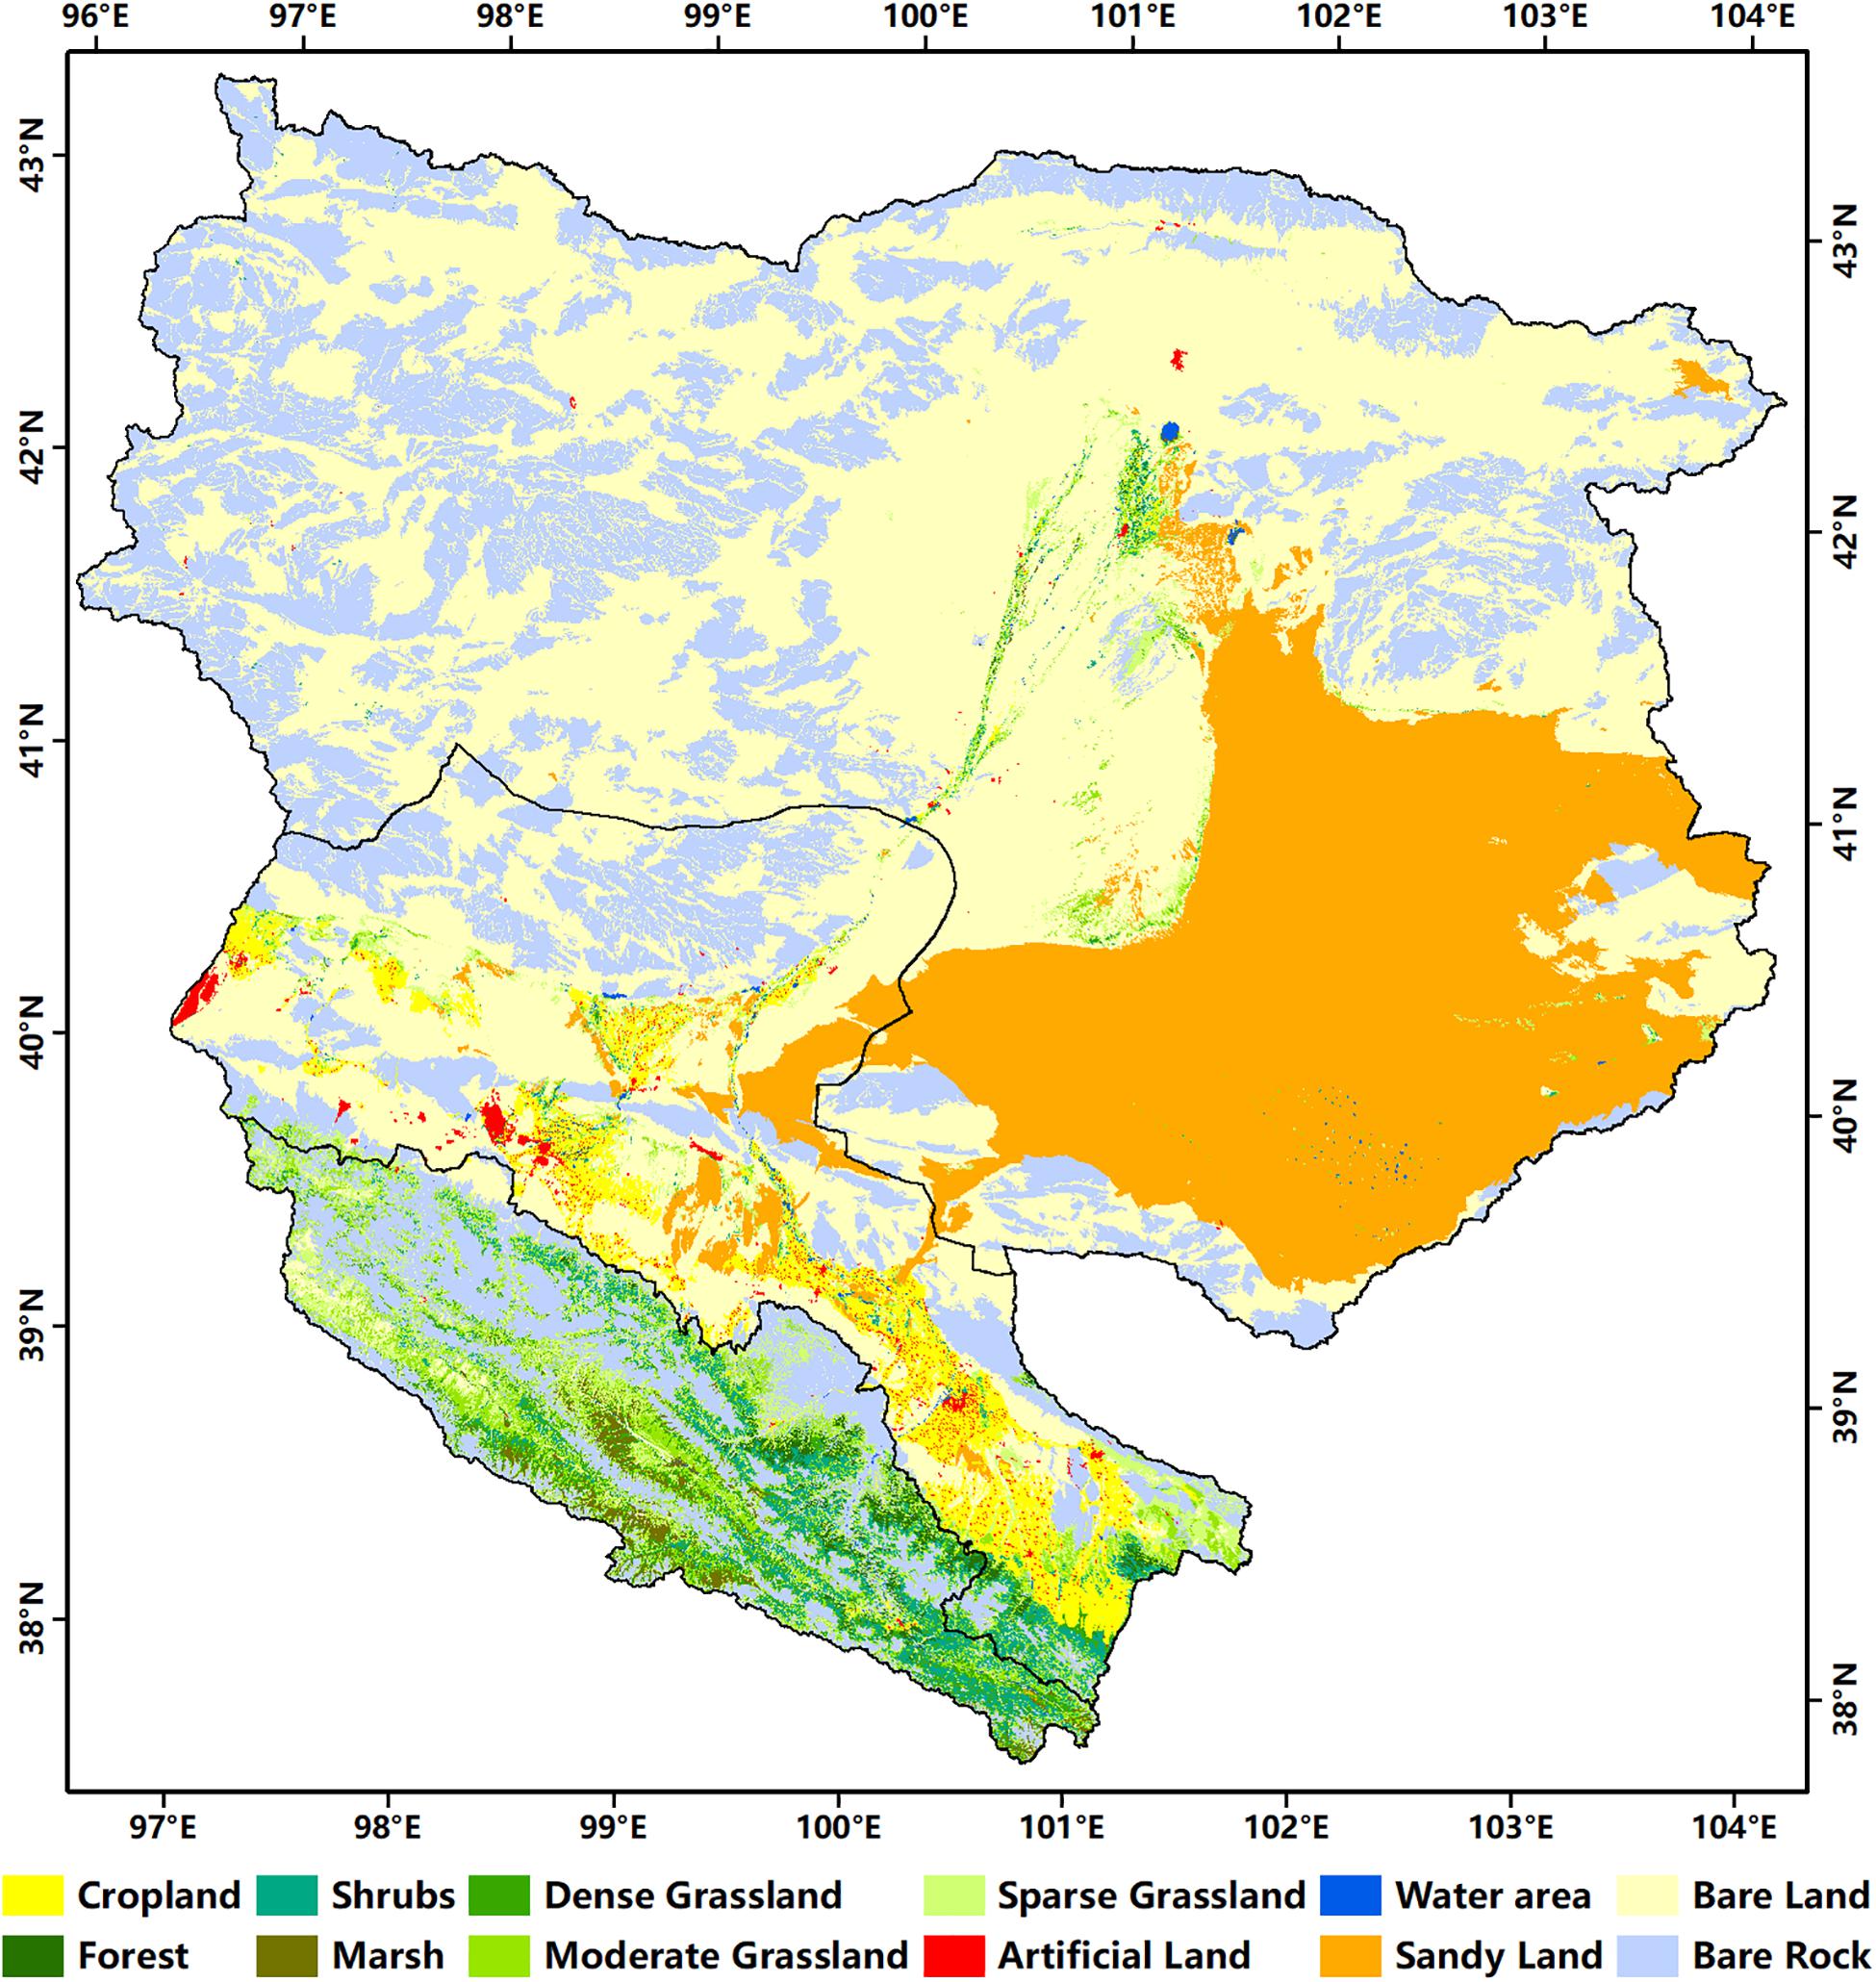
Figure 3. Map of LULC in the HRB in 2015.
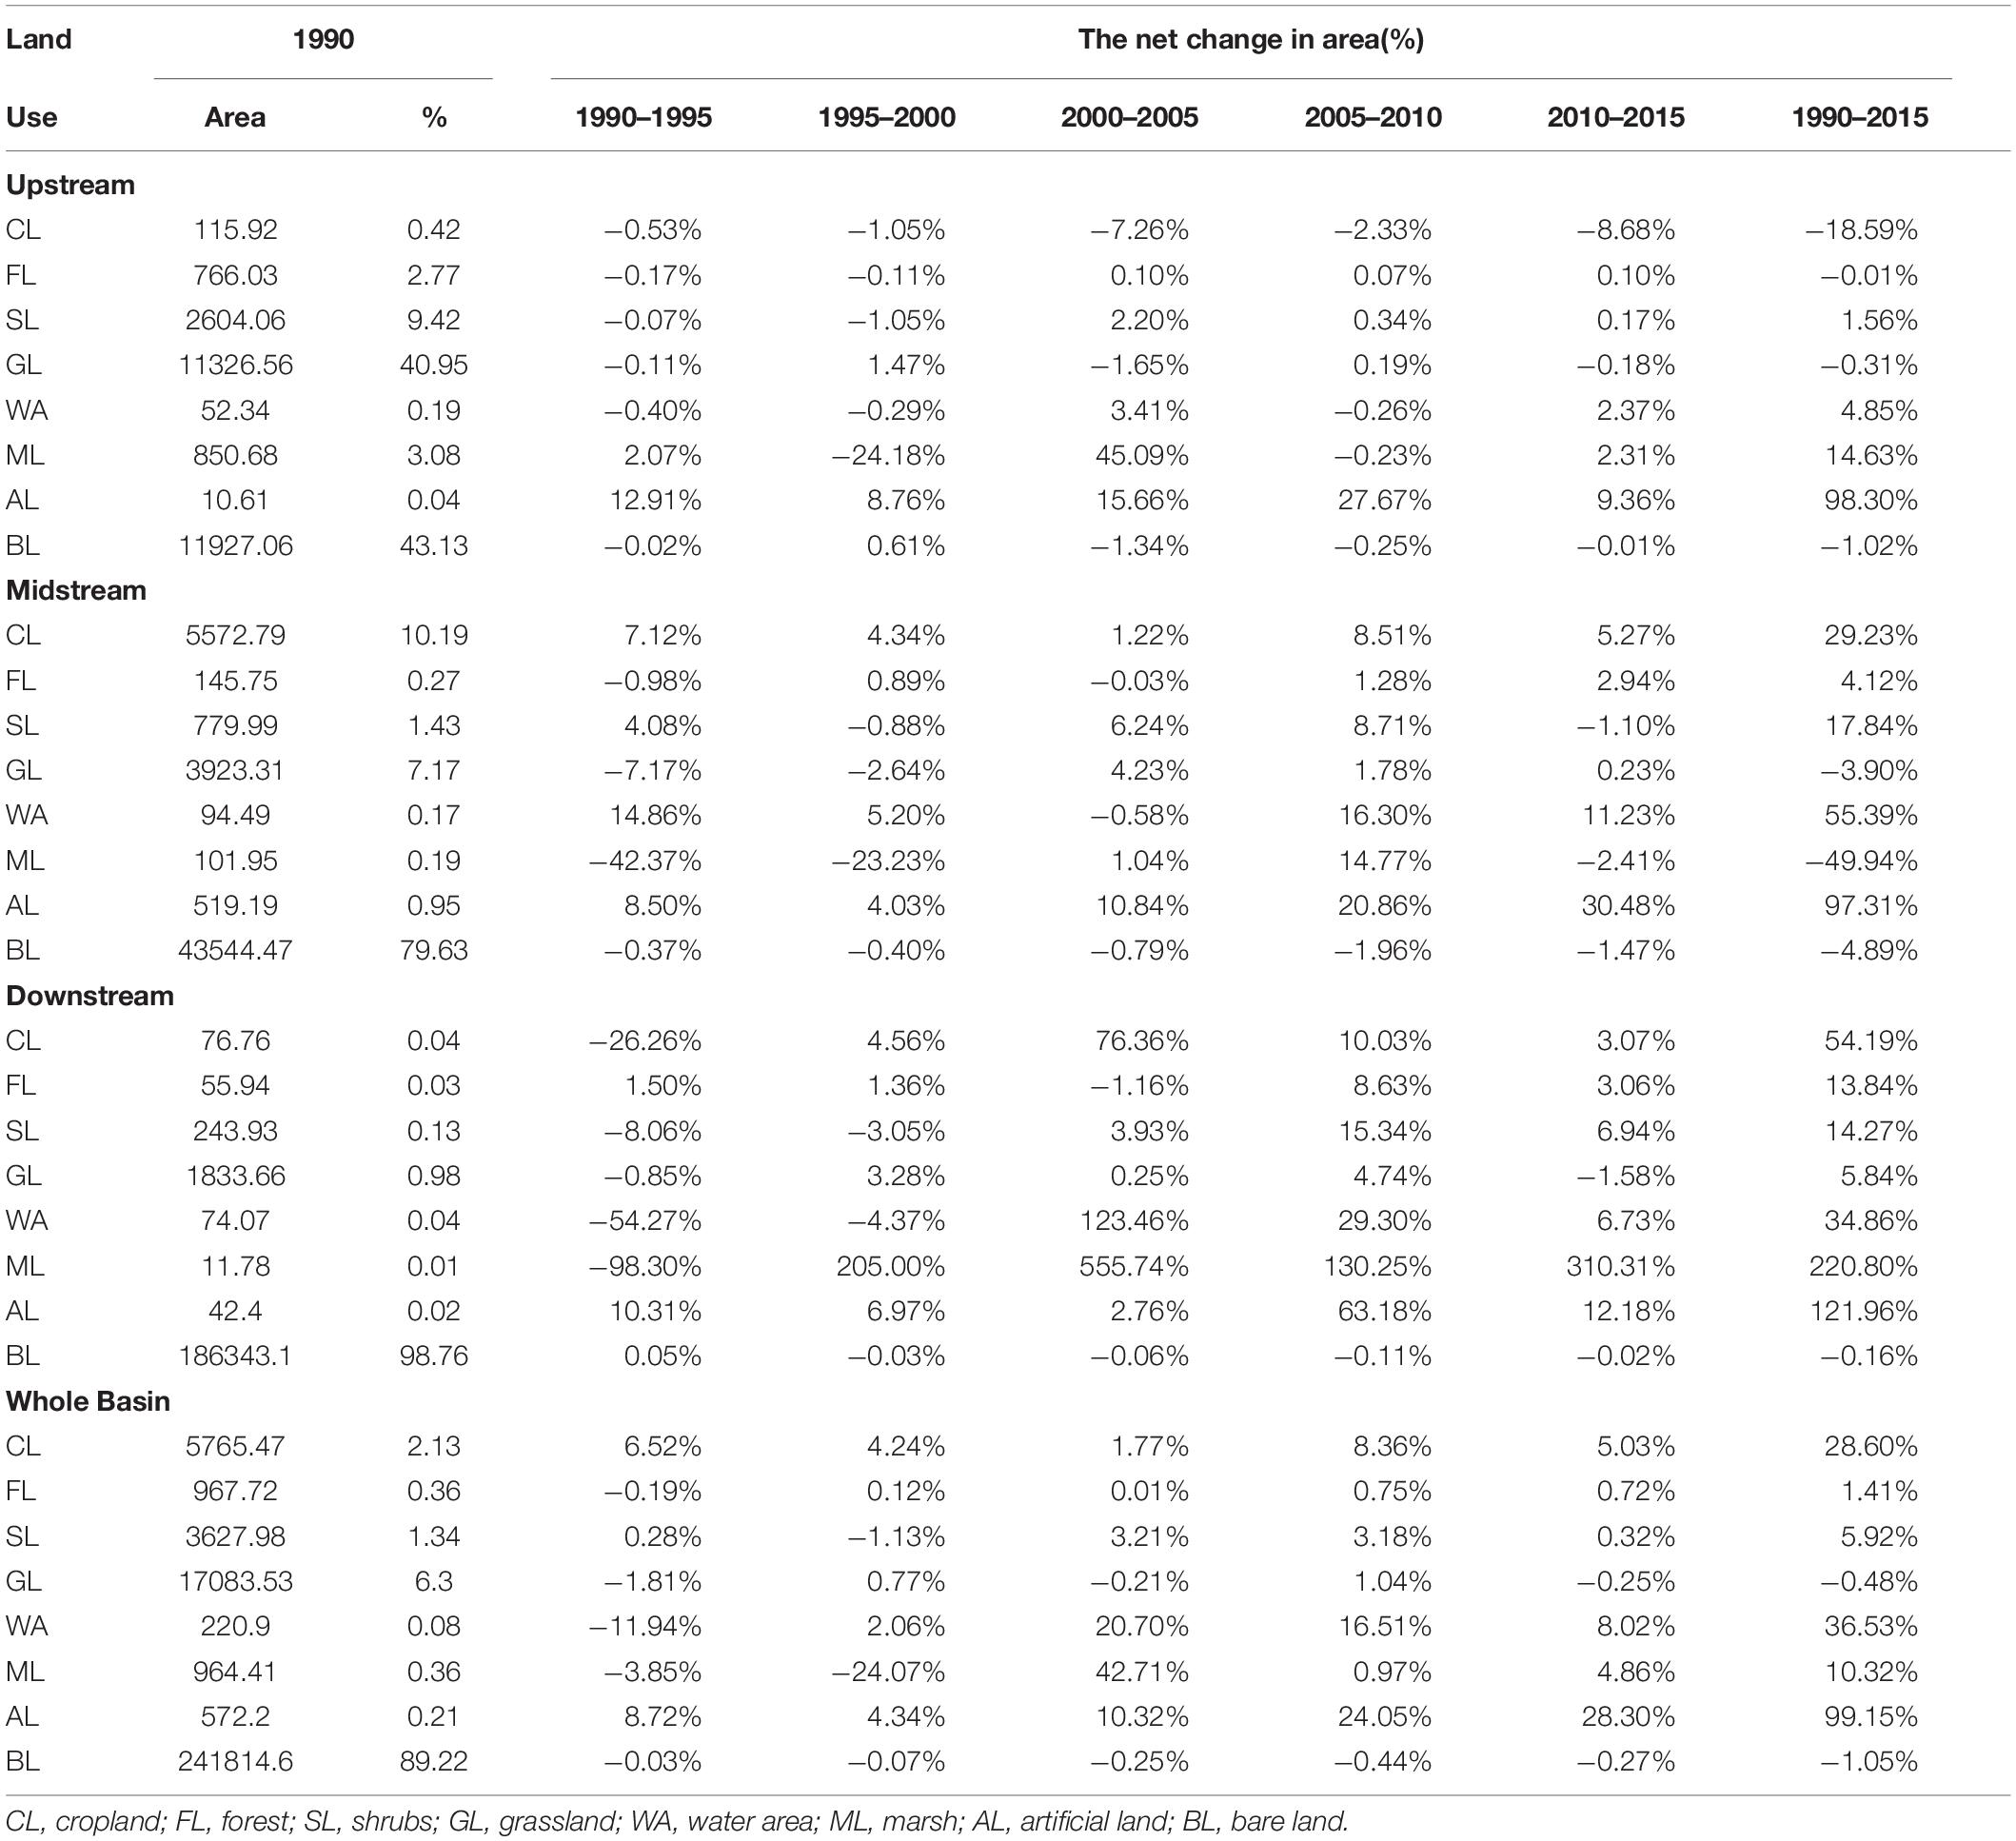
Table 3. The area of LULC classes for 1990 and net change of five periods in the HRB (km2, %).
To evaluate the land degradation process, we classify the conversion between LULC types into two categories by using the transfer matrix. Among them, the land degradation process included a decrease of grassland coverage, grassland turned into bare land, and forest, shrubs, water area, and marsh turned into grassland or bare land; land restoration process included an increase of grassland coverage, bare land turned into grassland, water area, forest and shrubs, and grassland turned into the marsh, forest, and shrubs. Figure 4 shows the trend of land degradation in the whole basin and each part of the HRB. From the entire basin, the land degradation process was dominant from 1990 to 2000. But since 2000, the land restoration process has changed into the leading process, and land restoration area continued to decrease after reaching its maximum in 2005. Viewed from different parts of the HRB, although the overall trend of degradation and restoration is the same as the whole basin, each part of the basin has its characteristics. Land degradation dominated in the upstream and midstream occurred mainly between 1995 and 2000. However, land degradation in the downstream primarily occurred between 1990 and 1995, but land restoration began to appear since 1995 and became the dominant process until 2000. After land restoration dominated, the midstream and downstream recovered fastest from 2005 to 2010, while the upstream recovered most quickly from 2000 to 2005.
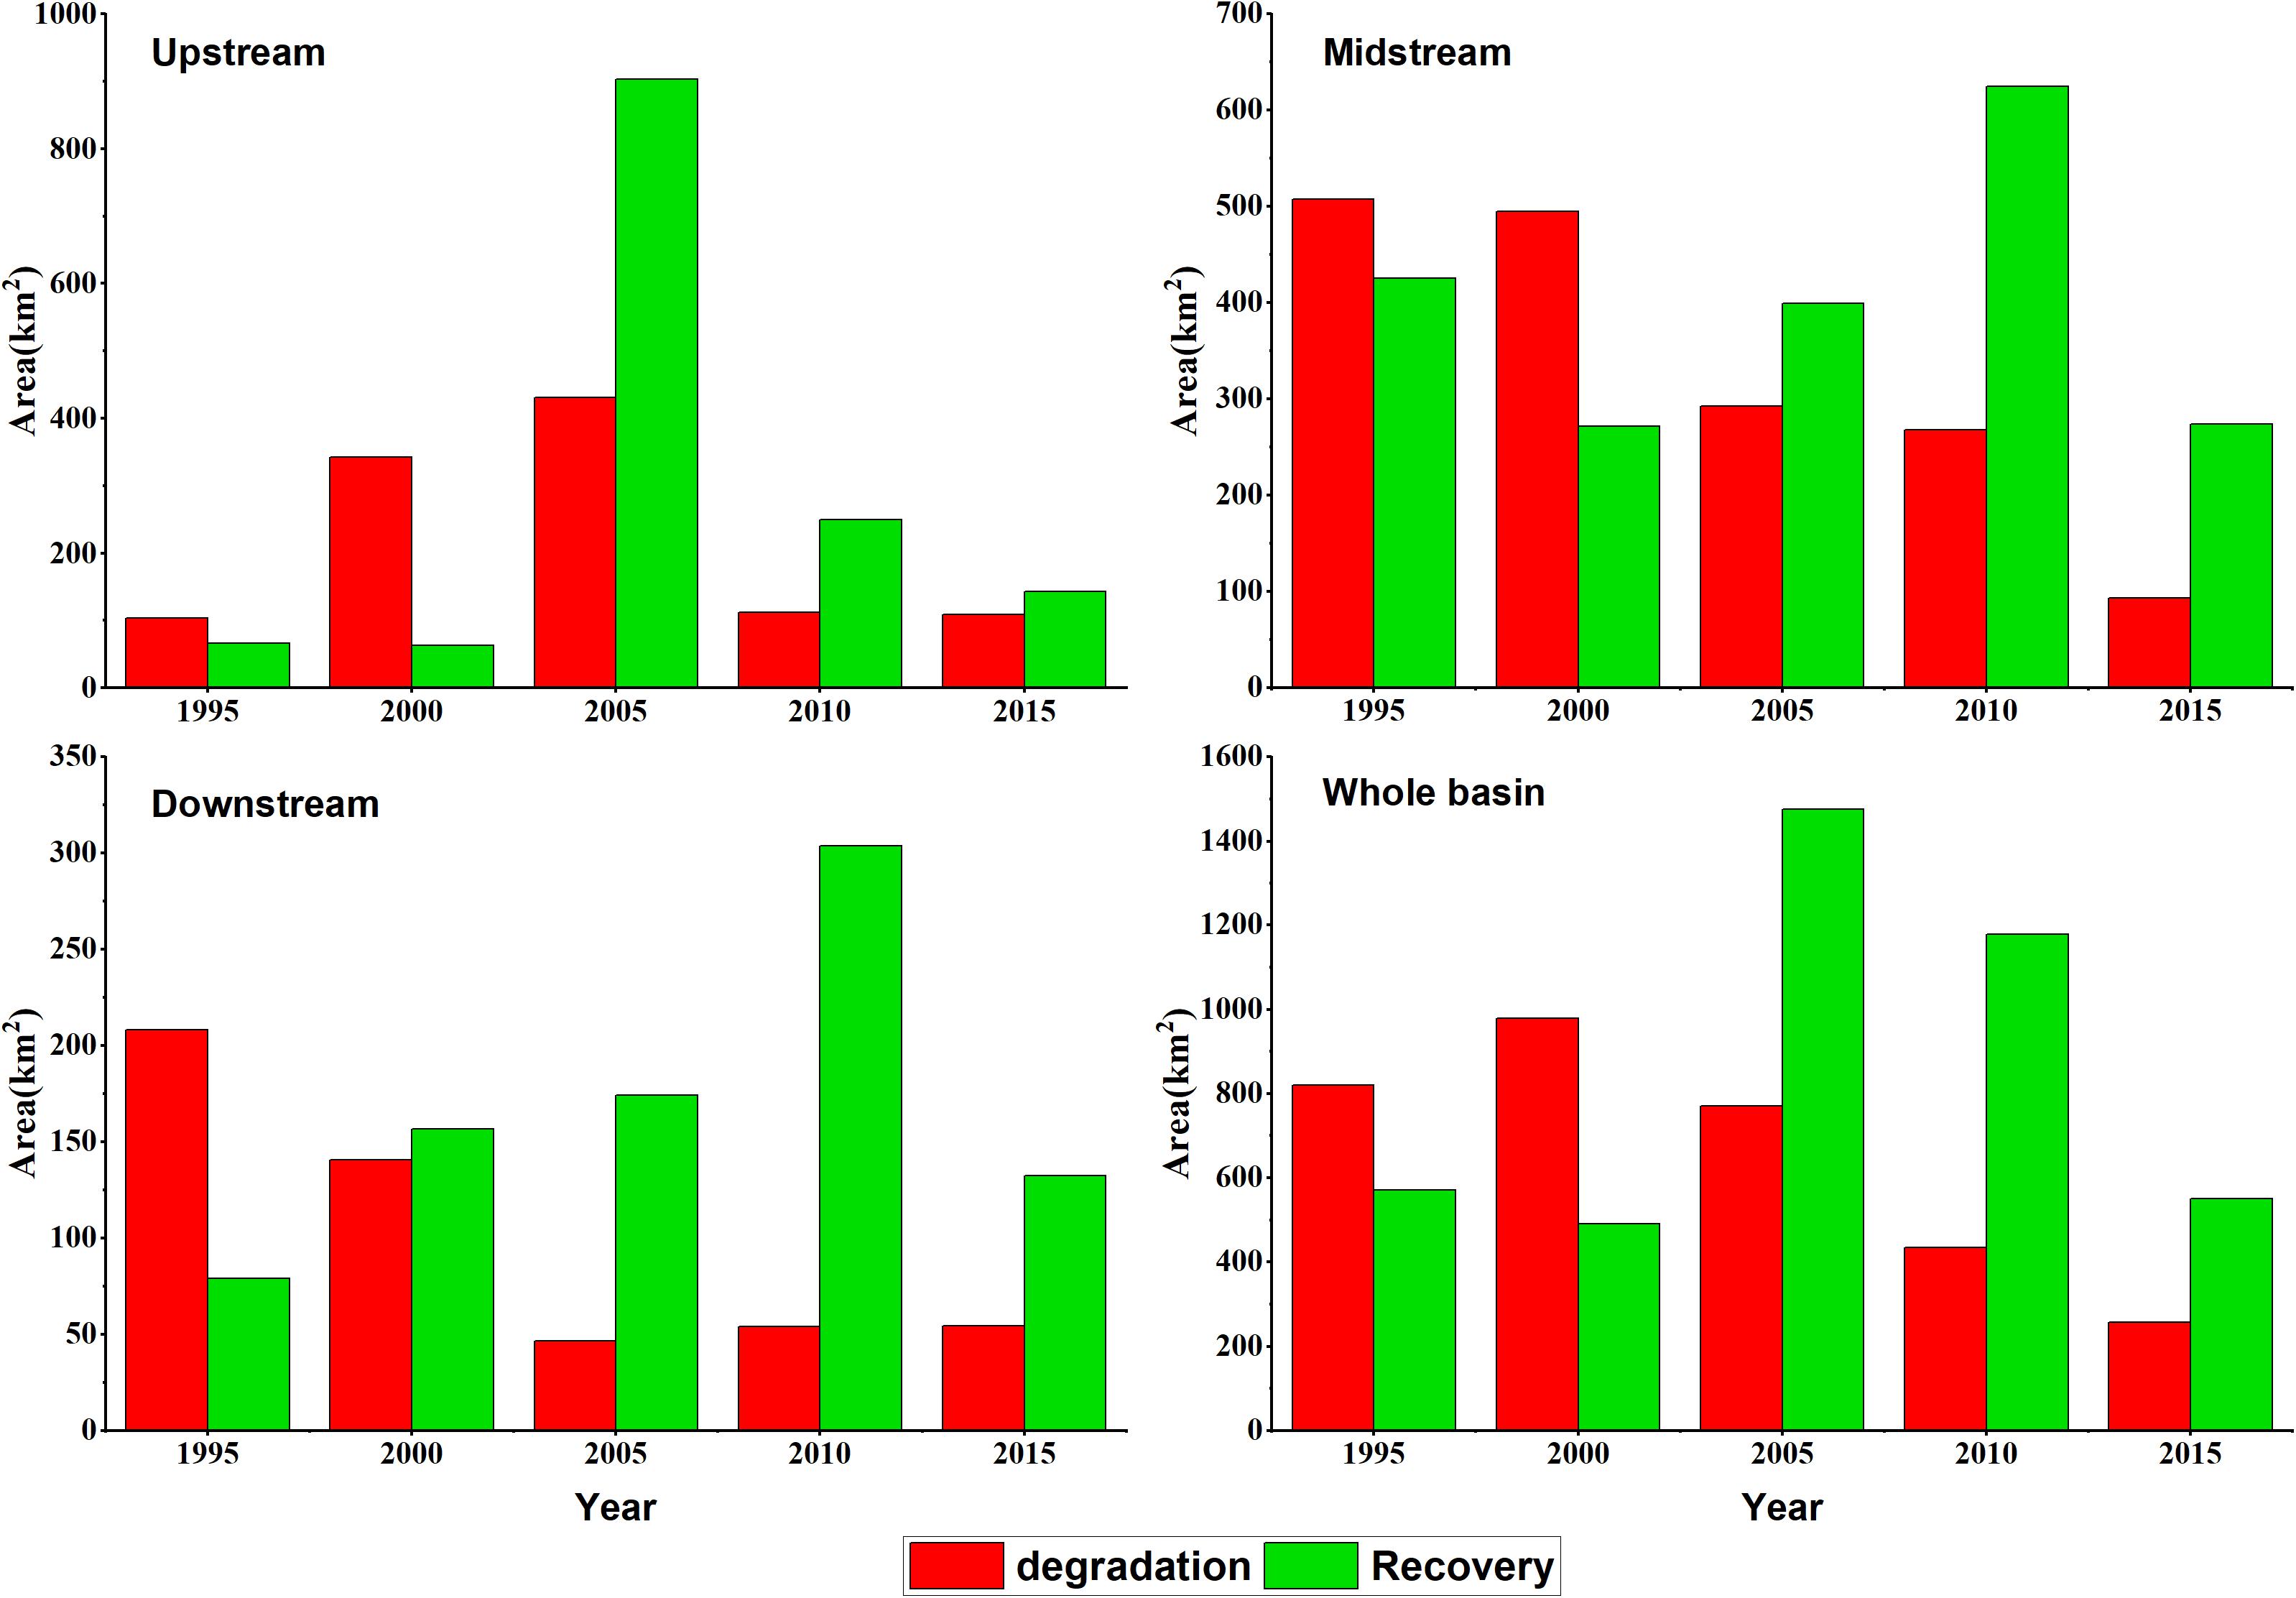
Figure 4. The trend of land degradation process extracted from LULC change in the HRB during 1990–2015.
Aeolian Desertification Dynamics
Figure 5 shows the temporal and spatial distribution of ADL in the HRB. Although there was no significant change in the overall location of ADL, the severity of ADL did change over time. The ADL was centrally distributed in areas adjacent to the oasis, areas of sparse vegetation along the river, and areas of the western edge of the Badain Jaran Desert. In 2015 (Table 4), ADL covered 11,983.99 km2, amounting for 4.42% of the total area. Most ADLs were classified as ES and S (34.10%, 43.38% respectively), with a smaller proportion classified as M and SL (12.54%, 9.98%, respectively). ES and S ADL were concentrated and mainly distributed in the Ejina, Gaotai, Jinta, and Yumen. Slight and moderate desertified land was fragmented and mostly in the Suzhou, Linze, Ganzhou, and Minle areas. The ADL in the midstream of the HRB jeopardizes the stability and development of these vital oasis agricultural areas.
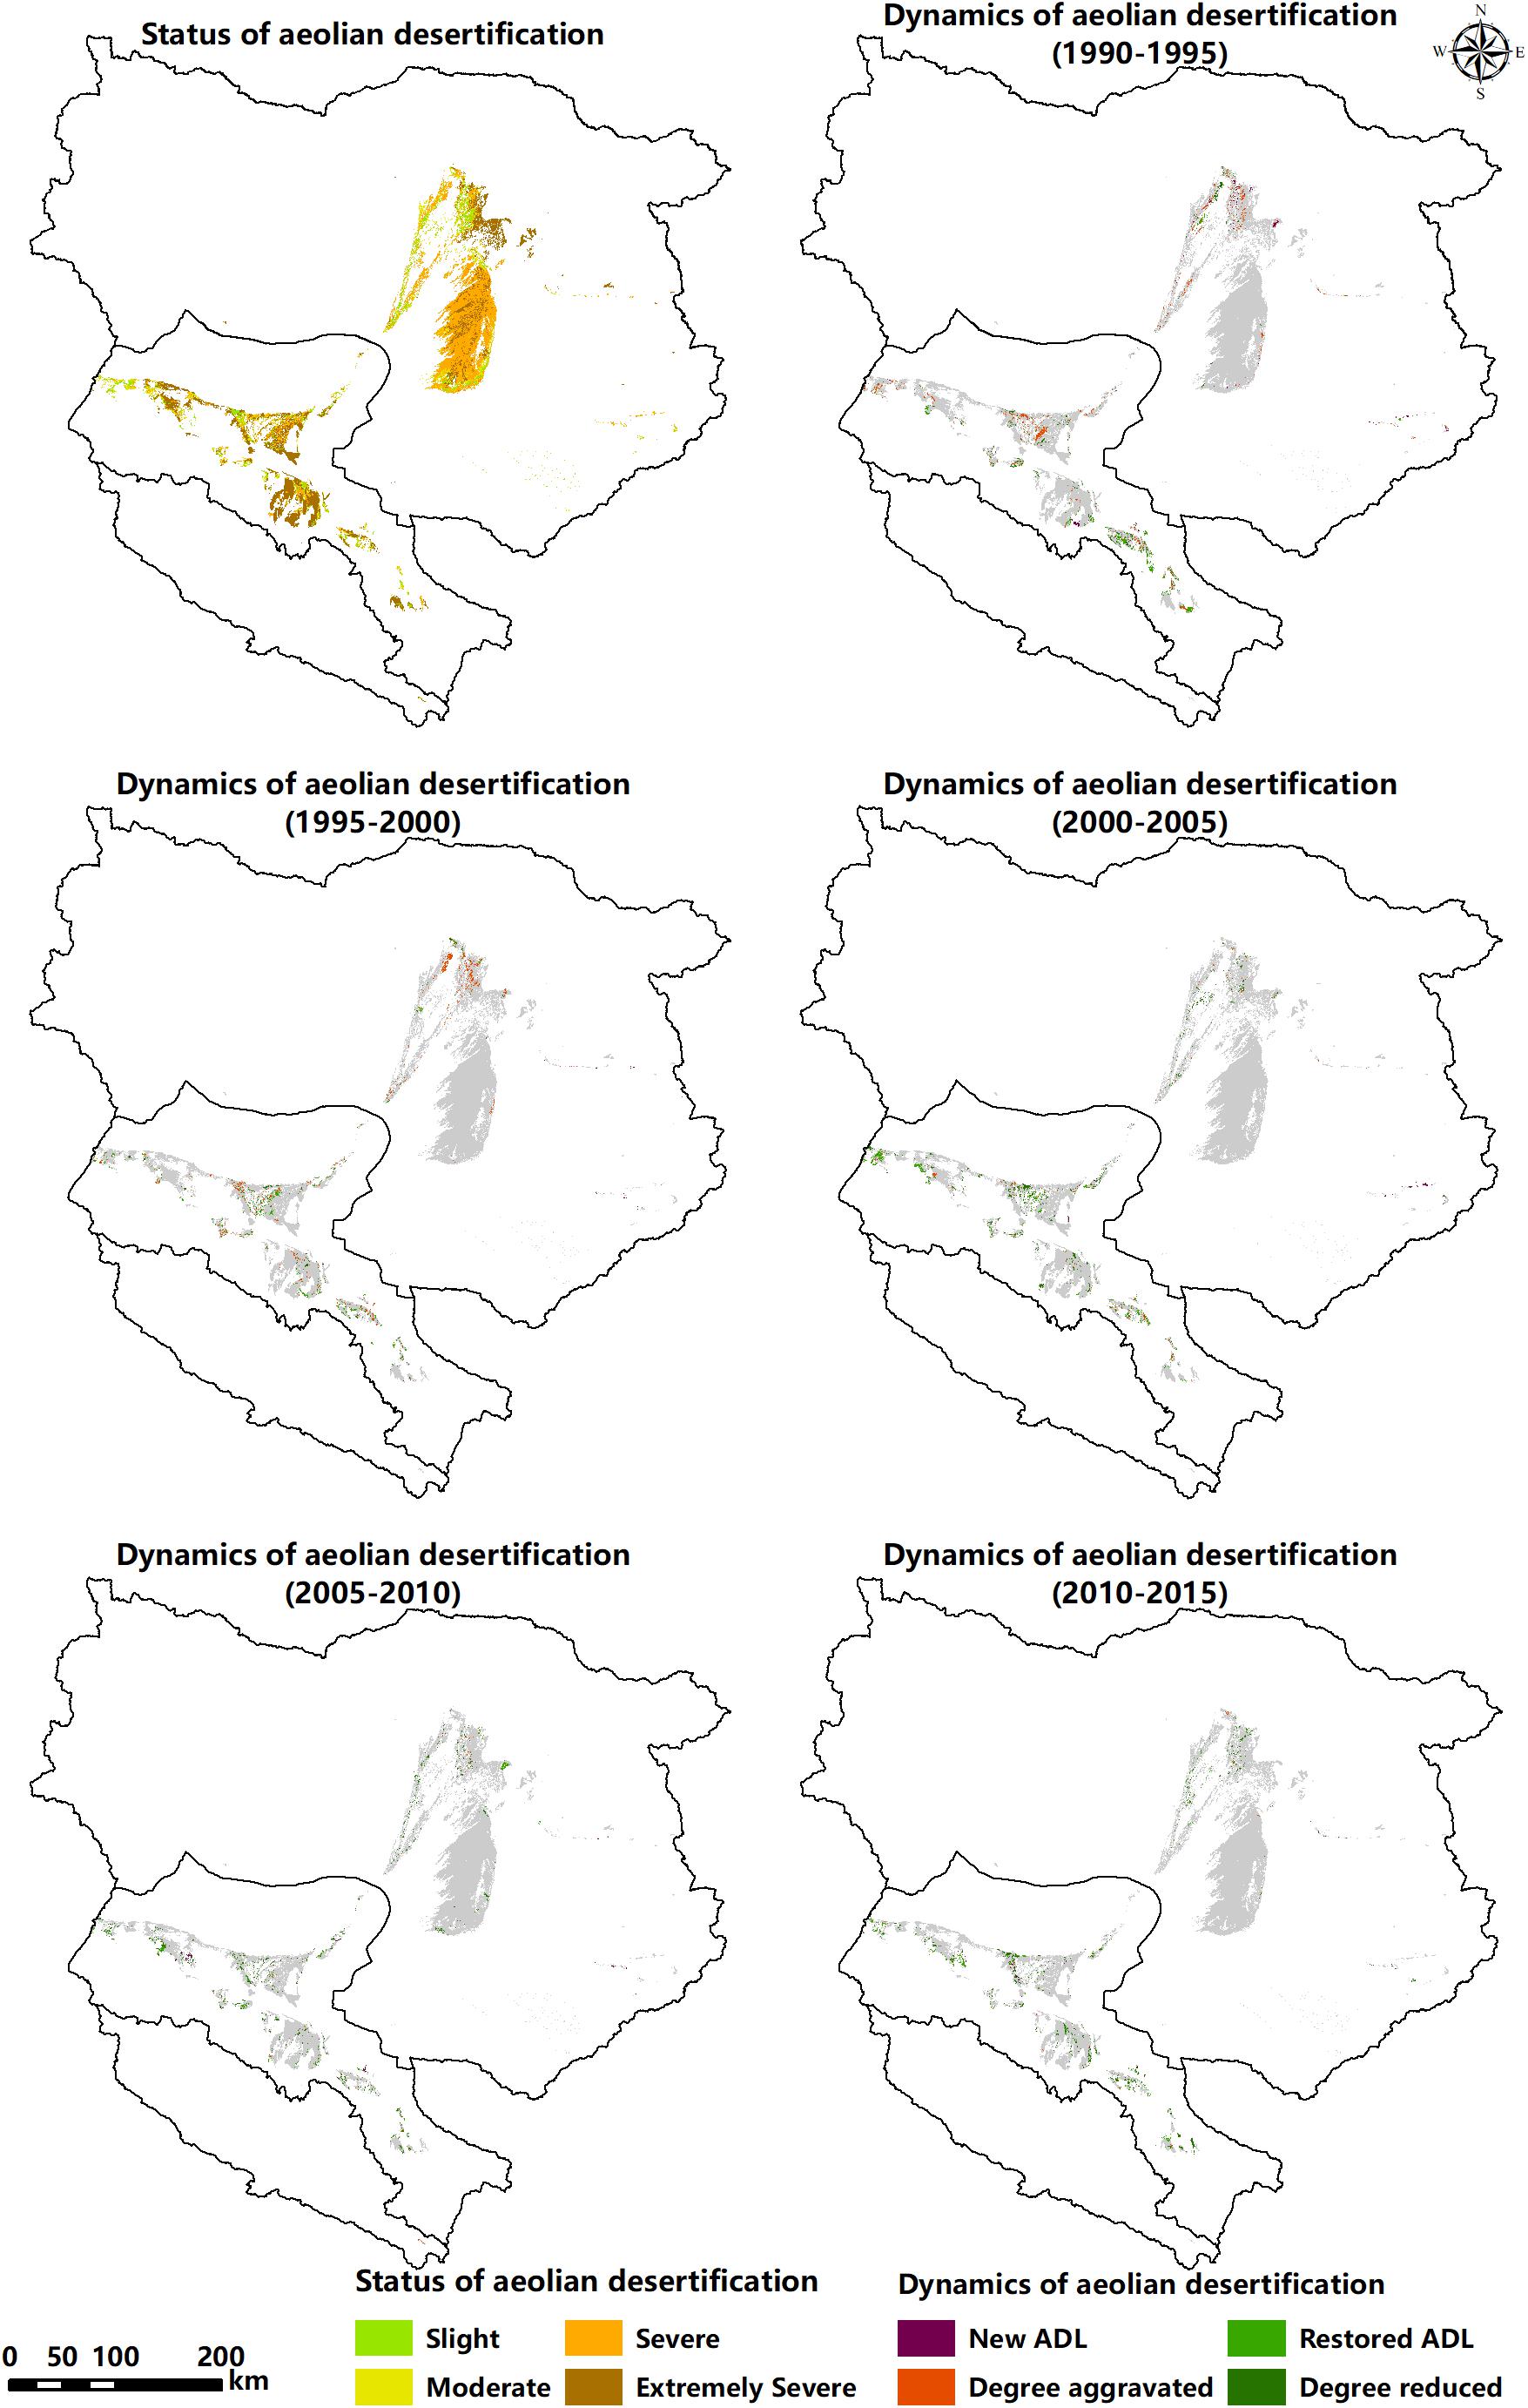
Figure 5. Aeolian desertification monitoring results in the HRB during 1990–2015.
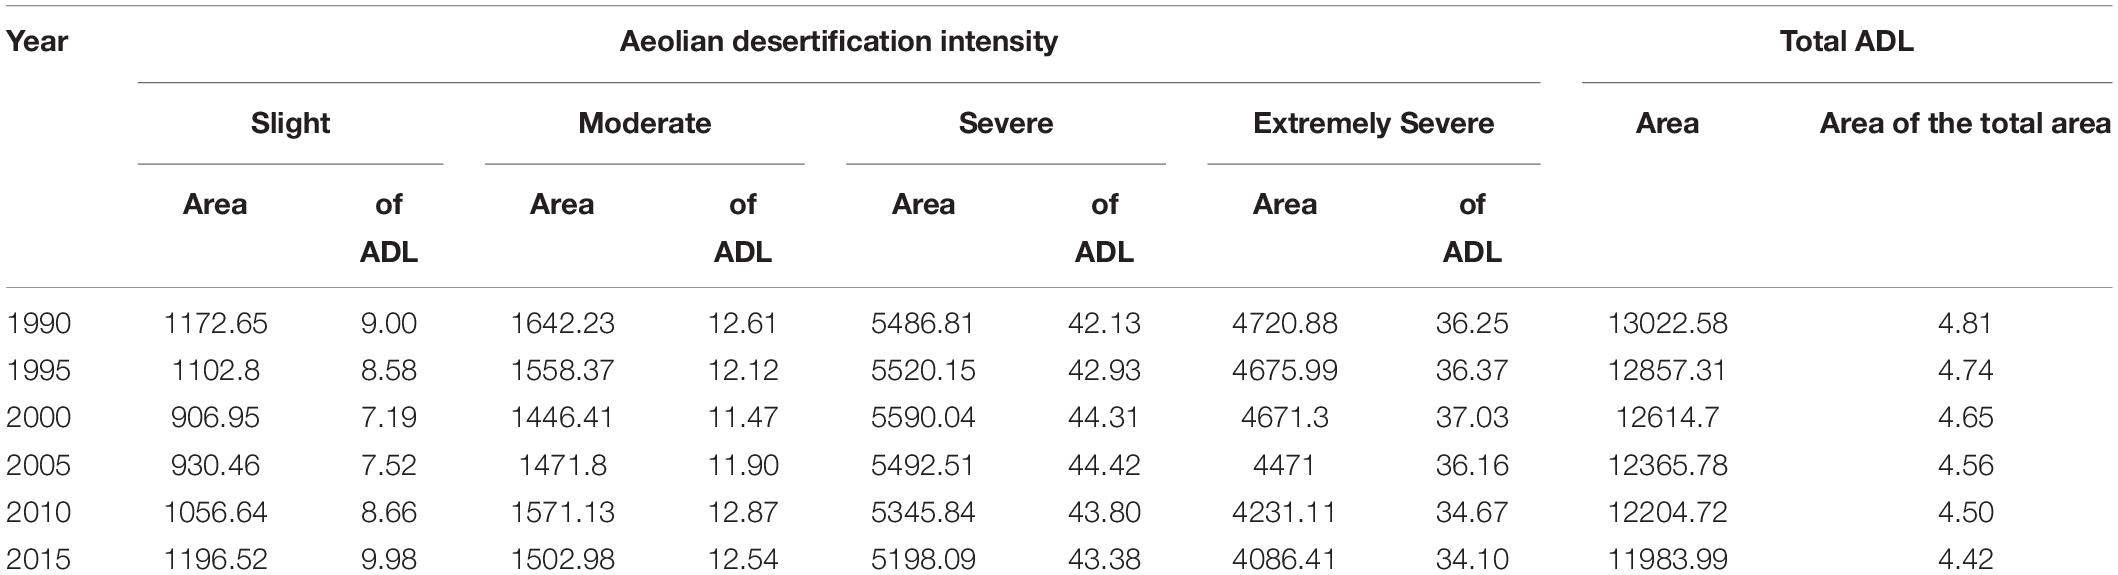
Table 4. The changes in the severity of ADL from 1990 to 2015 in the HRB (km2, %).
From 1990 to 2015, ADL in the HRB declined by 1,038.59 km2, which is equal to 7.97% of the total ADL in 1990, representing a linear decrease of 64.91 km2y–1. To analyze the trends of Aeolian desertification, we classified area expansion and degree increase of ADL as desertification development, and area reduction and degree decrease of ADL as desertification recovery, by using the transition matrix (Figure 6). From 1990 to 2000, the area of ADL has shown a decreasing trend, but the degree of ADL is aggravated. Therefore, the direction of desertification in the HRB is still a desertification development in this period. From 2000 to 2015, the trend of desertification in the HRB is reversed, which shows not only a decrease of degree but also a reduction of area of ADL. In the midstream, the reason for the reversal of desertification is that it expands the area of ADL which is much smaller than the reduced area of ADL between 1990 and 2000. After 2000, the reversal of desertification is mainly due to the reduction of desertification degrees. In the downstream, the change of desertification degree is the main factor determining the direction of the desertification process. When inflow reduced (1990–2000), vegetation coverage decreased so that desertification presents a trend of development. On the contrary, desertification tends to reverse (2000–2015).
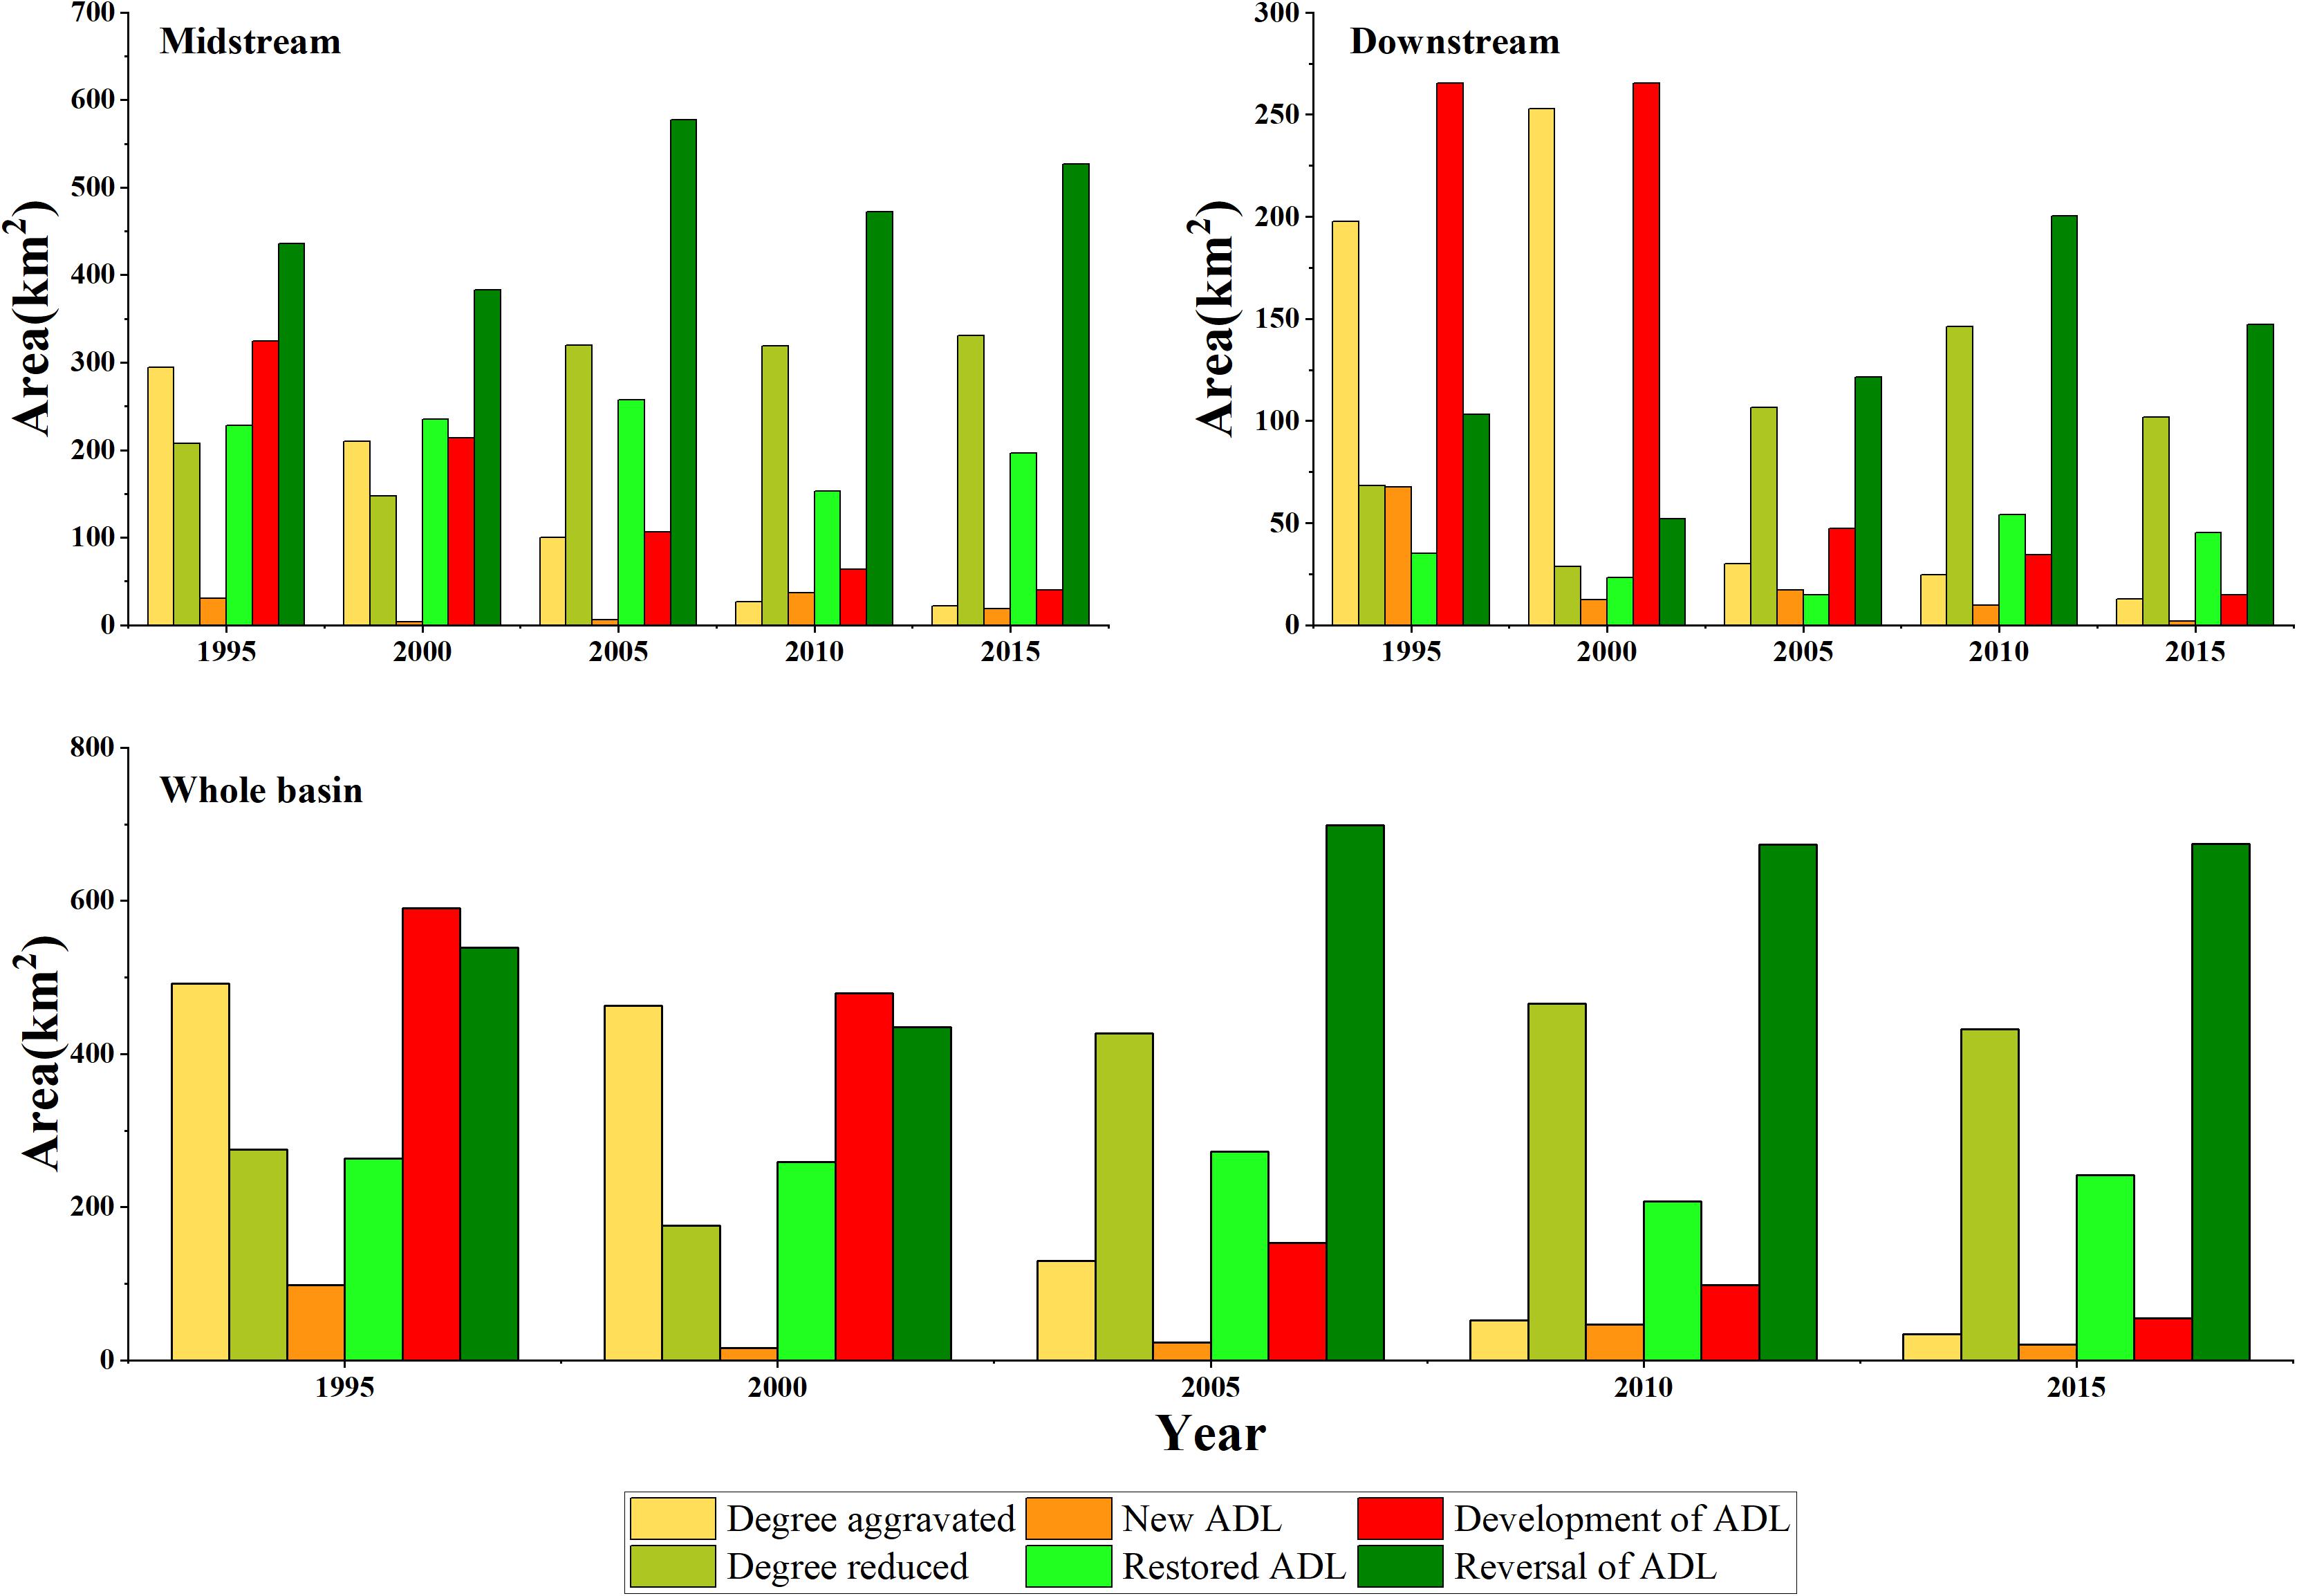
Figure 6. The trend of Aeolian desertification process in the HRB during 1990–2015.
Vegetation Trend
In the arid and semi-arid areas, vegetation is positively generally correlated with precipitation. Therefore, the driving factors of vegetation change can be better explained by combining precipitation change with vegetation trends. Figures 7, 8 show the RG (from 1990 to 2015), precipitation, and its change trend (from 1975 to 2015), respectively. Different trend changes are observed in the different parts of the HRB. In the upstream, the precipitation showed an increasing linear trend with a rate of 1.1 mm/year, which indicated a more wet trend from the last 4 decades, while vegetation also changed from relatively worse to relatively better from 1990 to 2015. Notably, the most massive precipitation appeared in 1998, the plant also was best. In the midstream, worse vegetation areas mainly occurred in oasis agricultural areas and the Shandan County from 1990 to 2001, attributed to less precipitation. However, the natural vegetation around the oasis shows a relatively good trend, which might be due to the increase of groundwater level caused by the rise of irrigation water in the oasis because of drought. From 2002 to 2015, with the rise in precipitation and the implementation of environmental protection projects, vegetation continued to recover in most areas, and the plant was in a relatively better stage, but vegetation around the oasis gradually disappeared. In the downstream, although there is no significant change trend in precipitation, the precipitation in the period from 1990 to 2000 is more than that in the period from 2001 to 2015. However, vegetation change is contrary to precipitation trend, and the vegetation is worse in the period of more precipitation, but better in the period with less precipitation.
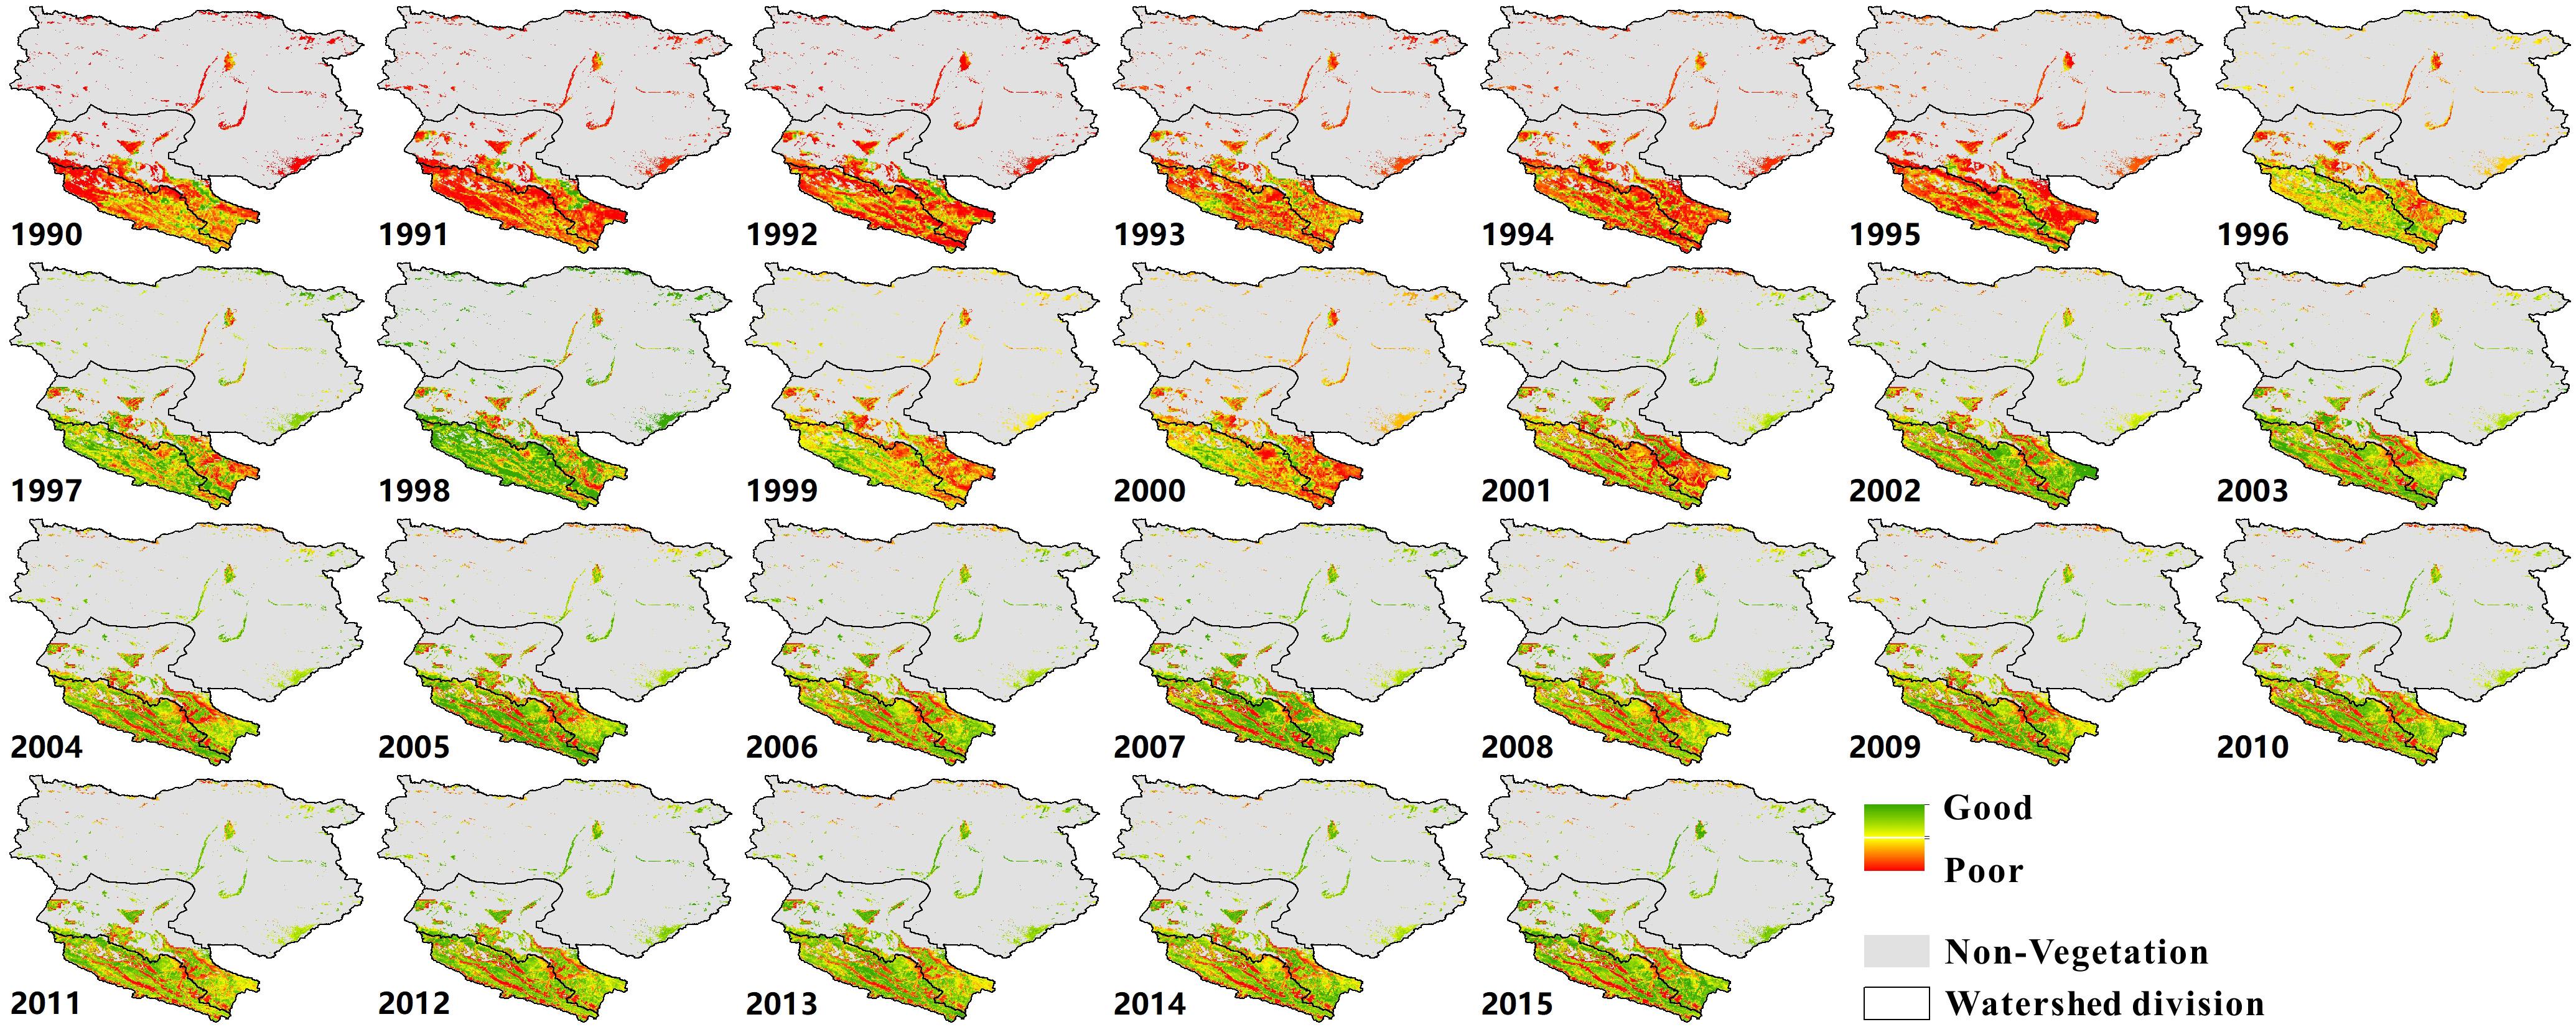
Figure 7. The relative greenness maps portray vegetation greenness in the HRB during 1990–2015.
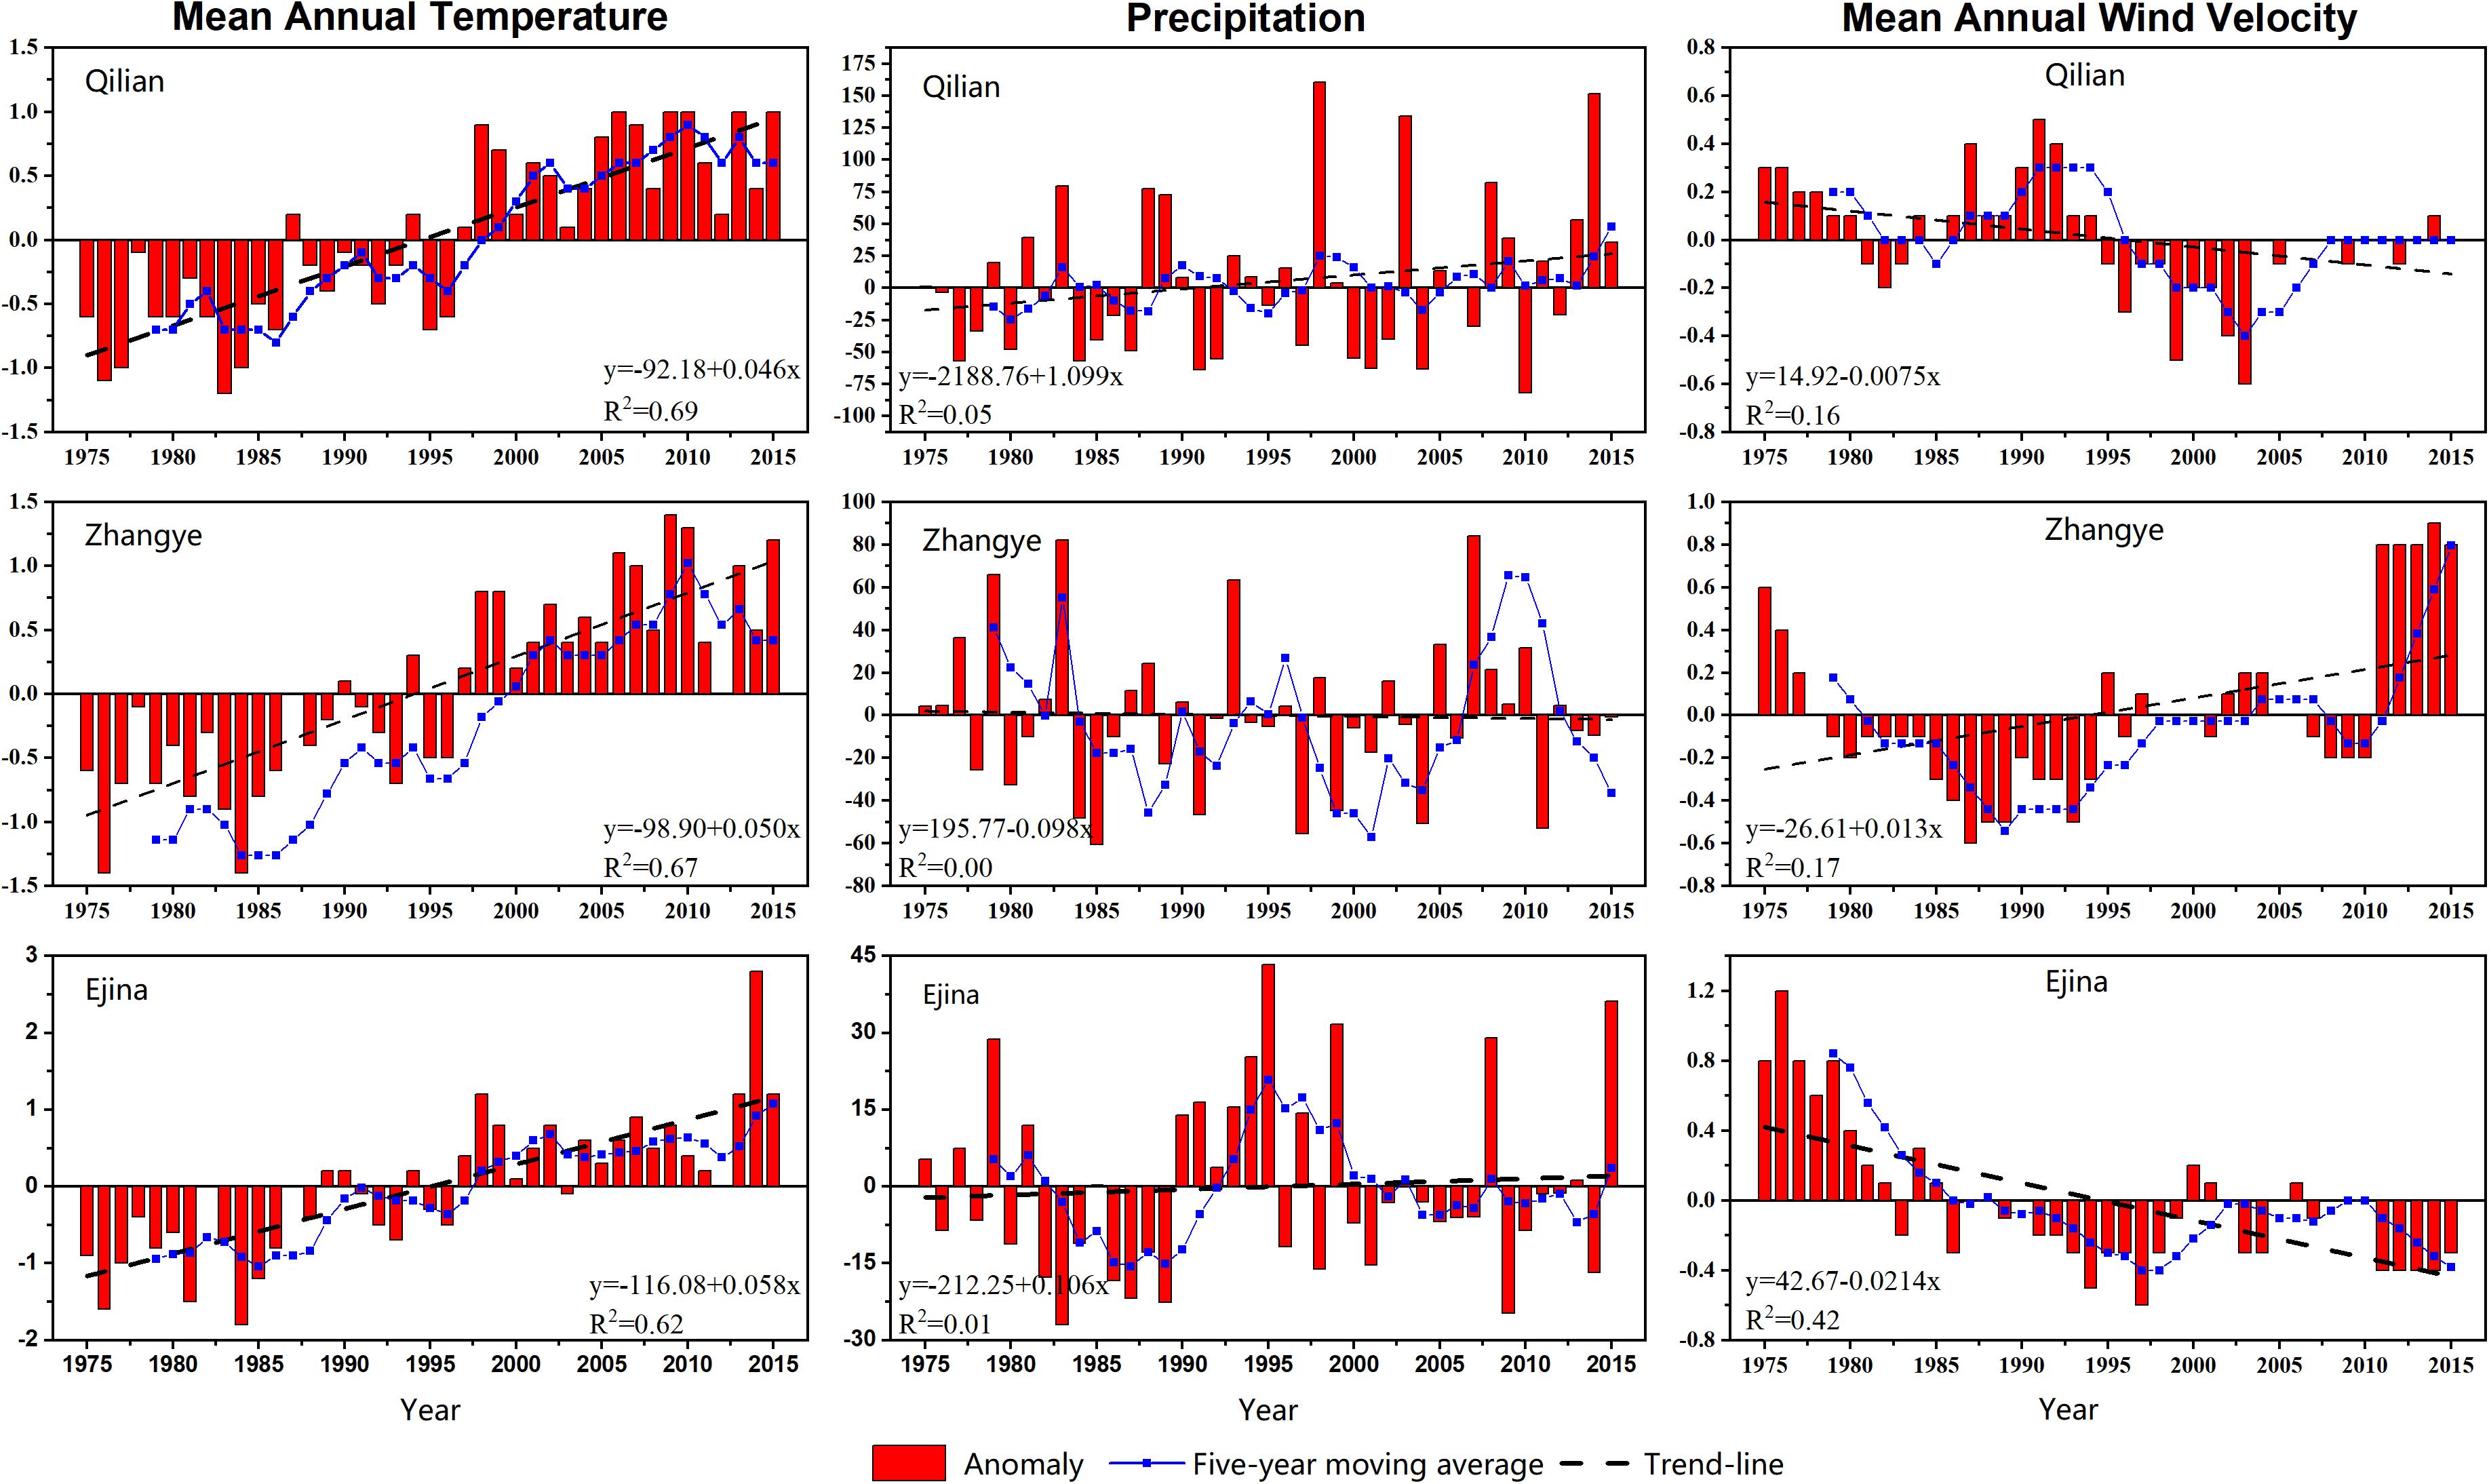
Figure 8. Change in annual temperature, precipitation, and mean wind velocity in the HRB from 1975 to 2015.
Discussion
Natural factors and human activities were the two critical driving forces behind the land degradation process and could both influence land degradation on the regional scale (Dawelbait and Morari, 2012). In this study, we analyzed the driving factors behind the positive and negative process of land degradation from the changes in temperature, precipitation, wind speed, population, cultivated land, livestock, and water use patterns in the HRB.
Effects of Climate Variation on Land Degradation
In this study, because the HRB contains three distinct geographic units, the annual mean temperature, precipitation, and annual mean wind velocity data recorded at Qilian, Zhangye, and Ejina meteorological stations covering the period from 1975 to 2015 in the different parts of the HRB have been selected. Those meteorological data showed the climatic change in the upstream, midstream, and downstream of the HRB, respectively. Furthermore, deviation, 5-year moving average, and linear trend of the relevant variables have been calculated to analyze the climatic variation and the drivers of land degradation (Figure 8).
In the upstream of the HRB, the annual mean temperature and precipitation show a significant increasing trend, and the annual mean temperature growth rate was 0.046°C/year. In the upstream, increasing temperature eased thermal constraints on vegetation growth, which was conducive to vegetation growth. Meanwhile, increased precipitation contributes to vegetation growth also. But some scholars considered that increasing temperature is a critical climatic factor responsible for land degradation in cold, high-altitude regions (Xue et al., 2009). As rapidly growing temperature warmed the upper permafrost layers, a large area of permafrost was thawing and even disappeared in some regions, which has decreased water content in vegetation root zone and has led to changes in soil structure and composition. All these changes were the main factor in the degradation of the high cold meadow and swamp meadow (Wang and Cheng, 1999), which is also a significant factor in land degradation from 1995 to 2000 (a dry period, Figure 8) in the upstream of the HRB. Therefore, taken together, the process of land degradation is consistent with climate change. This indicates that climate change is the dominant driving factor in land degradation in the upstream of the HRB.
In the midstream and downstream of the HRB, the annual mean temperature also shows a significant increasing trend with a growth rate of more than 0.05°C/year. Every degree of temperature rise can increase potential evapotranspiration by approximately 75 mm/year (Le Houérou, 1996). Thus, a higher temperature could result in increasing topsoil evapotranspiration and decreasing topsoil moisture content. Meanwhile, precipitation not only did not show a significant increasing trend but also showed a slight decrease trend in the midstream of the HRB, which increased the arid conditions of the region. During the study period, the overall aridity of the climate increase attributed to temperature steadily increased while precipitation was not changed throughout the midstream and downstream of the HRB. Therefore, this simultaneous effect of changes in precipitation and temperature created more significant water stress on vegetation, which has worsened the land degradation process. Moreover, because of enhanced irrigation in the oasis agriculture region to address the impact of rising water stress on crops, reduction of ecological water consumption resulted in increased land desertification in the downstream.
Wind also plays a vital role in soil erosion and land degradation in the arid region. Throughout the whole study period, the annual mean wind velocity shows a decreasing trend, and only a slightly increasing trend after 2011 in the midstream of the HRB. Such a change could reduce the wind’s erosive power and slow down the development of desertification. In conclusion, the trend of climate change is not consistent with that of the land degradation process in the midstream and downstream of the HRB. So, the climate variation was not the main driving force for land degradation in the midstream and downstream of the HRB.
NDVI has been widely used to monitor land degradation (Li et al., 2016). Therefore, we chose 3 × 3 pixel mean-NDVI at three weather stations to do correlation analysis with meteorological elements to reveal the impact of climate factors on land degradation. We found that only the annual mean temperature in the upstream and the annual mean wind speed in the midstream has a significant influence on NDVI (p < 0.01; Table 5). Generally, the vegetation is sensitive to precipitation in semi-arid and arid areas, but NDVI is not related to precipitation in the midstream and downstream of HRB. In a word, this indicated that climate factors are not the main driving factors of land degradation development and reversion in the midstream and downstream in the HRB.
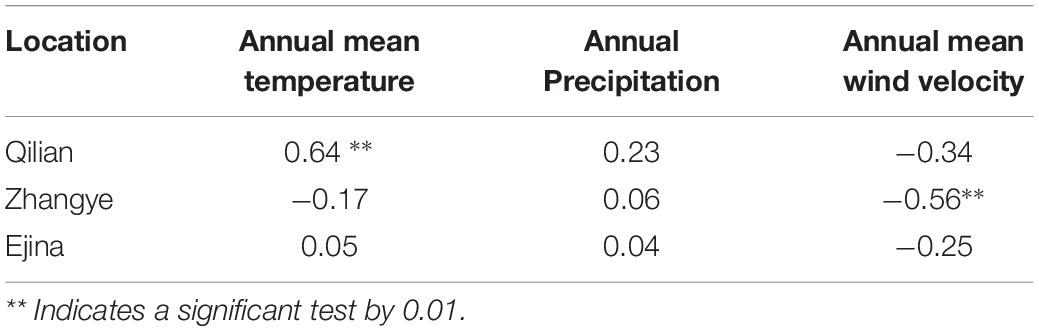
Table 5. The correlation between the NDVI and climatic factors.
Effects of Human Activities on Land Degradation
Human activities have two sides to land degradation. On the one hand, unreasonable human activities accelerate or promote the process of land degradation; on the other hand, reasonable human activities contribute to the reversal of land degradation under adverse natural conditions. In this research, the intensity of human activities was evaluated by using four proxies: the population, the area of arable land, and the numbers of livestock and politic measures, which can be used as an indication of effecting vegetation cover changes.
Rapid population expansion was the root of all irrational human activities, which led to the destruction of the ecological environment. For example (Figure 9A), the population of Zhangye City was 549,200 in the 1950s but had increased to 1,213,300 in 2014 (an increase of 221%). The rise in population will inevitably lead to a substantial increase in the area of cultivated land, residential land, industrial land, and traffic land, which is the leading cause of the decrease in Aeolian desertified land after the 1990s. Furthermore, due to the lack of adequate surface protection, the severe destruction of vegetation and soil surface structure caused by population and unreasonable economic activities and the intensification of wind erosion and the accumulation of surface soil salt caused by unreasonable utilization of water resources, were primary factors causing the intensification of land degradation.
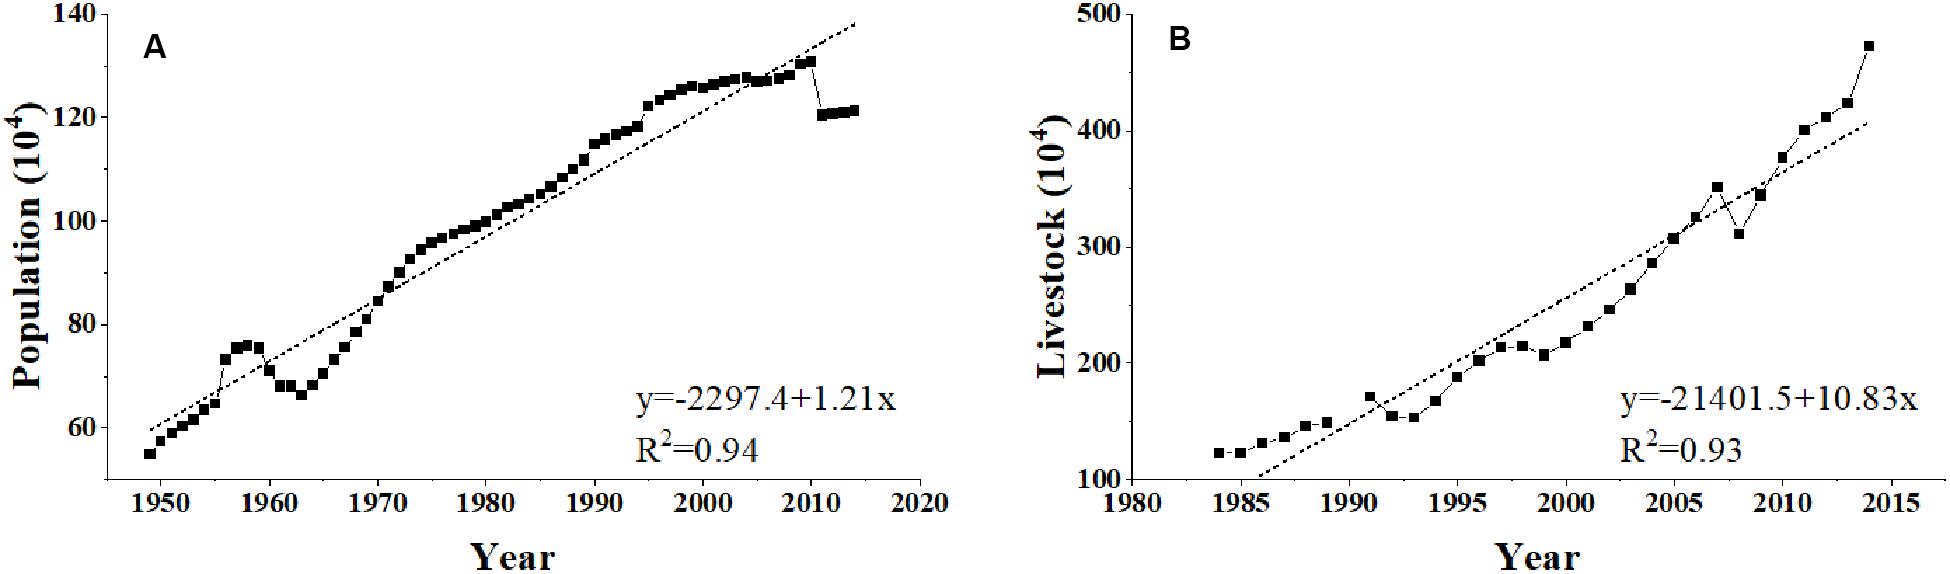
Figure 9. Change in population in Zhangye city from 1950 to 2015 (A), and change in livestock in Zhangye city from 1984 to 2015 (B).
Cultivated land in the oasis increased rapidly due to implementation of the “Grain Production Base Policy” in the 1970s and increased by 58.6% in 2010 (Liao et al., 2015b), which led to the oasis in the midstream becoming the major grain production base in Gansu Province and even in China. With the increase of cultivated land, the demand for irrigation water in the midstream continues to increase, which has led to a severe deterioration in the downstream ecosystems, including lakes, rivers drying up, wetlands shrinking, Aeolian desertification, and ecological degradation.
Overgrazing is another main factor in land degradation in the HRB. Since the 1980s, the livestock population in the HRB has increased dramatically. Taking Zhangye City as an example (Figure 9B), the sheep population increased by 283.73% from 1984 to 2014. Overgrazing is a common phenomenon in the natural grassland of the HRB. The overloading rate has increased from 21.68% in the early 1990s to 32.1% (Liu J. et al., 2002). At the same time of grazing, over-exploitation of valuable medicinal herbs such as Licorice, Cordyceps, Cynomorium soongaticum, Ephedra, etc. was also one of the main factors causing the extreme desertification of grassland in the HRB.
In response to the expansion of land degradation and the increasing deteriorated ecological environment, a series of environmental protection and restoration projects, including the “Three-North Shelterbelt Project,” “Grain for Green,” “Grazing Withdrawal Program,” “Construction of National Ecological Security Barrier,” and others, have been carried out. On the other hand, countermeasures have been adopted to combat land degradation and rehabilitate the deteriorated environment. These include the exclusion of grazing in degraded grassland, closed breeding, aerial sowing of tree and grass, seedings by airplane, etc. These projects and related policy played a vital role in revegetation and land degradation reversal.
Effects of the EWDP on Land Degradation
Figure 10 shows the trend of runoffs from the YLX, water consumption in the midstream, and runoffs to the downstream from 1975 to 2017. Before the EWDP was implemented, the runoffs from YLX have no significant change trend, but the water consumption in the midstream was rising rapidly. In contrast, runoffs to the downstream have declined sharply, and nearly zero, especially in 2001. Combined with the above analysis, we found that the decrease of available water resources is the dominant driving factor of a series of ecological environment problems in the downstream of the HRB.
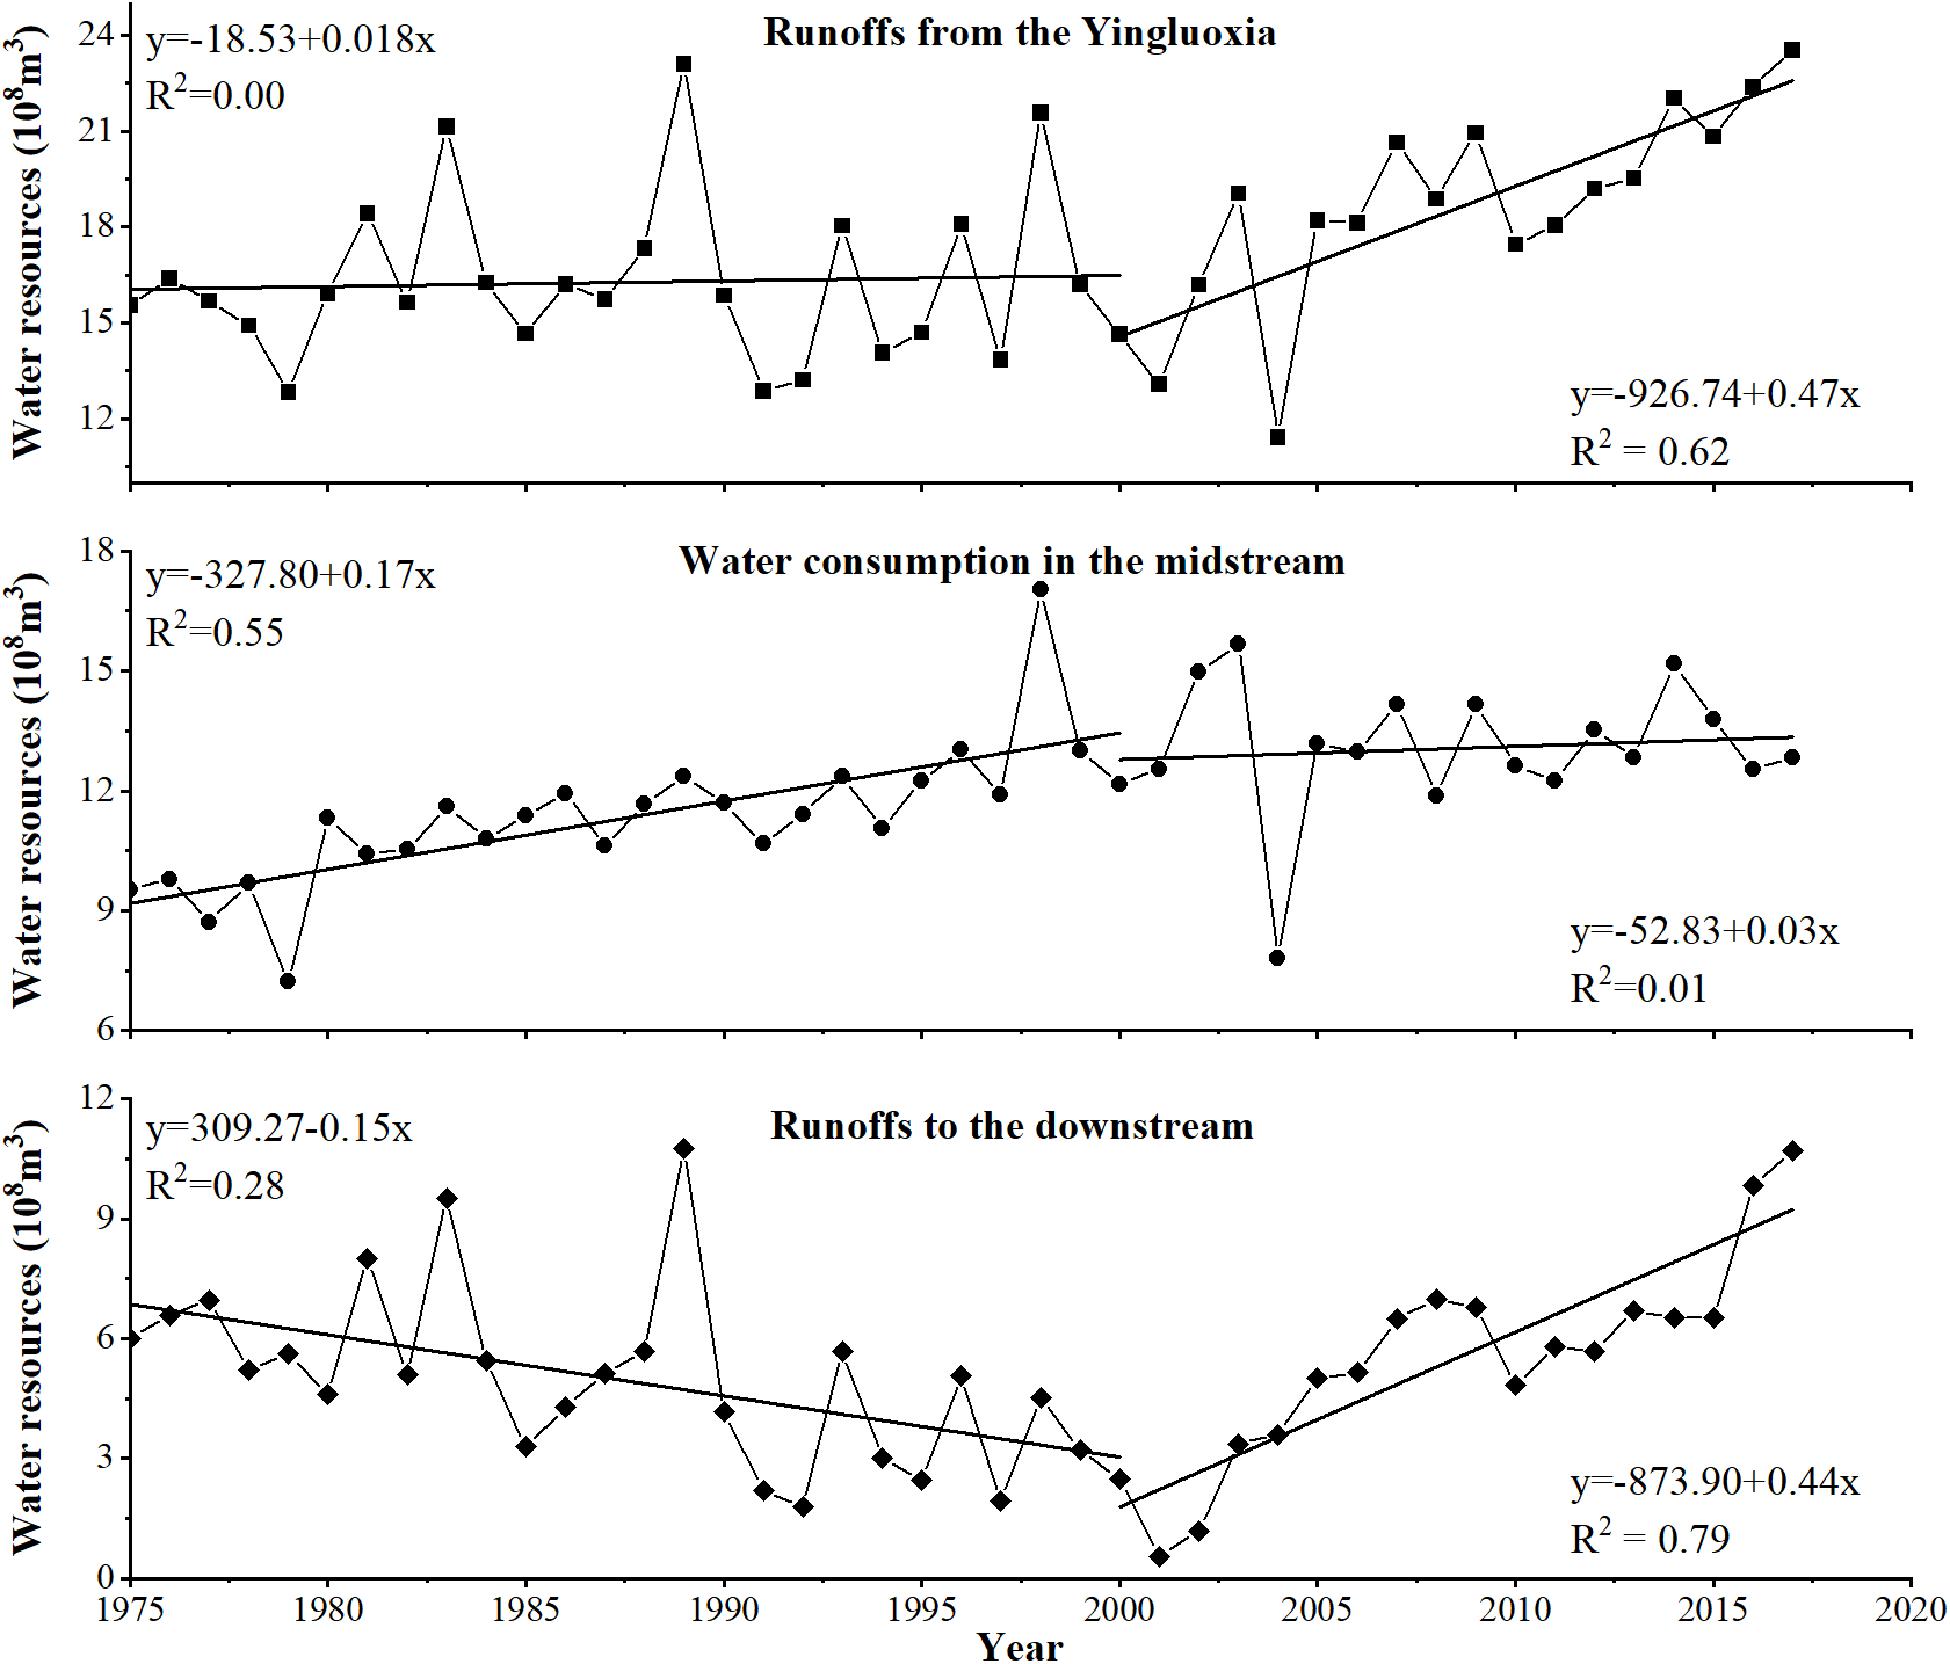
Figure 10. Change in runoffs from the Yingluoxia, water consumption in the midstream, and runoffs to the downstream from 1975 to 2015.
As Figure 10 shows, water consumption in the midstream maintained at a stable level, with no significant change trend after 2000. However, the runoffs to the downstream increased dramatically since 2000, and the accumulated actual discharge volume of the ZYX section is 13.2 billion m3 (Jiang X. et al., 2019). The terminal lake of the Heihe River has been recovered, and the area of the East Juyan Lake was up to 59.6 km2 in 2000, which was greater than in 1958. The West Juyan Lake and the Swan Lake (a residual lake of the ancient Juyan Lake) have also been replenished gradually after 2002 (Liao et al., 2015a). The increased water volume in the terminal lakes of the Heihe River led to increasing groundwater recharge and soil moisture content, which has promoted an increase in native vegetation and the restoration of the ecological environment in the downstream of the HRB. Also, there has been an expansion of downstream vegetation. As Table 5 shows, environmental rehabilitation has increased vegetation cover of the downstream by 226.7 km2 during 2000–2015, and the vegetation area in 2015 was much larger than the area in 1990. Attributed to increase in the area of the East Juyan Lake and the recovery of withered forests along the banks, the tourist industry based on the desert lake and a Populus euphratica forest has begun to boom, which has promoted the transformation of economic structure in the downstream region to reduce the interference to the ecological environment.
Although the EWDP is a benefit to the restoration of degraded downstream ecological environment, some potential factors which promoted land degradation have also arisen. After the EWDP, the artificial oasis still continuously expanded in the midstream, mainly because desert and ADL are reclaimed for cropland. But due to the shortage of surface water caused by the EWDP, irrigation of most newly reclaimed farmland after 2000 has relied on groundwater. To maintain a more massive increase in water demand for new cropland, groundwater abstraction in the midstream has been intensified further, which was already extensive in the 1980s. Furthermore, to reduce the leakage of ditches and improve the utilization rate of surface water resources, more than 70% of the irrigation system used the waterproof canal, which blocked the groundwater recharge source. So, the combination of farmland expansion in the midstream and the implementation of the water-saving irrigation system were the main reasons for the constant decrease in the groundwater table, resulting in the deterioration of native grassland around the key irrigation district near the Heihe River, which accounts for land degradation in the midstream after 2000.
Conclusion
In this study, LULC, Aeolian desertification, and vegetation change, extracted by using multi-sensor data, were chosen as monitoring indices to illustrate the effects of the EWDP on land degradation in the HRB. Our results reveal that the process of land degradation in the HRB can be divided into two stages, in which the degradation trend was dominant from 1990 to 2000, and the rehabilitation trend was dominant from 2000 to 2015. During the study period, although both climate variation and human activities except political measures have been favorable to land degradation development in the HRB, the land degradation process of the HRB has been stopped and reversed after 2000. The EWDP and the other political measures were benefited to change the land degradation process. Especially in the downstream, the EWDP improving the efficiency of the surface water resources reallocation supplemented groundwater and facilitated the recovery of the deteriorated ecosystem. However, the EWDP indirectly led to the decline of the groundwater table in the midstream caused by the expansion of farmland and completion of the water-saving irrigation system, with resulting local vegetation degradation. Hence, we propose to promote economic restructuring and change the mode of economic growth based on agriculture so as to prevent land degradation caused by the reduction of surface water resources due to the implementation of the EWDP in the midstream of the HRB.
Data Availability Statement
The raw data supporting the conclusions of this article will be made available by the authors, without undue reservation.
Author Contributions
XS and JL: methodology. XX: project administration. YHR: hydrological data analysis. JL: socio economic data analysis. XS, JL, and XX: validation. XS: writing—original draft. All authors read and agreed to the published version of the manuscript.
Funding
This study was supported by the National Natural Science Foundation of China (Grant No. 41801072), the Project of National Key Research and Development Program of China (2016YFC0500909), and Open Fund Project of the Key Laboratory of Desert and Desertification, Chinese Academy of Sciences (KLDD-2018-001).
Conflict of Interest
The authors declare that the research was conducted in the absence of any commercial or financial relationships that could be construed as a potential conflict of interest.
Footnotes
References
Akhtar-Schuster, M., Stringer, L. C., Erlewein, A., Metternicht, G., Minelli, S., Safriel, U., et al. (2017). Unpacking the concept of land degradation neutrality and addressing its operation through the Rio Conventions. J. Environ. Manag. 195, 4–15. doi: 10.1016/j.jenvman.2016.09.044
Ao, F., Jingjie, Y., Pingm, W., and Yichi, Z. (2012). Changing characteristics and influencing causes of groundwater level in the lower reaches of the Heihe River. J. Nat. Resour. 27, 686–696. doi: 10.11849/zrzyxb.2012.04.014
Burgan, R. E., and Hartford, R. A. (1993). Monitoring Vegetation Greenness with Satellite Data. Ogden, UT: U.S. Department of Agriculture, Forest Service, Intermountain Research Station.
Cheng, G., Li, X., Zhao, W., Xu, Z., Feng, Q., Xiao, S., et al. (2014). Integrated study of the water-ecosystem-economy in the Heihe River Basin. Nat. Sci. Rev. 1, 413–428. doi: 10.1093/nsr/nwu017
Cheng, G., Xiao, H., Xu, Z., Li, J., and Lu, M. (2006). Water issue and its countermeasure in the inland river basins of Northwest China: a case study in Heihe river basin. J. Glaciol. Geocryol. 28, 406–413. doi: 10.1007/s11442-006-0415-5
Cheng, G. D., and Li, X. (2015). Integrated research methods in watershed science. Sci. China Earth Sci. 58, 1159–1168. doi: 10.1007/s11430-015-5074-x
Cowie, A. L., Orr, B. J., Castillo Sanchez, V. M., Chasek, P., Crossman, N. D., Erlewein, A., et al. (2018). Land in balance: the scientific conceptual framework for land degradation neutrality. Environ. Sci. Policy 79, 25–35. doi: 10.1016/j.envsci.2017.10.011
Dawelbait, M., and Morari, F. (2012). Monitoring desertification in a Savannah region in Sudan using Landsat images and spectral mixture analysis. J. Arid Environ. 80, 45–55. doi: 10.1016/j.jaridenv.2011.12.011
Duan, H., Wang, T., Xue, X., and Yan, C. (2019). Dynamic monitoring of aeolian desertification based on multiple indicators in Horqin Sandy Land China. Sci. Total Environ. 650, 2374–2388. doi: 10.1016/j.scitotenv.2018.09.374
Fang, C. (2002). Discrepancy laws of the eco-economic zone in Heihe drainage area and its coupling development pattern. Acta Ecol. Sin. 22, 699–708. doi: 10.3321/j.issn:1000-0933.2002.05.012
Feng, L., Jia, Z., and Li, Q. (2016). The dynamic monitoring of aeolian desertification land distribution and its response to climate change in northern China. Sci. Rep. 6:39563. doi: 10.1038/srep39563
Guo, Q., Feng, Q., and Li, J. (2009). Environmental changes after ecological water conveyance in the lower reaches of Heihe River, northwest China. Environ. Geol. 58:1387. doi: 10.1007/s00254-008-1641-1
He, C., Demarchi, C., Croley, T. E., Feng, Q., and Hunter, T. (2009). Hydrologic modeling of the Heihe watershed by DLBRM in Northwest China. Sci. Cold Arid Reg. 1, 432–442. doi: 10.1360/972009-1551
Huang, G., Li, X., Ma, M., Li, H., and Huang, C. (2016). High resolution surface radiation products for studies of regional energy, hydrologic and ecological processes over Heihe river basin, northwest China. Agric. For. Meteorol. 230–231, 67–78. doi: 10.1016/j.agrformet.2016.04.007
Inman-Bamber, N. G., Lakshmanan, P., and Park, S. (2012). Sugarcane for water-limited environments: theoretical assessment of suitable traits. Field Crops Res. 134, 95–104. doi: 10.1016/j.fcr.2012.05.004
Jiang, L., Jiapaer, G., Bao, A., Li, Y., Guo, H., Zheng, G., et al. (2019). Assessing land degradation and quantifying its drivers in the Amudarya river delta. Ecol. Indic. 107:105595. doi: 10.1016/j.ecolind.2019.105595
Jiang, X., Xia, J., Huang, Q., Long, A., Dong, G., and Song, J. (2019). Adaptability analysis of the Heihe River “97” water diversion scheme. Acta Geogr. Sin. 74, 103–116. doi: 10.11821/dlxb201901008
Kakembo, V., Ndlela, S., and Cammeraat, E. (2012). Trends in vegetation patchiness loss and implications for landscape function: the case of Pteronia Incana invasion in the eastern cape province, South Africa. Land Degrad. Dev. 23, 548–556. doi: 10.1002/ldr.2175
Kang, E., Cheng, G., Song, K., Jin, B., Liu, X., and Wang, J. (2005). Simulation of energy and water balance in Soil-Vegetation-Atmosphere Transfer system in the mountain area of Heihe River Basin at Hexi Corridor of northwest China. Sci. China Ser. D Earth Sci. 48, 538–548. doi: 10.1360/02yd0428
Kang, W., and Liu, S. (2014). A review of remote sensing monitoring and quantitative assessment of Aeolian desertification. J. Desert Res. 34, 1222–1229. doi: 10.7522/j.issn.1000-694X.2013.00318
Latifovic, R., Trishchenko, A. P., Chen, J., Park, W. B., Khlopenkov, K. V., Fernandes, R., et al. (2005). Generating historical AVHRR 1 km baseline satellite data records over Canada suitable for climate change studies. Can. J. Remote Sens. 31, 324–346. doi: 10.5589/m05-024
Le Houérou, H. N. (1996). Climate change, drought and desertification. J. Arid Environ. 34, 133–185. doi: 10.1006/jare.1996.0099
Li, J., Yang, X., Jin, Y., Yang, Z., Huang, W., Zhao, L., et al. (2013). Monitoring and analysis of grassland desertification dynamics using Landsat images in Ningxia, China. Remote Sens. Environ. 138, 19–26. doi: 10.1016/j.rse.2013.07.010
Li, Q., Zhang, C., Shen, Y., Jia, W., and Li, J. (2016). Quantitative assessment of the relative roles of climate change and human activities in desertification processes on the Qinghai-Tibet Plateau based on net primary productivity. CATENA 147, 789–796. doi: 10.1016/j.catena.2016.09.005
Liao, J., Wang, T., and Xue, X. (2015a). Lake’s evaporation in the Ejin Basin since transferring water from the Heihe River. J. Desert Res. 35, 228–232. doi: 10.7522/j.issn.1000-694X.2013.00448
Liao, J., Wang, T., and Xue, X. (2015b). Oasis evolution in the Heihe River Basin during 1956-2010. J. Desert Res. 32, 1426–1441. doi: 10.1007/s11783-011-0280-z
Liu, H. (1995). Types and characteristics of land degradation and countermeasures in China. Nat. Resour. 4, 26–32.
Liu, J., Zhang, F., and Xie, X. (2002). The ecological crisis of grassland desertification and the development of Animal husbandry in Hexi corridor. Agric. Res. Arid Areas 20, 114–116. doi: 10.3969/j.issn.1674-7240.2002.12.008
Liu, Z., Zhu, Z., and Hao, D. (2002). The mountain-basin complex of Heihe River and resource-environment safety of oasis zone in the lower reaches. J. Nat. Resour. 17, 286–293. doi: 10.1007/s11769-002-0026-8
Luo, K., Tao, F., Moiwo, J. P., and Xiao, D. (2016). Attribution of hydrological change in Heihe River Basin to climate and land use change in the past three decades. Sci. Rep. 6:33704. doi: 10.1038/srep33704
Ma, J. Z., Wang, X. S., and Edmunds, W. M. (2005). The characteristics of ground-water resources and their changes under the impacts of human activity in the arid Northwest China—a case study of the Shiyang River Basin. J. Arid Environ. 61, 277–295. doi: 10.1016/j.jaridenv.2004.07.014
Mi, L., Xiao, H., Zhang, J., Yin, Z., and Shen, Y. (2016). Evolution of the groundwater system under the impacts of human activities in middle reaches of Heihe River Basin (Northwest China) from 1985 to 2013. Hydrogeol. J. 24, 971–986. doi: 10.1007/s10040-015-1346-y
Pereira, L. S., Cordery, I., and Iacovides, I. (2012). Improved indicators of water use performance and productivity for sustainable water conservation and saving. Agric. Water Manag. 108, 39–51. doi: 10.1016/j.agwat.2011.08.022
Qi, S., and Luo, F. (2005). Water environmental degradation of the Heihe River Basin in arid northwestern China. Environ. Monit. Assess. 108, 205–215. doi: 10.1007/s10661-005-3912-6
Song, X., Wang, T., Xue, X., Yan, C., and Li, S. (2015). Monitoring and analysis of aeolian desertification dynamics from 1975 to 2010 in the Heihe River Basin, northwestern China. Environ. Earth Sci. 74, 3123–3133. doi: 10.1007/s12665-015-4350-6
Song, X., and Yan, C. (2014). Land cover change detection using segment similarity of spectrum vector based on knowledge base. Acta Ecol. Sin. 34, 7175–7180. doi: 10.5846/stxb201310132458
UNCCD (1994). United Nations Convention to Combat Desertification in Countries Experiencing Serious Drought and/or Desertification, Particularly in Africa. Paris: Secretariat of the United Nations Convention to Combat Desertification.
Wang, G., and Cheng, G. (1998). Changes of hydrology and ecological environment during late 50 years in Heihe River Basin. J. Desert Res. 18, 233–238. doi: 10.1088/0256-307X/15/11/025
Wang, G., and Cheng, G. (1999). The ecological features and significance of hydrology within arid inland river basins of China. Environ. Geol. 37, 218–222. doi: 10.1007/s002540050379
Wang, J., Wei, H., Cheng, K., Ochir, A., Davaasuren, D., Li, P., et al. (2020). Spatio-temporal pattern of land degradation from 1990 to 2015 in Mongolia. Environ. Dev. 34:100497. doi: 10.1016/j.envdev.2020.100497
Wang, P., Yu, J., Pozdniakov, S. P., Grinevsky, S. O., and Liu, C. (2014). Shallow groundwater dynamics and its driving forces in extremely arid areas: a case study of the lower Heihe River in northwestern China. Hydrol. Process. 28, 1539–1553. doi: 10.1002/hyp.9682
Wang, T., Song, X., Yan, C., Li, S., and Xie, J. (2011). Remote sensing analysis on aeolian desertification trends in Northern China during 1975—2010. J. Desert Res. 31, 1351–1356.
Wang, T., Yan, C., Song, X., and Li, S. (2013). Landsat images reveal trends in the aeolian desertification in a source area for sand and dust storms in China’s Alashan plateau (1975-2007). Land Degrad. Dev. 24, 422–429. doi: 10.1002/ldr.1138
Wang, T., Yan, C., Song, X., and Xie, J. (2012). Monitoring recent trends in the area of aeolian desertified land using Landsat images in China’s Xinjiang region. ISPRS J. Photog. Remote Sens. 68, 184–190. doi: 10.1016/j.isprsjprs.2012.01.001
Wang, Y., Xiao, H., and Wang, R. (2009). Water scarcity and water use in economic systems in Zhangye city, Northwestern China. Water Resour. Manag. 23, 2655–2668. doi: 10.1007/s11269-009-9401-x
Wu, B., Yuan, Q., Yan, C., Wang, Z., Yu, X., Li, A., et al. (2014). Land cover changes of China from 2000 to 2010. Q. Sci. 34, 723–731. doi: 10.3969/j.issn.1001-7410.2014.04.04
Xiao, J., Shen, Y., Tateishi, R., and Bayaer, W. (2006). Development of topsoil grain size index for monitoring desertification in arid land using remote sensing. Intern. J. Remote Sens. 27, 2411–2422. doi: 10.1080/01431160600554363
Xiao, S., and Xiao, H. (2004). The impact of human activity on the water environment of Heihe water basin in last century. J. Arid Land Resour. Environ. 18, 57–62. doi: 10.3969/j.issn.1003-7578.2004.03.011
Xie, Y., Zhao, H., and Wang, G. (2015). Spatio-temporal changes in oases in the Heihe River Basin of China: 1963-2013. Ecoscience 22, 33–46. doi: 10.1080/11956860.2015.1047140
Xue, X., Guo, J., Han, B., Sun, Q., and Liu, L. (2009). The effect of climate warming and permafrost thaw on desertification in the Qinghai-Tibetan Plateau. Geomorphology 108, 182–190. doi: 10.1016/j.geomorph.2009.01.004
Yan, C. Z., Song, X., Zhou, Y., Duan, H., and Li, S. (2009). Assessment of aeolian desertification trends from 1975’s to 2005’s in the watershed of the Longyangxia Reservoir in the upper reaches of China’s Yellow River. Geomorphology 112, 205–211. doi: 10.1016/j.geomorph.2009.06.003
Zhang, A., Zheng, C., Wang, S., and Yao, Y. (2015). Analysis of streamflow variations in the Heihe River Basin, northwest China: trends, abrupt changes, driving factors and ecological influences. J. Hydrol. Reg. Stud. 3, 106–124. doi: 10.1016/j.ejrh.2014.10.005
Zhang, G., Nie, Z., and Liu, S. (2006). Threshold of influence of water resources in the Heihe River valley, northwestern Gansu, China on the ecological environment variation of the lower reaches. Geol. Bull. China 25, 244–250. doi: 10.1007/s11442-006-0415-5
Zhang, L., Wu, B., Li, X., and Xing, Q. (2014). Classification system of China land cover for carbon budget. Acta Ecol. Sin. 34, 7158–7166. doi: 10.5846/stxb201310102431
Zhang, S., Ye, Z., Chen, Y., and Xu, Y. (2017). Vegetation responses to an ecological water conveyance project in the lower reaches of the Heihe River basin. Ecohydrology 10:e1866. doi: 10.1002/eco.1866
Zhang, X., and Xia, J. (2009). Coupling the hydrological and ecological process to implement the sustainable water resources management in Hanjiang River Basin. Sci. China Ser. E-Technol. Sci. 52, 3240–3248. doi: 10.1007/s11431-009-0363-2
Zhou, Y., Li, X., Yang, K., and Zhou, J. (2018). Assessing the impacts of an ecological water diversion project on water consumption through high-resolution estimations of actual evapotranspiration in the downstream regions of the Heihe River Basin, China. Agric. For. Meteorol. 249, 210–227. doi: 10.1016/j.agrformet.2017.11.011
Keywords: land degradation, Ecological Water Diversion Project, the Heihe River, multi-sensor, rehabilitation
Citation: Song X, Liao J, Xue X and Ran Y (2020) Multi-Sensor Evaluating Effects of an Ecological Water Diversion Project on Land Degradation in the Heihe River Basin, China. Front. Environ. Sci. 8:152. doi: 10.3389/fenvs.2020.00152
Received: 01 April 2020; Accepted: 11 August 2020;
Published: 22 September 2020.
Edited by:
Jian Sun, Institute of Geographic Sciences and Natural Resources Research (CAS), ChinaReviewed by:
Kun Jia, Beijing Normal University, ChinaJinyan Zhan, Beijing Normal University, China
Copyright © 2020 Song, Liao, Xue and Ran. This is an open-access article distributed under the terms of the Creative Commons Attribution License (CC BY). The use, distribution or reproduction in other forums is permitted, provided the original author(s) and the copyright owner(s) are credited and that the original publication in this journal is cited, in accordance with accepted academic practice. No use, distribution or reproduction is permitted which does not comply with these terms.
*Correspondence: Xiang Song, songxiang@lzb.ac.cn; Jie Liao, liaojie@lzb.ac.cn