Occurrence and Origins of Cerium Dioxide and Titanium Dioxide Nanoparticles in the Loire River (France) by Single Particle ICP-MS and FEG-SEM Imaging
 Karine Phalyvong1,2
  Yann Sivry1* Hélène Pauwels2
  Alexandre Gélabert1 Mickaël Tharaud1 Guillaume Wille2 Xavier Bourrat2
  Marc F. Benedetti1
- 1CNRS, Institut de Physique du Globe de Paris, Sorbonne Paris Cité, Paris Diderot University, Paris, France
- 2BRGM, Orleans, France
The need to quantify engineered nanoparticles (ENPs) in the environment is due to the increasing incorporation of these particles in the daily products, which threatens human health and can possibly impact natural systems. Ceria NPs (CeO2NPs) and titanium dioxide NPs (TiO2NPs) are two of the most used ENPs in the world. In this study their occurrence was determined in river waters with accurate and relevant techniques such as single particle ICP-MS (spICPMS). In the Loire River (France), the variation of both CeO2NPs and TiO2NPs could be assessed locally, with an increase of the concentrations near a wastewater treatment plant (WWTP) outlet as well as in a lake connected to the river and dedicated to outdoor activities. In the upstream river water, supposedly less impacted by NPs, 6.4 ± 1.2 × 10⁴ part mL–1 Ce-bearing and 13.4 ± 1.8 × 10⁴ part mL–1 Ti-bearing particles were measured. These values increased to 33.9 ± 3.4 × 10⁴ part mL–1 Ce-bearing and 80.3 ± 3.4 × 10⁴ part mL–1 Ti-bearing particles near the WWTP outlet. Equivalent size for sphere distributions ranged from 24 nm to 70 nm for CeO2 and from 80 nm to 500 nm for TiO2 in the river water. In the lake, a raise of the concentrations has been observed with 38.3 ± 2.0 × 10⁴ part mL–1 and 71.6 ± 2.1 × 10⁴ part mL–1 containing Ce and Ti, respectively, with similar size distributions. FEG-SEM imaging confirms the occurrence of Ce- and Ti-bearing particles in the water samples. On the contrary, NPs seem to undergo strong heteroaggregation in the Loire river water. The Ce/La elemental ratios does not evolve from upstream to downstream the WWTP outlet, suggesting that a natural origin cannot be excluded to explain the increase observed in NPs number concentration. On the contrary, the Ce/La ratio increases in the outdoor activities center, which suggests the contribution of NPs potentially related to the cars parked nearby. Besides, elemental ratios Ti/V and Ti/Y have been assessed to highlight an anthropogenic source of Ti in both sampling sites, possibly to the sunscreens used during the summer.
Introduction
Engineered nanoparticles (ENPs) are of great importance thanks to their small size which gives them specific properties, especially valuable in different areas such as medicine (Zhang et al., 2008), biology (De et al., 2008), or industry (Piccinno et al., 2012). Ceria (CeO2NPs) and titanium dioxide NPs (TiO2NPs) are among the most used NPs in the world (Keller and Lazareva, 2014, Hochella et al., 2019). CeO2NPs are mostly selected for their high oxygen storage capacity (Zhang et al., 2011), their ability to absorb UV (Lima et al., 2009) and their low redox potential (Ce3+/Ce4+; Van Hoecke et al., 2009). They have several applications, especially in the automobile industry as a diesel fuel additive and as part of catalytic converters. Because of their anti-inflammatory properties (Hirst et al., 2009), these ENPs are also useful in medicine. Regarding TiO2NPs, their UV blocking properties and their white color make them very interesting to be incorporated in daily products such as sunscreens, toothpaste, food (as an additive) and paints (Weir et al., 2012). In addition, TiO2NPs are usually coated with a protective layer of alumina or silica. This layer is used to complex hydroxyl radicals (Serpone et al., 2007) and superoxide anion radicals (Virkutyte et al., 2012) produced by TiO2NPs, which are harmful for human health. It is also known to decrease the photocatalytic activity of TiO2NPs. In addition, TiO2NPs constitute the largest release of nanomaterials into the environment (water, air and soil; Sun et al., 2016). The increasing use of ENPs, notably by their incorporation in daily products, raises questions about their release into the environment (Keller and Lazareva, 2014), about their fate and behavior in such complex media (Nowack and Bucheli, 2007; Wagner et al., 2014; Lead et al., 2018), but also about their toxicity (Navarro et al., 2008; Kahru and Dubourguier, 2010). The mobility of NPs (Cary et al., 2015) is difficult to assess, especially as modeled concentrations have been estimated at ng L–1 to μg L–1 (Gottschalk et al., 2013; Nowack et al., 2015). In addition, the very low concentrations make ENPs difficult to be quantified among natural NPs geochemical background. That is why the use of trustworthy analytical tools allowing the detection and quantification of ENPs in the environment, at relevant concentrations, is required.
Single particle Inductively Coupled Plasma-Mass Spectrometry (spICPMS) is an innovative technique that can determine particle size distribution and particle number concentration. In the early 2000s, this method was firstly applied to colloids (Degueldre and Favarger, 2003, 2004; Degueldre et al., 2004, 2006a,b) and more recently to ENPs (Laborda et al., 2011; Mitrano et al., 2012). Lately, a study underlined that spICPMS presented limitations in terms of minimum size detection (Lee et al., 2014). Few applications of spICPMS in environmental matrix have been assessed, especially in aquatic media. Most studies are about silver ENPs detected (Mitrano et al., 2012; Tuoriniemi et al., 2012; Wang et al., 2020) or spiked (Telgmann et al., 2014) in wastewater samples (Polesel et al., 2018) and in natural waters (Mitrano et al., 2014; Yang et al., 2016). One study deals with the detection of ZnONPs in water by using both a binding resin and spICPMS (Hadioui et al., 2015). The fate of several ENPs was also studied during the drinking water treatment process, showing that ENPs were detected and quickly removed after the first water treatment step (Donovan et al., 2016a,b). To our knowledge, the studies conducted by Gondikas et al. (2014) revealing the release of TiO2NPs from sunscreens in the Old Danube Lake during 1 year of sampling, in the Meuse and Ijssel rivers (Peters et al., 2018) and the one conducted by Reed et al. (2017), revealing elevated Ti-containing particles during bathing hours in a stream used for recreation are the only ones applying the spICPMS technique for TiO2NPs evidences in a natural matrix at relevant environmental concentrations. While this study efficiently assessed the temporal variation of TiO2NPs concentration at one single point, no spatial investigation of the ENPs dynamics was performed.
The aim of the present study was to assess the occurrence of NPs potentially resulting from anthropogenic activities in a complex environmental system, the Loire River. Particularly, some potential ENPs inflows were investigated: a direct water release considering sunscreen use in a recreational area (TiO2NPs for instance), an indirect airborne contamination involving fuel burning (automobile use with CeO2NPs), and NPs released from a wastewater treatment plant (WWTP). The occurrence of TiO2NPs and CeO2NPs at different locations in the Loire River watershed were determined with two powerful analytical tools: spICPMS and FEG-SEM imaging, specifically dedicated to the NPs detection in complex environmental matrices. These tools were combined with a geochemical approach involving the use of elemental ratios for the determination of the NPs origins and sources.
Materials and Methods
Field Settings
The site study is located around the city of Orléans (France), along the Loire Rive which is 1,012 km long and is one of the largest river in Europe. Indeed, the Loire River drains an area of 117,000 km2 (Camenen et al., 2016) and constitutes one of the major input of water discharge in the Atlantic Ocean with 26 km3 per year (Figueres et al., 1985; Grosbois et al., 2000). The Loire River basin (20% of France territory) can be divided into three smaller basins: the Upper Loire, the Middle Loire, and the Lower Loire which correspond to 18, 24, and 65% of the basin area, respectively (Minaudo et al., 2015). In its upper basin, the Loire River drains old plutonic and volcanic rocks such as granites, gneisses, and mica schists (Grosbois et al., 2000; Dhivert et al., 2015), whereas in its middle basin, where Orleans is seated, 200 to 6 million years old carbonate deposits from Paris basin dominate (Négrel et al., 2000). For this study, seven sampling sites were chosen from upstream to downstream the Orléans city (Figure 1).
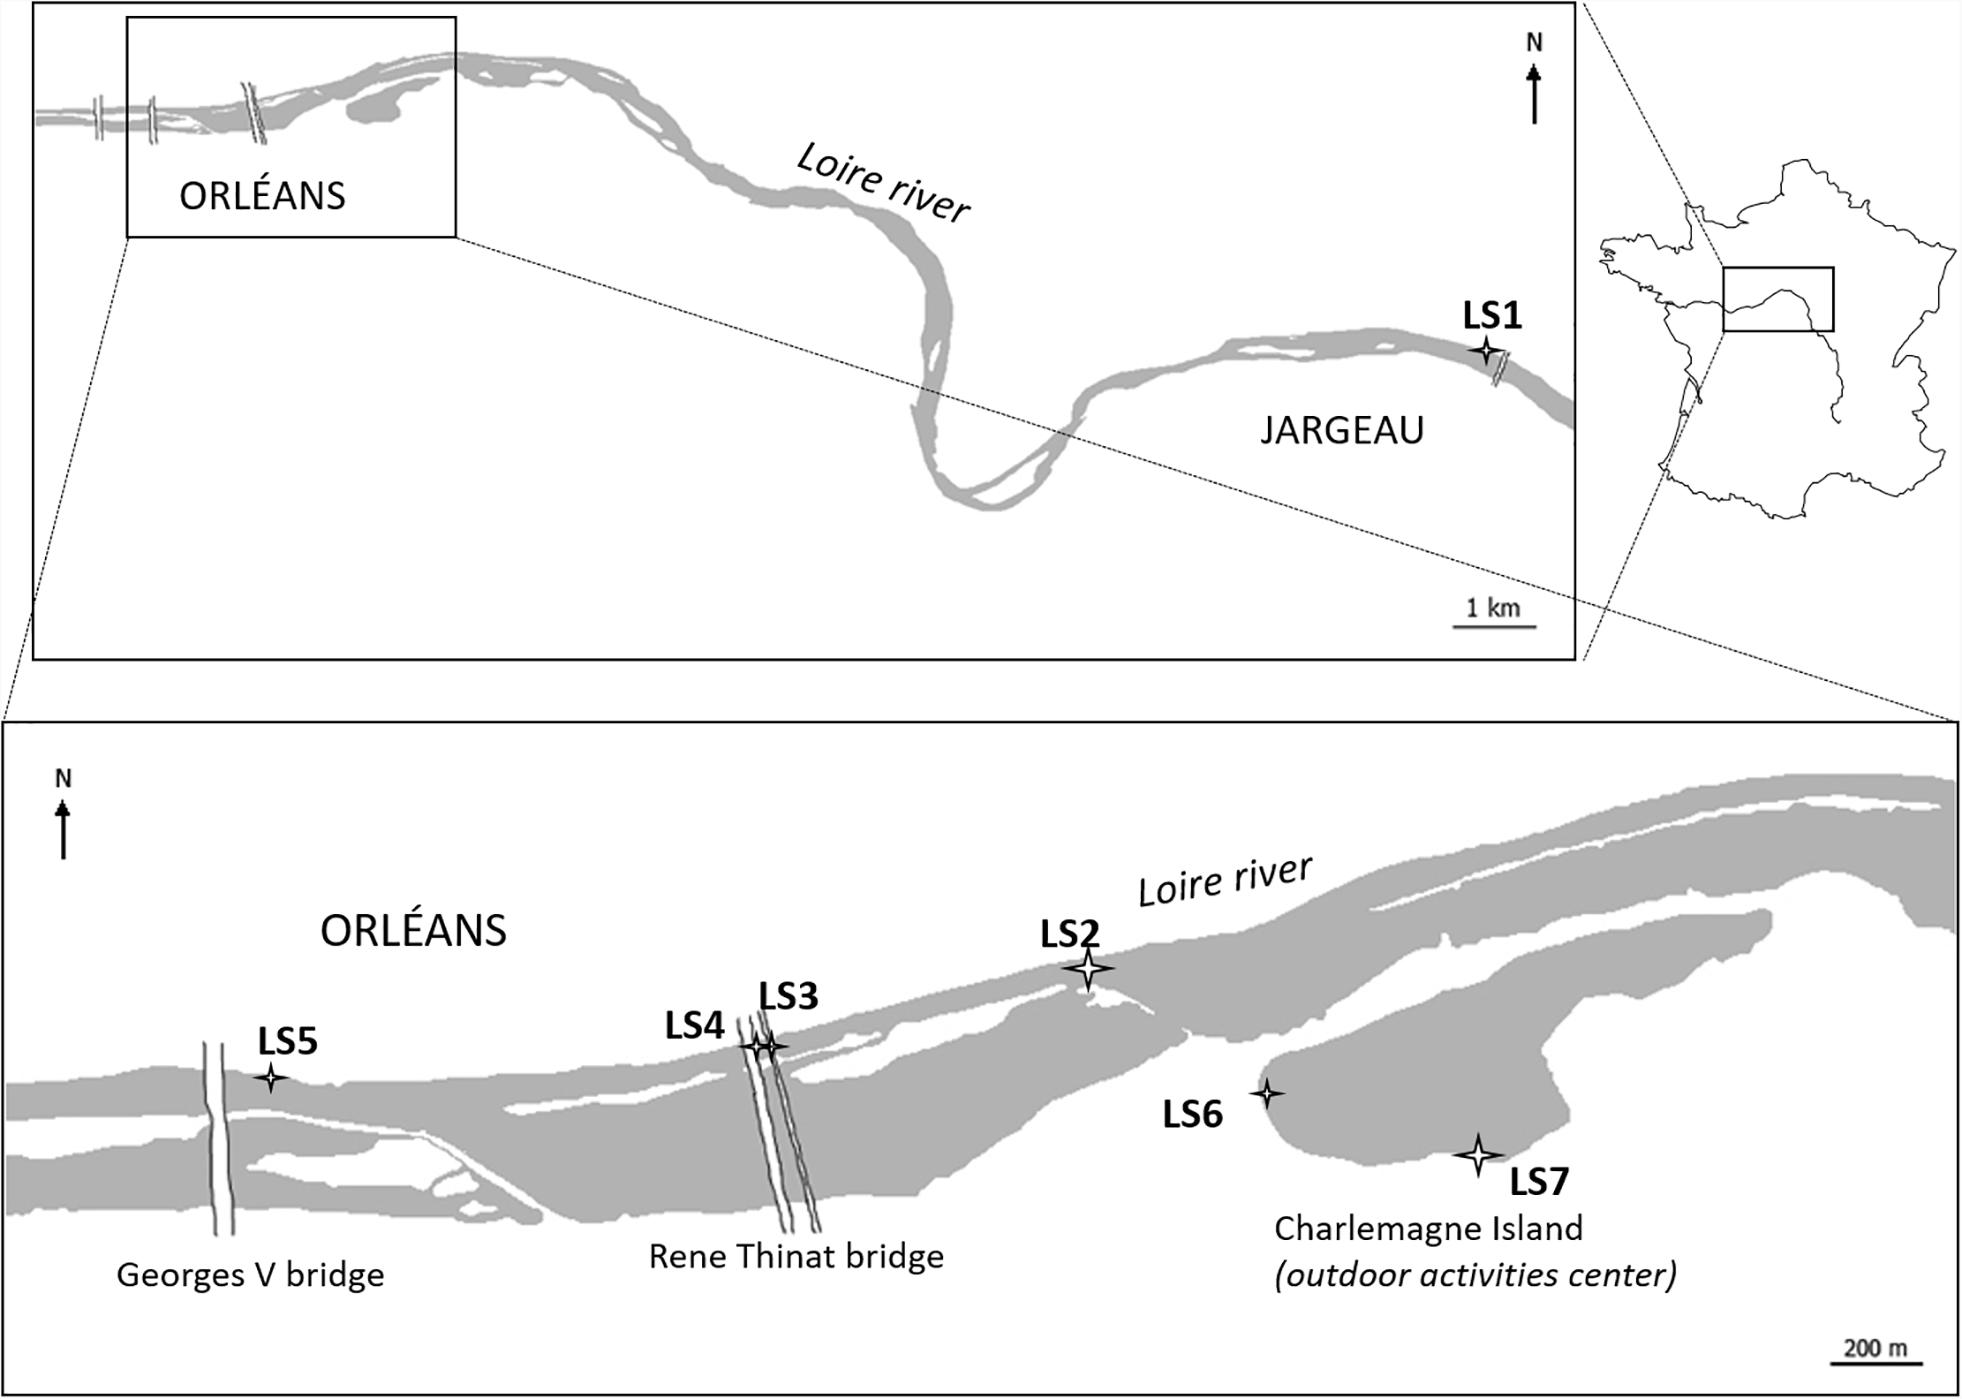
Figure 1. Loire River sampling sites from LS1 (in Jargeau city) to LS7, in Orleans city.
The sampling campaign took place during two sunny days of September 2014: 15th and 16th, where the water level was low. A first sampling site, called LS1, has been chosen upstream from Orléans city, at Jargeau city. Given its location, this site was postulated to be the one the least affected by anthropogenic activities of Orléans. In Orleans city, LS2 site is located before the WWTP outlet where two sampling points were selected (LS3 and LS4). At the downstream of these points, water sample has been taken up on LS5, at the very end of the Orleans city. LS6 and LS7 are located close to an outdoor activities center where people can swim into a lake which water has underground connections with the Loire River.
Water Chemistry
On site measurements on surface waters were performed including pH, dissolved oxygen, conductivity, and temperature. Water samples were filtered through 0.22 μm acetate cellulose syringe filters and stored in Falcon tubes (PP). An aliquot of the water sample was acidified with distilled 16N HNO3 for dissolved trace and major cations analysis. Another one was kept unacidified for the anions and the alkalinity analyses. Concentrations of major anions and cations were determined by ionic chromatography (Thermo Fisher Scientific ICS 1100) and Inductively Coupled Plasma Atomic Emission Spectroscopy (ICP-AES, Thermo Fisher Scientific iCAP 6200), respectively. Alkalinity was measured by automatic titration with 10–2 mol L–1 HCl with a Titrando 809 from Metrohm. Moreover, Loire River water was also filtered through 0.7 μm glass microfiber filters to measure the non-purgeable organic carbon (NPOC) in the filtrate after acidification with 85% H3PO4, using a Shimadzu Total Organic Carbon Analyzer (TOC V CSH). For each sampling site, around one liter of Loire surface water (bulk water) was collected in view of spICPMS analysis. Suspended matters were also collected on 0.2 μm polyethersulfone filters, picked up, and freeze-dried prior to FEG-SEM analyses. Total concentrations in bulk water samples of Al, Sc, Ti, V, Cr, Mn, Fe, Co, Cu, Zn, Sr, Y, Ag, Cd, and Pb as well as REE except Pm) in water were obtained by performing evaporation of the bulk water followed by acid digestion with distilled 27N HF/16N HNO3 at 1:1 ratio at 95°C overnight. Samples were then diluted with 2% HNO3 before ICP-AES and ICP-MS analyses. Total and dissolved trace element concentrations were measured with a High Resolution-ICP-MS (Thermo Fisher Scientific ELEMENT II). If the measured concentrations were too high (especially, in total fractions, superior to 10 ppb), samples were analyzed by ICP-AES (Thermo Fisher Scientific iCAP 6200).
Single Particle ICP-MS (spICPMS)
A High Resolution Thermo Fisher Scientific ELEMENT II ICP-MS was used in single counting mode for spICPMS measurements. The number of measurements was fixed at 10,000 data with a dwell time of 1 ms and a settling time of 1 ms. Besides, the flow rate was measured manually in triplicate, during the analysis day, at 0.2 mL min–1. Calibration curves were made in the same matrix as the samples: the sample LS1 was ultrafiltered at 500 Da then used for dilution (from 50 to 1,000 ppt) of gold (Au), cerium (Ce) and titanium (Ti) SCP Science with 10 ppm stock solutions. Furthermore, using the second method called “particle size” and described by Pace et al. (2011), 5 ppt of gold NPs with a 15 nm size (BBInternational) were used to determine the transport efficiency (12% in low resolution and 6.4% in medium resolution). 140Ce and 47Ti were measured in low and medium resolutions, respectively. spICPMS technique requires diluted samples to have single particle events. Similarly to standards, each bulk water samples as well as AuNPs suspension were diluted with LS1 500 Da ultrafiltered water, with the objective to disturb as less as possible the chemical equilibriums of samples while diluting as well as to eliminate any matrix effect. Ultrafiltered LS1 sample also served as a blank during analyses. Several dilutions were assessed (2, 5, 10, 100, and 1,000), and the 5-fold dilution was chosen as the best compromise between a minimum number of particles and an accurate peak resolution. Samples were measured in triplicate (3 times 10000 data) which allows calculating averages and standard deviations.
Data treatment procedure was provided by Colorado School of Mines coming from Pace et al. (2011) and could be sum up as following: at first, count intensities were classified as a function of their frequency. The lowest intensities represented the dissolved ions and higher intensities accounted for NPs. Different methods exist to determine the threshold between dissolved and NPs such as iterative algorithms with 3σ (Mitrano et al., 2012) or 5σ (Tuoriniemi et al., 2012), a K-mean clustering algorithm (Bi et al., 2014), a deconvolution method (Cornelis and Hassellöv, 2014), or simply by using the first minimum as the limit between dissolved and NPs (Mitrano et al., 2014). In our study, the threshold between dissolved and NPs species was determined experimentally by measuring LS1 500 Da ultrafiltered water in single counting mode. LS1 water sample was chosen as the least impacted with NPs. Actually, below this threshold, all measured species are considered in a non-particulate form referred here as a “true dissolved state.” Then, the frequency versus count intensity of LS1 500 Da ultrafiltered water was simultaneously drawn with the unknown sample to determine the cut-off between dissolved and NPs. Consequently, if the distribution for the dissolved ions can be measured and drawn, the threshold between dissolved and NPs can be determined, experimentally.
In spICPMS, the detection limit in size depends on several factors such as the instrument sensitivity or the background noise level. Indeed, a chart proposed by Lee et al. (2014) summarizes the detection size limit for 40 elements including Ce and Ti where the minimum size for 140Ce is around 10 nm, and for 49Ti, around 80 nm. Among the several approaches tested by Tharaud et al. (2017) to reduce the Ca interference while measuring TiO2 in solutions, we decided to use with a High-Resolution ICPMS). Furthermore, in the Loire River, a high concentration of calcium was measured (∼600 nmol L–1) and this element has an isobaric interference with 48Ti, the most abundant isotope of titanium (73.8%). Hence, the third most abundant isotope 47Ti was chosen (7.3%) as suggested by Gondikas et al. (2014) who faced the same issue. This has a direct consequence on the smallest detected size which will be high for Ti (>80 nm).
FEG-SEM
A TESCAN MIRA 3 XMU Field Emission Gun – Scanning Electron Microscopy (FEG-SEM) was used for imaging particles collected on 0.2 μm filters using a secondary electron detector (Everhart-Thornley detector) and a YAG-doped scintillator backscattered electrons detector (Autrata type detector). Only pictures obtained with the backscattered electrons detector are shown in this study, as this detector highlights the compounds with an important averaged atomic number. Elemental analyses were performed by Energy Dispersive X-ray Spectroscopy (EDS) on the targeted particles in samples using an EDAX team system [ApolloXPP silicon drift detector (SDD)]. Samples were prepared as followed: freeze-dried suspended matters were dispersed in absolute ethanol, and ultrasonicated in a bath during 10 min. Samples were dispersed onto aluminum stubs and dried at 45°C in an oven for approximately 4 h. Afterward, samples were cleaned with an argon plasma cleaner (GAMBETTI Colibri) to remove traces of impurities. Then, samples were coated with a 1.5 nm layer of platinium-paladium using a CRESSINGTON 208HR sputter coater prior to SEM-EDS analyses. In each sample, between 5 and 10 particles containing the NPs of interest (Ti- or Ce-containing NPs) were identified by this technique, among over approximately 40 particles scanned per sample.
Results
Evolution of the Water Chemistry Around Orleans City
Along the Loire River, the pH value remained relatively constant (8.07 ± 0.22), with a light increase in LS3 and LS4 (8.24) close to the WWTP outlet, with respect to LS1 measurement (7.71; Supplementary Table S1) whereas dissolved O2 (8.82 mg L–1), alkalinity (2.83 meq L–1) and the NPOC concentration (4.43 ± 0.08 mg L–1) remain constant. Besides, the conductivity was lower at LS3 (230 μS cm–1) than at LS1 (248 μS cm–1). Close to the outdoor activities center, in the lake connected to the Loire River (LS6 and LS7 sites), the chemical composition of the water presented significant contrasts with respect to the Loire River, particularly regarding the pH values (8.84 and 8.76 for LS6 and LS7, respectively), dissolved O2 concentrations (13.76 mg L–1 and 11.81 mg L–1), and NPOC concentrations (3.91 ± 0.05 mg L–1 and 3.79 ± 0.03 mg L–1). The alkalinity and conductivity were also higher in LS7 where the values were found at 3.50 meq L–1 and at 261 μS cm–1, respectively.
NPs Profile Along the Loire River
Figure 2 shows the particle number concentrations of Ce and Ti as well as the Ti/Ce ratio of particle number concentrations in Orleans city (Figure 2A) and in the lake dedicated to the outdoor activities center (Figure 2B), both compared with the upstream water (LS1) taken as site of reference.
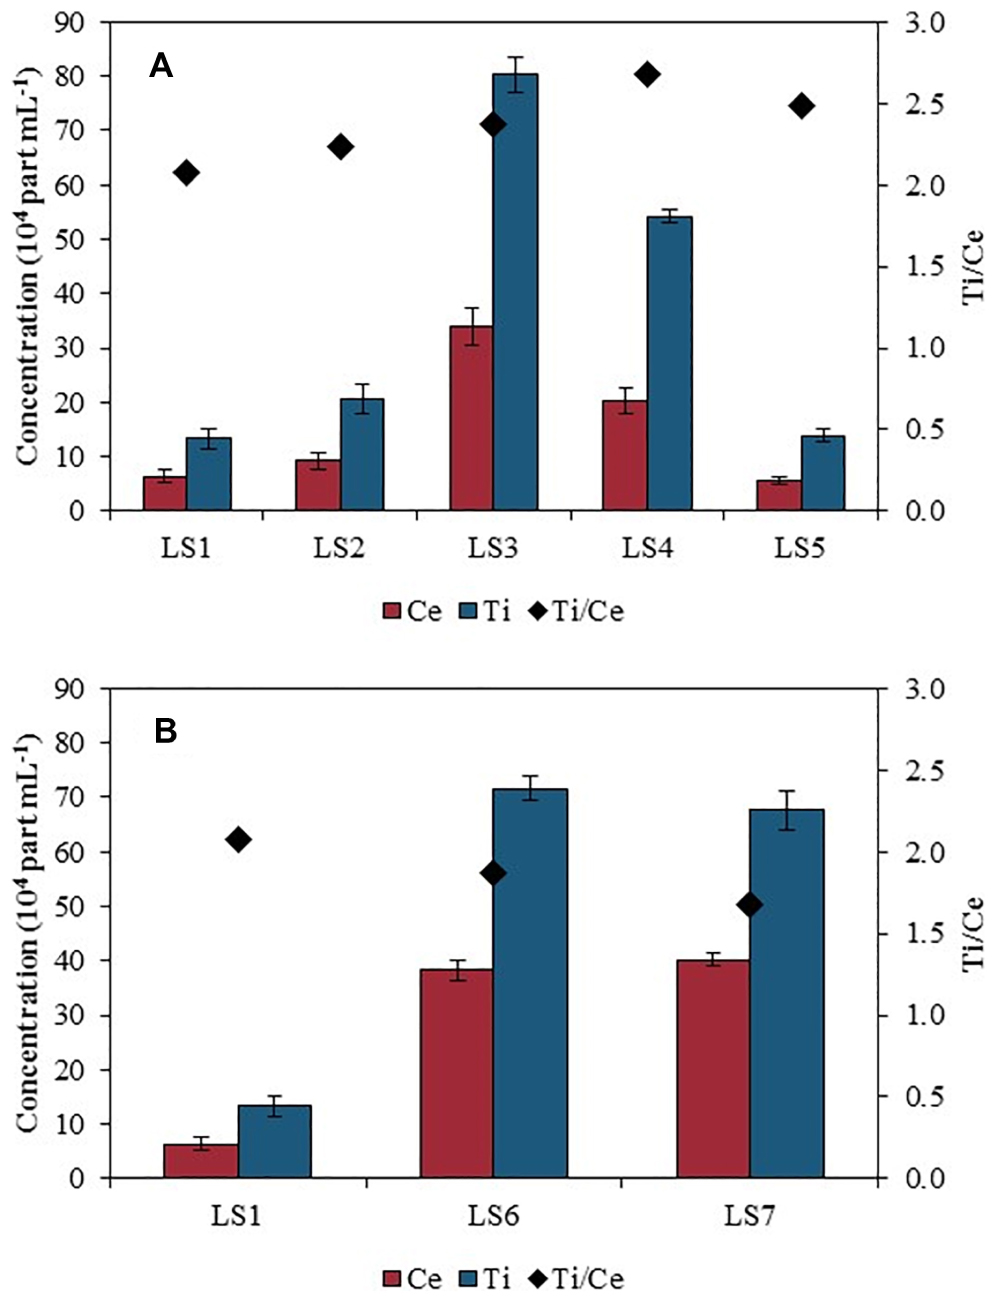
Figure 2. Ce and Ti particle number concentration (PNC, left-hand side axis) and Ti/Ce PNC ratio (right-hand side axis) in the river water measured by spICPMS along (A) Orleans city (LS1 to LS5) and (B) in the outdoor activities center (LS6 and LS7 compared with LS1).
The particle number concentration for Ce was measured at 6.4 ± 1.2 × 10⁴ part mL–1 containing Ce at LS1, upstream Orleans city (Figure 2A). It rose up to 33.9 ± 3.4 × 10⁴ part mL–1, at LS3, before decreasing down to 5.6 ± 0.7 × 10⁴ part mL–1, downstream the WWTP outlet (LS5). At LS6 and LS7 (Figure 2B), the particle number concentrations were high, similar to the concentration measured in LS3, with 38.3 ± 2.0 × 10⁴ part mL–1 in LS6 and 40.3 ± 1.0 × 10⁴ part mL–1 containing Ce in LS7.
A similar trend was obtained for Ti-bearing NPs with 13.4 ± 1.8 × 10⁴ part mL–1 measured at LS1, and an increased concentration at LS3 with 80.3 ± 3.4 × 10⁴ part mL–1. Downstream, the concentration decreased with 14.0 ± 1.1 × 10⁴ Ti-bearing part mL–1 detected, at LS5 (Figure 2A). Water samples collected at LS6 and LS7 contained 71.6 ± 2.1 × 10⁴ part mL–1 and 67.7 ± 3.6 × 10⁴ part mL–1 containing Ti, respectively (Figure 2B), which were significantly higher than the concentration found in the Loire River upstream section. The ratio of the particle number concentrations of Ti over Ce was also represented in Figure 2. The Ti/Ce ratio increased gradually downstream LS1, especially near LS4, but is lower in LS6 and LS7.
Making the assumption that particles were spherical and in oxidized states, spICPMS analysis for all sampling sites gave a CeO2NPs equivalent size for sphere distributions ranging from 24 nm to 70 nm (Figure 3). For TiO2NPs, the equivalent size for sphere distributions (Figure 4) ranged between 80 nm and 500 nm for all sampling sites.
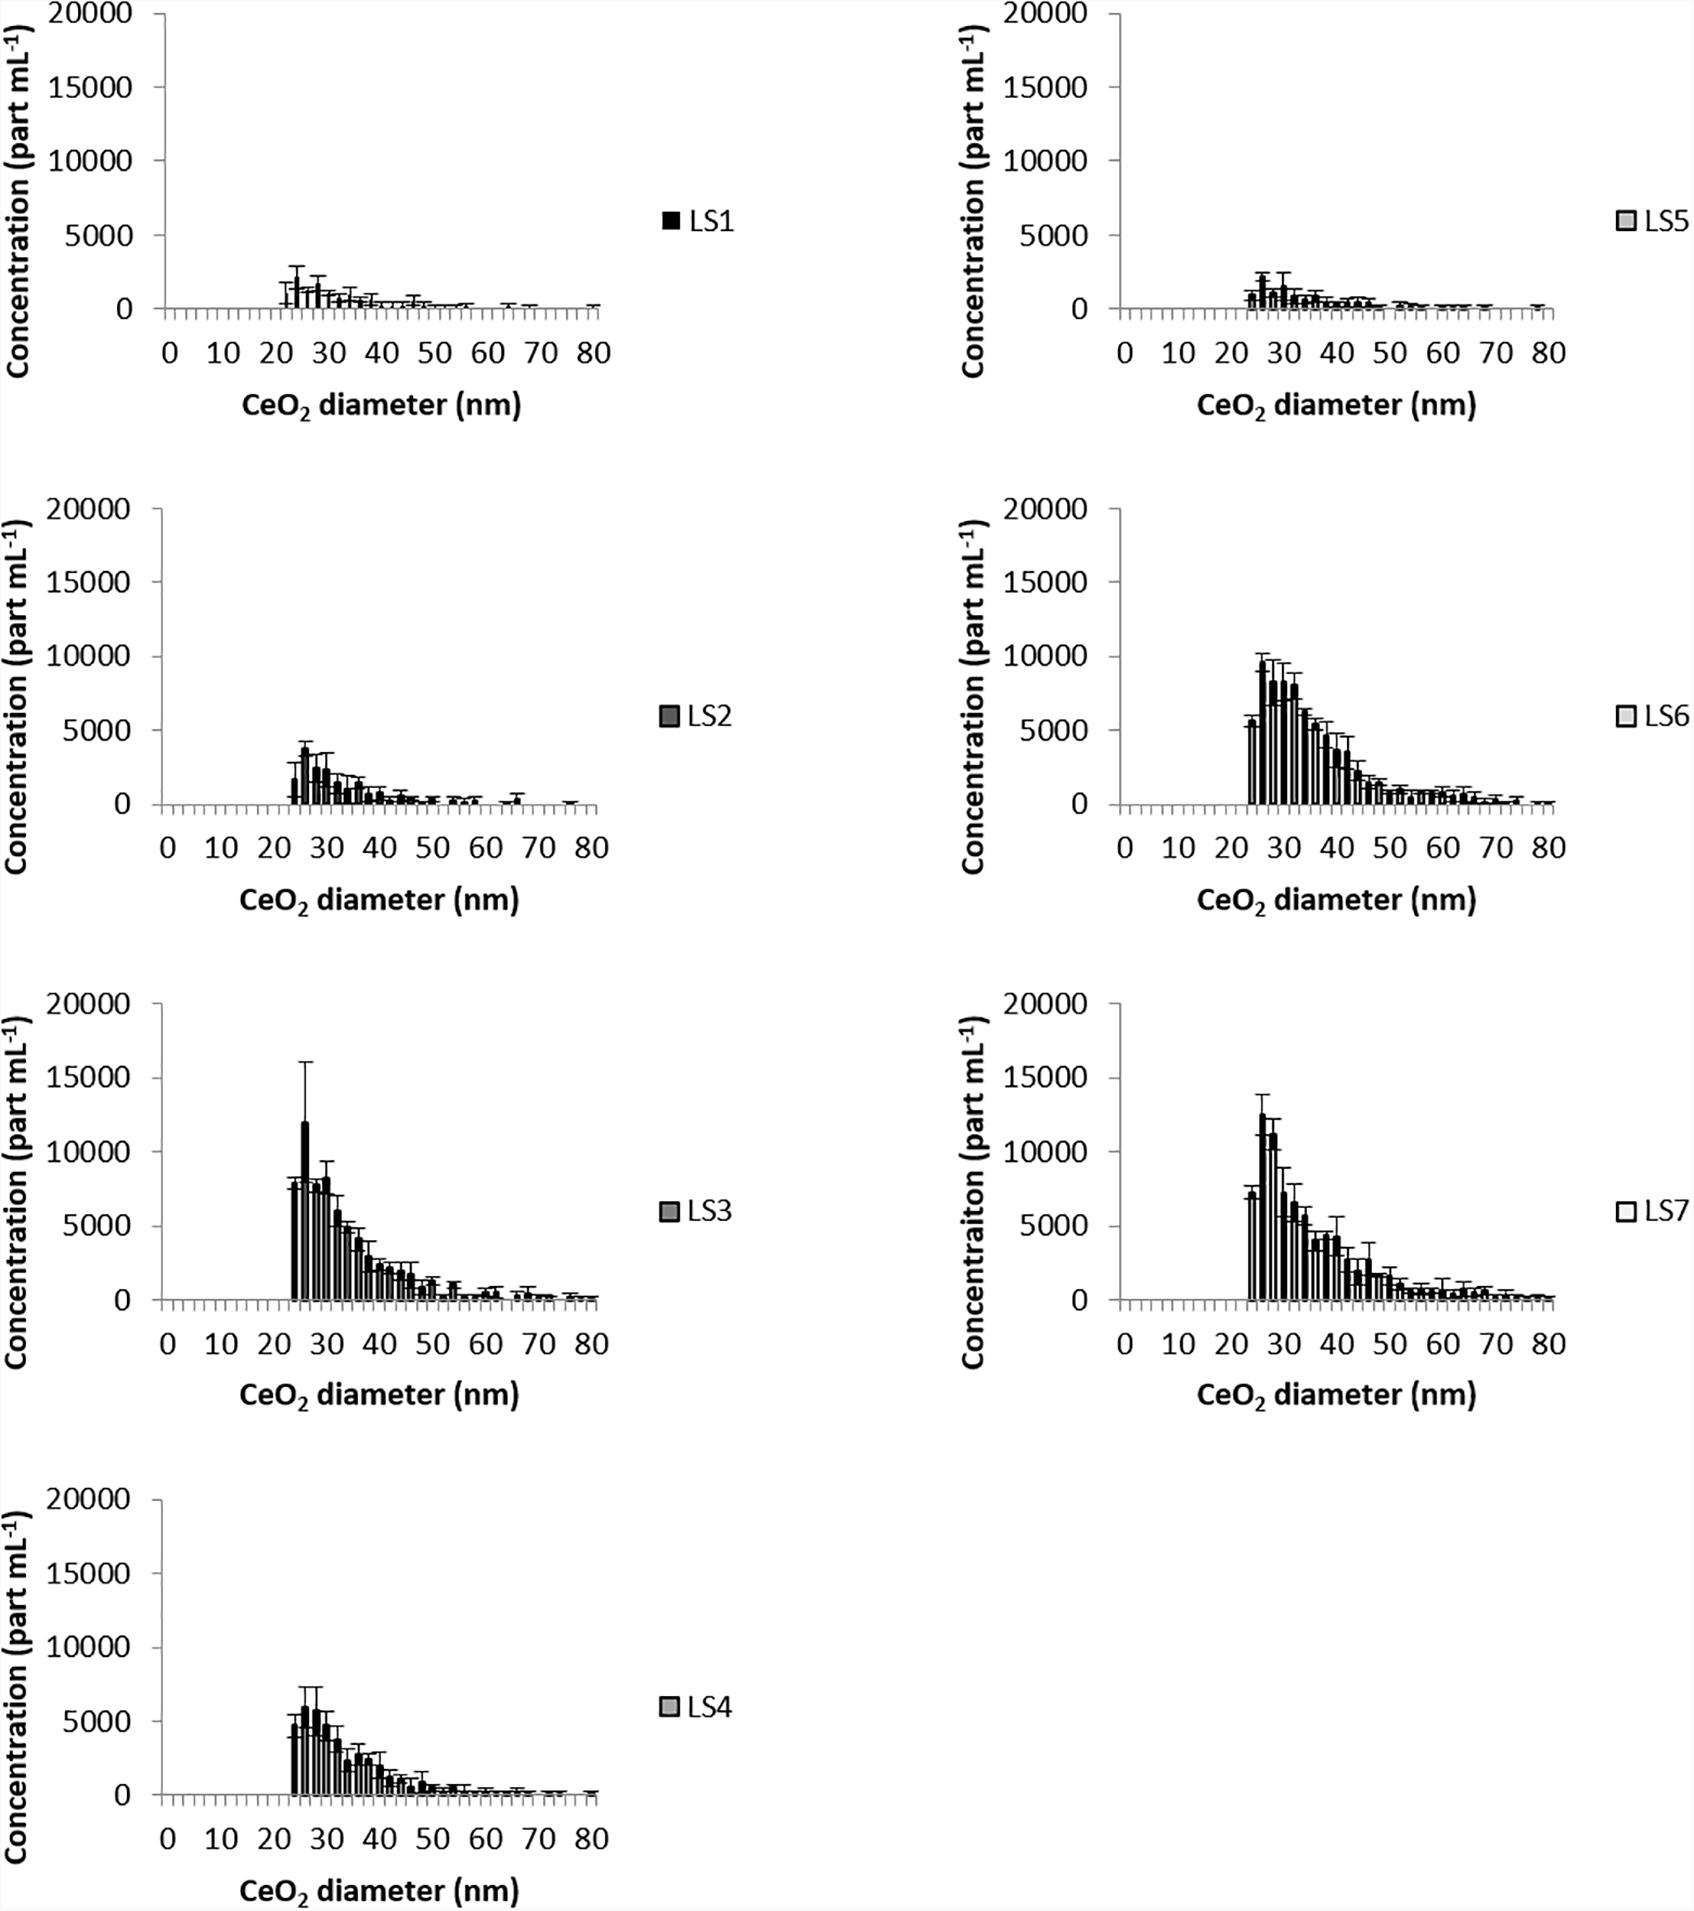
Figure 3. Size distribution of CeO2NPs in Loire River water samples.
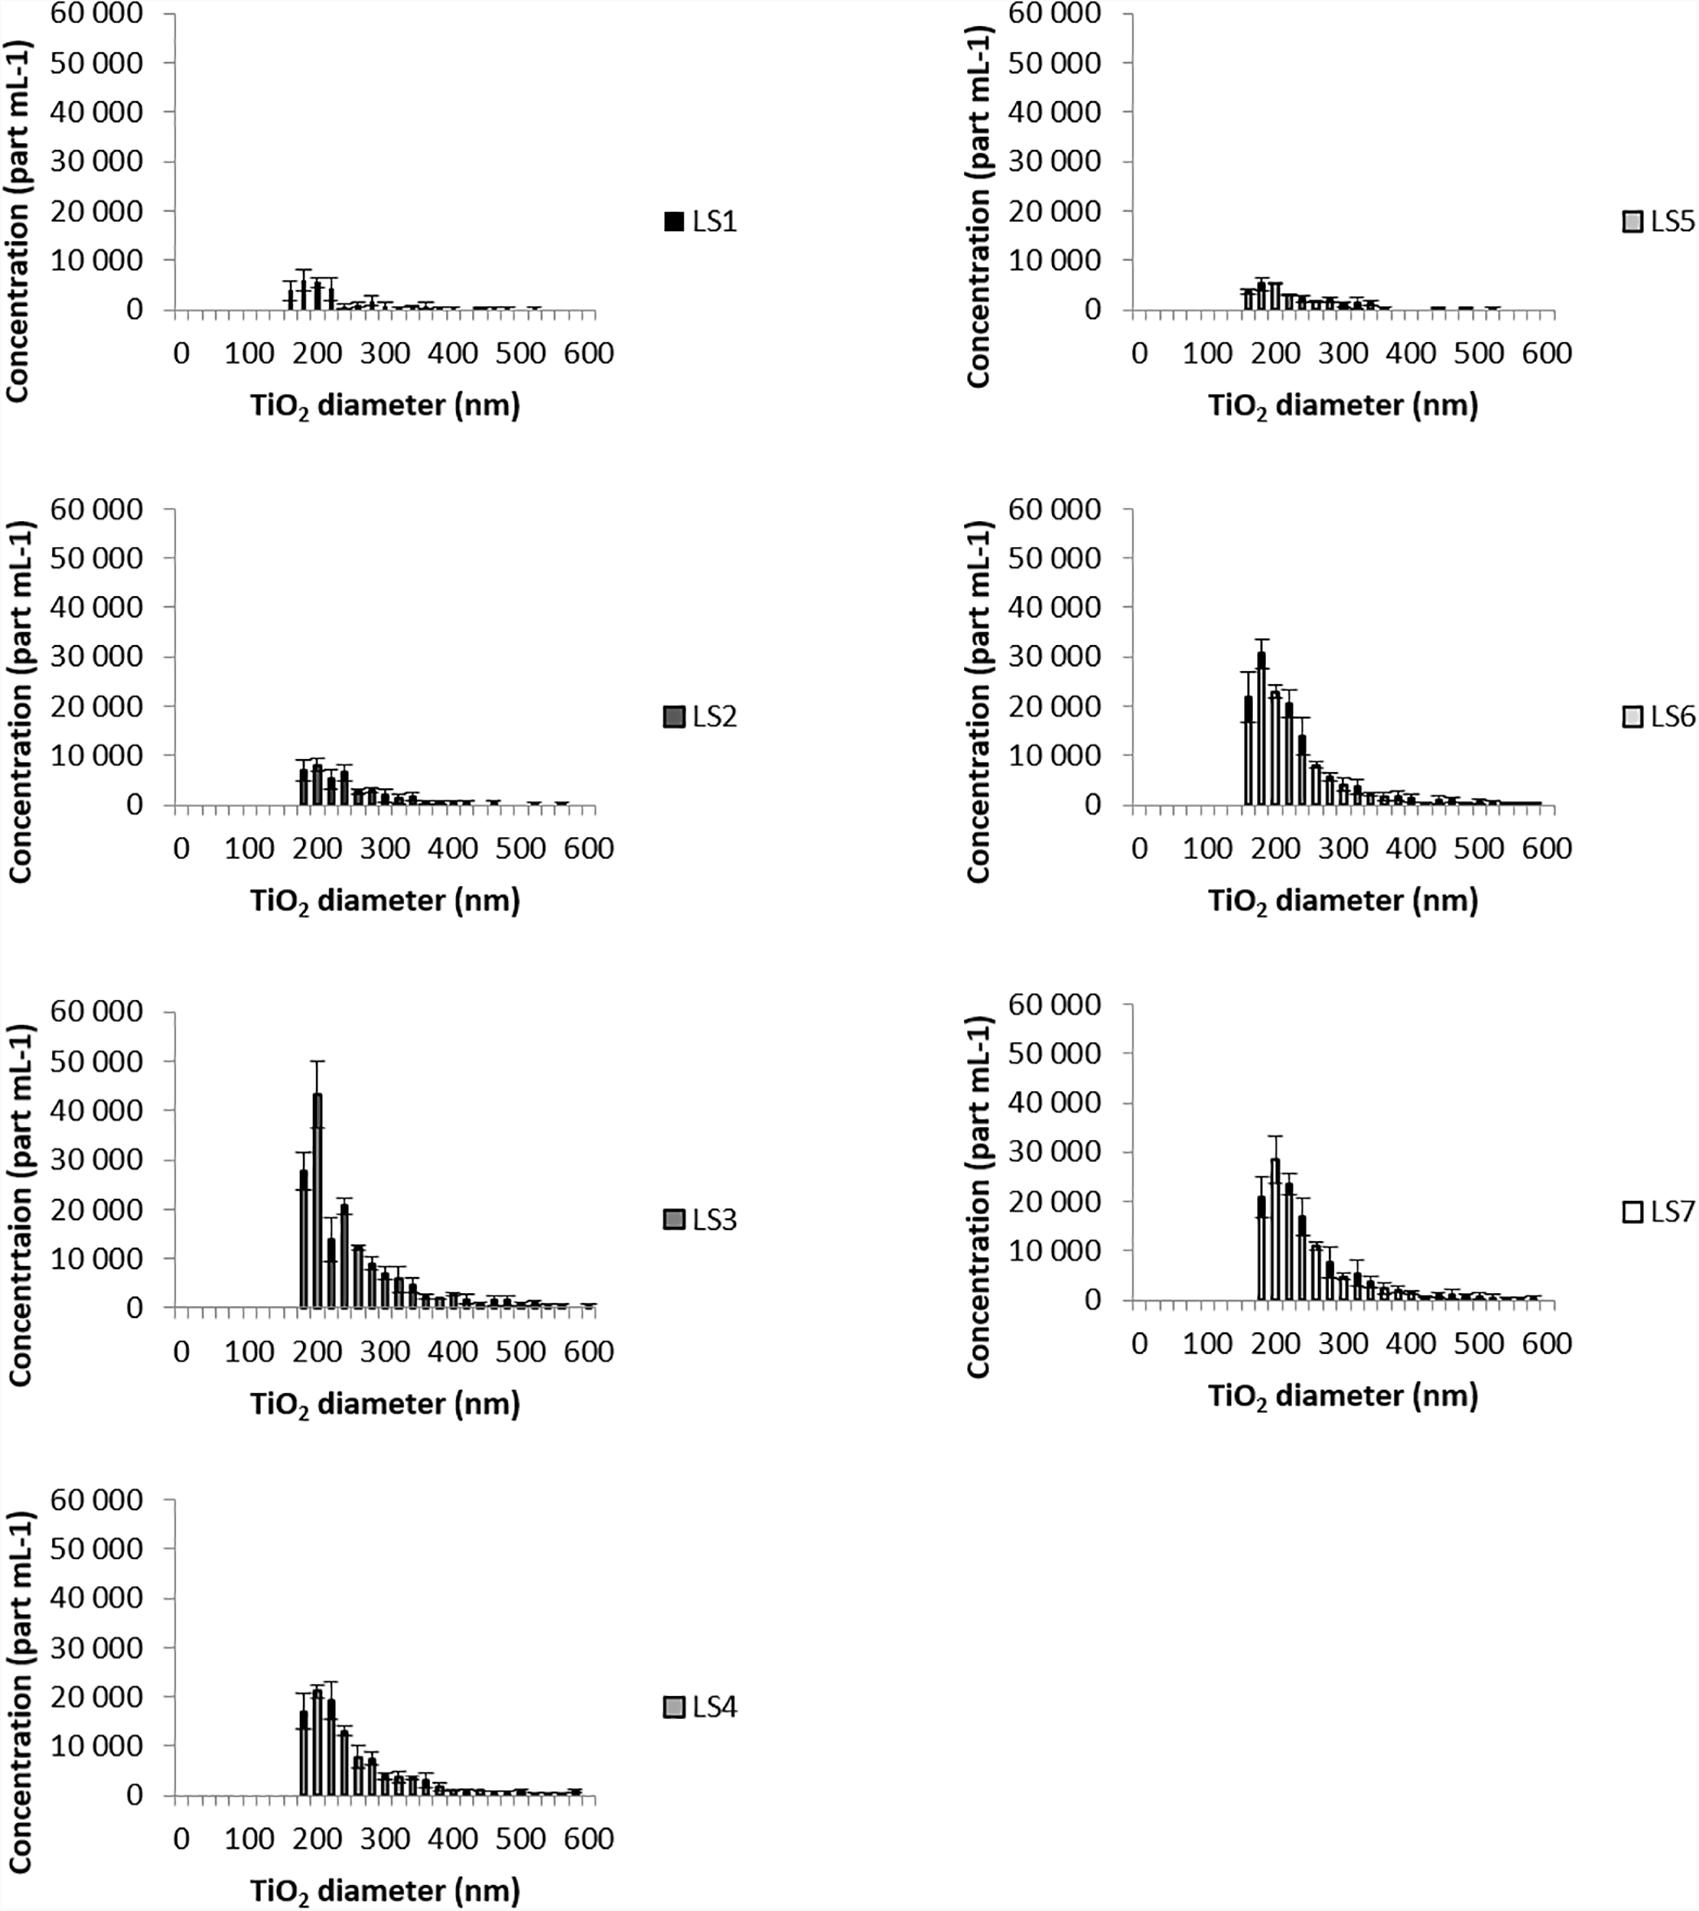
Figure 4. Size distribution of TiO2NPs in Loire River water samples.
Variation of Trace Elements Total Concentrations
Figure 5 shows the total concentrations (dissolved + particulate) of Ce and La measured in bulk samples after the acid digestion, at the different sampling sites from LS2 to LS5 in the Loire River (Figure 5A) and in the lake at LS6 and LS7 sampling sites, both compared to LS1 (Figure 5B).
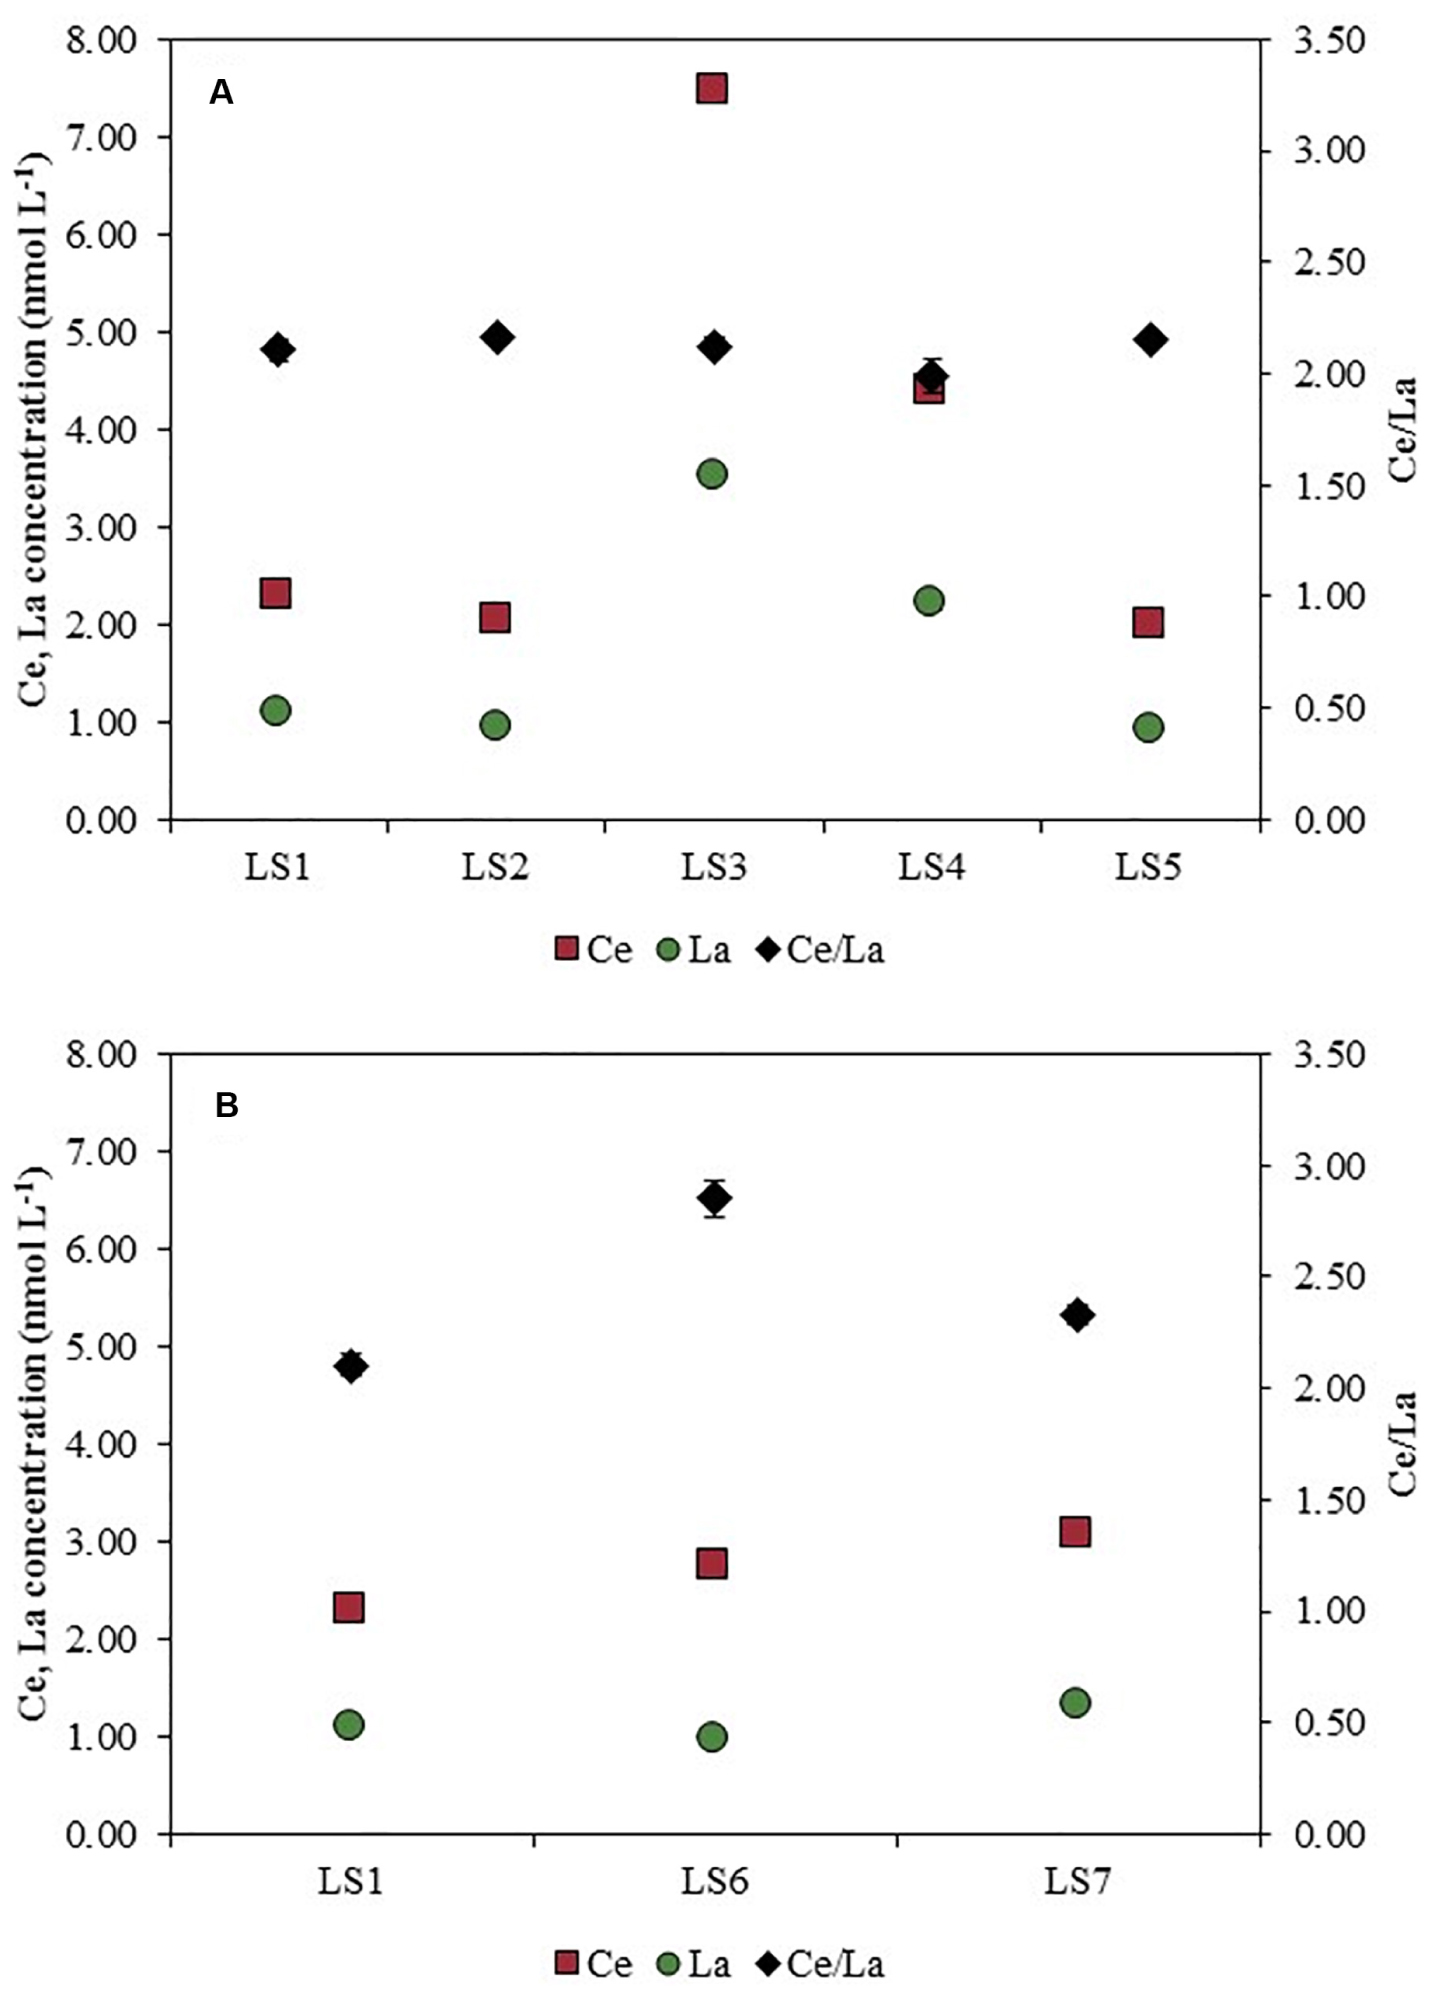
Figure 5. Total Ce and La concentrations (left-hand side axis) and Ce/La ratios (right-hand side axis) along (A) Orleans city (LS1 to LS5) and in (B) the outdoor activities center (LS6 and LS7 compared with LS1) after an acid digestion.
Ce concentration increased from LS1 (2.29 ± 0.04 nmol L–1) up to LS3 (7.48 ± 0.14 nmol L–1), and then decreased at LS5 (1.99 ± 0.01 nmol L–1). In the same way, La concentration rose up from LS1 (1.09 ± 0.02 nmol L–1) to LS3 (3.52 ± 0.02 nmol L–1). Then, the concentration decreased when reaching the downstream part of the studied area (0.92 ± 0.01 nmol L–1). Regarding LS6 and LS7 sampling sites (Figure 5B), Ce concentration also increased (∼3.00 ± 0.05 nmol L–1). On the contrary, La concentration measured in LS6 and LS7 remained approximately constant (∼1.30 ± 0.01 nmol L–1).
The variations of Al and Ti total concentrations along the Loire River are displayed in Figure 6. Similarly to Ce concentration, Ti concentration increased from LS1 to LS3 (0.10 ± 0.01 and 0.68 ± 0.01 μmol L–1, respectively) and then decreased downstream the Orléans city at LS5 (0.14 ± 0.00 μmol L–1). In the water samples, concentrations in Al were higher than Ti concentrations, but the trend observed along the river was similar: a lower value at LS1 site with 2.10 ± 0.05 μmol L–1, an increase in LS3 up to 18.05 ± 0.49 μmol L–1 and a decrease at LS5 site to 3.51 ± 0.06 μmol L–1. In LS6 and LS7 (Figure 6B), both Ti and Al display concentrations higher than in LS1, with 0.15 ± 0.01 μmol L–1 and 0.34 ± 0.01 μmol L–1 for Ti in LS6 and LS7, respectively, and with 3.36 ± 0.05 μmol L–1 and 10.36 ± 0.22 μmol L–1 for Al in LS6 and LS7, respectively.
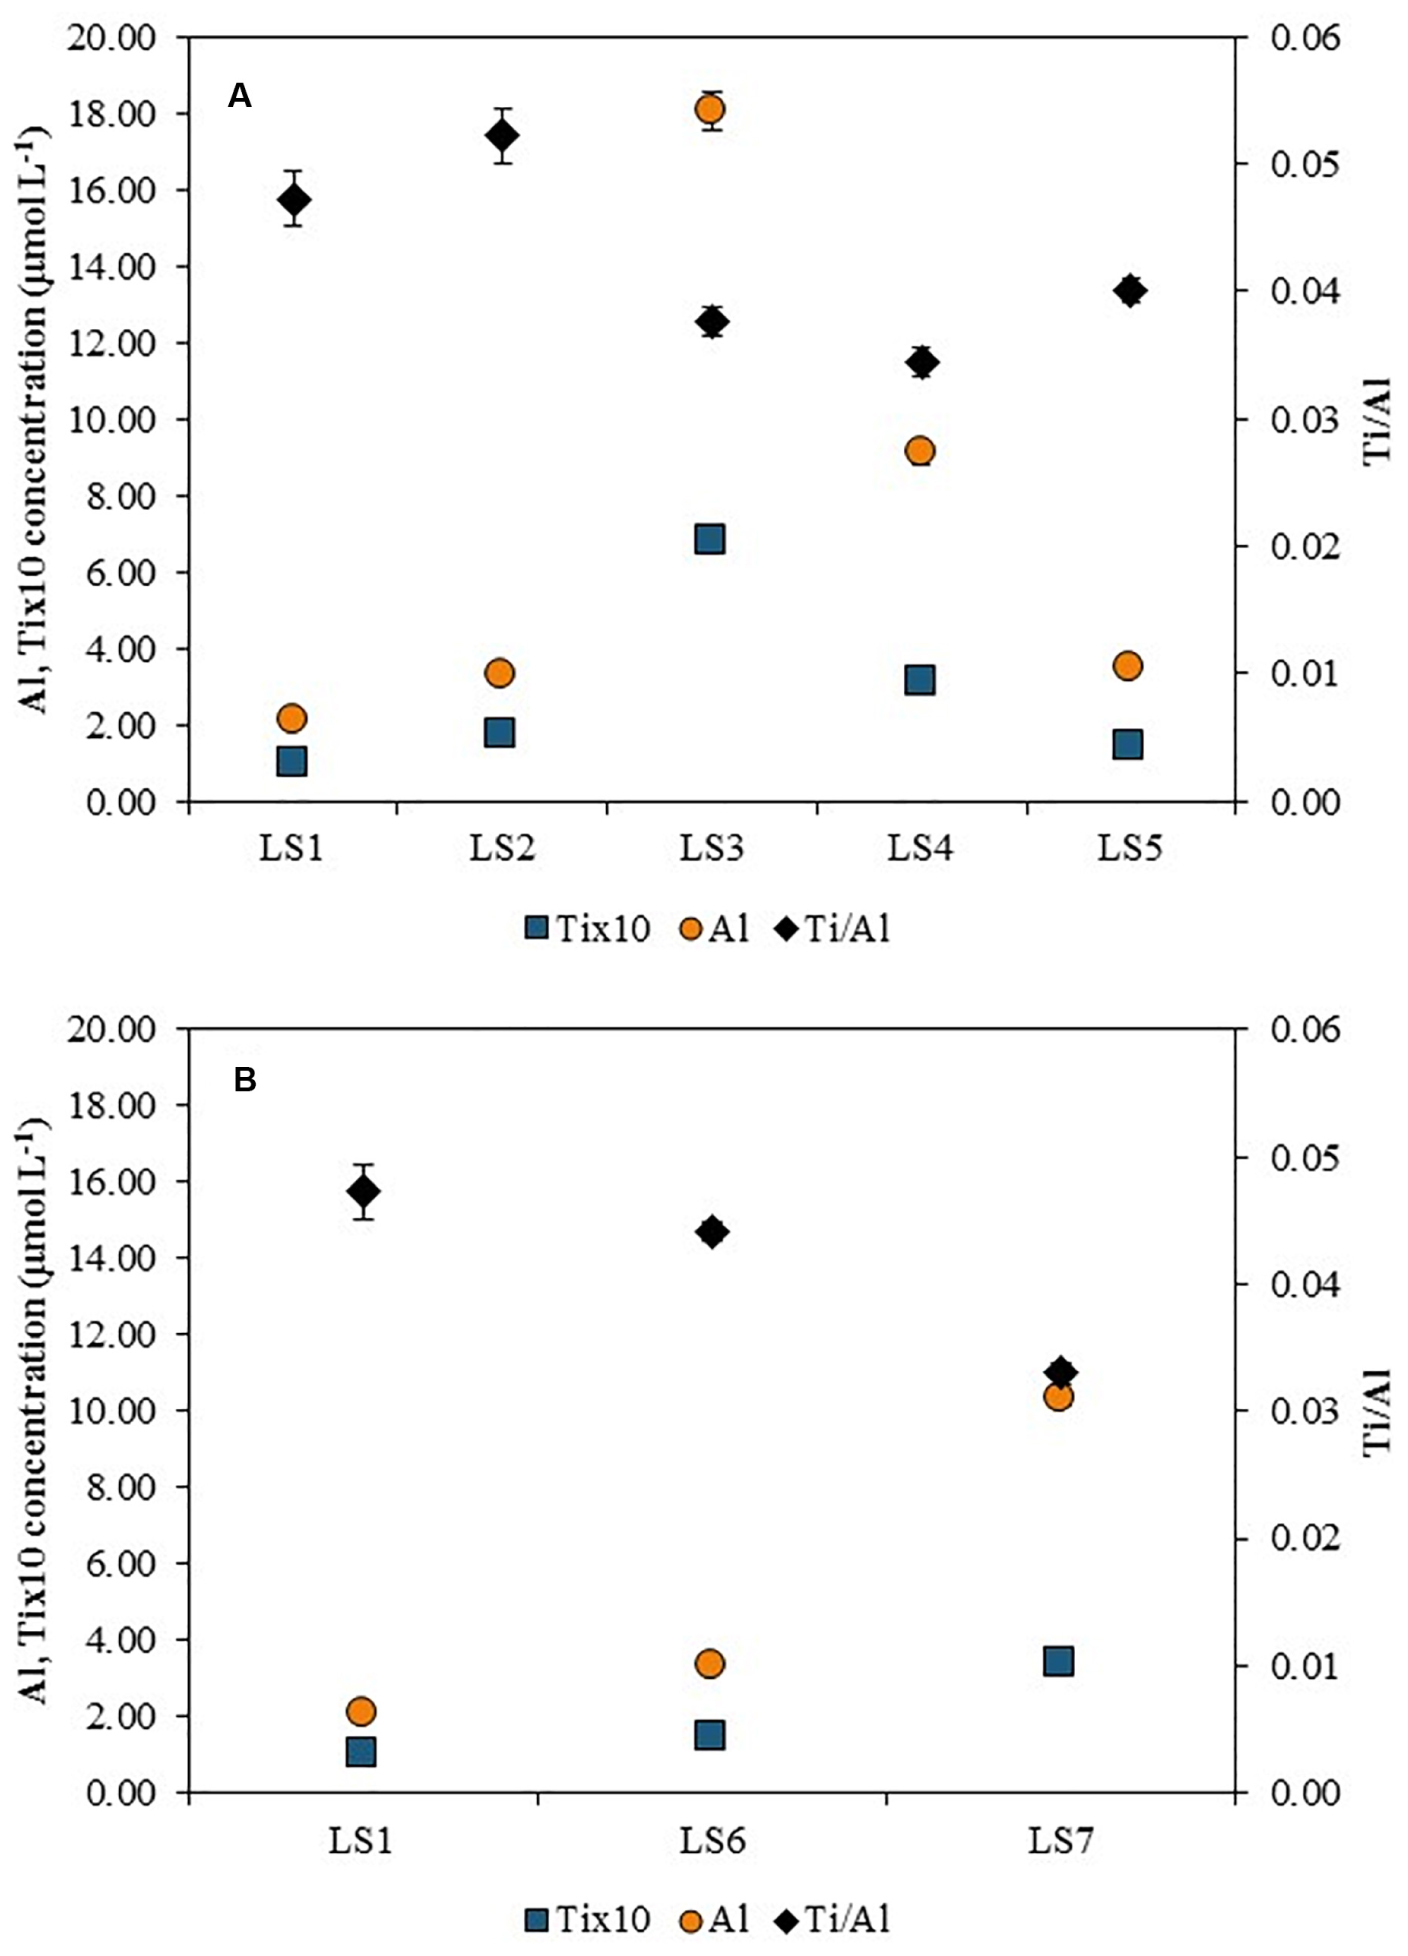
Figure 6. Total Al and Ti concentrations (left-hand side axis) and Ti/Al elemental ratios (right-hand side axis) along (A) Orleans city (LS1 to LS5) and in (B) the outdoor activities center (LS6 and LS7 compared with LS1) after an acid digestion.
FEG-SEM Characterization
Figure 7 shows the particles observed with FEG-SEM imaging and analyzed by EDS for chemical composition.
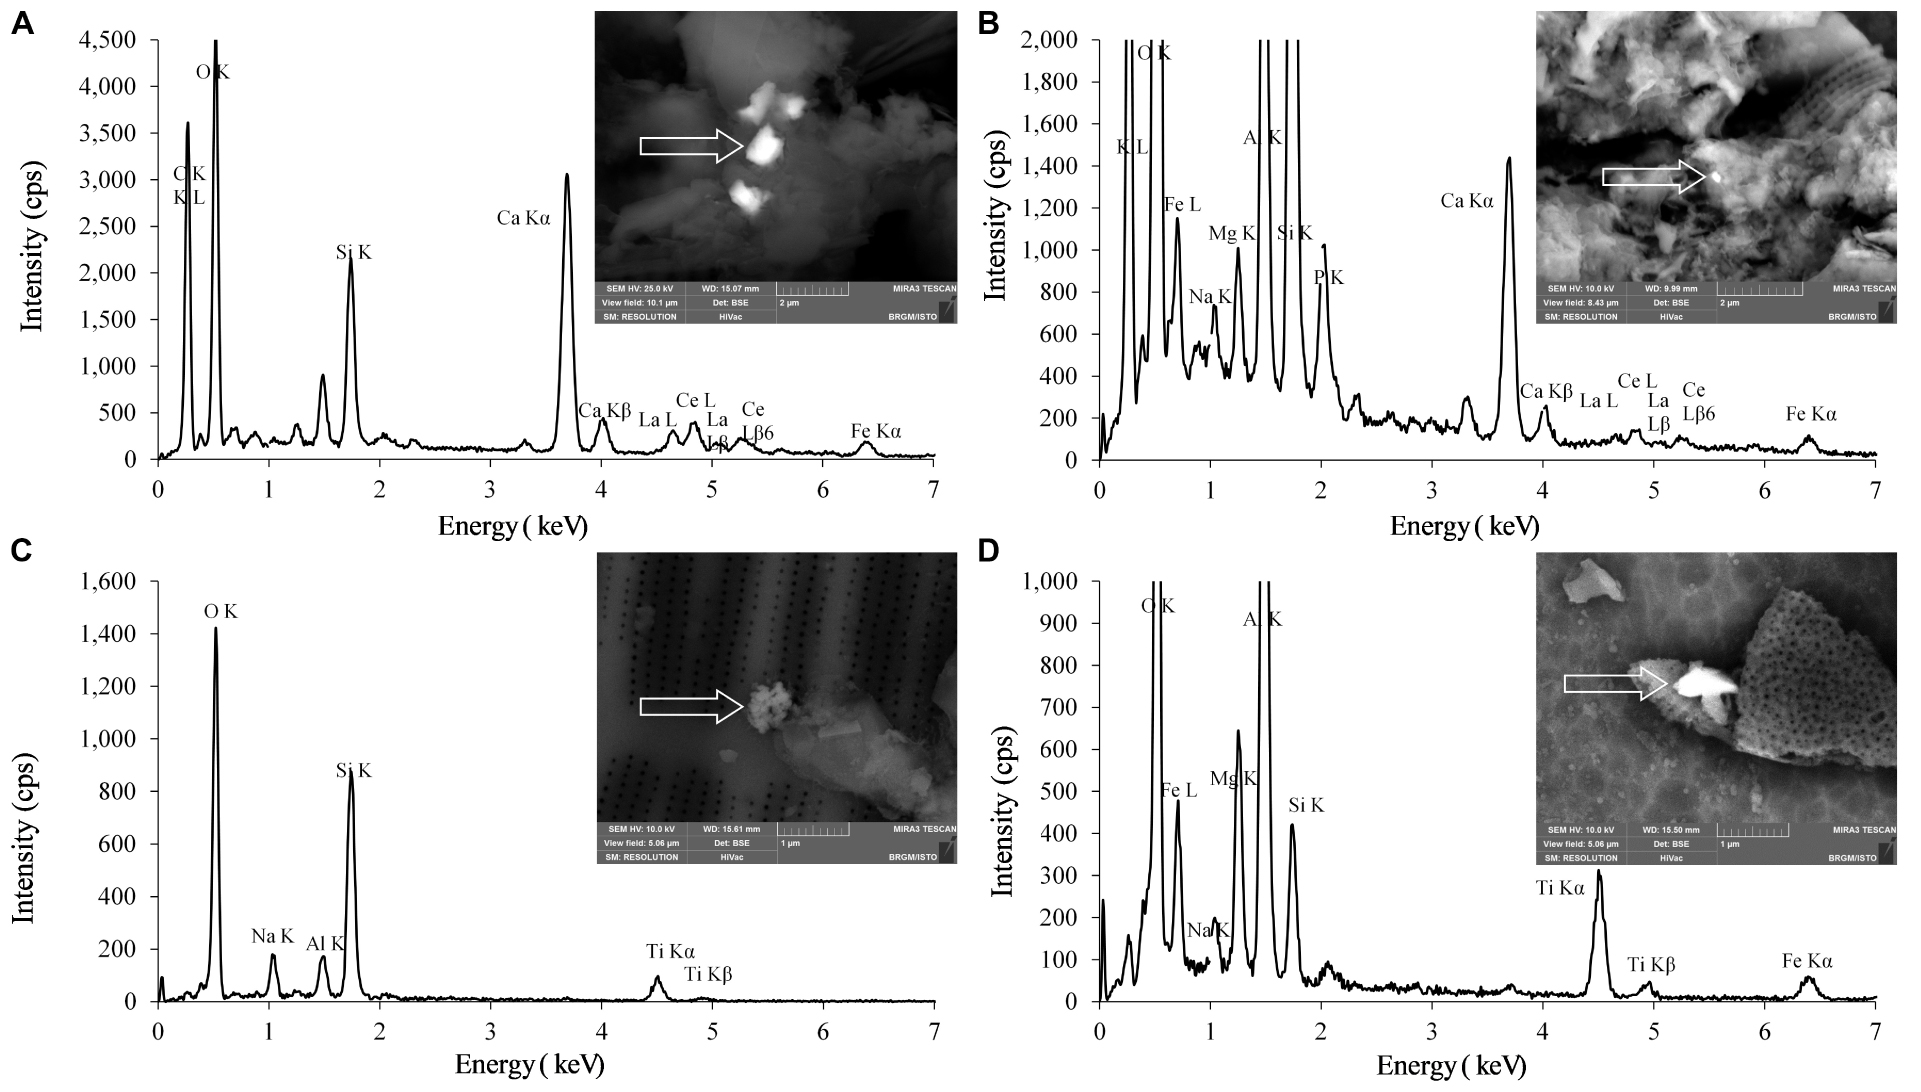
Figure 7. FEG-SEM pictures of particles containing Ce and Ti and the associated EDS spectra on different sampling sites (A) LS6, (B) LS7, (C) LS2, and (D) LS3.
At LS6 and LS7 sampling points, Ce-bearing particles were observed in the suspended matter. These particles displayed different sizes, typically ranging from 155 × 240 nm up to 850 × 1000 nm, as shown in Figures 7A,B for LS6 and LS7, respectively. It must be emphasized that these Ce-containing particles also contained some La, according to the EDS spectra. For all FEG-SEM observations (n = 56), sizes of the detected particles were bigger than the equivalent size for sphere distribution calculated by spICPMS.
Ti-bearing particles were observed in suspended matter of all the samples, as shown for the two sampling sites LS2 and LS3 in Figures 7C,D. In LS2, for example, an aggregate of NPs can be observed stick, or deposited, on the surface of a diatom. Actually, the aggregate was 560 nm large and 670 nm long and contained primary particles with sizes smaller than 100 nm. In Figure 7D (LS3), the Ti-bearing particles were usually larger (400 ± 50 nm) and longer (880 ± 50 nm). In addition to titanium, elements such as sodium, silicon, and iron were detected in the particles, as displayed in the EDS spectra. One has to notice that in each sample the detected NPs were aggregated or deposited onto larger structures such as mineral phases, and no individual NPs were observed in these samples.
Discussion
Detection of CeO2NPs and TiO2NPs in the Loire River
Ce and Ti-bearing particles were truly observed by SEM-EDS in the Loire River waters and the associated particle number concentrations (PNC) determined by single counting ICPMS. The spICPMS measurements show an increase of the PNC for both Ce and Ti in the LS3 sampling point area, downtown Orleans city, which is close to the WWTP outlet (Figure 2A). Besides, an increase of the particle number concentrations is also measured for both elements at LS6 and LS7 (Figure 2B), as compared with the lower values at the upstream point (LS1). However, in spite of these high PNC, particles were rarely observed by SEM-EDS at the nanoscale size and more frequently at the microscale. This is partly explained by the occurrence of large mineral phases in SPM that can hide the NPs dispersed on the sample. In addition, the particles seem to undergo heteroaggregation with these mineral phases. This can either happen naturally in the environment or be an artifact caused by the ethanol dispersion and drying process used for sample preparation. Additional tries were performed by direct deposition of bulk river water onto the stub (data not shown), in order to get rid of this potential artifact, but the formation of carbonates during the drying process makes the NPs detection even harder. Yet, more “nano” TiO2 particles should be observed by SEM-EDS, since the equivalent size for sphere distributions (Figure 4) measured by spICPMS ranged between 80 nm and 500 nm for all sampling sites. This suggests that the PNC of TiO2NPs in the river water is too low regarding the SPM content in river water, and thus inadequate for SEM-EDS. The spICPMS results display a CeO2NPs equivalent size for sphere distributions ranging from 24 nm to 70 nm (Figure 3) and could not provide information about particles bigger than 100 nm, as those observed in the samples by SEM-EDS.
The size distributions of CeO2NPs and TiO2NPs (Figures 3, 4) assessed with spICPMS are not Gaussian, as observed in most of the spICPMS studies where standards of monodispersed NPs are used (Laborda et al., 2011; Mitrano et al., 2012). In the present study, all the sampling sites display the same long tailed NPs size distribution. At least two populations of size can be observed for Ti in some samples (notably, LS3 sampling site), with equivalent size for spherical distributions from 80 nm to 200 nm and from 200 nm to 500 nm. These values are in the same order of magnitude than the ones determined by Lee et al. (2014) where the minimum equivalent sizes for sphere detected in a river water sample were estimated at 33 nm and at 186 nm, for CeO2 and TiO2, respectively. The instrument settings and 48Ca-48Ti interference, that prevent using the most abundant Ti isotope, are responsible for the high minimum equivalent size for sphere values and also for the shape of the diagram determined by spICPMS (Gondikas et al., 2014; Lee et al., 2014; Reed et al., 2017). The long tail observed for size distributions is also due to the occurrence of larger particles in the samples, as seen in the study of Reed et al. (2012) where the authors analyzed polydispersed samples by spICPMS. The hypotheses made during spICPMS data treatment (spherical NPs and in oxidized state) imply the indirect assumption that particles analyzed are anthropogenic. However, this latter hypothesis is weakened by SEM-EDS analyses that mostly displayed particles containing impurities and rather mixed with other natural phases: EDS analysis volume is typically larger than the particles size, and could have interacted with the surrounding substrate during measurements, thus showing additional elements that are not truly present in the analyzed NPs.
One question is the relative stability of the two types of NPs, which can be afforded through the Ti/Ce particle number concentration ratio and compared with LS1 upstream point. At LS1, the ratio is equal to 2. Then, Ti/Ce ratio rises up to 2.5 near LS3 showing an important contribution of Ti rather than Ce from the WWTP outlet. Conversely, as comparison with LS1 value, Ti/Ce ratio decreases at LS6 and LS7 (1.5) which indicates a major contribution of Ce from the outdoor activities center.
Influence of the Water Chemistry on the NPs Stability
Both the natural organic matter (NOM) and the ionic strength can play an important role on the stability of the NPs. Indeed, the NPOC concentrations were quantified at 4 mg L–1 showing the occurrence of NOM in the river waters. Besides, the NOM in the river can stabilize the ENPs released in the environment. This is the case of TiO2, ZnO, and CeO2NPs which aggregates are stabilized at 300 nm with the occurrence of NOM in mesocosm freshwater (Keller et al., 2010). This heteroaggregation NPs-NOM can explain the high size value found in spICPMS and in SEM-EDS, especially for Ti-bearing particles. In another study, NOM stabilizes CeO2NPs (from 2.2 mgC L–1 in an algal medium) and prevents the formation of larger aggregation of the NPs (>1 μm; Van Hoecke et al., 2011). Moreover, CeO2NPs are supposed to be insoluble at pH higher than 7 (Dahle et al., 2015). In the case of the Loire River, the studied CeO2NPs are supposed to be insoluble and are probably aggregated with sizes higher than 100 nm. They could not be detected by spICPMS but some particles with micrometer sizes were measured by SEM-EDS.
Contrary to LS3 water chemistry, the results show that in the Loire River, a particular chemistry is observed at LS6 and LS7 sampling points (Supplementary Table S1). For instance, ionic strength is determined at 2.50 mmol L–1 in LS3 water sample, which is similar to LS1 sampling point (2.65 mmol L–1) but the values are higher for LS6 and LS7 (2.84 mmol L–1 and 2.97 mmol L–1, respectively). The same observation can be done for the pH and the dissolved oxygen values. So, even if the outdoor activities center water comes from the Loire River, the water chemistry is particular at these sampling points. The ionic strength plays an important part in the stabilization state of the ENPs. Indeed, fast aggregation of TiO2NPs can happen with an increase of the ionic strength (variation of the concentration of CaCl2 from 0.01 to 0.1 mM; Thio et al., 2011). This could suggest that in the Loire River, TiO2NPs are mostly aggregated in homoaggregation process. In a more realistic case, Gondikas et al. (2014) measured the hydrodynamic sizes of a TiO2 cosmetic grade at mg L–1 level in MilliQ water, filtered lake water and unfiltered lake water as a function of time. They also suggested that TiO2NPs undergo fast aggregation in the Danube water. However, for all the cited studies, the concentrations used in the experiment are higher than the one found in the environment (mg L–1 instead of μg L–1 or ng L–1) which can have an importance on the behavior of the NPs studied in aquatic systems. Yet, homoaggregation is unlikely to happen in the Loire River and it was not observed in the SEM-EDS analyses but a heteroaggregation with mineral phases or NOM could occur more often. So, TiO2NPs are expected to be aggregated with mineral phases since the aquatic system is relatively close to the Danube water.
Attempt for the CeO2NPs and TiO2NPs Origin Determination
The use of elemental ratios is the key for understanding the potential origins of these NPs (Figures 5, 6). Indeed, Ce and La are often associated in the environment (Montaño et al., 2014; Dahle and Arai, 2015). For instance, Ce and La are present in natural minerals such as monazite [(Ce, La, Nd, Th, PO4)] and natural NPs can originate from the weathering of such minerals. This association could be seen with the EDS spectra (Figure 7) where two particles among several analyzed were measured at different sizes but suggested that the particles are mainly from a natural origin. In Figure 5A, when compared to LS1 (Ce: 2.29 ± 0.04 nmol L–1 and La: 1.09 ± 0.02 nmol L–1), the total concentrations of both Ce (7.48 ± 0.14 nmol L–1) and La (3.52 ± 0.02 nmol L–1) increased at LS3. The elemental ratio of Ce/La is also estimated at 2.10 ± 0.05 for LS1. From LS1 to LS5, the elemental ratios are constant: an averaged value of 2.11 is found for these sampling sites. Consequently, along the Loire River, in Orleans city, several origins of Ce-bearing particles can’t be distinguished and only a natural origin for CeO2NPs is not excluded.
For LS6 and LS7 sampling sites, only the total concentration of Ce increased (2.76 ± 0.02 nmol L–1), whereas the La total concentration decreased (0.97 ± 0.03 nmol L–1). Moreover, the dissolved concentrations of Ce (0.03 ± 0.00 nmol L–1) and of La (0.02 ± 0.00 nmol L–1) are insignificant as comparison with the total concentrations of these elements showing that an important contribution originates from the particles (Supplementary Table S2). Besides, the elemental ratio of Ce/La rises up to 2.85 ± 0.08 in LS6 and reaches 2.33 ± 0.04 in LS7. At these sampling points, the high Ce concentration and the high Ce/La elemental ratio show the occurrence of anthropogenic Ce-bearing particles such as CeO2NPs. This anthropogenic source can be explained by the cars present in the free access parking lot at the outdoor activities center where the NPs can originate from the catalytic converters, and from fuel additive (Piccinno et al., 2012) by indirect airborne contamination.
In Figure 6, for titanium, Ti/Al elemental ratio is studied because TiO2 ENPs are often coated with an alumina layer to prevent TiO2 ENPs to become harmful for our health, when incorporated into sunscreens (Serpone et al., 2007; Virkutyte et al., 2012). Actually, an acid digestion was also performed on three different TiO2 ENPs and the Ti/Al elemental ratios were found equal to 4.1 ± 0.1, 5.3 ± 0.1, and 8.0 ± 0.1, consistently with the higher Ti content in the core relatively to the Al content in the coating.
Al total concentrations are higher than Ti total concentrations because of the important background of Al in the Loire River waters. An important increase of Al concentration is observed near LS3 (18.05 ± 0.49 μmol L–1) which leads to a decrease of the Ti/Al elemental ratio (0.038 ± 0.001). The LS3 elemental ratio value is lower than the one calculated at LS1 (0.047 ± 0.002), which indicates an important release of Al at this sampling point, probably due to the WWTP outlet, where Al could be used as a flocculent in the WWTP process. Besides, the dissolved concentrations of Al and of Ti are negligible for all sampling points (Supplementary Table S2). For instance, at LS3, 0.30 ± 0.00 μmol L–1 are measured for Al dissolved concentration and 5.79 ± 0.05 nmol L–1 for Ti dissolved concentration. Since Al concentration is very high in LS3 sample water, the occurrence of Ti NPs is hidden while using these elemental ratios. Indeed, the spICPMS results show, at this sampling point, the highest Ti-bearing nanoparticles concentration in the Loire River (80.3 ± 3.4 × 10⁴ part mL–1).
The measured Ti/Al elemental ratios are very low in LS6 (0.044 ± 0.001) and LS7 (0.033 ± 0.001) sampling sites even if an increase of the particle number concentrations is measured (LS6: 71.6 ± 2.1 × 10⁴ part mL–1 and LS7: 67.7 ± 3.6 × 10⁴ part mL–1). Here again, the occurrence of Ti-bearing nanoparticles is not excluded due to the high Al concentrations and the low Ti/Al ratios. However, the same order of magnitude has been observed in the Danube recreational lake with Ti/Al elemental ratios ranging from 0.04 to 0.055, during the bathing season (Gondikas et al., 2014) which is close to the results observed in the Loire River. Besides, as suggested by Gondikas et al., other elemental ratios can be used to assess the sources of the studied NPs such as Ti/V or Ti/Y because they can be associated with Ti in geogenic sample. In Gondikas et al. study, in the summer, 14.0 ± 4.8 and 182 ± 20 were calculated for Ti/V and Ti/Y ratios, respectively. By using these elemental ratios in the Loire River (Table 1), Ti/V ratio is the highest of all sampling points for LS3 sampling point, with 17.39 ± 0.27 value which is in the same order of magnitude than the ratio found in the Danube recreational lake (14.0 ± 4.8).
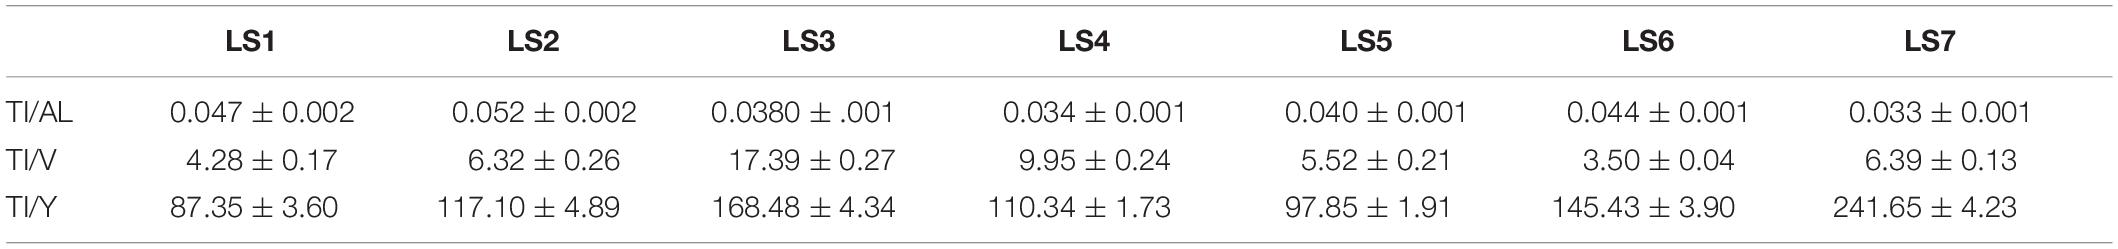
Table 1. Elemental ratios of Ti over Al, V, and Y in the digested bulk samples.
For Ti/Y, the ratios are also in the same order of magnitude than the one found in the Danube recreational lake. In the Loire River, two major increases of the elemental ratio were seen in LS3 (168.48 ± 4.34) and LS7 (241.65 ± 4.23), suggesting an anthropogenic origin of the NPs in these two sampling points, probably due to the use of sunscreens during this summer but also probably due to the whitening process near the WWTP outlet.
Conclusion
The occurrence of CeO2NPs and TiO2NPs was determined with the use of spICPMS and FEG-SEM imaging at relevant environmental concentrations, displaying the NPs in the Loire River with different equivalent size for sphere distributions (CeO2: 24 nm to 70 nm; TiO2: 80 nm to 500 nm). The use of elemental ratios (Ce/La) gave indications on the origins of the NPs, whether the NPs originated from natural process or from anthropogenic activities but it was not source-specific: only assumptions on the NPs origins could be made. Indeed, near the WWTP outlet, the occurrence of natural CeO2NPs was determined (Ce/La elemental ratio stayed constant) whereas in the outdoor activities center, CeO2NPs sources seemed to be anthropogenic since Ce/La elemental ratios increased, due to the cars in the parking lot. For TiO2NPs, the origins could not be assessed with the use of Ti/Al ratios, due to the high concentration of Al in the Loire River, hiding the occurrence of TiO2NPs in the river. Instead, Ti/V and Ti/Y were assessed to complete the study showing an anthropogenic impact coming from TiO2NPs (potentially related to the use of sunscreens during the summer and to the whitening process for the WWTP outlet). NPs containing Ce and Ti may also undergo heteroaggregation with larger mineral phases, which could also hide the occurrence of individual NPs in FEG-SEM analyses. Further investigations still need to be done on the other compartments of Earth such as the soils or the sediments to better characterize and understand the NPs cycle at relevant environmental concentrations. Moreover, other techniques should be used such as the single-counting Inductively-Coupled Plasma Time-of-Flight Mass Spectrometer (spICP-ToF-MS) method that allows detecting several elements in the same particle to better differentiate the natural NPs from the ENPs and determine their origins without much assumption.
Data Availability Statement
The datasets presented in this study can be found in online repositories. The names of the repository/repositories and accession number(s) can be found in the article/ Supplementary Material. The remaining data will be made available on request to the authors.
Author Contributions
KP was in charge of the sampling, analyses, and writing, and supervised and guided by MT and GW for spICPMS and MEB-FEG, respectively. YS conceived the presented idea, coordinated, and supervised the whole work with the help of MB and HP. XB and AG helped them supervising the project on the MEB-FEG and natural systems, respectively. All the authors discussed and wrote the final manuscript.
Funding
This research project “QUANTINANO” was fully supported by the Bureau de Recherche Géologique et Mini re (BRGM) and Institut de Physique du Globe de Paris (IPGP) under the convention No. DAF/JAC/JUR/AS/no. 2013/422. Part of this work was supported by the IPGP multidisciplinary program PARI and by Paris IdF region SESAME Grant no. 12015908 and the ANR-18-IDEX-0001, IdEx Université de Paris.
Conflict of Interest
The authors declare that the research was conducted in the absence of any commercial or financial relationships that could be construed as a potential conflict of interest.
Acknowledgments
Our thanks go to Ms. Laure Cordier for the assistance she provided during various multi-elemental analyses.
Supplementary Material
The Supplementary Material for this article can be found online at: https://www.frontiersin.org/articles/10.3389/fenvs.2020.00141/full#supplementary-material
References
Bi, X., Lee, S., Ranville, J. F., Sattigeri, P., Spanias, A., Herckes, P., et al. (2014). Quantitative resolution of nanoparticle sizes using single particle inductively coupled plasma mass spectrometry with the K-means clustering algorithm. J. Anal. At. Spectrom. 29, 1630–1639.
Camenen, B., Grabowski, R. C., Latapie, A., Paquier, A., Solari, L., and Rodrigues, S. (2016). On the estimation of the bed-material transport and budget along a river segment: application to the middle loire river. France. Aquat. Sci. 78, 71–81. doi: 10.1007/s00027-015-0442-3
Cary, L., Pauwels, H., Ollivier, P., Picot, G., Leroy, P., Mougin, B., et al. (2015). Evidence for TiO2 nanoparticle transfer in a hard-rock aquifer. J. Contam. Hydrol. 179, 148–159. doi: 10.1016/j.jconhyd.2015.06.007
Cornelis, G., and Hassellöv, M. (2014). A signal deconvolution method to discriminate smaller nanoparticles in single particle ICP-MS. J. Anal. At. Spectrom. 29, 134–144. doi: 10.1039/c3ja50160d
Dahle, J., and Arai, Y. (2015). Environmental geochemistry of cerium: applications and toxicology of cerium oxide nanoparticles. Int. J. Environ. Res. Public Health 12, 1253–1278. doi: 10.3390/ijerph120201253
Dahle, J. T., Livi, K., and Arai, Y. (2015). Effects of pH and phosphate on CeO2 nanoparticle dissolution. Chemosphere 119, 1365–1371. doi: 10.1016/j.chemosphere.2014.02.027
De, M., Ghosh, P. S., and Rotello, V. M. (2008). Applications of nanoparticles in biology. Adv. Mater. 20, 4225–4241.
Degueldre, C., and Favarger, P. Y. (2003). Colloid analysis by single particle inductively coupled plasma-mass spectroscopy: a feasibility study. Colloids Surf. APhysicochem. Eng. Asp. 217, 137–142. doi: 10.1016/s0927-7757(02)00568-x
Degueldre, C., and Favarger, P. Y. (2004). Thorium colloid analysis by single particle inductively coupled plasma-mass spectrometry. Talanta 62, 1051–1054. doi: 10.1016/j.talanta.2003.10.016
Degueldre, C., Favarger, P. Y., and Bitea, C. (2004). Zirconia colloid analysis by single particle inductively coupled plasma–mass spectrometry. Anal. Chim. Acta 518, 137–142. doi: 10.1016/j.aca.2004.04.015
Degueldre, C., Favarger, P. Y., Rosse, R., and Wold, S. (2006a). Uranium colloid analysis by single particle inductively coupled plasma-mass spectrometry. Talanta 68, 623–628. doi: 10.1016/j.talanta.2005.05.006
Degueldre, C., Favarger, P. Y., and Wold, S. (2006b). Gold colloid analysis by inductively coupled plasma-mass spectrometry in a single particle mode. Anal. Chim. Acta 555, 263–268. doi: 10.1016/j.aca.2005.09.021
Dhivert, E., Grosbois, C., Rodrigues, S., and Desmet, M. (2015). Influence of fluvial environments on sediment archiving processes and temporal pollutant dynamics (Upper Loire River, France). Scie. Total Environ. 505, 121–136. doi: 10.1016/j.scitotenv.2014.09.082
Donovan, A. R., Adams, C. D., Ma, Y., Stephan, C., Eichholz, T., and Shi, H. (2016a). Detection of zinc oxide and cerium dioxide nanoparticles during drinking water treatment by rapid single particle ICP-MS methods. Anal. Bioana. Chem. 408, 5137–5145. doi: 10.1007/s00216-016-9432-0
Donovan, A. R., Adams, C. D., Ma, Y., Stephan, C., Eichholz, T., and Shi, H. (2016b). Single particle ICP-MS characterization of titanium dioxide, silver, and gold nanoparticles during drinking water treatment. Chemosphere 144, 148–153. doi: 10.1016/j.chemosphere.2015.07.081
Figueres, G., Martin, J. M., Meybeck, M., and Seyler, P. (1985). A comparative study of mercury contamination in the Tagus estuary (Portugal) and major French estuaries (Gironde. Loire, Rhône). Estuar. Coast. Shelf Sci. 20, 183–203. doi: 10.1016/0272-7714(85)90037-x
Gondikas, A. P., von der Kammer, F., Reed, R. B., Wagner, S., Ranville, J. F., and Hofmann, T. (2014). Release of TiO2 nanoparticles from sunscreens into surface waters: a one-year survey at the Old Danube recreational lake. Environ. Sci. Technol. 48, 5415–5422. doi: 10.1021/es405596y
Gottschalk, F., Sun, T., and Nowack, B. (2013). Environmental concentrations of engineered nanomaterials: review of modeling and analytical studies. Environ. Pollut. 181, 287–300. doi: 10.1016/j.envpol.2013.06.003
Grosbois, C., Négrel, P., Fouillac, C., and Grimaud, D. (2000). Dissolved load of the loire river: chemical and isotopic characterization. Chem. Geol. 170, 179–201. doi: 10.1016/s0009-2541(99)00247-8
Hadioui, M., Merdzan, V., and Wilkinson, K. J. (2015). Detection and characterization of ZnO nanoparticles in surface and waste waters using single particle ICPMS. Environ. Sci. Technol. 49, 6141–6148. doi: 10.1021/acs.est.5b00681
Hirst, S. M., Karakoti, A. S., Tyler, R. D., Sriranganathan, N., Seal, S., and Reilly, C. M. (2009). Anti-inflammatory properties of cerium oxide nanoparticles. Small 5, 2848–2856. doi: 10.1002/smll.200901048
Hochella, M. F. Jr., Mogk, D. W., Ranville, J., Allen, I. C., Luther, G. W., and Marr, L. C. (2019). Natural, incidental, and engineered nanomaterials and their impacts on the Earth system. Science 363:eaau8299. doi: 10.1126/science.aau8299
Kahru, A., and Dubourguier, H.-C. (2010). From ecotoxicology to nanoecotoxicology. Toxicology 269, 105–119. doi: 10.1016/j.tox.2009.08.016
Keller, A. A., and Lazareva, A. (2014). Predicted releases of engineered nanomaterials: from global to regional to local. Environ. Sci. Technol. Lett. 1, 65–70. doi: 10.1021/ez400106t
Keller, A. A., Wang, H., Zhou, D., Lenihan, H. S., Cherr, G., Cardinale, B. J., et al. (2010). Stability and aggregation of metal oxide nanoparticles in natural aqueous matrices. Environ. sci. Technol. 44, 1962–1967. doi: 10.1021/es902987d
Laborda, F., Jiménez-Lamana, J., Bolea, E., and Castillo, J. R. (2011). Selective identification, characterization and determination of dissolved silver(I) and silver nanoparticles based on single particle detection by inductively coupled plasma mass spectrometry. J. Anal. At. Spectrom. 26, 1362–1371.
Lead, J. R., Batley, G. E., Alvarez, P. J. J., Croteau, M.-N., Handy, R. D., McLaughlin, M. J., et al. (2018). Nanomaterials in the environment: behavior, fate, bioavailability, and effects an updated review. Environ. Toxicol. Chem. 37, 2029–2063. doi: 10.1002/etc.4147
Lee, S., Bi, X., Reed, R. B., Ranville, J. F., Herckes, P., and Westerhoff, P. (2014). Nanoparticle size detection limits by single particle ICP-MS for 40 elements. Environ. Sci. Technol. 48, 10291–10300. doi: 10.1021/es502422v
Lima, J. F. D., Martins, R. F., Neri, C. R., and Serra, O. A. (2009). ZnO:CeO2-based nanopowders with low catalytic activity as UV absorbers. Appl. Surf. Sci. 255, 9006–9009. doi: 10.1016/j.apsusc.2009.06.071
Minaudo, C., Meybeck, M., Moatar, F., Gassama, N., and Curie, F. (2015). Eutrophication mitigation in rivers: 30 years of trends in spatial and seasonal patterns of biogeochemistry of the Loire River (1980–2012). Biogeosciences 2015, 2549–2563. doi: 10.5194/bg-12-2549-2015
Mitrano, D. M., Lesher, E. K., Bednar, A., Monserud, J., Higgins, C. P., and Ranville, J. F. (2012). Detecting nanoparticulate silver using single-particle inductively coupled plasma-mass spectrometry. Environ. Toxicol. Chem. 31, 115–121. doi: 10.1002/etc.719
Mitrano, D. M., Ranville, J. F., Bednar, A., Kazor, K., Hering, A. S., and Higgins, C. P. (2014). Tracking dissolution of silver nanoparticles at environmentally relevant concentrations in laboratory, natural, and processed waters using single particle ICP-MS (spICP-MS). Environ. Sci. 1, 248–259. doi: 10.1039/c3en00108c
Montaño, M. D., Badiei, H. R., Bazargan, S., and Ranville, J. F. (2014). Improvements in the detection and characterization of engineered nanoparticles using spICP-MS with microsecond dwell times. Environ. Sci. 1, 338–346. doi: 10.1039/c4en00058g
Navarro, E., Baun, A., Behra, R., Hartmann, N. B., Filser, J., Miao, A.-J., et al. (2008). Environmental behavior and ecotoxicity of engineered nanoparticles to algae, plants, and fungi. Ecotoxicology 17, 372–386. doi: 10.1007/s10646-008-0214-0
Négrel, P., Grosbois, C., and Kloppmann, W. (2000). The labile fraction of suspended matter in the Loire River (France): multi-element chemistry and isotopic (Rb–Sr and C–O) systematics. Chem. Geol. 166, 271–285. doi: 10.1016/s0009-2541(99)00225-9
Nowack, B., Baalousha, M., Bornhoft, N., Chaudhry, Q., Cornelis, G., Cotterill, J., et al. (2015). Progress towards the validation of modeled environmental concentrations of engineered nanomaterials by analytical measurements. Environ. Sci. Nano 2, 421–428. doi: 10.1039/c5en00100e
Nowack, B., and Bucheli, T. D. (2007). Occurrence, behavior and effects of nanoparticles in the environment. Environ. Pollut. 150, 5–22. doi: 10.1016/j.envpol.2007.06.006
Pace, H. E., Rogers, N. J., Jarolimek, C., Coleman, V. A., Higgins, C. P., and Ranville, J. F. (2011). Determining transport efficiency for the purpose of counting and sizing nanoparticles via single particle inductively coupled plasma mass spectrometry. Anal. Chem. 83, 9361–9369. doi: 10.1021/ac201952t
Peters, R. J. B., van Bemmel, G., Milani, N. B. L., den Hertog, G. C. T., Undas, A. K., van der Lee, M., et al. (2018). Detection of nanoparticles in Dutch surface waters. Sci. Total Environ. 621, 210–218. doi: 10.1016/j.scitotenv.2017.11.238
Piccinno, F., Gottschalk, F., Seeger, S., and Nowack, B. (2012). Industrial production quantities and uses of ten engineered nanomaterials in Europe and the world. J. Nanopart. Res. 14, 1109–1119.
Polesel, F., Farkas, J., Kjos, M., Almeida Carvalho, P., Flores-Alsina, X., Gernaey, K. V., et al. (2018). Occurrence, characterisation and fate of (nano)particulate Ti and Ag in two Norwegian wastewater treatment plants. Water Res. 141, 19–31. doi: 10.1016/j.watres.2018.04.065
Reed, R. B., Higgins, C. P., Westerhoff, P., Tadjiki, S., and Ranville, J. F. (2012). Overcoming challenges in analysis of polydisperse metal-containing nanoparticles by single particle inductively coupled plasma mass spectrometry. J. Anal. At. Spectrom. 27, 1093–1100.
Reed, R. B., Martin, D. P., Bednar, A. J., Montaño, M. D., Westerhoff, P., and Ranville, J. F. (2017). Multi-day diurnal measurements of Ti-containing nanoparticle and organic sunscreen chemical release during recreational use of a natural surface water. Environ. Sci. 4, 69–77. doi: 10.1039/c6en00283h
Serpone, N., Dondi, D., and Albini, A. (2007). Inorganic and organic UV filters: their role and efficacy in sunscreens and suncare products. Inorganica Chim. Acta 360, 794–802. doi: 10.1016/j.ica.2005.12.057
Sun, T. Y., Bornhoft, N. A., Hungerbuhler, K., and Nowack, B. (2016). Dynamic probabilistic modeling of environmental emissions of engineered nanomaterials. Environ. Sci. Technol. 50, 4701–4711. doi: 10.1021/acs.est.5b05828
Telgmann, L., Metcalfe, C. D., and Hintelmann, H. (2014). Rapid size characterization of silver nanoparticles by single particle ICP-MS and isotope dilution. J. Anal. At. Spectrom. 29, 1265–1272. doi: 10.1039/c4ja00115j
Tharaud, M., Gondikas, A. P., Benedetti, M. F., von der Kammer, F., Hofmann, T., and Cornelis, G. (2017). TiO2 nanomaterials detection in calcium rich matrices by spICPMS. A matter of resolution and treatment. J. Anal. At. Spectrom. 32, 1400–1411. doi: 10.1039/c7ja00060j
Thio, B. J., Zhou, D., and Keller, A. A. (2011). Influence of natural organic matter on the aggregation and deposition of titanium dioxide nanoparticles. J. Hazard. Mater. 189, 556–563. doi: 10.1016/j.jhazmat.2011.02.072
Tuoriniemi, J., Cornelis, G., and Hassellöv, M. (2012). Size discrimination and detection capabilities of single-particle ICPMS for environmental analysis of silver nanoparticles. Anal. Chem. 84, 3965–3972. doi: 10.1021/ac203005r
Van Hoecke, K., De Schamphelaere, K. A. C., Van der Meeren, P., Smagghe, G., and Janssen, C. R. (2011). Aggregation and ecotoxicity of CeO2 nanoparticles in synthetic and natural waters with variable pH, organic matter concentration and ionic strength. Environ. Pollut. 159, 970–976. doi: 10.1016/j.envpol.2010.12.010
Van Hoecke, K., Quik, J. T. K., Mankiewicz-Boczek, J., De Schamphelaere, K. A., Elsaesser, A., Van der Meeren, P., et al. (2009). Fate and effects of CeO2 nanoparticles in aquatic ecotoxicity tests. Environ. Sci. Technol. 43, 4537–4546.
Virkutyte, J., Al-Abed, S. R., and Dionysiou, D. D. (2012). Depletion of the protective aluminum hydroxide coating in TiO2-based sunscreens by swimming pool water ingredients. Chemi. Eng. J. 191, 95–103. doi: 10.1016/j.cej.2012.02.074
Wagner, S., Gondikas, A., Neubauer, E., Hofmann, T., and Von Der Kammer, F. (2014). Spot the difference: engineered and natural nanoparticles in the environment-release, behavior, and fate. Angew. Chemie Int. Ed. 53, 12398–12419.
Wang, J. L., Alasonati, E., Tharaud, M., Gelabert, A., Fisicaro, P., and Benedetti, M. F. (2020). Flow and fate of silver nanoparticles in small French catchments under different land-uses: the first one-year study. Water Res. 176:115722. doi: 10.1016/j.watres.2020.115722
Weir, A., Westerhoff, P., Fabricius, L., Hristovski, K., and von Goetz, N. (2012). Titanium dioxide nanoparticles in food and personal care products. Environ. Sci. Technol. 46, 2242–2250. doi: 10.1021/es204168d
Yang, Y., Long, C.-L., Li, H.-P., Wang, Q., and Yang, Z.-G. (2016). Analysis of silver and gold nanoparticles in environmental water using single particle-inductively coupled plasma-mass spectrometry. Sci. Total Environ. 563–564, 996–1007. doi: 10.1016/j.scitotenv.2015.12.150
Zhang, J., Kumagai, H., Yamamura, K., Ohara, S., Takami, S., Morikawa, A., et al. (2011). Extra-low-temperature oxygen storage capacity of CeO2 nanocrystals with cubic facets. Nano Lett. 11, 361–364. doi: 10.1021/nl102738n
Keywords: detection of nanoparticles, spICPMS, natural river water, anthropogenic source, TiO2, CeO2, FEG-SEM
Citation: Phalyvong K, Sivry Y, Pauwels H, Gélabert A, Tharaud M, Wille G, Bourrat X and Benedetti MF (2020) Occurrence and Origins of Cerium Dioxide and Titanium Dioxide Nanoparticles in the Loire River (France) by Single Particle ICP-MS and FEG-SEM Imaging. Front. Environ. Sci. 8:141. doi: 10.3389/fenvs.2020.00141
Received: 06 April 2020; Accepted: 23 July 2020;
Published: 22 September 2020.
Edited by:
Gaetane Lespes, Université de Pau et des Pays de l’Adour, FranceReviewed by:
Wenzhi Liu, Wuhan Botanical Garden (CAS), ChinaHuacheng Xu, Nanjing Institute of Geography and Limnology (CAS), China
Copyright © 2020 Phalyvong, Sivry, Pauwels, Gélabert, Tharaud, Wille, Bourrat and Benedetti. This is an open-access article distributed under the terms of the Creative Commons Attribution License (CC BY). The use, distribution or reproduction in other forums is permitted, provided the original author(s) and the copyright owner(s) are credited and that the original publication in this journal is cited, in accordance with accepted academic practice. No use, distribution or reproduction is permitted which does not comply with these terms.
*Correspondence: Yann Sivry, sivry@ipgp.fr