Article

Douglas-Fir Biomass Allocation and Net Nutrient Pools 15–20 Years after Organic Matter Removal and Vegetation Control

1
Stand Management Cooperative, School of Forest and Environmental Sciences, University of Washington, Box 352100, Seattle, WA 98195, USA
2
USDA Forest Service, PNW Research Station, Olympia, WA 98512, USA
3
Weyerhaeuser Company, Springfield, OR 97477, USA
*
Author to whom correspondence should be addressed.
Forests 2020, 11(9), 1022; https://doi.org/10.3390/f11091022
Submission received: 13 August 2020 / Revised: 18 September 2020 / Accepted: 19 September 2020 / Published: 22 September 2020
(This article belongs to the Special Issue Soil Management and Forest Productivity)

Abstract

:
Douglas-fir (Pseudotsuga menziesii var. menziesii (Mirbel) Franco) plantation forests of the coastal Pacific Northwest have been intensively managed to improve the yield of forest products. However, the long-term effects of these management techniques have received limited research attention in this region. Three affiliate Long-Term Soil Productivity study sites were installed in Douglas-fir forests to understand the impacts of organic matter removals and vegetation control on soil productivity over time. Matlock and Fall River are located in Washington, USA and Molalla is located in Oregon. Organic matter removal treatments included traditional bole-only harvest (BO), whole tree removals (WT), and a whole tree plus coarse woody debris removal (WT+) (Fall River only). Five years of annual vegetation control (AVC) was compared with a conventional initial vegetation control (IVC) treatment at all sites. Douglas-fir biomass allocation to foliage, branch, and stem components was modeled using 15- to 20-year-old trees from this study along with 5- to 47-year-old trees from previous studies on these sites. Across all sites, model predictions indicated that the WT treatment had 7.1 to 9.7 Mg ha−1 less Douglas-fir biomass than the BO treatment. There was 1.5 to 20.5 Mg ha−1 greater Douglas-fir biomass in the AVC treatment than in the IVC treatment at all sites. Douglas-fir carbon and nitrogen biomass were consistently lower in the WT treatment, but there were no significant changes in overall site nutrient pools. The AVC treatment resulted in greater Douglas-fir nutrient pools yet there was a net loss in site calcium, magnesium, and potassium due to lower forest floor and soil base cation pools. While WT removals did not significantly affect site nutrition, the decrease in Douglas-fir biomass at all sites and increase in invasive Scotch broom (Cytisus scoparius (L.) Link) biomass at Matlock suggests that the standard practice of retaining harvest residuals is beneficial. The use of intensive vegetation control to improve Douglas-fir biomass and nutrition must be balanced with retaining soil base cations.

Graphical Abstract

1. Introduction

The Long-Term Soil Productivity (LTSP) study has aimed to understand the effects of intensive forest management on soil productivity over time [1,2]. Results from LTSP studies have shown that management effects on productivity are variable by region, treatment intensity, and time since harvest [3,4,5,6]. Removals of additional harvest residues through whole tree harvests have the potential to feed growing bioproduct markets yet the long-term effects on forest plantations are highly variable [4]. Early in stand development, whole tree harvests have been linked to temporary improvements in microclimate and planting conditions for tree seedlings [4]. However, the short-term losses of nutrients through whole tree removals have resulted in long-term reductions in soil productivity especially during canopy closure when nutrient demands are greatest [4]. Whole tree harvesting has also been linked to greater long-term cover of invasive species, such as Scotch broom (Cytisus scoparius (L.) Link) [7,8]. Combining whole tree harvesting with removal of the forest floor caused significant declines in soil C and reduced availability of N in soils with low carbon contents (<10 g C kg−1) [2].
In contrast to the variable effects of organic matter removal, competing vegetation control has resulted in consistent increases in tree growth, but not tree survival, for the vast majority of LTSP study sites [5,6]. The operational use of herbicides to control competing vegetation during forest regeneration has increased with recent improvements in vegetation management technology [9,10]. Vegetation control has been found to improve microclimate and increase resource availability for planted seedlings up to 10 years after forest harvesting [5,6,11], but it has also been linked to greater leaching of soil N [12]. Five years of annual vegetation control treatments consistently decreased soil N and exchangeable base cation concentrations in 15- to 20-year-old coast Douglas-fir (Pseudotsuga menziesii var. menziesii (Mirbel) Franco) stands [13]. The effects of competing vegetation control are likely to decrease as stands reach canopy closure [14].
In the Pacific Northwest, coast Douglas-fir is the main plantation forest species receiving intensive management. Distinctive combinations of climate, soil development and nutrition, and soil water holding capacities cause large variation in Douglas-fir productivity throughout the region [15,16]. Three affiliate Douglas-fir LTSP studies (i.e., Fall River WA, Matlock WA, and Molalla OR) were established across the coastal Pacific Northwest (PNW) to encompass differences in soil productivity that might affect the response to intensive forest management treatments, such as organic matter removals and repeated vegetation control. There are currently no other long-term studies on the effects of these treatments on soil and vegetation nutrient pools in the PNW. To advance our understanding of the long-term effects of intensive management on forest soil productivity, the Fall River site included an additional treatment that removed legacy wood in addition to logging debris [8]. All three of the PNW affiliate study sites included sustained control of competing vegetation for five years, rather than only the three-year treatment duration used for most of the other LTSP study installations [3,5,6].
Forest nutrient pool sizes are typically calculated by combining predictions of vegetation biomass with estimates of nutrient concentration for each biomass component [17,18,19,20]. In a comparison of the three PNW LTSP affiliate sites in year 5, total aboveground N stored in conifer, shrub, and herbaceous vegetation had a positive linear relationship with total soil N to a depth of 60 cm [18]. Douglas-fir foliar N concentration was also correlated with total soil N. In this report our objectives were to: (1) estimate foliar, branch, stem, and total biomass of 15- to 20-year-old Douglas-fir and compare to previously published biomass equations, (2) understand the long-term impacts of organic matter removals and annual vegetation control on Douglas-fir and competing vegetation biomass, and (3) determine net changes in site nutrient pools, including shallow mineral soil, forest floor, competing vegetation, and Douglas-fir biomass.

2. Materials and Methods

2.1. Study Sites and Treatments

The three affiliate Douglas-fir LTSP sites in the Pacific Northwest (Fall River, Matlock, and Molalla) contain distinctive climates, soil types, and soil productivities (Figure 1; Table 1). Fall River, near Brooklyn, Washington, USA, was harvested in 1999 and planted in spring 2000 (Table 1; Figure 2). The soil at Fall River developed from the Pomona basalt flow and has been classified as a Boistfort silt loam [21]. Matlock and Molalla were both harvested in 2003 and planted in Spring 2004. Matlock, near Matlock, Washington, USA, contains a Grove very gravelly loamy sand that formed from Pleistocene glacial outwash [21,22]. The parent material was basic igneous agglomerate at Molalla (near Dodge, OR, USA) and the soil series has been classified as a Kinney cobbly medial loam [21]. Prior to treatment, soils were analyzed for total and available nutrients [8,23].
At harvest, all three sites received organic matter removal (OM) treatments consisting of bole-only harvest (BO) and whole tree harvest (WT) [7,10]. At Fall River, an additional whole tree harvest treatment was applied (WT+: WT plus removal of large legacy wood, surface red rot, and live and dead coarse woody debris greater than 0.6 cm). The traditional BO treatment removed just the merchantable logs from the plot. The WT treatment removed most aboveground tree parts including needles and branches, but stumps and roots were left on site. Residual organic matter differed by site and treatments due to distinct levels of pre-treatment organic matter and different harvesting regimes [7,10,13].
Annual vegetation control (AVC) was applied to randomly-assigned plots for five years at all three sites. At Fall River, annual vegetation control treatments aimed for 95% vegetation control [10]. Five years of annual vegetation control at Matlock and Molalla aimed for an operational level of vegetation control [7]. One-year of initial vegetation control (IVC) was applied to randomly-assigned plots at Matlock and Molalla. The bole-only treatment at Fall River did not receive initial vegetation control, but the IVC code was used to differentiate it from the AVC treatment.

2.2. Competing Vegetation, Forest Floor, and Soil Sampling

Competing vegetation biomass was sampled in August 2018 (Matlock and Molalla) and 2019 (Fall River). At Matlock and Molalla, 10 randomly located 0.2 m2 subplots per plot were sampled for understory (herbaceous and small shrubs) and overstory (in-growth trees and large shrubs taller than 1 m). Twenty randomly located 0.2 m2 subplots per plot were sampled at Fall River. Only the vegetation occurring within the boundaries of a given subplot was collected, except at Fall River where a small amount of understory competing vegetation within subplots required a bulk sampling of competing vegetation throughout the buffer plot to obtain a sample large enough for nutrient analyses. Competing vegetation biomass from all subplots was composited by plot. Fall River competing vegetation consisted of native herbaceous species, including oxalis (Oxalis oregana Nutt.), sword fern (Polystichum munitum (Kaulf.) C. Presl), and false Solomon’s seal (Maianthemum racemosum (L.) Link). Scotch broom, a nonnative leguminous shrub, was the major competing vegetation species at Matlock, yet Matlock contained the greatest competing vegetation diversity of all three sites [25]. Salal (Gaultheria shallon Pursh), bracken fern (Pteridium aquilinum (L.) Kuhn, trailing blackberry (Rubus ursinus Cham. and Schldl.), and snowberry (Symphoricarpos albus (L.) S.F. Blake) were found on all treatments at Matlock. Molalla competing vegetation consisted of native overstory trees, such as cascara (Rhamnus purshiana DC.) and bitter cherry (Prunus emarginata (Dougl. ex Hook.) Eaton and understory (Oregon grape (Mahonia nervosa (Pursh) Nutt.), salal, sword fern, and trailing blackberry).
Four randomly placed locations per plot were sampled for forest floor and mineral soil at each site during the fall of 2017. One forest floor sample of known area (182 cm2) was removed from the sample area, and an 8-cm wide by 15-cm long metal core was hammered into the mineral soil (0–15 cm). Forest floor and mineral soil samples were brought back to the lab in a cooler and stored at 4 °C.

2.3. Douglas-Fir Biomass Sampling

Douglas-fir biomass has been previously sampled on all sites (Table 2). Prior to harvest at Fall River, biomass components of 47-year-old second-growth Douglas-fir were sampled [20]. After five growing seasons planted Douglas-fir biomass was sampled at all three sites [18]. Douglas-fir biomass was sampled again at Fall River 11 years after planting [19].
The base of each biomass tree was cleared of forest floor and cut at the mineral soil surface. Each tree stem was severed into sections of 1.3 to 2.5 m in length. For each stem section, the branches were separated into small, medium, and large size classes and then counted and weighed. A representative number of branches (one to three branches) from each size class were subsampled and recombined for each stem section. The representative branches were then separated into large branches without needles and branches with needles and subsampled again by mass ratio for each stem section. The subsampled branches were dried to a constant weight at 70 °C for two days. Once dry, the branches were stripped of needles and the dry mass of needles and branches were recorded. The dry-matter fraction and ratio of dry needle to branch mass from each subsampled stem section was used to estimate the total dry weight of foliage and branches for each stem section and summed by tree. The dry mass of needles and branches by stem section were summed for each biomass tree.
Stem sections were weighed, and a 2 to 5 cm thick stem cross-section (“cookie”) was removed from the bottom of each section. A segment of the leader was also sampled from each tree. The cookie segments were weighed fresh, dried to a constant weight at 70 °C, and weighed again to obtain dry-matter fraction. The mean dry-matter fraction from the bottom and top of each stem section was used to estimate the dry weight of each stem section. The dry mass from each stem section was recombined for each biomass tree. Stem, branch, and foliar biomass were summed for each biomass tree to determine total tree biomass.
In this report, Douglas-fir biomass components (foliage, branch, and stem) were sampled 15 years after planting at Matlock (n = 16) and Molalla (n = 16) (November 2018) and 20 years after planting at Fall River (n = 17) (November 2019). One tree of mean diameter at breast height (DBH) and height (HT) (m) from the buffer of each plot was measured for DBH (cm), HT (m), and height to live crown (HLC) (m). In the same month, DBH and HT were recorded on all measurement plot Douglas-fir trees. HLC was measured on all measurement trees at Fall River. Because a subsample of trees were measured for HLC at Matlock and Molalla, separate equations for IVC and AVC trees using DBH and HT were used to predict crown length (CL) (m), which is the difference between HT and HLC: (Matlock IVC CL = −0.184 + 0.0136*DBH + 0.948*HT (R2 = 0.993); Matlock AVC CL = −0.184 + 0.0181*DBH + 0.942*HT (R2 = 0.988); Molalla IVC CL = 0.875 + 0.231*DBH + 0.488*HT (R2 = 0.852); Molalla AVC CL = 0.875 + 0.122*DBH + 0.661*HT (R2 = 0.847)). Measured or estimated CL and HT were used to calculate crown ratio (CR) to account for crown recession.

2.4. Douglas-Fir Biomass Allocation Equations

Douglas-fir biomass allocation at 15 and 20 years was compared to previously published biomass allocation equations from 11 and 47 year stands at Fall River [19,20] (Figure 3). Previous biomass component measurements (5–47 years) were combined with Douglas-fir biomass components from this study (15–20 years) to produce biomass allocation equations for a wider range of tree sizes. Foliar, branch, and stem biomass were compared to tree measurement variables (DBH, HT, and CR) based on previous research to determine the best equations to predict biomass allocation across all sites and tree ages [19,20,27]. Biomass components were combined across all sites because site differences were found to explain less than 1% of the variation in Douglas-fir biomass. The best equations (linear, polynomial, logarithmic or power) were selected according to the lowest prediction bias and greatest R2 value. The method of weighted least squares, with weights of 1/HT or 1/DBH, was used to correct for non-constant residual variances in the modeled relationships [28]. Total biomass per tree was calculated as the sum of predicted foliar, branch, and stem biomass for each tree. For each plot, 15- or 20-year plot-level foliar, branch, stem, and total biomass (Mg ha−1) were calculated based on the sum of each biomass component and plot size.

2.5. Aboveground and Belowground Nutrients

Forest floor and soil samples were composited by plot and air-dried until dry to the touch. Competing vegetation samples were dried at 70 °C for two days. Forest floor, competing vegetation, and Douglas-fir component samples were ground to 2 mm in a Wiley mill and then finely-ground in a ball mill. Mineral soil samples were sieved to 4.75 mm to separate the fine fraction. Subsamples of forest floor and mineral soil were oven-dried at 105 °C for 48 h to estimate their total dry weights.
Exchangeable Ca, K, Mg, and Al from the forest floor and mineral soil were extracted with a 1 N solution of NH4Cl. The Bray-1 method was used to extract mineral soil available P [29]. Total C and N of mineral soil, forest floor, competing vegetation, and Douglas-fir samples were analyzed by dry combustion with a CHN 2400 analyzer (PerkinElmer Inc., Akron, OH, USA). Total metals for all samples were measured using the methods of EPA 3050b [30] on an ICP-AES (Thermo Scientific Co.). Exchangeable cations, Bray P, and total nutrients were analyzed on an ICP-AES (ThermoFisher Scientific Co., Waltham, MA, USA).
Forest floor nutrient contents were estimated using total and available nutrient concentrations and forest floor mass. Soil bulk density, sampling depth (15 cm), and nutrient concentrations were used to estimate soil nutrient contents. Understory, overstory, and total competing vegetation nutrient contents were calculated using subplot competing vegetation mass and nutrient concentrations. Individual-tree foliar, branch, and stem nutrient pools were estimated from the biomass allocation equations and summed by plot to determine total Douglas-fir nutrient pools.

2.6. Statistical Analyses

While the sites were combined to model biomass allocation, each site was analyzed separately to test for significant differences in Douglas-fir biomass and above- and belowground nutrient contents because of differences in soil nutrition, experimental design, and plot size. Treatment effects on Douglas-fir biomass component biomass and forest floor, soil, competing vegetation, and Douglas-fir nutrient, and total pools were examined using a Type II sums of squares ANOVA from a linear regression model with a blocking factor using the “Anova” function in the “car” package and an alpha level of 0.1 in R (R Statistical Software version 3.4.2, The R Foundation for Statistical Computing) [31]. There were no significant treatment interactions found at Matlock and Molalla, and no treatment interactions were tested in the analysis of Fall River data due to a fractional factorial design. Significant treatment contrasts were determined using the Holm-Bonferroni method [32] (p < 0.10).

3. Results

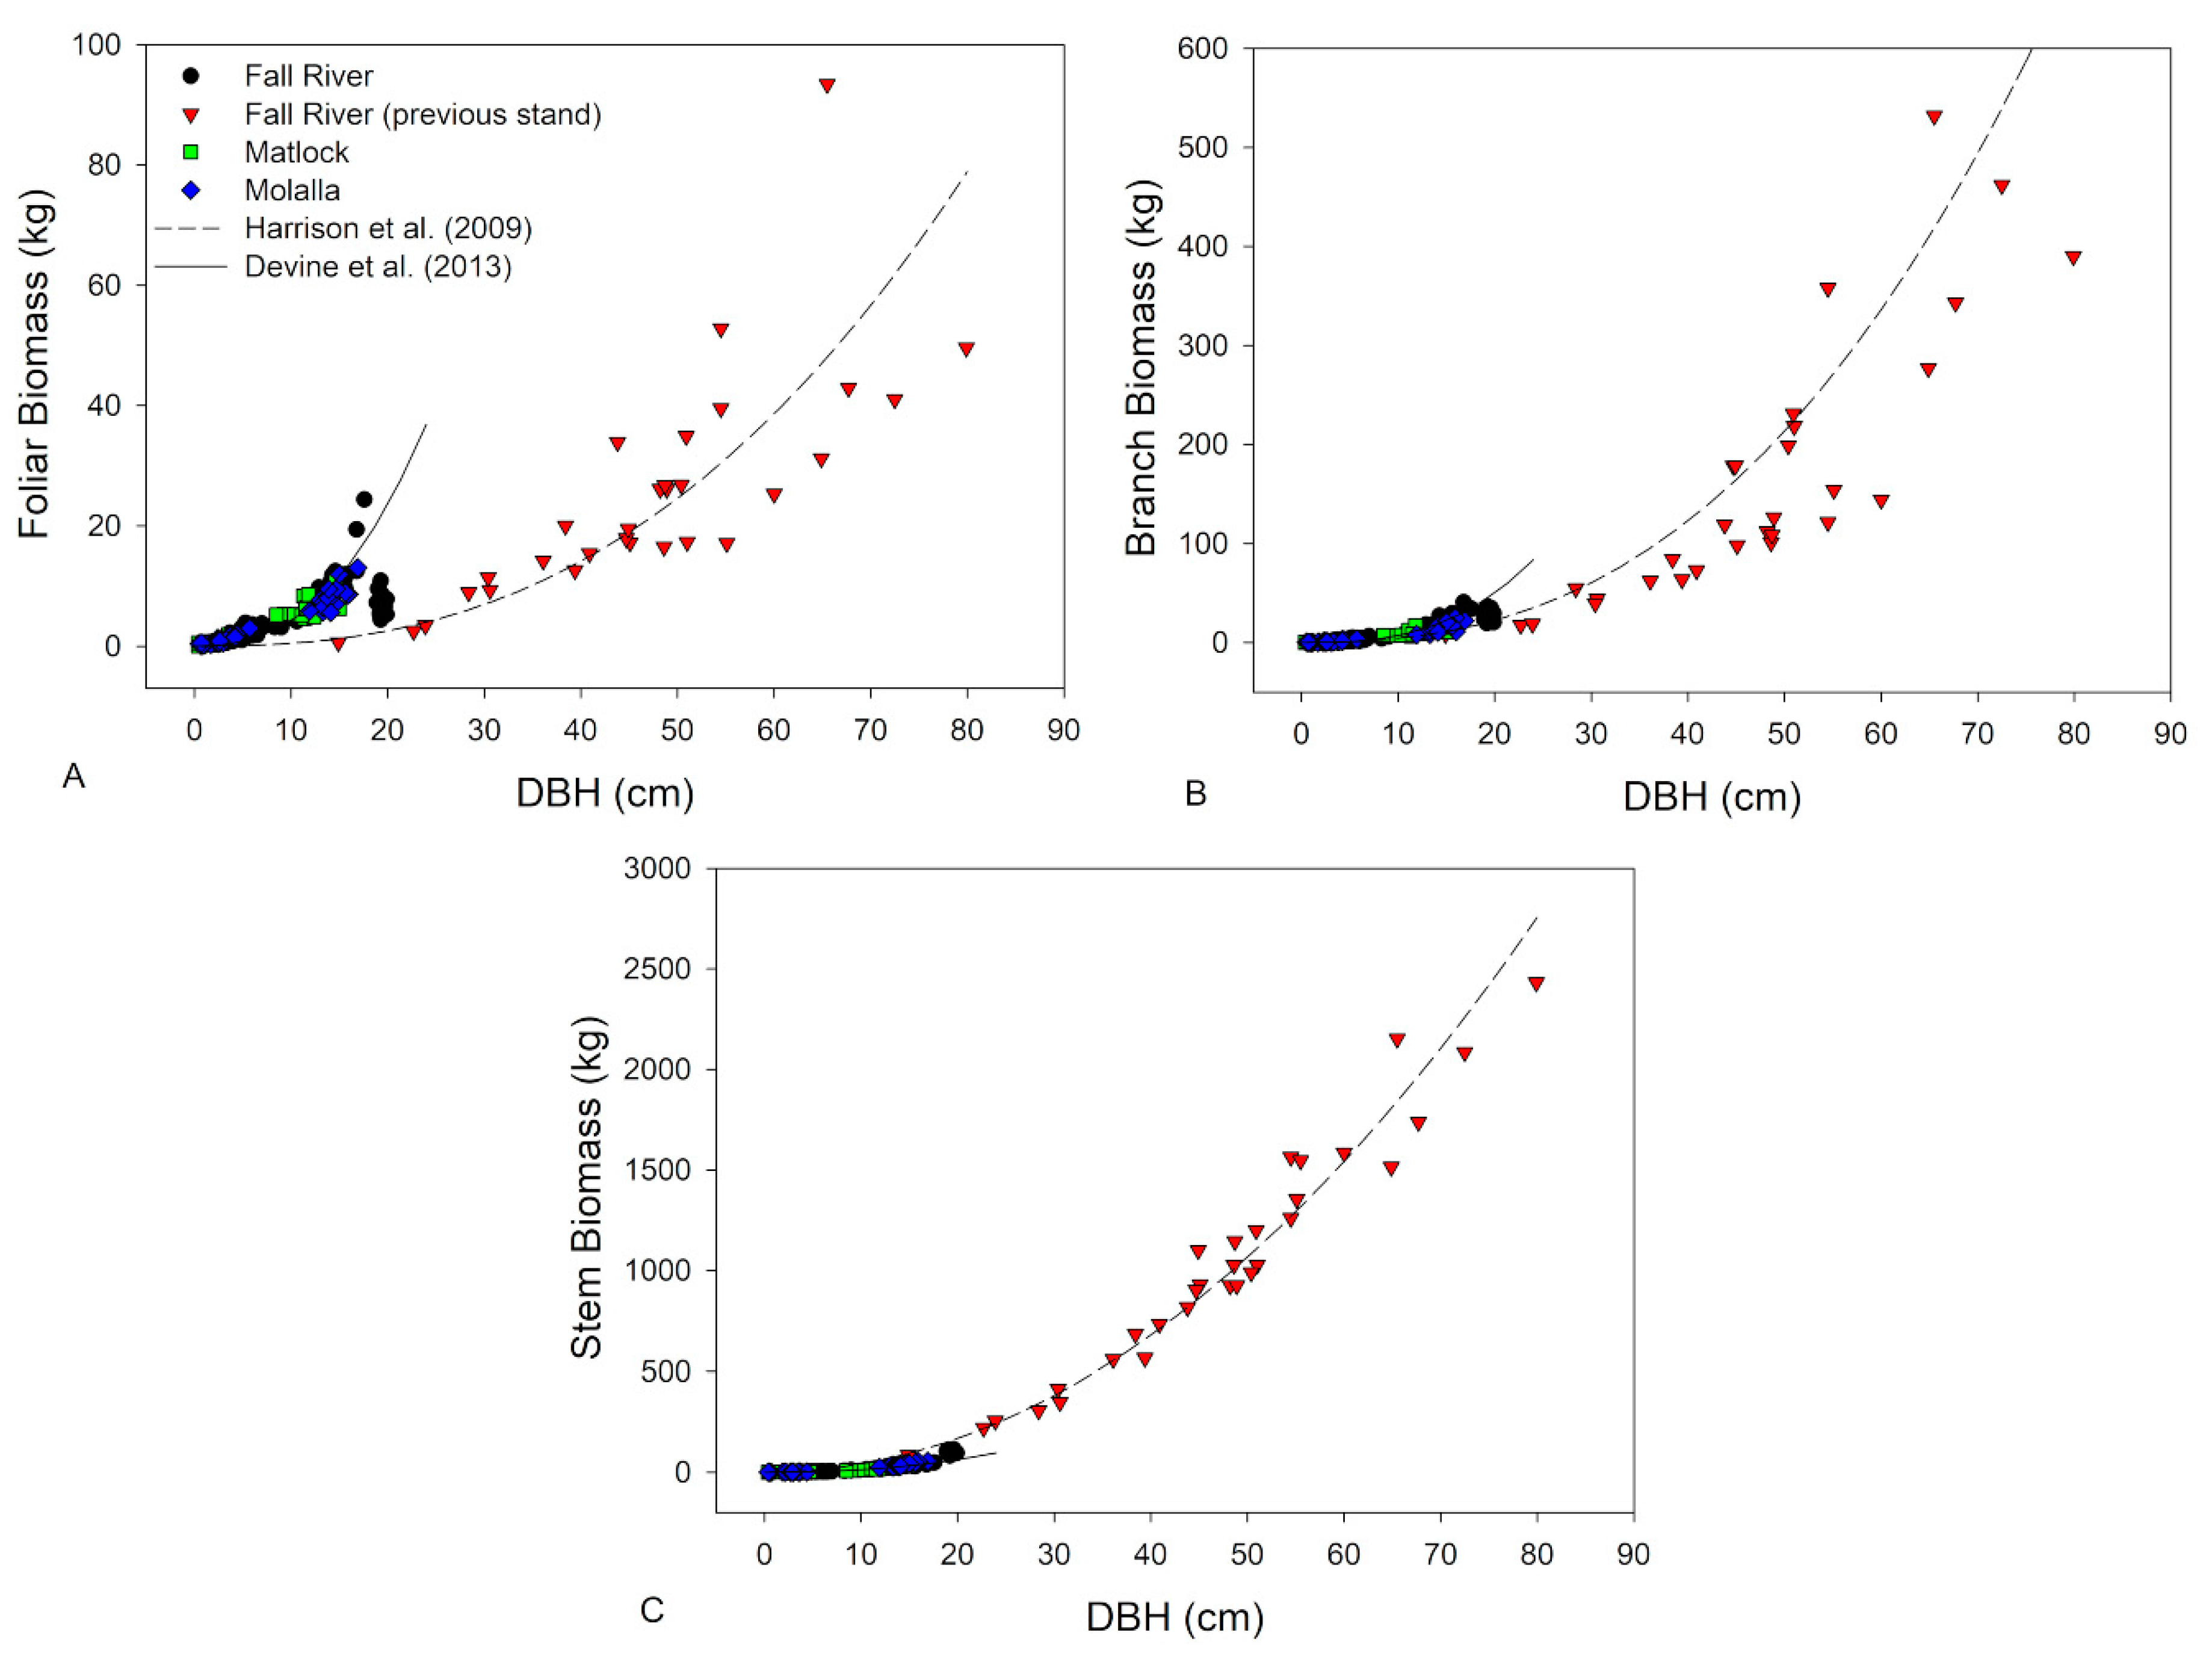
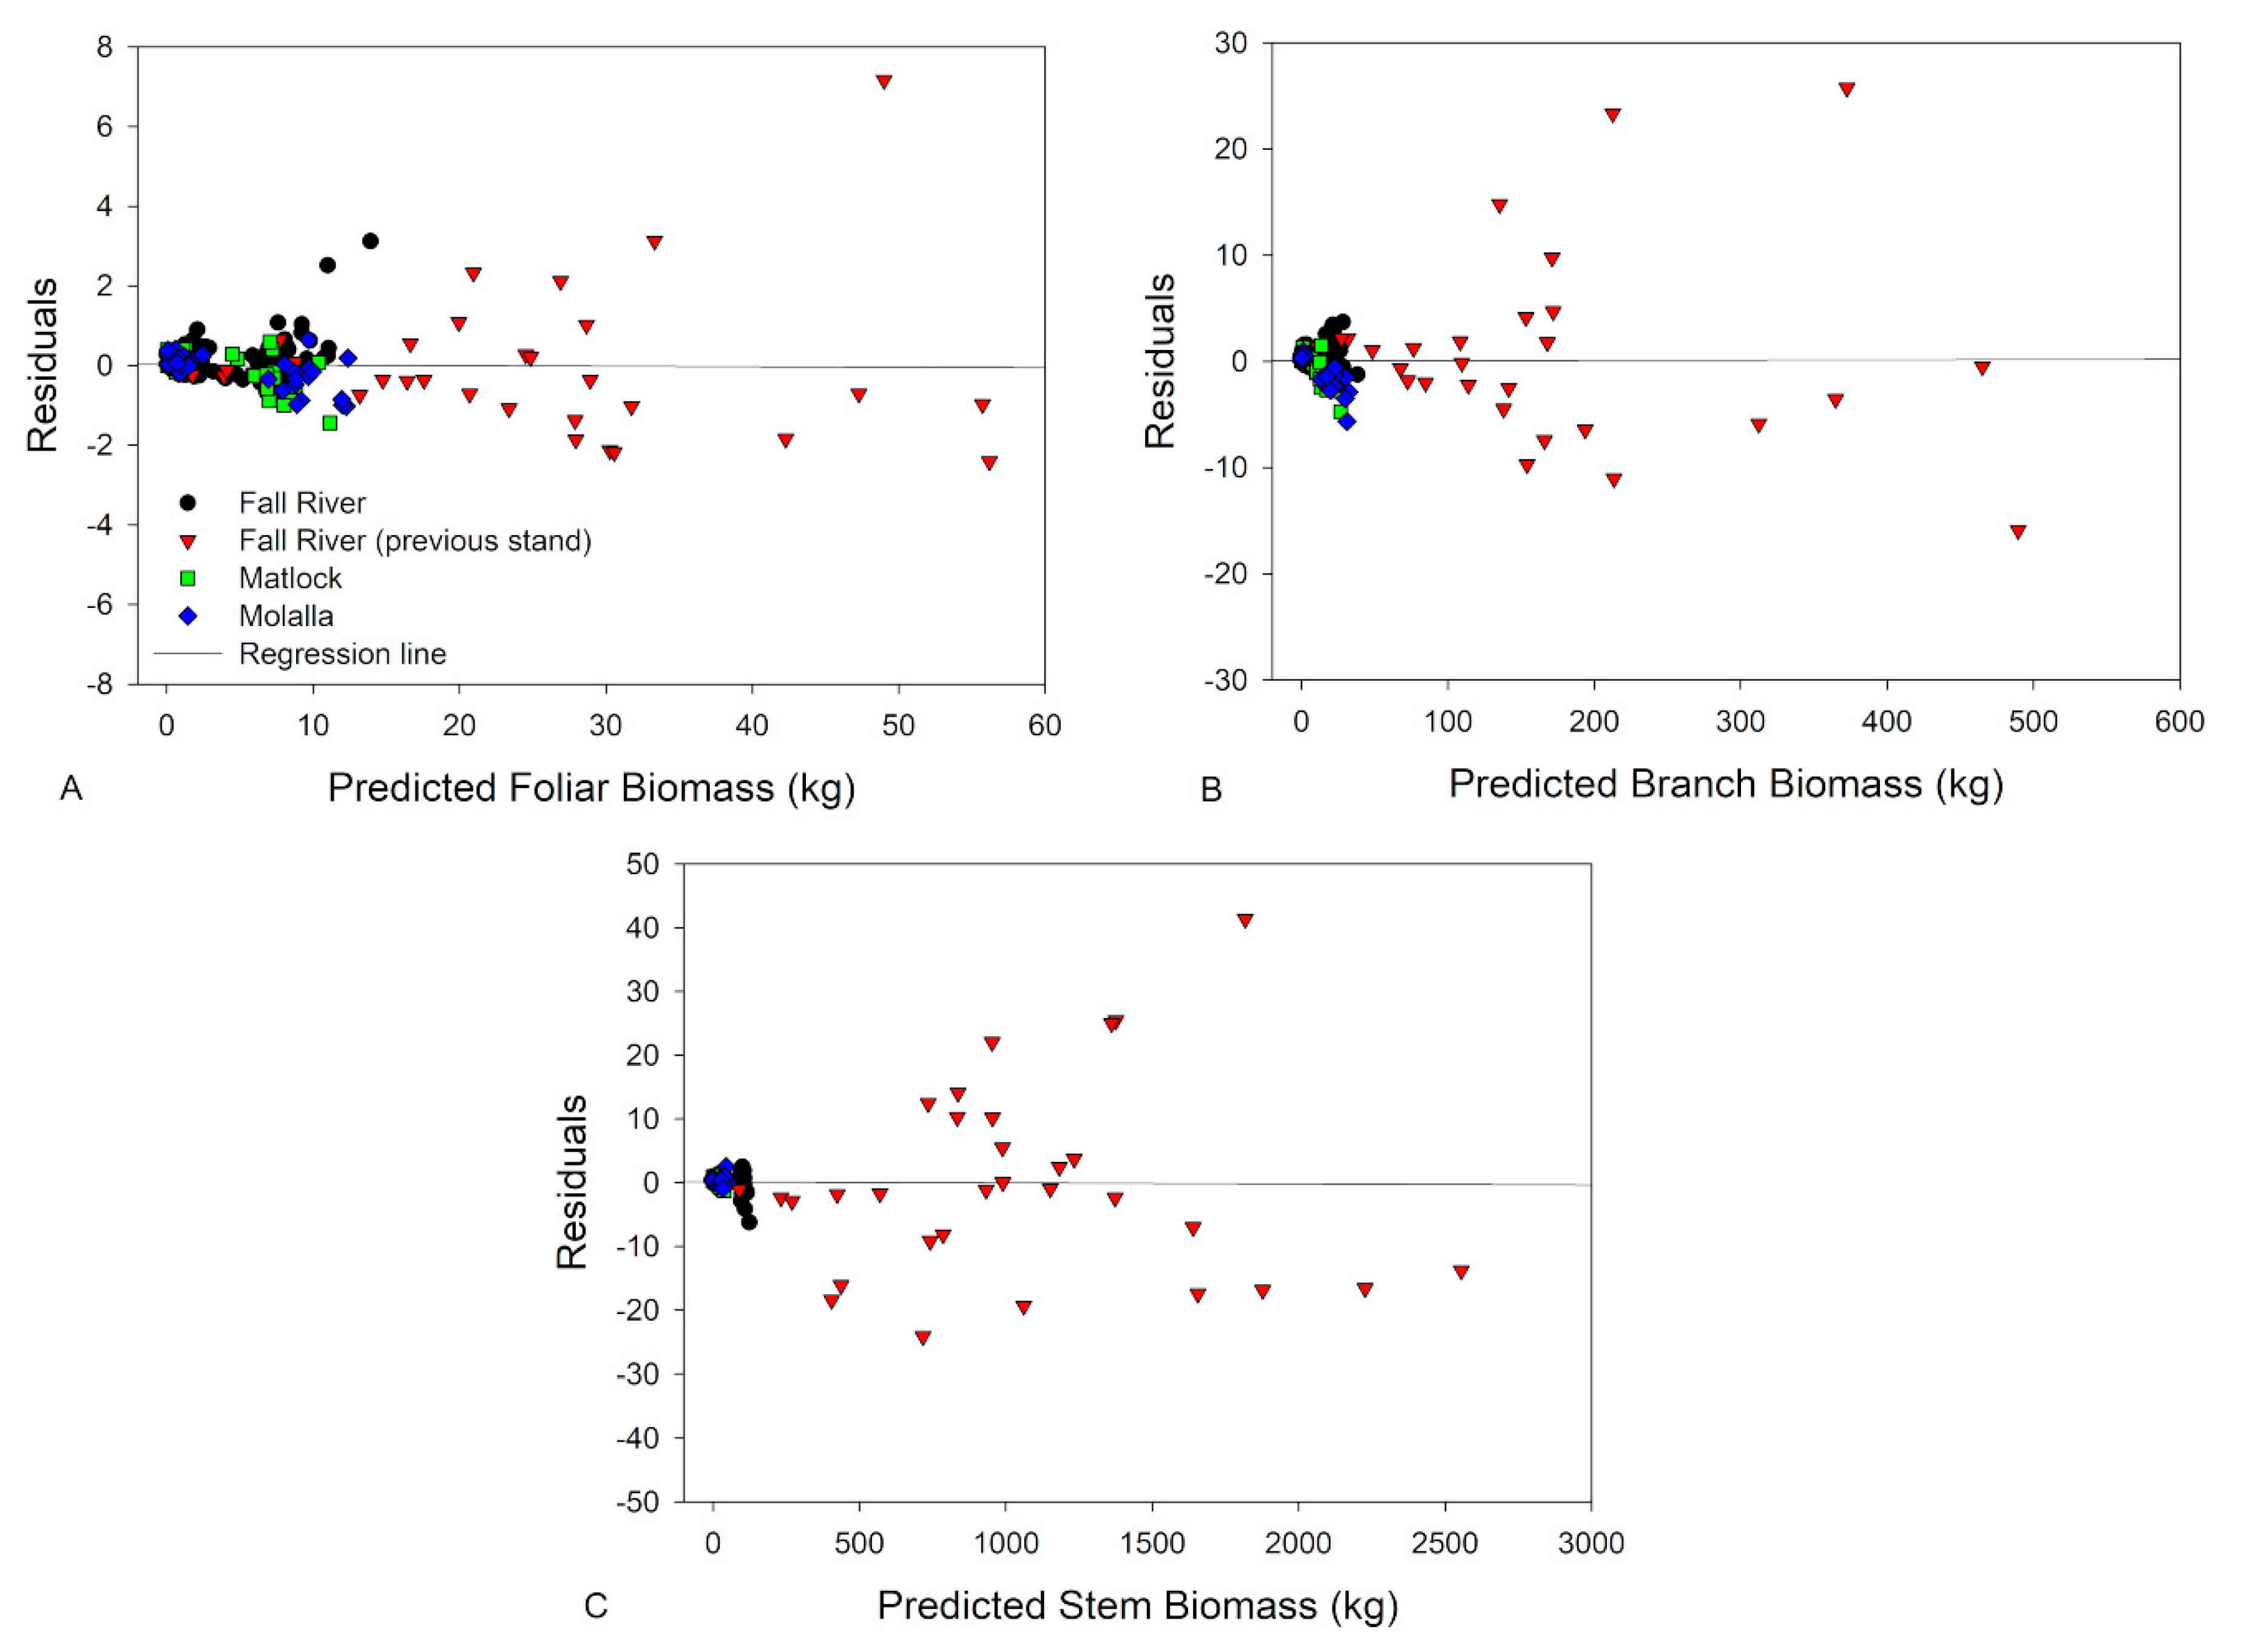
3.1. Douglas-Fir Individual-Tree Biomass Allocation Equations

Diameter at breast height and crown ratio were the best predictors of foliar and branch biomass for all tree ages (Table 3). Stem biomass was strongly predicted by DBH and HT. Biomass predictions were weaker in older trees but were improved by weighting with the inverse of HT (foliar and branch biomass) or the inverse of DBH (stem biomass) (Figure 4).

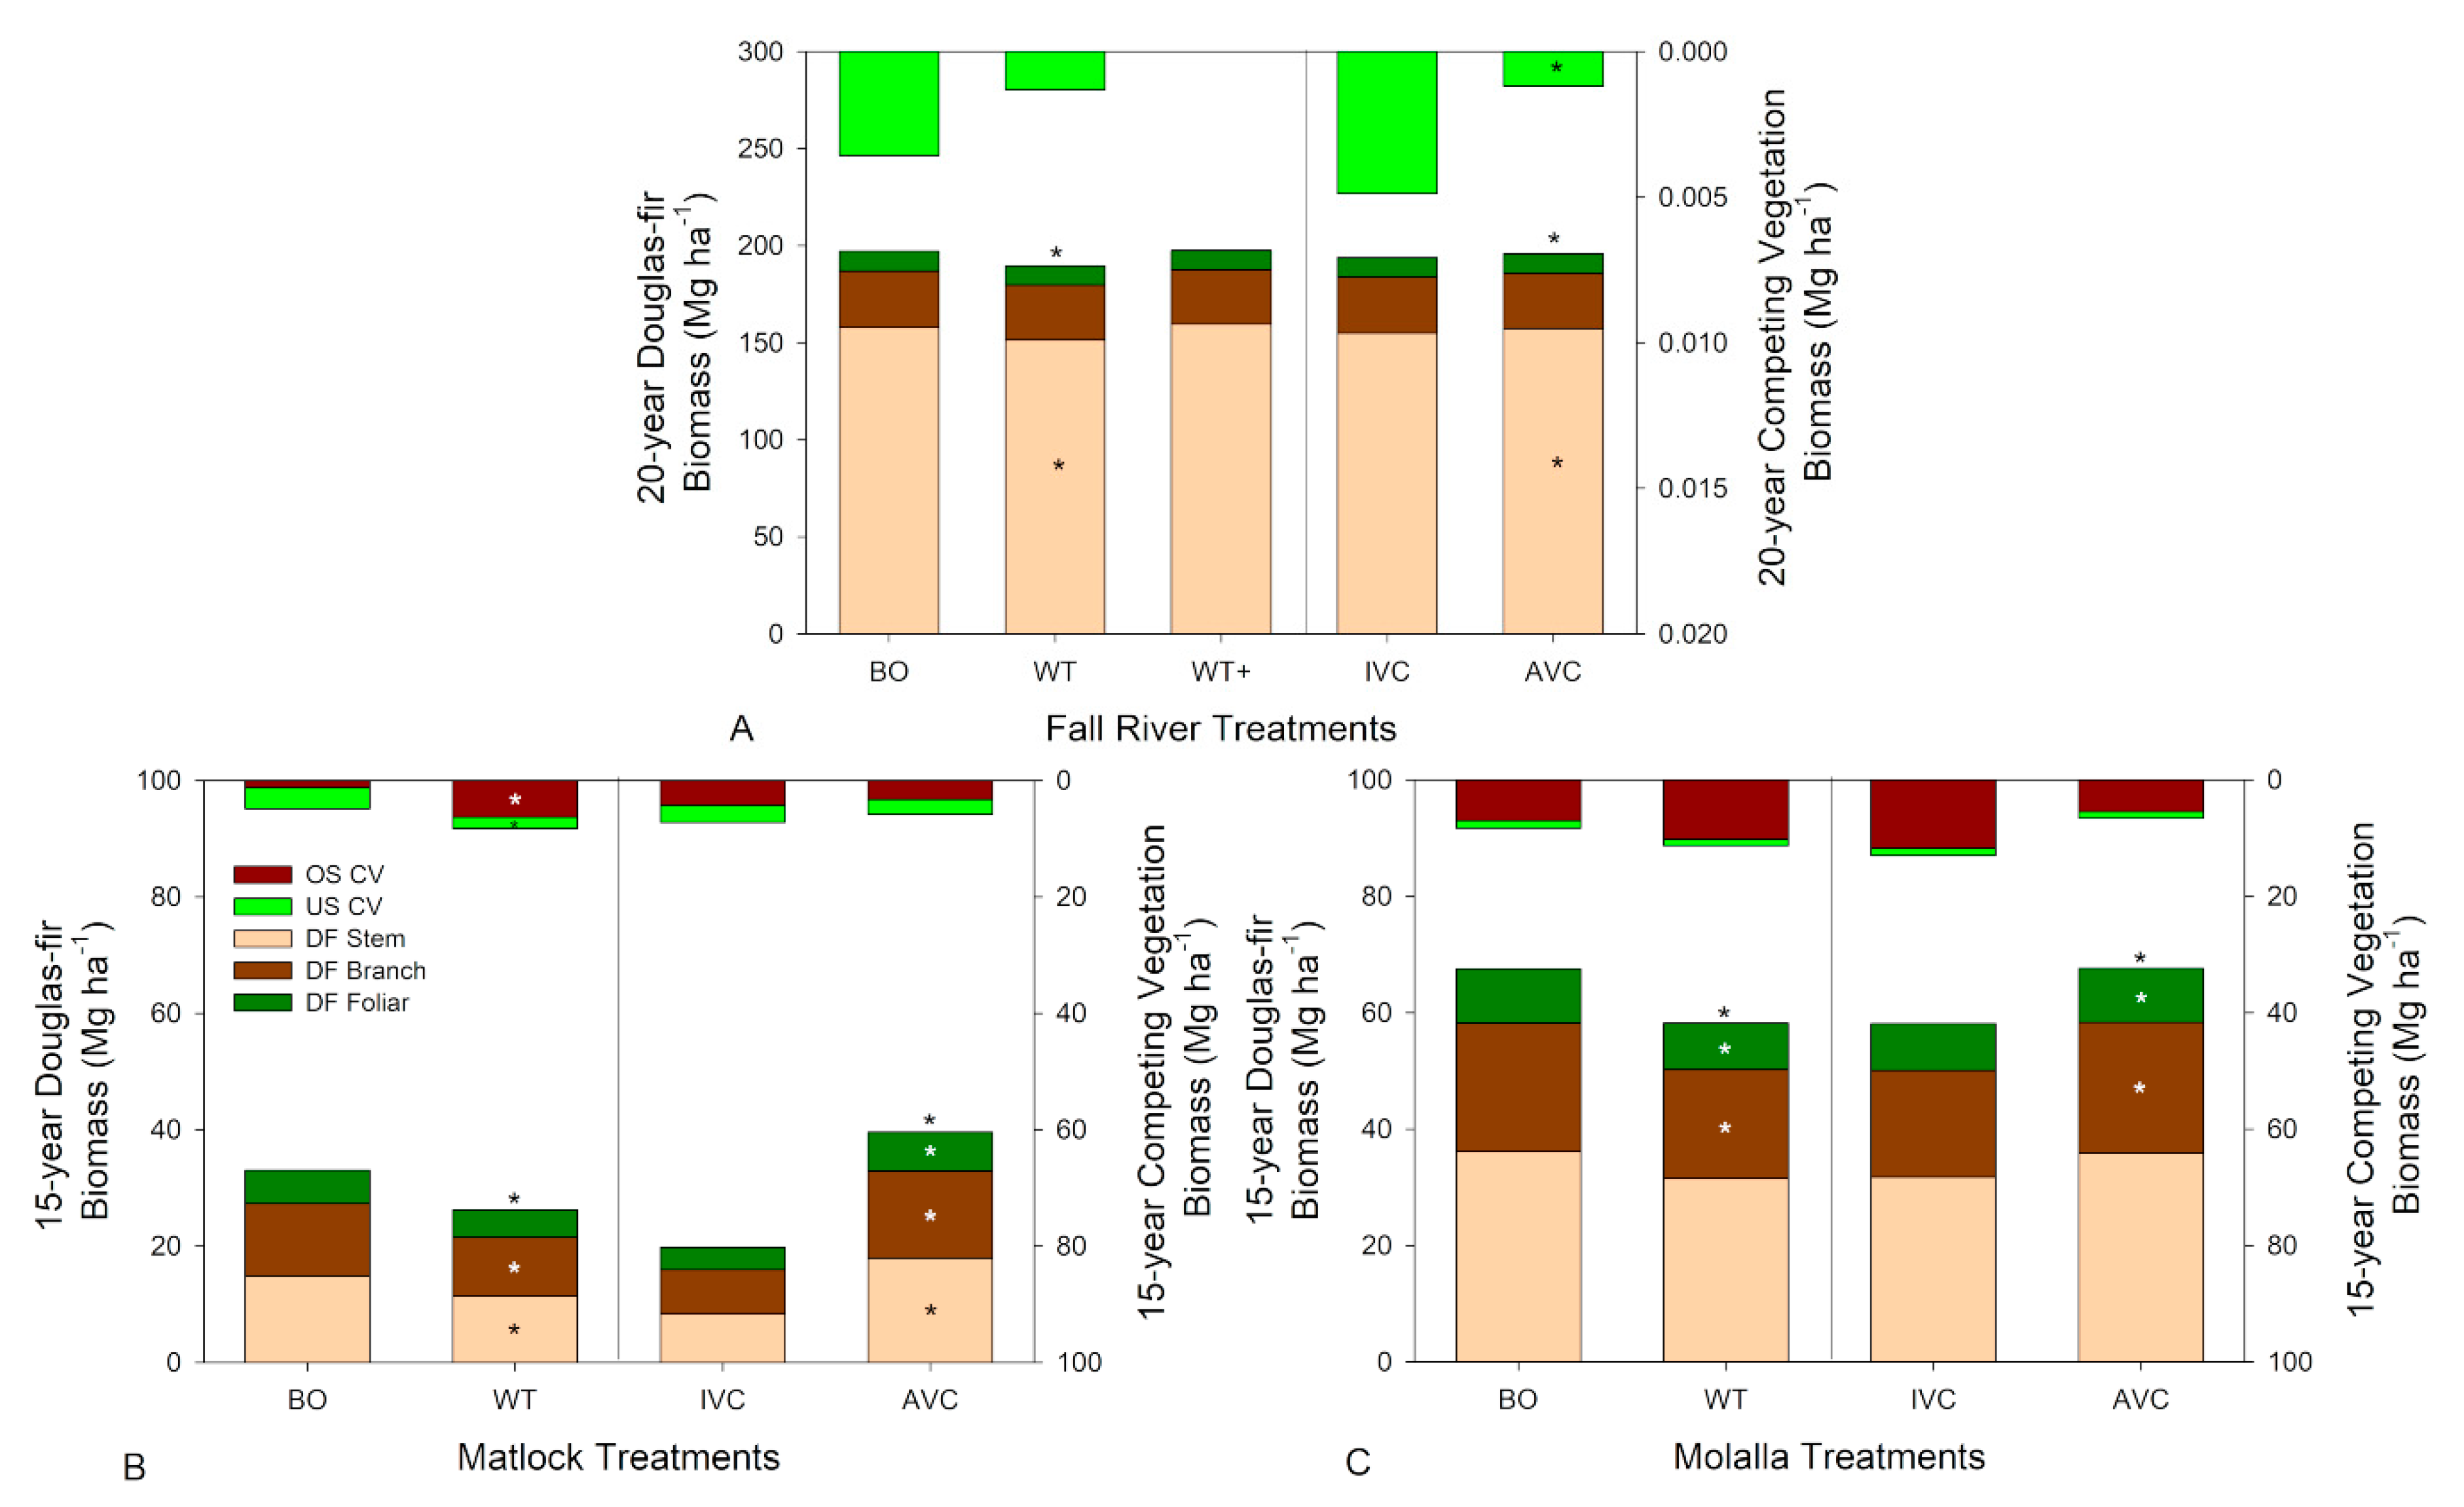
3.2. Plot-Level Douglas-Fir Biomass

At Fall River, plot-level stem biomass and total biomass differed significantly among the organic matter and vegetation control treatments, while foliar and branch biomass were not significantly different (Figure 5A). The AVC treatment contained significantly lower competing vegetation biomass compared to the IVC treatment (0.0012 Mg ha−1 versus 0.0049 Mg ha−1, respectively), although competing vegetation biomass was extremely low compared to Douglas-fir biomass (190–198 Mg ha−1).
Competing vegetation at Matlock comprised a higher percentage of total aboveground biomass (18%) compared to Fall River (<0.1%). The BO treatment contained significantly lower overstory competing vegetation biomass and greater understory competing vegetation biomass compared to the WT treatment, but there were no significant differences due to the vegetation control treatments (Figure 5B). BO and AVC treatments resulted in significantly greater plot-level Douglas-fir foliar, branch, stem, and total biomass. The AVC treatment contained twice as much Douglas-fir biomass compared to the IVC treatment (39.5 Mg ha−1 versus 19.8 Mg ha−1, respectively).
Molalla also contained a large amount of hardwood competing vegetation compared to total aboveground biomass (14%) mostly as cascara and bitter cherry—yet there were no significant differences in competing vegetation biomass between organic matter removal or vegetation control treatments (Figure 5C). The BO and AVC treatments contained significantly greater plot-level Douglas-fir foliar, branch, and total biomass compared to the WT and IVC treatments, respectively. Douglas-fir biomass was 1.2 times greater in the BO and AVC treatments than in the WT and IVC treatments.

3.3. Douglas-Fir Nutrient Concentrations

Nutrient concentrations in foliage, branch, and stem components were affected by organic matter and vegetation treatments (Table 4). At Fall River and Molalla, foliar N concentrations were greater in the BO treatment than in the WT treatment. However, at Matlock the WT treatment contained the greatest foliar N concentration along with greater stem P, Ca, and Mg concentrations. Foliar K concentration was greater in the BO treatment at Molalla.
The annual vegetation control treatment resulted in greater foliar N at Fall River and lower foliar and branch N concentrations at Matlock than the IVC treatment (Table 4). At Fall River, foliar P concentration was also significantly greater in the AVC treatment. At Matlock, foliar Ca was greater and stem P, Mg, and Al were lower in the AVC treatment. Lower foliar K and greater branch Al were found in the AVC treatment at Molalla.

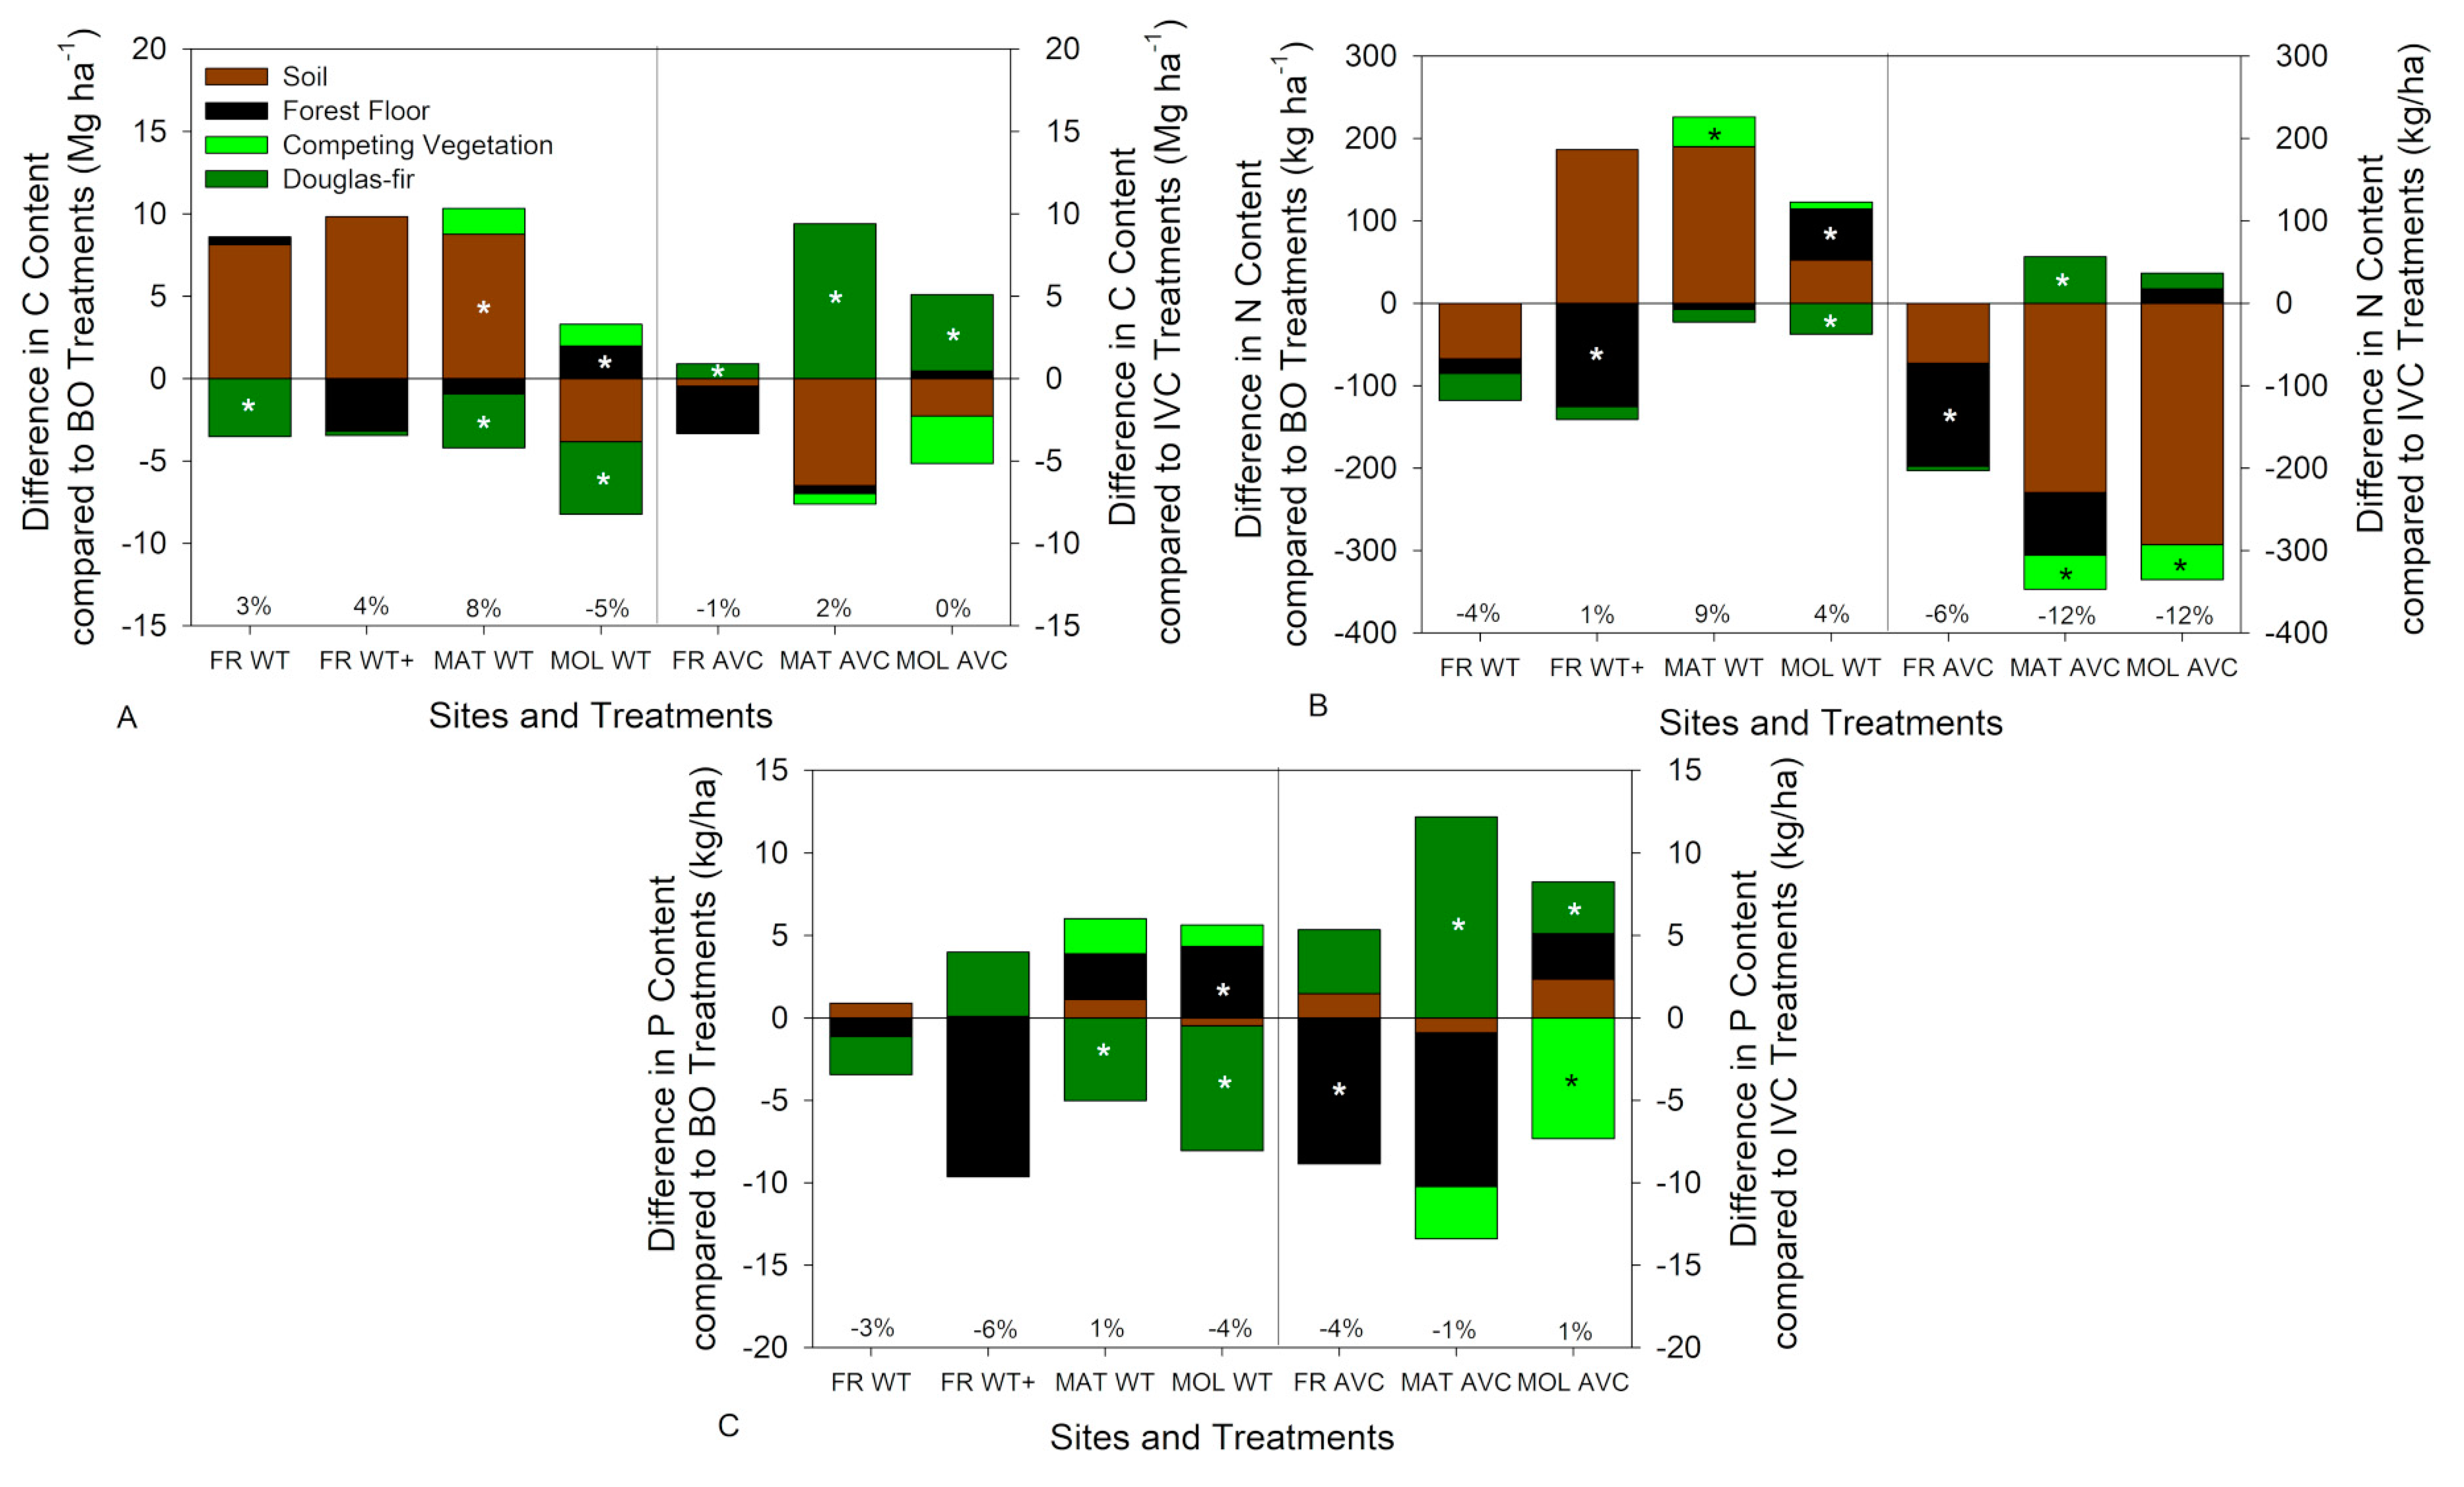
3.4. Plot-Level above- and Belowground Nutrient Pools

The WT treatment resulted in a smaller Douglas-fir carbon (C) pool per ha at all three sites compared to the BO treatment due to lower Douglas-fir biomass in these treatments (Figure 6A; Appendix A). Conversely, soil and forest floor C pools increased in the WT treatment at Matlock and Molalla, respectively. Annual vegetation control significantly increased Douglas-fir C pools at all three sites compared to the IVC treatment. Total C pools were not significantly affected by WT or AVC treatments.
Above- and belowground N pools were affected differently at all sites (Figure 6B; Appendix A). At Fall River, the forest floor N pool was lower in the WT+ and AVC treatments compared to the BO and IVC treatments, respectively. Annual vegetation control increased Douglas-fir N pools and decreased competing vegetation N pools at Matlock. The BO treatment also contained lower competing vegetation N pools at Matlock. Similarly, AVC at Molalla significantly decreased the competing vegetation N pool compared to the IVC treatment, which is due to the combination of lower overstory competing vegetation biomass and lower N concentrations. The WT treatment resulted in greater forest floor N pools due to a larger forest floor mass and a lower Douglas-fir N pool.
The largest changes in the site P pool were in the forest floor, but the only significant differences were a lower forest floor P pool at Fall River in the AVC treatment and higher forest floor P pool at Molalla in the WT treatment due to a significantly greater forest floor biomass (Figure 6C; Appendix A). Douglas-fir P pools decreased significantly at Matlock and Molalla in the WT treatment compared to the BO treatment. Annual vegetation control increased the Douglas-fir P pool at Matlock and decreased the competing vegetation P pool at Molalla.
WT and AVC treatments generally resulted in a net loss of site Ca (−12 to −239 kg/ha) (Figure 7A; Appendix B). The AVC treatment resulted in a significantly lower total Ca pool at Fall River due to lower competing vegetation, forest floor, and soil Ca pools. Conversely, Douglas-fir Ca pools were significantly higher in the AVC treatments at Matlock and Molalla. The WT treatment at Molalla contained a significantly lower Douglas-fir Ca pool but a significantly higher forest floor Ca pool compared the BO treatment.
The total K pool was significantly lower at Molalla in the AVC treatment compared to the IVC treatment (Figure 7B; Appendix B). Annual vegetation control increased the Douglas-fir K pools at Fall River and Matlock while the WT removal treatment decreased Douglas-fir K pools at Matlock and Molalla. The WT+ and AVC treatments at Fall River and Molalla, respectively, resulted in a significant decrease in soil K pools.
Site Mg pools reacted similarly to site Ca pools in the WT and AVC treatments (Figure 7C; Appendix B). Fall River and Molalla total Mg pools were significantly lower due to large losses in the soil Mg pool in the AVC treatments. Forest floor Mg pools in the WT+ and AVC treatments at Fall River also decreased compared to the BO and IVC treatments, respectively.
A reduction in total Ca, K, and Mg pools due to WT and AVC treatments was paired with a net increase in total Al pools (Figure 7D; Appendix B). At Matlock, a significant increase in the soil exchangeable Al pools in the WT treatments resulted in a greater total site Al pool than in the BO treatment. Douglas-fir Al pools also increased significantly due to the AVC treatment compared to the IVC treatment at Matlock and Molalla.

4. Discussion

4.1. Douglas-Fir Biomass Allocation Equations

Individual-tree Douglas-fir biomass allocation to foliage and branches fluctuated over time. Fifteen-year needle and branch biomass at Matlock and Molalla fit the 11-year biomass equations from Fall River because the trees were of similar size due to lower productivity at these sites [19]. Conversely, even though 11-year, 20-year, and 47-year biomass samples were all from Fall River, foliar and branch biomass on 20-year trees were underpredicted by the 11-year equations and overpredicted by the 47-year equations due to crown recession [19,20]. The addition of crown ratio improved the prediction of foliar and branch biomass of all Douglas-fir age classes. Crown ratio combined with radial measurements (DBH or tree basal area) have been used to improve the prediction of foliar biomass of older trees [27,33].
Douglas-fir stem biomass was less affected by tree age and size compared to foliar and branch biomass. The stem biomass equation of Devine et al. [19] predicted the stem biomass of 15-year Matlock and Molalla trees well, but underpredicted 20-year Fall River trees. Using HT in addition to DBH improved prediction of stem biomass for trees 5 to 47 years old. The combination of DBH, HT, DBH:QMD ratio, and latitude were recently used to predict stem wood biomass of 39- to 120-year-old Douglas-fir [27], but DBH:QMD ratio and latitude were not found to improve prediction of the 5- to 47-year-old Douglas-fir in this study.
At Fall River, the WT and WT+ treatments resulted in 39.1 and 47.9 Mg ha−1 greater biomass removal, respectively, compared to the BO treatment [10]. This removal of biomass resulted in two times greater N removal from the WT+ treatment than the BO treatment. The lower productivity Matlock and Molalla sites resulted in 7.5 and 5.7 Mg ha−1 greater biomass removal, respectively, in the WT treatment than the BO treatment, but nutrient removals from harvest were not published [7]. The biomass allocation equations produced in this study will improve the estimation of organic biomass removals from Douglas-fir harvest operations based on Douglas-fir size and crown recession. Greater removal of harvest residuals will result in greater permanent losses of nutrients that would otherwise be slowly released into the soil. Additional biomass and nutrient removals from whole tree harvesting must be accounted for to maintain the sustainability of whole tree harvests to supply bioproduct markets [4,17].

4.2. Aboveground Biomass

At Matlock, lower cover of logging debris in WT relative to BO [7], and subsequent development of a lower abundance of native vines and shrubs [8,25], repeatedly released seed-bank origin Scotch broom resulting in greater overstory competing vegetation biomass and cover of Scotch broom at 15 years (Figure 5B). In contrast, the greater residual organic matter and greater biomass and cover of native vines and shrubs in the BO treatment limited development of overstory competing vegetation [8]. However, the effects of whole tree removals on competing vegetation biomass are site-specific because there were no effects of whole tree removals on competing vegetation biomass at 5 and 15 or 20 years at Fall River and Molalla [18].
Whole tree removals resulted in lower 15 to 20 year Douglas-fir biomass at all sites mostly due to a small stem biomass than bole-only removals. Zhang et al. [14] also found smaller planted conifer biomass at age 20 due to whole tree removals. The WT+ treatment stem and total biomass at Fall River were also greater than the WT treatment and not different than the BO treatment, which is likely due to temporary improvements in microclimate in the WT+ treatment [11,34]. While total Douglas-fir biomass was significantly different at 15 to 20 years, there were no differences in periodic stand volume growth between organic matter removal treatments from 10 to 15 years [13] suggesting that any improvements in microclimate have diminished over time. In a meta-analysis of 10-year-old LTSP sites, there were few significant effects of organic matter removals on tree biomass [6]. However, as stands reach canopy closure it is hypothesized that nutrient losses will cause the greatest effects on tree growth due to high nutrient demands [4].
The effects of AVC on current competing vegetation in this study depended upon the intensity of vegetation control and the types of competing vegetation at each site. After five years, annual vegetation control resulted in lower biomass of competing vegetation at Fall River and Molalla, but no significant differences were found at Matlock [18]. Ten to 15 years after completion of the vegetation control treatments, the AVC treatment continued to affect competing vegetation biomass at Fall River (Figure 5), but no significant differences in competing vegetation at Matlock and Molalla were likely due to operational vegetation control regimes compared to complete vegetation control at Fall River (95% control) [7,10]. At Matlock, the absence of differences in competing vegetation biomass and cover between AVC and IVC could be due to treatment of Scotch broom on all plots three times to prevent high mortality of Douglas-fir [7,8]. Annual vegetation control at Molalla was largely focused on suppression of herbaceous competing vegetation [7] and did not specifically target the cascara and bitter cherry, which continues to compete for overstory light availability in all treatments. Flamenco et al. [35] also found that five years of annual vegetation control resulted in variable competing vegetation biomass after 11 years in coastal Pacific Northwest due to hardwood competition and different overstory conifer species.
At five years, the AVC treatments on all sites contained greater total Douglas-fir biomass than the IVC treatment due to improved microclimate conditions and reduced competition [11,18,34]. At 15 to 20 years, AVC treatments still contained greater Douglas-fir biomass at all sites. Similarly, annual vegetation control has resulted in greater planted conifer biomass for 0 to 20 years due to improvements in microclimate conditions, seedling survival, and foliar nutrition [6,14,35,36]. Flamenco et al. [35] found that conifer stands receiving annual vegetation control contained greater leaf area index and total aboveground biomass than untreated stands 11 years after vegetation control ended. These findings support the use of multiple years of competing vegetation control to improve long-term biomass of planted conifer species.

4.3. Organic Matter Removal Effects on Net Nutrient Biomass

Organic matter removal treatments did not result in net changes in aboveground and belowground nutrient pools except for a net increase in the total Al pool at Matlock. Douglas-fir C and N pools tended to decrease in WT treatments due to lower Douglas-fir biomass along with decreases in foliar N at Fall River and Molalla. The long-term effects of whole tree harvesting have also shown no changes in soil and site C and N pools compared to bole-only harvests [4,37,38,39]. Himes et al. [40] projected that Douglas-fir soils with low N (<9000 kg N ha−1) similar to Matlock are at high risk of N depletion due to whole tree harvesting. However, at Matlock the large amount of Scotch broom biomass and cover in the WT treatment increased soil NO3 adsorption and foliar N concentration as well as the competing vegetation N pool in this treatment [8,13,41] (Figure 6). Although root nutrient biomass and nutrient concentrations were not measured in this study, root biomass of Douglas-fir is estimated to be small portion of aboveground tree biomass (18%–22%) with greater C allocation to roots on sites with low productivity [8,40,42]. Future studies at these sites will examine treatment effects on root biomass and nutrient pools.
Whole tree harvesting has been found to reduce forest floor and soil P over time compared to bole-only harvests [4,37], but no significant changes in forest floor and soil P were found in this study except at Molalla where greater forest floor biomass resulted in a greater forest floor P pool. The three sites used in this study contain young soils [22] and adequate extractable soil P compared to regional Douglas-fir soils [13]. However, there were significant reductions in Douglas-fir P pools at Matlock and Molalla due to lower Douglas-fir biomass in the whole tree removal treatment (Figure 6).
In whole tree removal treatments, soil Ca, K, and Mg concentrations and pools tended to be lower in the short- and long-term compared to bole-only harvests [4,13,37]. While the soil exchangeable K pool was only significantly decreased in the WT+ treatment at Fall River, soil exchangeable K concentrations were also reduced in the WT treatments at Fall River and Matlock, which was likely due to the large removal of K from removed organic matter [13,43]. The WT+ treatment at Fall River also contained lower Ca, K, and Mg pools in the forest floor compared to the BO treatment, and Douglas-fir Ca and K pools were lower in WT treatments at Matlock and Molalla. Decomposing K from residual biomass is also less likely to be captured in the soil than Ca and Mg [44]. The decreases in site K were assumed to be lost from the system because there were no differences in soil exchangeable K at 0 to 300 cm depth in the BO and WT+ treatments in a study five years earlier at Fall River (C. Dietzen, unpublished data). In addition, the WT treatment at Matlock contained increased soil and total Al pools compared to the BO treatment. Achat et al. [45] also found a corresponding increase in soil exchangeable Al with a decrease in base saturation after whole tree harvesting.

4.4. Vegetation Control Effects on Net Nutrient Biomass

Annual vegetation control treatments had no significant effects on total C and N pools at these sites. The Douglas-fir C pool increased due to greater biomass in the AVC treatment at all sites, but no changes were found in competing vegetation or belowground C pools (Figure 6). Competing vegetation and forest floor N pools tended to decrease due to AVC, which could be due to greater leaching of N in the first two to four years [12]. While these losses were not found to significantly affect the shallow soil N pool at 15 years, lower N availability in the AVC treatment is suggested through lower 5-cm depth NO3 adsorption, soil N concentrations (0–60 cm), and foliar N concentrations than in the IVC treatment [8,13,41]. In deep soil studies at Fall River, soil C and N pools were mostly unchanged due to the AVC treatment except for a decrease in the 0 to 15 cm and 250 to 300 cm depths 12 and 15 years after harvesting, respectively [38,39].
The largest changes in nutrients due to the AVC treatment were decreases in soil Ca, K, and Mg pools (Figure 7). Although there was greater Douglas-fir Ca, K, and Mg pools in the AVC treatment, there were net losses in Ca, K, and Mg pools at most sites. At Fall River and Molalla, total Ca and Mg pools in the AVC treatment were 10% to 31% lower than in the IVC treatment. The total K pool in the AVC treatment was 23% lower than in the IVC treatment at Molalla. Losses of soil exchangeable Ca, K, and Mg were not only associated with the shallow soil because decreases in exchangeable base cation concentrations were also found from 15 to 60 cm depth at Molalla (R. Slesak, unpublished data). However, these losses have not affected nutrient uptake to Douglas-fir at Molalla because this soil contains high exchangeable base cation pools compared to regional Douglas-fir soils [13]. In contrast, previous research has shown that soils with high N and low exchangeable base cations (similar to Fall River) are most likely to result in losses of base cations due to excess leaching [46], which can be exacerbated by intensive vegetation control treatments [12,47].

5. Conclusions

The experimental and intensive whole tree removal treatments applied at these three study sites consistently resulted in modestly lower Douglas-fir biomass and aboveground C and N pools relative to the more industry-standard bole only removal treatments. Despite the observed aboveground growth differences, soil and total site nutrient pools were minimally affected by the level of experimental biomass removal, even though the whole tree removals were far in excess of any normal operational procedures. Because stands at canopy closure have the greatest demand for nutrients, the intense experimental whole tree harvest may result in continued detrimental effects on tree growth as the stands age. While whole tree removals appear to have a minimal effect on site nutrient pools, lower harvest debris cover was associated with greater competing vegetation biomass at Matlock where the invasive species Scotch broom was present. These findings suggest that standard industry practice of retaining harvest residuals is likely resulting in greater Douglas-fir biomass while diminishing release of seed-bank origin competing vegetation.
Ten to 15 years after the five years of intensive annual vegetation control ended, Douglas-fir biomass and nutrient concentrations and pools were greater at all sites compared to IVC treatments. However, the elevated Douglas-fir nutrient pools in the AVC treatment does not balance out the substantial losses in Ca, Mg, and K from forest floor and shallow soil pools. The net effect is a loss in Ca, Mg, and K pools from these sites. This indicates that the extreme duration and intensity of vegetation control applied in these studies should be balanced with retaining native understory vegetation to limit leaching of base cations after harvest. The current industry standard of one to two years of partial vegetation control may be achieving this desired balance.

Author Contributions

Conceptualization, K.M.L., T.B.H., S.M.H. and W.R.L., methodology, K.M.L., T.B.H., S.M.H. and W.R.L., validation, K.M.L., T.B.H. and S.M.H., formal analysis, K.M.L., T.B.H., S.M.H. and W.R.L., investigation, K.M.L., T.B.H., S.M.H. and W.R.L., writing—review and editing, K.M.L., T.B.H. and S.M.H., visualization, K.M.L., T.B.H. and S.M.H., supervision, E.C.T., project administration, E.C.T., funding acquisition, K.M.L., R.B.H., T.B.H. and E.C.T. All authors have read and agreed to the published version of the manuscript.

Funding

This research was funded by NCASI (SF-SFG-2620), National Science Foundation (1439653), and USDA National Institute for Food and Agriculture (Grants.gov number: GRANT11325729).

Acknowledgments

The authors would like to thank the University of Washington School of Environmental and Forest Sciences, Stand Management Cooperative, National Council for Air and Stream Improvement, and USDA National Institute for Food and Agriculture (Grants.gov number: GRANT11325729) for their financial support of this study. We would like to thank Anais Sanchez, Lindsey VanderMolen, Amelia Root, James Dollins, Dave Peter, and Jason James for their field and technical assistance. Additionally, we are grateful to Weyerhaeuser Company, Green Diamond Resource Company, and Port Blakely Tree Farms LLC for use of their land and logistical support.

Conflicts of Interest

The authors declare no conflict of interest.

Appendix A

Table A1. Aboveground and belowground C, N, and P nutrient pools at Fall River, Matlock, and Molalla. Values with different lowercase letters are significantly different (p < 0.10) among organic matter (BO, WT, WT+) or vegetation control treatments (IVC, AVC).
Fall RiverMatlockMolalla
Nutrient PoolTreatmentDFCVUSFFSoilTotalDFCVUSCVOSFFSoilTotalDFCVUSCVOSFFSoilTotal
C
(Mg ha−1)
BO90.5 b0.001510.677.0178.115.8 b1.6 b0.7 a9.444.9 a72.332.1 b0.63.16.5 a57.6100.0
WT87.0 a0.000611.085.1183.112.6 a0.9 a3.3 b8.553.7 b78.527.7 a0.54.58.5 b53.895.0
WT+90.2 b0.00007.486.8184.4
IVC88.9 a0.0021 a12.081.8182.89.5 a1.32.09.252.574.527.6 a0.65.37.356.997.6
AVC89.8 b0.0005 b9.281.4180.318.9 b1.12.48.746.076.332.2 b0.52.47.754.697.5
N
(kg ha−1)
BO3410.0776314 b2650330412434 b18 a27517532204205 b1348212 a19222399
WT3080.0270297 b2582318710818 a70 b26819432407167 a1257274 b19742484
WT+3250.0003188 a28363350
IVC3330.10372 b2734343988 a3061 b30919632451176137323420952591
AVC3270.03247 a26613235144 b2227 a23317332160195123225218022292
P
(kg ha−1)
BO49.00.01331.713.494.024.0 b5.11.1 a24.625.980.833.0 b1.87.518.5 a7.268.0
WT46.60.00430.514.391.519.0 a2.55.9 b27.427.181.825.5 a1.49.222.8 b6.765.6
WT+52.80.00022.013.588.4
IVC46.50.017 b35.6 b12.594.615.4 a4.54.430.727.081.927.7 a1.711.919.35.866.3
AVC50.30.004 a26.8 a14.091.127.6 b3.02.621.326.080.630.8 b1.54.822.08.167.2
Abbreviations: Total Douglas-fir biomass (DF), understory competing vegetation (CVUS), overstory competing vegetation (CVOS), forest floor (FF), soil (0–15 cm), total (total aboveground and belowground pools).

Appendix B

Table A2. Aboveground and belowground Ca, K, Mg, and Al nutrient pools at Fall River, Matlock, and Molalla. Values with different lowercase letters are significantly different (p < 0.10) among organic matter (BO, WT, WT+) or vegetation control treatments (IVC, AVC).
Fall RiverMatlockMolalla
Nutrient PoolTreatmentDFCVUSFFSoilTotalDFCVUSCVOSFFSoilTotalDFCVUSCVOSFFSoilTotal
Ca
(kg ha−1)
BO2480.01878 b31864411327 b479533757190 b115383 a12901626
WT2710.00877 b2205698814 a3273414621160 a970104 b11671510
WT+2880.00044 a160492
IVC2630.02299 b405 b767 b61 a222385505695157 a9869513041652
AVC2640.00760 a204 a528 a141 b191467443683193 b11379111521484
K
(kg ha−1)
BO1870.0914 b13934065 b24 b5 a2466340162 b154915 a331573
WT2070.0313 b10232248 a14 a25 b3054322123 a135420 b317526
WT+2150.009 a95319
IVC1730.012 a17 b15034041 a201930601711391576 b17371 b617 b
AVC2080.031 b11 a10832771 b181025591831461327 a18277 a481 a
Mg
(kg ha−1)
BO660.01418 b69154178 b2 a1846912831018 a195255
WT680.00517 b54139144 a8 b2046922631224 b177241
WT+730.00010 a42125
IVC650.01823 b89 b177 b11 a772249952531622216 b282 b
AVC690.00514 a48 a131 a20 b63164388293720155 a213 a
Al
(kg ha−1)
BO11.51.2 × 10−32.1205.0218.65.40.30.11.033.9 a40.7 a7.70.30.30.6 a20.829.8
WT18.15.9 × 10−42.0234.7254.84.50.21.51.054.4 b61.5 b8.20.20.20.8 b25.234.6
WT+20.63.9 × 10−62.9268.4292.0
IVC10.41.3 × 10−31.6194.6206.73.8 a0.30.80.940.346.2 a7.0 a0.40.30.724.733.2
AVC17.16.0 × 10−42.5239.5259.16.1 b0.30.81.047.956.0 b9.0 b0.10.20.721.231.2
Abbreviations: Total Douglas-fir biomass (DF), understory competing vegetation (CVUS), overstory competing vegetation (CVOS), forest floor (FF), soil (0–15 cm), total (total aboveground and belowground pools).

References

  1. Powers, R.F. Long-Term Soil Productivity: Genesis of the concept and principles behind the program. Can. J. For. Res. 2006, 36, 519–528. [Google Scholar] [CrossRef] [Green Version]
  2. Farve, R.; Napper, C. Biomass Fuels & Whole Tree Harvesting Impacts on Soil Productivity—Review of Literature; USDA Forest Service, National Technology and Development Program: San Dimas, CA, USA, 2009; 60p. [Google Scholar]
  3. Powers, R.F.; Scott, D.A.; Sanchez, F.G.; Voldseth, R.A.; Page-Dumroese, D.; Elioff, J.D.; Stone, D.M. The North American long-term soil productivity experiment: Findings from the first decade of research. For. Ecol. Manag. 2005, 220, 31–50. [Google Scholar] [CrossRef]
  4. Thiffault, E.; Hannam, K.D.; Paré, D.; Titus, B.D.; Hazlett, P.W.; Maynard, D.G.; Brais, S. Effects of forest biomass harvesting on soil productivity in boreal and temperate forests—A review. Environ. Rev. Vol. 2011, 19, 278–309. [Google Scholar] [CrossRef]
  5. Fleming, R.L.; Powers, R.F.; Foster, N.W.; Kranabetter, J.M.; Scott, D.A.; Ponder, F., Jr.; Berch, S.; Chapman, W.K.; Kabzems, R.D.; Ludovici, K.H.; et al. Effects of organic matter removal, soil compaction, and vegetation control on 5-year seedling performance: A regional comparison of Long-Term Soil Productivity sites. Can. J. For. Res. 2006, 36, 529–550. [Google Scholar] [CrossRef] [Green Version]
  6. Ponder, F.; Fleming, R.L.; Berch, S.; Busse, M.D.; Elioff, J.D.; Hazlett, P.W.; Kabzems, R.D.; Kranabetter, J.M.; Morris, D.M.; Page-Dumroese, D.; et al. Effects of organic matter removal, soil compaction and vegetation control on 10th year biomass and foliar nutrition: LTSP continent-wide comparisons. For. Ecol. Manag. 2012, 278, 35–54. [Google Scholar] [CrossRef]
  7. Harrington, T.B.; Schoenholtz, S.H. Effects of logging debris treatments on five-year development of competing vegetation and planted Douglas-fir. Can. J. For. Res. 2010, 40, 500–510. [Google Scholar] [CrossRef]
  8. Harrington, T.B.; Slesak, R.A.; Dollins, J.P.; Schoenholtz, S.H.; Peter, D.H. Logging-debris and vegetation-control treatments influence competitive relationships to limit 15-year productivity of coast Douglas-fir in western Washington and Oregon. For. Ecol. Manag. 2020, 473. in press. [Google Scholar] [CrossRef]
  9. Shepard, J.P.; Creighton, J.; Duzan, H. Forestry herbicides in the United States: An overview. Wildl. Soc. Bull. 2004, 32, 1020–1027. [Google Scholar] [CrossRef]
  10. Ares, A.; Terry, T.A.; Piatek, K.B.; Harrison, R.B.; Miller, R.E.; Flaming, B.L.; Licata, C.W.; Strahm, B.; Harrington, C.A.; Meade, R.; et al. The Fall River Long-Term Site Productivity Study in Coastal Washington: Site Characteristics, Experimental Design, and Biomass, Carbon and Nitrogen Stores before and after Harvest; USDA Forest Service, National Technology and Development Program: Olympia, WA, USA, 2007; p. 85. [Google Scholar]
  11. Roberts, S.D.; Harrington, C.A.; Terry, T.A. Harvest residue and competing vegetation affect soil moisture, soil temperature, N availability, and Douglas-fir seedling growth. For. Ecol. Manag. 2005, 205, 333–350. [Google Scholar] [CrossRef]
  12. Slesak, R.A.; Schoenholtz, S.H.; Harrington, T.B.; Strahm, B.D. Dissolved carbon and nitrogen leaching following variable logging-debris retention and competing-vegetation control in Douglas-fir plantations of western Oregon and Washington. Can. J. For. Res. 2009, 39, 1484–1497. [Google Scholar] [CrossRef]
  13. Littke, K.M.; Harrington, T.B.; Slesak, R.A.; Holub, S.M.; Hatten, J.A.; Gallo, A.C.; Littke, W.R.; Harrison, R.B.; Turnblom, E.C. Impacts of organic matter removal and vegetation control on nutrition and growth of Douglas-fir at three Pacific Northwestern Long-Term Soil Productivity sites. For. Ecol. Manag. 2020, 468. [Google Scholar] [CrossRef]
  14. Zhang, J.; Busse, M.D.; Young, D.H.; Fiddler, G.O.; Sherlock, J.W.; TenPas, J.D. Aboveground biomass responses to organic matter removal, soil compaction, and competing vegetation control on 20-year mixed conifer plantations in California. For. Ecol. Manag. 2017, 401, 341–353. [Google Scholar] [CrossRef]
  15. Steinbrenner, E. Forest soil productivity relationships. In Forest Soils of the Douglas-Fir Region; Heilman, P., Anderson, H., Barmgartner, D., Eds.; Washington State University Cooperative Ext. Service: Pullman, WA, USA, 1979. [Google Scholar]
  16. Littke, K.M.; Harrison, R.B.; Zabowski, D. Determining the effects of biogeoclimatic properties on different site index systems of Douglas-fir in the coastal Pacific Northwest. For. Sci. 2016, 62, 503–512. [Google Scholar] [CrossRef]
  17. Kimmins, J.P. Evaluation of the consequences for future tree productivity of the loss of nutrients in whole-tree harvesting. For. Ecol. Manag. 1977, 1, 169–183. [Google Scholar] [CrossRef]
  18. Devine, W.D.; Harrington, T.B.; Terry, T.A.; Harrison, R.B.; Slesak, R.A.; Peter, D.H.; Harrington, C.A.; Shilling, C.J.; Schoenholtz, S.H. Five-year vegetation control effects on aboveground biomass and nitrogen content and allocation in Douglas-fir plantations on three contrasting sites. For. Ecol. Manag. 2011, 262, 2187–2198. [Google Scholar] [CrossRef]
  19. Devine, W.D.; Footen, P.W.; Harrison, R.B.; Terry, T.A.; Harrington, C.A.; Holub, S.M.; Gould, P.J. Estimating Tree Biomass, Carbon, and Nitrogen in Two Vegetation Control Treatments in An 11-Year-Old Douglas-Fir Plantation on a Highly Productive Site; Res. Pap. PNW-RP-591; U.S. Department of Agriculture, Forest Service, Pacific Northwest Research Station: Portland, OR, USA, 2013; 29p.
  20. Harrison, R.B.; Terry, T.; Licata, C.; Flaming, B.; Meade, R.; Guerrini, I.; Strahm, B.; Xue, D.; Lolley, M.; Sidell, A. Biomass and stand characteristics of a highly productive mixed Douglas-fir and western hemlock plantation in coastal Washington. West. J. Appl. For. 2009, 24, 180–186. [Google Scholar] [CrossRef] [Green Version]
  21. Soil Survey Staff, Natural Resources Conservation Service, United States Department of Agriculture. Official Soil Series Descriptions. Available online: https://soilseries.sc.egov.usda.gov/osdname.aspx (accessed on 27 September 2019).
  22. Kruckeberg, A. The Natural History of Puget Sound Countr; The University of Washington Press: Seattle, WA, USA, 1991. [Google Scholar]
  23. Slesak, R.A.; Schoenholtz, S.H.; Harrington, T.B. Soil C and nutrient pools of Douglas-fir plantations five years after manipulating biomass and competing vegetation in the Pacific Northwest. For. Ecol. Manag. 2011, 262, 1722–1728. [Google Scholar] [CrossRef]
  24. Wang, T.; Hamann, A.; Spittlehouse, D.L.; Murdock, T.Q. ClimateWNA- high-resolution spatial climate data for Western North America. J. Appl. Meteor. Climatol. 2012, 51, 16–29. [Google Scholar] [CrossRef] [Green Version]
  25. Slesak, R.A.; Harrington, T.B.; Peter, D.H.; DeBruler, D.G.; Schoenholtz, S.H.; Strahm, B.D. Effects of intensive management practices on 10-year Douglas-fir growth, soil nutrient pools, and vegetation communities in the Pacific Northwest, USA. For. Ecol. Manag. 2016, 365, 22–33. [Google Scholar] [CrossRef] [Green Version]
  26. King, J. Site Index Curves for Douglas-fir in the Pacific Northwest; Weyerhaeuser Forestry; Weyerhaeuser Company, Forestry Research Center: Centralia, WA, USA, 1966; p. 8. [Google Scholar]
  27. Swan, R.J. Prediction of Aboveground Component Biomass for Coastal Douglas-fir (Pseudotsuga menziesii var. menziesii). Master’s Thesis, School of Environmental and Forest Sciences, University of Washington, Seattle, WA, USA, 2019. [Google Scholar]
  28. Draper, N.R.; Smith, H. Applied Regression Analysis, 2nd ed.; Wiley: New York, NY, USA, 1981. [Google Scholar]
  29. Bray, R.H.; Kurtz, L.T. Determination of total, organic, and available forms of phosphorus in soils. Soil Sci. 1945, 59, 39–45. [Google Scholar] [CrossRef]
  30. U.S. EPA. Method 3050B: Acid Digestion of Sediments, Sludges, and Soils. Revision 2; U.S. EPA: Washington, DC, USA, 1996.
  31. Fox, J.; Weisberg, S. car: Companion to Applied Regression. Available online: https://cran.r-project.org/web/packages/car/index.html (accessed on 16 April 2018).
  32. Holm, S. A simple sequentially rejective multiple test procedure. Scand. J. Statist. 1979, 6, 65–70. [Google Scholar]
  33. Putney, J.D.; Maguire, D.A. Shifts in foliage biomass and its vertical distribution in response to operational nitrogen fertilization of Douglas-fir in western Oregon. Forests 2020, 11, 511. [Google Scholar] [CrossRef]
  34. Devine, W.D.; Harrington, C.A. Influence of harvest residues and vegetation on microsite soil and air temperatures in a young conifer plantation. Agric. For. Meteor. 2007, 145, 125–138. [Google Scholar] [CrossRef]
  35. Flamenco, H.N.; Gonzalez-Benecke, C.A.; Wightman, M.G. Long-term effects of vegetation management on biomass stock of four coniferous species in the Pacific Northwest United States. For. Ecol. Manag. 2019, 432, 276–285. [Google Scholar] [CrossRef]
  36. Sanchez, F.G.; Scott, D.A.; Ludovici, K.H. Negligible effects of severe organic matter removal and soil compaction on loblolly pine growth over 10 years. For. Ecol. Manag. 2006, 227, 145–154. [Google Scholar] [CrossRef]
  37. Johnson, D.W.; Todd, D.E. Harvesting effects on long-term changes in nutrient pools of mixed oak forest. Soil Sci. Soc. Am. J. 1998, 62, 1725–1735. [Google Scholar] [CrossRef]
  38. Knight, E.J. Harvest Intensity and Competing Vegetation Control Have Little Effect on Soil Carbon and Nitrogen Pools in a Pacific Northwest Douglas-Fir Plantation. Master’s Thesis, School of Environmental and Forest Sciences, University of Washington, Seattle, WA, USA, 2013. [Google Scholar]
  39. Dietzen, C.A.; Marques, E.R.G.; James, J.N.; Bernardi, R.H.A.; Holub, S.M.; Harrison, R.B. Response of deep soil carbon pools to forest management in a highly productive Andisol. Soil Sci. Soc. Am. J. 2017, 81, 970–978. [Google Scholar] [CrossRef]
  40. Himes, A.J.; Turnblom, E.C.; Harrison, R.B.; Littke, K.M.; Devine, W.D.; Zabowski, D.; Briggs, D.G. Predicting risk of long-term nitrogen depletion under whole-tree harvesting in the coastal Pacific Northwest. For. Sci. 2013, 60, 382–390. [Google Scholar] [CrossRef] [Green Version]
  41. Root, A.M. The Effects of Biomass Removal and Competing Vegetation Control on Douglas-fir Foliar Nutrition in the Pacific Northwest, USA. Master’s Thesis, School of Environmental and Forest Sciences, University of Washington, Seattle, WA, USA, 2017. [Google Scholar]
  42. Keyes, M.R.; Grier, C.C. Above- and belowground net production in 40-year-old Douglas-fir stands on low and high productivity sites. Can. J. For. Res. 1981, 11, 599–605. [Google Scholar] [CrossRef]
  43. Duchesne, L.; Houle, D. Impact of nutrient removal through harvesting on the sustainability of the boreal forest. Ecol. Appl. 2008, 18, 1642–1651. [Google Scholar] [CrossRef]
  44. Thiffault, E.; Pare, D.; Belanger, N.; Munson, A.; Marquis, F. Harvesting intensity at clear-felling in the boreal forest: Impact on soil and foliar nutrient status. Soil Sci. Soc. Am. J. 2006, 70, 691–701. [Google Scholar] [CrossRef]
  45. Achat, D.L.; Deleuze, C.; Landmann, G.; Pousse, N.; Ranger, J.; Augusto, L. Quantifying consequences of removing harvesting residues on forest soils and tree growth—A meta-analysis. For. Ecol. Manag. 2015, 348, 124–141. [Google Scholar] [CrossRef]
  46. Perakis, S.S.; Maguire, D.A.; Bullen, T.D.; Cromack, K.; Waring, R.; Boyle, J.R. Coupled nitrogen and calcium cycles in forests of the Oregon Coast Range. Ecosystems 2006, 9, 63–74. [Google Scholar] [CrossRef]
  47. Devine, W.D.; Footen, P.W.; Strahm, B.D.; Harrison, R.B.; Terry, T.A.; Harrington, T.B. Nitrogen leaching following whole-tree and bole-only harvests on two contrasting Pacific Northwest sites. For. Ecol. Manag. 2012, 267, 7–17. [Google Scholar] [CrossRef]
Figure 1. Three affiliate sites of the North American Long-term Soil Productivity study in Washington and Oregon, USA. Map is sourced from ArcGIS (ArcMap version 10.6, Esri, Redlands, CA, USA).
Forests 11 01022 g001
Figure 2. Timeline of harvest, planting, and vegetation control, and Douglas-fir (DF) and competing vegetation biomass and soil sampling at the three sites.
Forests 11 01022 g002
Figure 3. Relationships between DBH and foliar (A), branch (B), and stem (C) at Fall River (current stand), Fall River (previous stand), Matlock, and Molalla. Previous biomass allocation equations from Fall River, Matlock, and Molalla are shown [19,20].
Forests 11 01022 g003
Figure 4. Biomass allocation model weighted residuals for foliar (A), branch (B), and stem (C) biomass.
Forests 11 01022 g004
Figure 5. Plot-level Douglas-fir stem, branch, and foliar biomass compared to overstory (OS) and understory (US) competing vegetation (CV) by treatment at each site. Asterisks within bars (components) or on top of bars (total) designate significant differences (p < 0.10) in biomass from the BO or IVC treatments. Y-axis scales are different for Fall River (A) due to larger Douglas-fir biomass and smaller competing vegetation biomass than at Matlock (B) and Molalla (C).
Forests 11 01022 g005
Figure 6. Net C (A), N (B), and P (C) nutrient pools in whole tree removal treatments (left frame: WT or WT+ minus BO treatment) and annual vegetation control (right frame: AVC minus IVC treatment) at Fall River (FR), Matlock (MAT), and Molalla (MOL). Asterisks denote significant differences from the BO or IVC treatments for a given study site. Values at the bottom of each graph are the total percent difference from the BO or IVC treatments.
Forests 11 01022 g006
Figure 7. Net Ca (A), K (B), Mg (C), and Al (D) nutrient pools in whole tree removal treatments (left frame: WT or WT+ minus BO treatment) and annual vegetation control (right frame: AVC minus IVC treatment) at Fall River (FR), Matlock (MAT), and Molalla (MOL). Asterisks denote significant differences from the BO or IVC treatments. Values at the bottom of each graph are the total percent difference from the BO or IVC treatment.
Forests 11 01022 g007
Table 1. Descriptive site variables and pre-treatment soil data to 1-m depth.
VariableUnitFall RiverMatlockMolalla
Plot Sizeha0.10.090.09
Latitudedegrees46.72147.20645.196
Longitudedegrees−123.410−123.442−122.285
Elevationm33435549
Mean Annual Temperature a°C9.610.79.8
Mean Annual Precipitation amm230020001800
Soil Water Holding Capacity bcm18.36.519.3
Soil Total N Contentkg ha−113,010 c4498 d9844 d
Soil Exchangeable
Ca Content
kg ha−1803 c744 d9930 d
Soil Exchangeable
Mg Content
kg ha−1349 c358 d4024 d
Soil Exchangeable
K Content
kg ha−1511 c188 d2496 d
Soil Extractable
P Content
kg ha−138 c59 d26 d
Previous Stand King’s Site Index
(Current Stand e)
m at 50 years42
(46)
36
(26)
36
(34)
a [24]; b [21]; c [8]; d Soil samples from the Matlock and Molalla sites were converted from 0.6 m [25] to 1 m using equations relating 0.6-m depth soil nutrients to 1-m depth soil nutrients (K. Littke, unpublished data; J. James, personal communication); e Current Stand King’s site index [26] is based on 15-year (this study) tree height measurements.
Table 2. Site ages, sample size, mean diameter at breast height (DBH), height (HT), and crown ratio (CR) (min-max) for the biomass data included in this study.
SiteAgenMean DBH (Range)Mean HT
(Range)
Mean CR
(Range)
Reference
(yr) (cm)(m)(m/m)
Fall River5464.3 (2–7)3.6 (2.2–5.3)0.89 (0.77–0.98)[18]
Fall River112613.3 (3.8–17.6)9.3 (7.3–11.9)0.86 (0.73–0.95)[19]
Fall River201719.4 (18.9–19.9)18.6 (17.5–20.5)0.51 (0.45–0.56)this study
Fall River473147.1 (14.9–79.9)34.8 (22.7–39.7)0.41 (0.22–0.55)[20]
Matlock5222.1 (0.4–4.7)2.2 (1.3–3.4)0.92 (0.74–0.99)[18]
Matlock151611.7 (8.5–15)8 (6.2–11.6)0.95 (0.90–0.98)this study
Molalla5432.6 (0.4–5.7)2.6 (1.3–4)0.91 (0.49–0.98)[19]
Molalla151614.4 (11.9–16.9)11.8 (9.8–13.2)0.91 (0.83–0.98)this study
Table 3. Douglas-fir biomass allocation equations.
Biomass ComponentEquationsnR2
Foliage ( D B H 1.5610     C R 1.2195 ) 5.9559 4.632000.82
Branch ( D B H 2.4311     C R 1.4106 ) 26.0892 20.832000.93
Stem ( D B H 1.583 H T 1.2717 ) 42.7899 45.161850.99
Biomass (kg); diameter at breast height (DBH) (cm); height (HT) (m); crown ratio (CR) (m/m); s (root mean square error), n (sample size).
Table 4. Significant treatment effects on Douglas-fir nutrient concentrations at Fall River, Matlock, and Molalla. Treatment means with different lowercase letters were significantly different (p < 0.10) between organic matter (BO, WT, WT+) or vegetation control treatments (IVC, AVC). All nutrient concentration values are shown as percentages.
SiteComponentNutrientANOVA ModelOM TreatmentsV Treatments
OMVBOWTWT+IVCAVC
p-Valuep-ValueMeanMeanMeanMeanMean
Fall RiverFoliarN0.030.081.32 b1.22 a1.29 ab1.28 a1.29 b
FoliarP0.240.040.1730.1680.1750.155 a0.178 b
MatlockFoliarN0.100.091.13 a1.22 b 1.22 b1.13 a
FoliarCa0.19<0.010.660.59 0.55 a0.71 b
BranchN0.490.060.350.37 0.38 b0.33 a
BranchK0.050.140.20 b0.17 a 0.200.18
StemP0.070.070.014 a0.019 b 0.019 b0.014 a
StemCa0.010.340.09 a0.11 b 0.100.09
StemMg0.030.030.011 a0.016 b 0.016 b0.011 a
StemAl0.420.060.00360.0045 0.0052 b0.0029 a
MolallaFoliarN0.050.181.17 b1.10 a 1.161.11
FoliarK0.040.100.82 b0.70 a 0.81 b0.72 a
Branch Al0.320.090.0190.021 0.018 a0.022 b

