Abstract
Long-term historic climate datasets are valuable tools to investigate climate variability, validate climate models and contextualize anticipated climate change. Surface solar radiation is one particularly relevant variable, with implications on policy decisions (e.g. performance of solar panels) and fundamental questions in climate science (e.g. regarding the energy budget). While all current twentieth century reanalyses provide surface solar radiation, we demonstrate that most of them fail to capture multidecadal surface radiation variability in Europe. To this end, we systematically compare the reanalyses 20CRv2c, 20CRv3, ERA20C and CERA20C and the free model run ERA20CM. We show that only CERA20C captures dimming (1949–1979) and brightening (1979–2009) in line with station observations, satellite-era reanalyses and established theory. The lack of multidecadal surface radiation variability in 20CRv2c/v3 is plausible given the use of constant aerosols. In contrast, ERA20CM, ERA20C and CERA20C are forced with time-varying aerosols. Despite this common forcing, ERA20CM and ERA20C surprisingly show no trends in clear-sky fluxes over the dimming and brightening periods while CERA20C shows significant trends. We discuss different potential explanations for this discrepancy (model versions, ocean coupling and ensemble size) and conclude that none of them provides a convincing explanation. Our results therefore imply that only CERA20C is suitable for assessments of surface solar radiation variability on multi-decadal timescales. This particularly applies to impact studies, for example, on long-term potentials of solar power generation.
Export citation and abstract BibTeX RIS

Original content from this work may be used under the terms of the Creative Commons Attribution 4.0 license. Any further distribution of this work must maintain attribution to the author(s) and the title of the work, journal citation and DOI.
1. Introduction
Robust decisions in light of climate uncertainty depend on reliable and actionable climatic information. Different potential sources of such information exist and range from observations, that are often not available for long periods and over large areas, to model results that are typically not validated with observations. Reanalyses combine an atmospheric model and observations and are usually considered to provide high-quality information. They are consequently extensively used in many disciplines within and beyond the climate sciences. Surface solar radiation is a key quantity in fundamental climate science and has implications for human society. For instance, renewable power generation from solar panels, a key technology for climate change mitigation, directly depends on the availability of surface solar radiation.
Longterm radiation records from the worldwide observational networks document substantial multidecadal variations in surface solar radiation (Wild et al 2005, Wild 2016). Additional evidence comes from satellite data (e.g. Sanchez-Lorenzo et al 2013). These variations remain evident also under cloud-free conditions, pointing to aerosols as a major cause (Gan et al 2014, Manara et al 2016, Schwarz 2020, Soni et al 2016, Wild 2012, Yang et al 2019). Specifically, the decline in surface solar radiation at widespread observation sites from the 1950s to the 1980s ('dimming') fits to the strongly increasing air pollution and associated aerosol burdens during this period. The following partial recovery of surface solar radiation since the 1980 s ('brightening') fits to the successive implementation of effective air pollution regulations which led to declining aerosol burdens and a more transparent atmosphere particularly in industrialized countries (Wild 2012). While older climate model generations (CMIP3) and reanalyses (ERA40) did not convincingly capture dimming/brightening (Wild and Schmucki 2011), recent model studies show both improvements (e.g. Chiacchio et al 2015) and substantial remaining challenges (Allen et al 2013, Storelvmo et al 2018). Nevertheless, capturing dimming and brightening can be of crucial importance in societally relevant applications. For instance, solar power potentials have varied substantially in China (Sweerts et al 2019) and Germany (Müller et al 2014) over multiple decades.
The availability of 20th century reanalyses opens new opportunities to investigate solar generation variability. Their global and uninterrupted coverage allows worldwide solar variability assessments on up to centennial timescales. The standardized output data formats of 20th century and satellite-era reanalyses means that established methods for the recent past can be effortlessly extended further back (such as solar power generation, Pfenninger and Staffell 2016). However, caution is essential as it is unclear whether 20th century reanalyses capture solar radiation variability well. 20th century reanalyses rely on sparse observations and do not assimilate any radiation-related quantities and are therefore substantially different to modern-era reanalyses in terms of the constraining observations. Moreover, reported discrepancies in terms of spurious trends in MSLP (Bloomfield et al 2018), storminess (Befort et al 2016, Rohrer et al 2019) and assimilated marine wind speeds (Wohland et al 2019), fuel scepticism about the reliability of 20th century reanalyses for quantitative surface climate assessments. In this study, we therefore investigate the inter-reanalyses agreement on multidecadal dimming and brightening, comparing 20th century reanalyses with satellite-era reanalyses and observations to identify which 20th century reanalyses best represent surface solar radiation fields for use in impact models.
2. Data and methods
2.1. 20th century reanalyses
This study utilizes all reanalyses of the 20th century that were available in late 2019 (see table 1). All of them are extensively used, for instance to study ice sheets (Fettweis et al 2017), hydrology (Caillouet et al 2017), precipitation (Rustemeier et al 2019) and extreme events (Brönnimann 2017). Reanalyses combine a numerical model of the earth system with observations in a process called data assimilation. The provision of a century-scale reanalysis is complicated by the limited number and quality of observations in the early 20th century. Two different centers currently provide such 20th century reanalyses, namely the National Oceanic and Atmospheric Administration (NOAA) in collaboration with the Cooperative Institute for Research in Environmental Sciences at the University of Colorado Boulder (CIRES) and the European Centre for Medium-Range Weather Forecasts (ECMWF). Sea surface temperature boundary data is always from HadISST using the latest version that was available during reanalysis production. The reanalyses differ in ensemble size, resolution, numerical weather prediction model and resolved climate subsystems (for example, CERA20C from ECMWF is the only one that explicitly models ocean dynamics). Reanalyses from the same data center are interlinked in multiple ways:
- (a)They are based on the same numerical weather prediction model. Even though the model version changes, essential components of the code and its structure usually remain similar over a few years. For example, the only major changes in the representation of radiation transfer between Cy38r1 and Cy41r2 of the IFS system are 'approximate updates to mitigate coastal temperature errors' (ECMWF 2016). In both IFS versions, the code is based on the Rapid Radiation Transfer Model (ECMWF 2016, ECMWF 2012, Mlawer et al 1997, Iacono et al 2008) suggesting that largely identical transfer models were used in ERA20CM/ERA20C and CERA20C. The number of vertical levels and the highest level (91 and 1 Pa) are also shared by all ECMWF centennial reanalyses.
- (b)They follow a similar data assimilation strategy. While NOAA follows a minimalist approach in only assimilating MSLP, the ECMWF assimilates both marine winds and MSLP. The assimilation of marine winds has been shown to induce substantial disagreement of long-term surface wind speed trends between ERA20C/CERA20C and 20CRv2c (Wohland et al 2019) in line with spurious trends found in ERA20C MSLP gradients (Bloomfield et al 2018). Including the free model run ERA20CM has proven beneficial before at it allows investigation of the effect of assimilating uncertain observations, potentially leading to deeper understanding.
- (c)The ECMWF has decided to chunk the 20th century in different segments of six year duration, which we refer to as streams. Streams are computed in parallel and therefore reduce the required wall-clock time by approximately a factor of twenty. The parallelization implies that the second (nth) stream can not be initiated from the first (n-1 th) stream because all streams are calculated simultaneously. Therefore ECMWF initializes streams from the predecessor dataset meaning that ERA20C (CERA20C) streams are initialized from ERA20CM (ERA20C). Signals can hence propagate through the different products. NOAA/CIRES follow a similar approach and 20CRv3 streams are initialized from 20CRv2c.
- (d)Except for volcano emissions, 20CRv2c and 20CRv3 use aerosol forcing that does not evolve from year to year (Gil Compo, personal communication) while ERA20CM, ERA20C and CERA20C use time-varying aerosol forcing from the Climate Model Intercomparison Project 5 (Patrick Laloyaux, personal communication). The CMIP5 aerosol forcing captures the a maximum in sulphate aerosols around 1980 (Hersbach et al 2015).
Table 1. Overview of current 20th century reanalyses.
| Name | Data center | model | ensemble size | time span | hor. resolution | specialty | interdependence | reference |
|---|---|---|---|---|---|---|---|---|
| 20CRv2c | NOAA/CIRES | GFS 2008EX | 56 | 1851–2014 | 1.875°· 1.875° | Compo et al (2011) | ||
| 20CRv3 | NOAA/CIRES | GFS v14.0.1 | 80 | 1836–2015 | 0.5°· 0.5° | successor of 20CRv2c streams initialized from 20CRv2c | Slivinski et al (2019) | |
| ERA20CM | ECMWF | IFS Cy38r1a | 10 | 1899–2010 | 1.125°· 1.125° | free model run | Hersbach et al (2015) | |
| ERA20C | ECMWF | IFS Cy38r1a | 1 | 1900–2010 | 1.125°· 1.125° | successor of ERA20CM streams initialized from ERA20CM | Poli et al (2016) | |
| CERA20C | ECMWF | IFS Cy41r2 | 10 | 1901–2010 | 1.125°· 1.125° | coupled ocean | succesor of ERA20C streams initialized from ERA20C | Laloyaux et al (2018) |
All ECMWF reanalyses use the same solar forcing from CMIP5 (Hersbach et al 2015, Poli et al 2016, Laloyaux et al 2018), 20CR uses an 11-year solar cycle in version 2c and data from the Total Solar Irradiance Reconstruction in version 3 (Slivinski et al 2019, Coddington et al 2016).
2.2. Satellite-era reanalyses
For comparison and validation, we also include two ECMWF satellite-era reanalyses covering the period from 1979. They are ERAI (Dee et al 2011) and ERA5 (Hersbach et al 2020) and are based on IFS Cy31r2 and Cy41r2, respectively. This means that ERAI uses a model version that is older than the ones used for ERA20CM, ERA20C and CERA20C while ERA5 uses the same version as CERA20C.
Table 2. Overview of ECMWF modern reanalyses.
| Name | Data center | model | ensemble size | time span | hor. resolution | specialty | interdependence | reference |
|---|---|---|---|---|---|---|---|---|
| ERAI | ECMWF | IFS Cy31r2 | 1 | 1979–2019 | 0.75°· 0.75° | Dee et al (2011) | ||
| ERA5 | ECMWF | IFS Cy41r2 | 1 | 1979 – present | 0.56°· 0.56° HRES: 0.28°· 0.28° | to be extended to 1950–present | successor of ERAI | Hersbach et al (2020) |
2.3. Relevant quantities
We focus on surface radiation and use the following notations that draw from the ECMWF conventions. Surface Solar Radiation Downwards (SSRD) expresses the downward component of shortwave radiation that reaches the earth surface and includes direct and diffuse radiation. In both 20CR reanalyses, SSRD is called downward solar radiation flux. To isolate the effect of clouds in the ECMWF reanalyses, we investigate total cloud cover (TCC) and clear-sky surface fluxes. Clear-sky fluxes are 'computed for exactly the same atmospheric conditions of temperature, humidity, ozone, trace gases and aerosol, but assuming that the clouds are not there' (Hogan 2015).
We refer to the downward component of the clear-sky solar radiation as surface solar downward radiation in clear-sky (SSDRC). As SSDRC has not been archived, we compute it from the net surface solar radiation clear-sky (SSRC) as

where α denotes the surface albedo. Following Hogan (2015), the forecast surface albedo is used as a proxy for α.
Lastly, we investigate changes in total column water (TCW) which affects both all-sky and clear-sky radiation. It is defined as 'the sum of water vapour, liquid water, cloud ice, rain and snow in a column extending from the surface of the Earth to the top of the atmosphere' (ECMWF 2018). Aerosol Optical Depth (AOD) is not available (ECMWF 2020, Copernicus Support Unit, personal communication, 2020).
2.4. Station measurements
We use SSRD measurements from the Global Energy Balance Archive (GEBA, Wild et al 2017) to validate the reanalyses. We use all GEBA stations that (a) have data back to 1949 or earlier and (b) pass the SNHT homogeneity test (for details, see Sanchez-Lorenzo et al 2013). Only the stations in Potsdam, Locarno-Monti and Stockholm fulfil these criteria, yielding a limited but useful sampling over different parts of Europe.
2.5. Trend analysis
We perform linear trend analysis over the periods 1949-1979 (dimming) and 1979-2009 (brightening). Both periods are of equal length to allow meaningful application of the same significance tests. The end of the chosen brightening period in 2009 approximately coincides with the end of the ECMWF centennial reanalyses in 2010. We test for the sensitivity to other definitions of the dimming (1951–1977, 1957–1983) and brightening periods (1981–2007, 1983–2009) which generally does not reveal important differences. Unless otherwise stated, the ensemble means are used and the robustness of the results within the ensemble is assessed subsequently. To mute effects from the seasonal cycle, all trends are calculated from annual mean values. Trends are called statistically significant if the null hypothesis of no trend can be rejected at a 95% confidence level (using a Wald test with t-distribution of the test statistic as implemented in scipy.stats.lingress; for methodological details see Vogelsang (1998)). Note that this method to assess significance is local and that it is possible that locally non-significant trends of the same sign over a larger region would be significant if the assessment was done non-locally. While the focus of this study is on locally significant trends, also the non-significant trends may thus carry important information and we generally report both in the figures.
3. Results
3.1. Overview of multi-decadal trends in SSRD
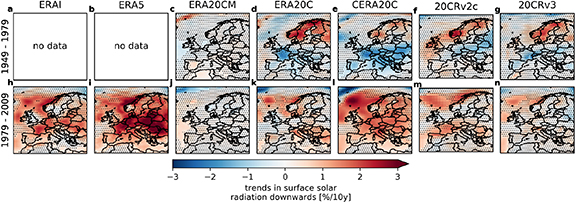
We report pronounced disagreement between different reanalyses (see figure 1). In the dimming period (1949–1979), only CERA20C features a statistically significant large-scale reduction in SSRD over central and southern Europe (figure 1(e). ERA20C also displays some areas with declining SSRD (e.g. France, Italy, Southern Germany) but the trends are weaker in magnitude and also barely statistically significant, implying that the trends can not be separated from climate variability with high levels of confidence (figure 1(d). Both versions of 20CR lack a clear large-scale pattern (figure 1(f),(g). In some places they disagree with each other regarding the sign of the trend (e.g. Spain, Russian Federation) and they also disagree with the large-scale dimming in CERA20C (e.g. in Italy). Remarkably, most 20th century reanalyses agree on brightening over Scandinavia with varying magnitude and statistical significance. ERA20CM only features very weak and generally non-significant signals (see figure 1(c).
Figure 1. Trends in surface solar radiation downwards (SSRD). Trends in the first row (a)–(g) are calculated from the annual values between 1949 and 1979 whereas the second row (h)–(n) refers to the period 1979 to 2009. Columns represent different reanalyses as indicated in the titles. Hatched areas mark lack of statistical significance (less than 95% confidence). ERAI and ERA5 are not available during the early period (a),(b). Where applicable, trends are computed based on the ensemble mean (ERA20CM, CERA20C, 20CRv2c and 20CRv3).
Download figure:
Standard image High-resolution imageModern reanalysis can be used as a reference in the brightening period (1979-2009). Both ERAI (figure 1 (h) and ERA5 (figure 1 (i) generally show upward trends in SSRD over the brightening period. The trends in ERA5 are stronger and more statistically significant in most locations. We double-checked with a non-ECMWF modern reanalysis, namely MERRA2, which shows the same evolution (see figure C7). Despite this agreement on the large-scale evolution in three modern reanalyses, differences exist on finer spatial scales. In the North-Eastern Mediterranean area, for example, significant trends are reported by ERA5 which are weak and insignificant in ERAI and weak, insignificant and of opposite sign in MERRA2. Overall, this suggests that reanalyses assimilating similar data and using similar models may produce different SSRD trends locally while agreeing on the large-scale brightening signal. Among the 20th century reanalyses, only CERA20C reproduces this large-scale brightening (figure 1 l). Virtually the entire continent displays upward SSRD trends and CERA20C also agrees very well with ERA5 in terms of the significance pattern. All other long-term reanalyses feature some differences between the dimming and brightening periods but importantly fail to capture large-scale brightening (see. Figures 1(j),(k),(m),(n). The older 20CRv2c agrees slightly better with ERA5/ERAI than its successor 20CRv3 as can be seen over Southern France and Switzerland.
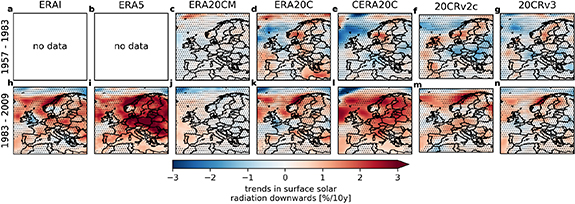
We tested the temporal sensitivity of these results by choosing different dimming and brightening periods. The results are robust. Neither an exclusion of the first and last two years nor an offset of the transition to brightening by four years substantially alters the results (cf figure A1 & A2). Some changes of the significance patterns occur, as expected under changes of the sample size. For example, the trends during the dimming phase are still predominantly negative, yet barely exceed the significance threshold. The brightening trends, however, remain significant in many locations. Moreover, we verified that no jumps or outliers cause the large-scale signals by investigating the time series over a focus area (10–30°E, 40–50°N; see appendix figure E12).
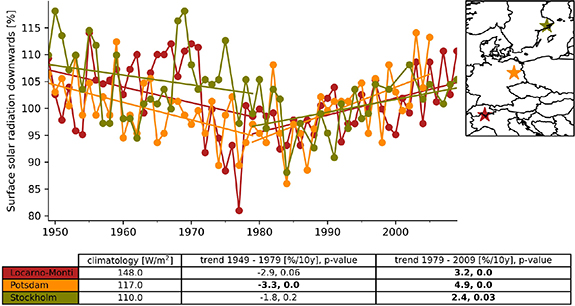
Additional evidence comes from station observations (see figure 2). All stations feature a dimming in the early phase and a brightening later on. The magnitude of the trends is substantial and ranges from −3.3%/10y to −1.8%/10y in the dimming and 4.9%/10y to 2.4%/10y in the brightening phase, confirming both the sign and the order of magnitude of the CERA20C results. Nevertheless, the amplitude of the trends in CERA20C barely exceeds ± 2%/10y and is thus underestimated by roughly a factor of two (figure 1 (l). The amplitude is better captured in ERA5 (figure 1(i). Despite this good overall agreement, the increase in SSRD over Scandinavia during the dimming period (figure 1(d)–(g) disagrees with the Stockholm observations which feature a downward trend (not significant at the 95% level). This apparent contradiction could be linked to land-sea effects and the coarse resolution of current 20th century reanalyses which report generally weaker or negative trends over the baltic.
Figure 2. Surface solar radiation downwards from GEBA station observations. Values are normalized by division with the climatology (i.e. the 1979-2009 mean). The table displays the climatology per station as well as trends and their p-values for the two periods under consideration. Trends that are statistically significant at the 95% level are bold.
Download figure:
Standard image High-resolution imageThe limited ability of 20CRv2c and 20CRv3 to reproduce dimming and brightening comes as no surprise, given that NOAA used constant aerosols. The substantial spread in the ECMWF reanalyses, in contrast, can not be explained equally as simply since those products utilize the same time-evolving aerosol forcings from CMIP5. The remainder of this study therefore focuses on the ECMWF reanalyses which all use the same time-varying ozone and greenhouse gas forcings (Hersbach et al 2015, Poli et al 2016, Laloyaux et al 2018). We decide to study different climatic processes independently even though they are coupled in reality. This leads to a substantial complexity reduction and is justified here as we seek an explanation for a pronounced and large-scale difference in the reanalyses. Changes in clouds and atmospheric water content might explain the spread even under identical aerosol forcings and they are evaluated in the next sections. We first disentangle the effect of clouds by investigating changes in cloud cover and clear-sky fluxes. In a second step, we assess atmospheric water content which can affect both the all-sky and clear-sky radiation. Total column ozone is found to be of limited relevance (see appendix F).
3.2. Trends in total cloud cover do not explain SSRD trend spread in ECMWF
Clouds can block incoming radiation very effectively and changes in the cloud cover could potentially explain the differences in the ECMWF centennial reanalyses. Some similarities between the TCW and SSRD trends exist in all reanalyses, even though the former are barely statistically significant (see figure 3). CERA20C features significant trends in SSRD in locations that do not feature trends in TCW, suggesting that clouds only contribute partly. In order for TCW trends to explain the differences between ERA20C/ERA20CM and CERA20C, they would have to be substantially different. However, trends in total cloud cover over Europe are remarkably similar in ERA20C and CERA20C during the dimming period (see figure 3 (e),(h). Both feature a region of increased cloud cover that stretches from the North of France and Benelux to Greece. In most places, however, the increase is not statistically significant. In the rest of the continent, non-significant and weak negative trends dominate. Also during the brightening decades, trends are generally weak and non-significant (see figure 3 (f),(i). Apart from a distinct reduction in ERA20C over the Mediterranean east of Corsica that is not paralleled in CERA20C and a similar feature off the Portuguese coast, no strong differences exist between ERA20C and CERA20C. As a consequence, the evolution of total cloud cover can not give rise to the fundamentally different signals in SSRD reported in section 3.1.
Figure 3. Total cloud cover climatology and trends in the ECMWF twentieth century reanalyses. Each reanalyses is displayed in a different row. The first column (a),(d),(g) shows the climatology defined as the 1979-2009 mean, the second (third) column shows trends from 1949 to 1979 (1979 to 2009). Trends are hatched if they are not statistically significant at the 95% level. Trends are given in percentage change per decade as compared to the climatology. Where applicable, trends are computed on the ensemble mean (ERA20CM, CERA20C).
Download figure:
Standard image High-resolution imageMoreover, zooming into two regions of disagreement reveals that the anticipated effects of cloud changes on surface radiation are opposite of the observed effects. For example, during the dimming period, ERA20C shows an increase in cloud cover in the Mediterranean south of Italy and along the northern coast of Libya (see figure 3 (e). At the same time, cloud cover dominantly decreases over the same region in CERA20C (figure 3 (f). More clouds lead to more scattering and absorption of shortwave radiation and consequently reduce SSRD at the surface. If changes in cloud cover were the driving factor, one would expect a SSRD reduction in ERA20C and a SSRD increase in CERA20C. However, this expectation does not match reality as CERA20C lacks such an increase (figure 1 (e) and the reduction in ERA20C is not weaker than in CERA20C (figure 1 (d),(e). The same argument can be put forward in the brightening period where ERA20C shows a relatively strong cloud cover decline in the eastern Mediterranean (figure 3 (i). Again, the expected stronger increase in SSRD in this region when compared to CERA20C is not found (figure 1 (k),(l).
As a consequence, changes in total cloud cover can not explain the differences in surface solar radiation because (a) ERA20C and CERA20C show qualitatively the same response in most locations and (b) where they deviate, the difference in the cloud trends does not match the difference in the SSRD trends. This result does not necessarily mean that clouds play no role at all. They could impact surface radiation in more subtle ways, for example, through changes in cloud height or cloud type that are not represented in TCC. Interestingly, ERA20C and CERA20C do not seem to feature any spurious long-term trends that could have arisen due to the documented wind speed trends (Wohland et al 2019). In particular, ERA20CM shows the largest areas of statistically significant trends over the brightening period (figure 3 (c), even though it is the only ECMWF 20th century reanalyses that is free of long-term wind trends.
3.3. Only CERA20C clear-sky fluxes reproduce dimming and brightening
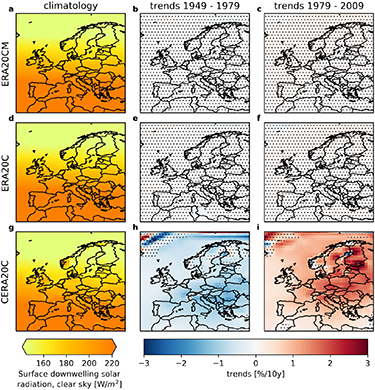
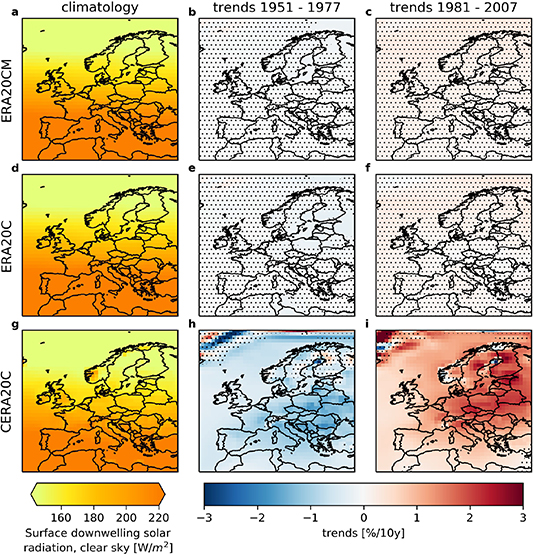
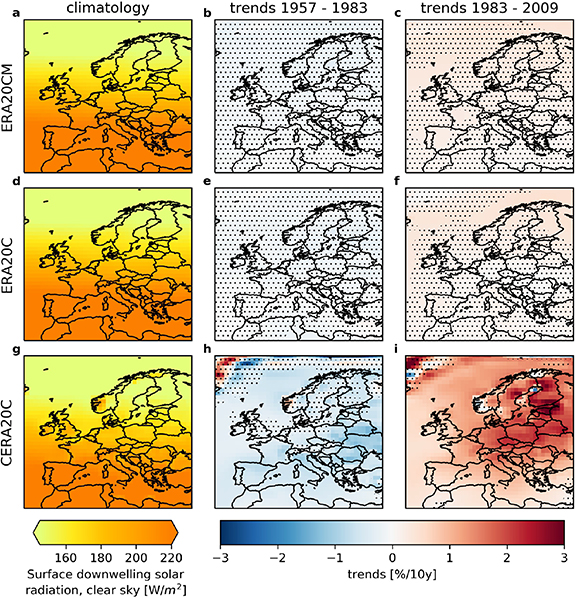
Clear-sky radiation is obtained by removing the effect of clouds and allows to focus on the impact of aerosols and water vapour. Interestingly, there is virtually no change in SSDRC in ERA20CM and ERA20C in both periods (see. Figure 4 (b),(c),(e),(f). The absence of relevant changes is robust as it persists under different definitions of the the dimming and brightening periods (cf figure A3, A4). This is in stark disagreement with expectations as time-varying aerosols ought to also impact the clear-sky fluxes. It could imply that constant aerosols were accidentally used. Unfortunately, AOD is not available to test this explanation. CERA20C features significant reductions in SSDRC in the dimming period and significant increases in the brightening period (figure 4 (h),(i), in line with expectations and the SSRD results (section 3.1). All reanalyses show very little spatial variability, suggesting that SSDRC is governed by continental-scale processes.
Figure 4. Surface solar downwelling radiation clear-sky (SSDRC) climatology and trends in the ECMWF twentieth century reanalyses. See caption of figure 3 for details.
Download figure:
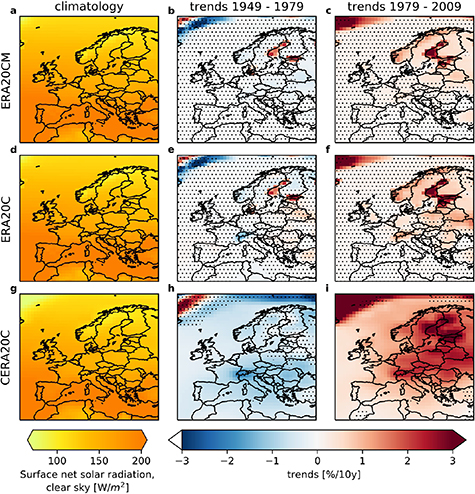
Standard image High-resolution imageCloser inspections reveals that ERA20CM and ERA20C both feature some significant signals in the net clear sky fluxes (see B5). They are, however, exclusively linked to changes of surface albedo and therefore vanish in the downward fluxes.
We conclude that differences in the clear-sky fluxes between the ECMWF 20th century reanalyses qualitatively explain the deviating representation of all-sky dimming and brightening. Recalling that all ECMWF products use the same time-varying CMIP5 aerosols, the clear-sky fluxes in ERA20C and ERA20CM seem to be insensitive to changes in the aerosol forcing.
3.3.1. Trends in total column water can not explain lacking clear-sky response of ERA20C/ERA20CM
While clouds can not have an impact on clear-sky radiation by definition, changes in atmospheric water content affect clear-sky and all-sky fluxes in the IFS model. The temporal evolution of total column water is similar in all ECMWF centennial reanalyses and consists of drying (1949–1979) and subsequent humidification (1979–2009) (see figure 5). Since less/more water molecules are available for scattering and reflection in a drying/humidifying atmosphere, these changes alone would cause an increase in surface radiation in the first period and a reduction in the second period, in disarray with the reported evolution of surface radiation. The drying signal is most significant in ERA20CM where it extends over almost the entire domain (figure 5 (b) and least significant in CERA20C (figure 5 (h). ERA20C lies in between the two extremes (see figure 5 (e). Humidification is more robust across the reanalyses. It is strongest in ERA20C (figure 5 (f) and of comparable magnitude in ERA20CM and CERA20C. Some difference exist as ERA20CM features slightly weaker albeit more significant trends than CERA20C (figure 5 (c),(i).
Figure 5. Total column water (TCW) climatology and trends in the ECMWF twentieth century reanalyses. See caption of figure 3 for details.
Download figure:
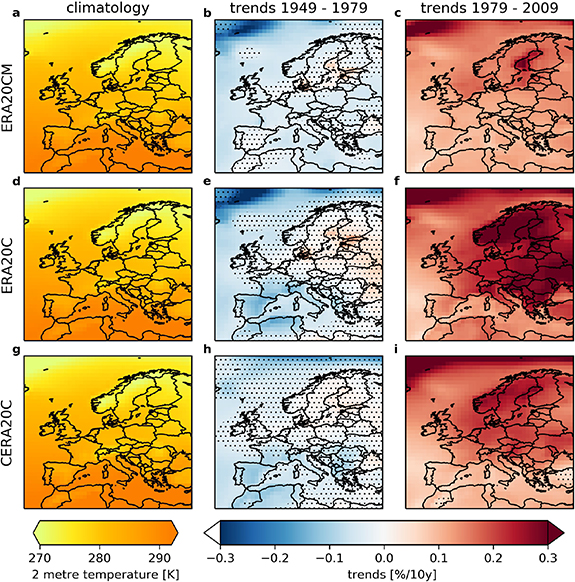
Standard image High-resolution imageThe higher agreement in 1979–2009 is likely connected to global warming as a warmer atmosphere can hold more moisture and more energy becomes available for phase transitions (e.g. Hegerl et al 2015). This connection is supported by the fact that ERA20C features the strongest warming signal over Europe and also shows the strongest humidification (see figures 5 & B6). Similarly, ERA20CM shows widespread cooling and pronounced drying during the dimming period, again supporting thermodynamical rather than dynamical changes. Such energy considerations are, however, complicated by the discontinous ocean heat content in CERA20C which features jumps at the initialization of each stream (Laloyaux et al 2018).
TCW trends can not explain the different continental-scale surface radiation trends in the ECWMF reanalyses. To illustrate this, we assume that TCW trends strongly impact surface radiation trends. It follows that
- any given reanalysis would feature similar all-sky and clear-sky trends because TCW affects both
- two different reanalyses showing similar TCW trends would also feature similar surface radiation trends.
We reported earlier that ERA20C and ERA20CM completely lack SSDRC trends (see figure 4 (b),(c),(e),(f), such that (a) does not hold. Moreover, the TCW trends in ERA20CM and CERA20C are comparable, but neither the SSRD nor the SSDRC trends have substantial similarities (see figures 1 j,l and 4 (c),(i) such that also (b) has to be rejected. It is thus justified to reject the assumption that TCW trends have a major impact on surface radiation trends here.
4. Discussion: Potential causes for the differences between ERA20CM, ERA20C and CERA20C
We showed that ERA20C and ERA20CM do not capture multi-decadal variability of surface solar radiation downward in clear-sky conditions at all. More precisely, neither the downward trend from 1949–1979 (dimming) nor the upward trends from 1979–2009 (brightening) are reproduced in these reanalyses. This shortcoming is surprising given that both were produced with identically prescribed time-varying aerosols. We would like to put forward three different explanations and discuss them successively. Please note that they are not mutually exclusive such that a combination of multiple factors may lead to the reported differences.
4.1. Improvement of the IFS model
As far as SSRD is concerned, there seems to be a sequential improvement with the production date. The oldest ECMWF centennial dataset ERA20CM does not capture SSRD multidecadal variability at all, the next generation ERA20C does a slightly better job, the newest product CERA20C agrees reasonably well with observations and satellite-era reanalyses. One can therefore hyphothesize that model improvements have allowed to capture the underlying processes better.
While this interpretation sounds intuitively plausible, it is likely wrong. According to the IFS documentation, there has only been a single major change to the model between the versions used for ERA20CM and CERA20C (table 2.1 in ECMWF 2016). This change aims to 'mitigate coastal temperature errors' and has no effect on large-scale radiation quantities (Hogan and Bozzo 2015). The dataset providers themselves are not aware of model changes that could explain the radiation differences (Hogan, personal communication).
Another hint that the model version may not be relevant is shown in figure 1 a. ERAI captures brightening which implies that even old versions of the IFS model can grasp dimming/brightening. ERAI uses IFS Cy31r2, the grandfather of Cy38r1 which was used for ERA20CM/ERA20C. It is unclear, however, whether the old model features brightening as a consequence of its internal dynamics or due to the assimilation of a greater set of observations, including radiance and refraction measurements (Dee et al 2011). It is thus possible that ERAI captures brightening because of the assimilated observations and despite model shortcomings. This interpretation is supported by the fact that ERAI uses prescribed climatological aerosols distributions rather than evolving ones (Fujiwara et al 2017).
4.2. Ocean coupling
Decadal to multidecadal ocean variability can give rise to longer-term variability in the atmosphere (Farneti 2017, Keenlyside et al 2015) and climate models have been shown to generate multi-year trends in surface radiation locally without external forcing (Folini et al 2017). Alterations in SST affect heat and moisture fluxes and thus modify atmospheric water content and clouds. As CERA20C is a coupled ocean-atmosphere reanalysis while ERA20C and ERA20CM lack an ocean model, it is theoretically possible that the coupling enables CERA20C to capture dimming and brightening. The mechanistic process through which this might occur, however, is far from clear as SSTs are very similar in all ECMWF centennial reanalyses. This is because the CERA20C ocean is not free but the SSTs are relaxed towards HadISST2 (Laloyaux et al 2018), thereby effectively reducing the difference between CERA20C and ERA20C/ERA20CM which use HadISST2 directly.
As a consequence of using the same SST dataset, multi-decadal ocean surface variability, such as the Atlantic Multidecadal Variability (AMV), is synchronized in the ECMWF centennial reanalyses. It is therefore expected that multi-decadal atmosphere variability stemming from the ocean is similar across ECMWF centennial reanalyses and can only explain features in figures 3-5 that are shared by all reanalyses. Most importantly, the differences seen in the clear-sky fluxes (figure 4) can thus not be explained by long-term surface ocean variability.
Moreover, the CERA20C ocean heat content drifts during each stream providing an exceptionally strong energy sink which might well deteriorate the results rather than improve them.
4.3. Ensemble size
A consensus on desirable ensemble sizes is still elusive and current 20th century reanalyses range from single member to 80 members (see table 1). This wide range complicates comparability because ensemble robustness can not be assessed in the same way. When seeking to disentangle forced signals from climate variability, ensemble averaging generally reduces noise, yielding stronger and more significant signals relative to the background climate variability in an ensemble mean. However, there is an important exception to this rule. If the ensemble is strongly constrained (i.e. if the noise itself is highly correlated), ensemble averaging has almost no effect.
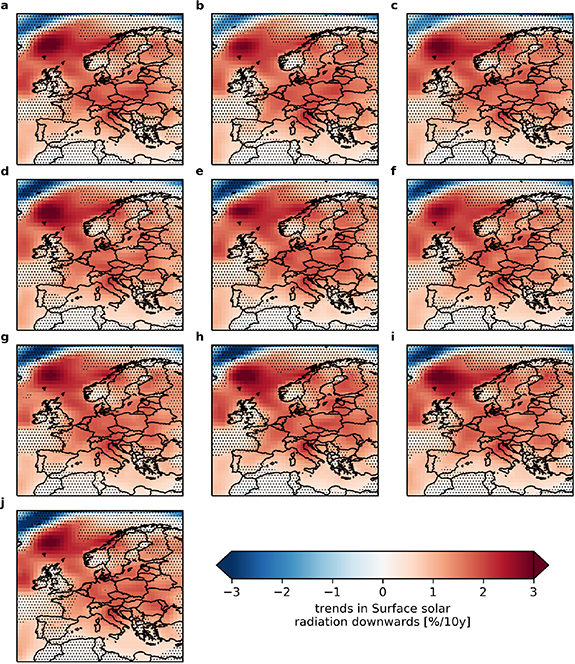
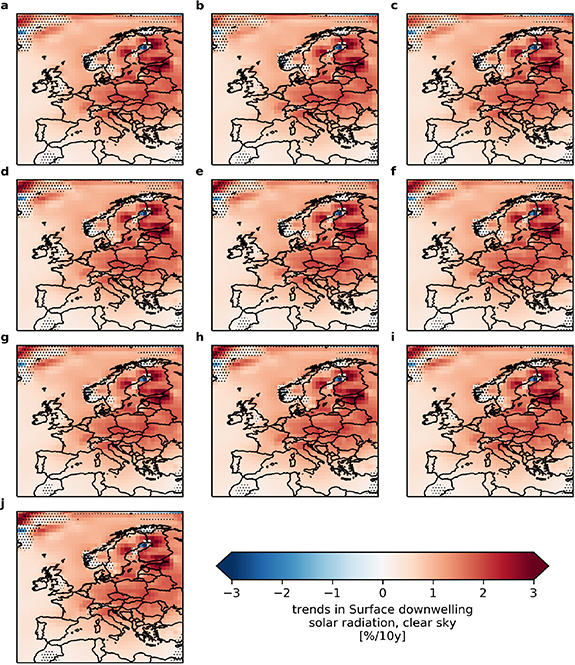
In this study, we decided to use the ensemble means, which could have introduced a bias when comparing ensemble (e.g, CERA20C) and deterministic reanalyses (ERA20C). The differences shown in figures 4 and 1 could be due to noise reduction in the ensemble mean. Closer inspection reveals, however, that the trends in SSDRC and SSRD are identical in all CERA20C ensemble members (see supplementary figures D10 and D8), suggesting that the CERA20C ensemble is well constrained with respect to trends in annual mean SSRD and SSDRC.
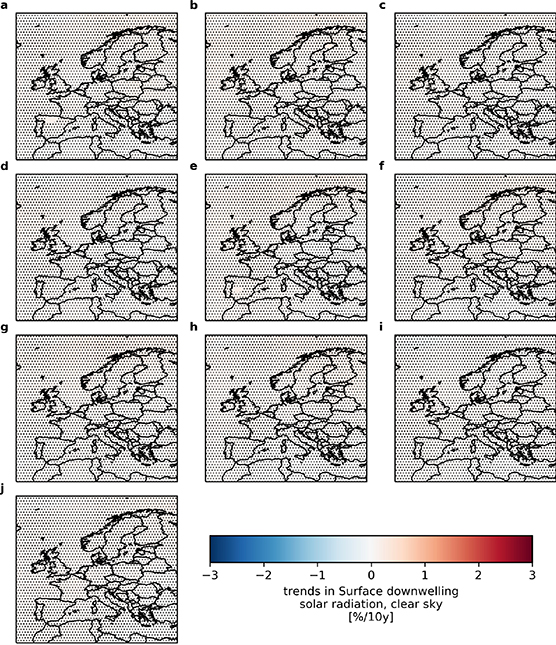
The free-model run ERA20CM is different. Due to the absence of data assimilation, the ensemble is loosely constrained when it comes to SSRD (see figure D9). Different ensemble members show patches of upward and downward trends in different locations. It is important to note that none of the ensemble members shows statistically significant trends over larger domains. Moreover, the trends are substantially smaller in magnitude when compared to CERA20C. Had we picked one ensemble member rather than used the ensemble mean, the interpretation in section 3.1 would not have changed. Regarding the clear-sky fluxes, all ensemble members unanimously report no changes in SSDRC (see figure D11). This provides further evidence that the non-existence of trends in SSDRC is a fundamental property of the ERA20C/ERA20CM reanalyses.
5. Conclusions
We systematically investigated multi-decadal variability in surface solar radiation in current 20th century reanalyses. Our main result is that CERA20C is the only reanalysis that captures dimming (1949–1979) and brightening (1979–2009) in all-sky and clear-sky surface radiation over Europe. All other 20th century reanalyses fail to capture this well-established pattern and should consequently not be used in long-term surface radiation assessments. 20CRv2c and 20CRv3 are run with constant aerosols and are thus not expected to show dimming/brightening. In contrast, all ECMWF 20th century reanalyses use time-varying CMIP5 aerosols. Despite that, ERA20C and ERA20CM show no response in surface clear-sky fluxes. We discussed a number of potential explanations (IFS model updates, ocean coupling and ensemble) and conclude that none of them provides a convincing explanation, potentially pointing to issues in the dataset production. While this study focuses on Europe, the pronounced differences are likely to manifest in other parts of the world as well and should be studied in future work.
Our results have direct implications for different fields of research. We suggest that 20CRv2c, 20CRv3, ERA20CM and ERA20C should not be used in long-term solar radiation assessments. This particularly includes the validation of climate models and impact studies, for example, regarding the hydrological cycle or solar power.
Providing reliable, gridded and uninterrupted climate information of the last century remains an unsolved challenge. There are numerous reasons to tackle this challenge as society greatly benefits from long-term and easy-to-use climate data archives. While an increasing number of weaknesses of current twentieth century reanalyses are reported, the number of useful applications also increases. Heavily borrowing from Box (1976), we conclude: Since all reanalyses 'are wrong the scientist must be alert to what is importantly wrong'.
6. Code and data availability
Reanalyses data is publicly available from the ECMWF and NOAA. The GEBA archive can be assessed after registration at https://geba.ethz.ch/. The code is written in Python and can be requested from the authors.
Acknowledgment
This study benefited substantially from many interesting conversations. JW wants to thank Patrick Laloyaux, Gil Compo, Robin Hogan, Nicolas Bellouin, Claire Ryder and Laura Wilcox for interesting exchange. JW is funded through an ETH Postdoctoral Fellowship and acknowledges support from the ETH foundation and the Uniscientia foundation. The authors want to thank ECMWF and NOAA for making ERAI, ERA5, ERA20CM, ERA20C, CERA20C, 20CRv2c and 20CRv3 publicly available. Support for the Twentieth Century Reanalysis Project dataset is provided by the U.S. Department of Energy, Office of Science Biological and Environmental Research (BER) program, by the National Oceanic and Atmospheric Administration Climate Program Office, and by the NOAA Physical Sciences Laboratory. The Global Energy Balance Archive (GEBA) is co-funded by the Federal Office of Meteorology and Climatology MeteoSwiss within the framework of GCOS Switzerland.
Author contributions
JW designed the investigation, analyzed the data, produced all figures and wrote the first draft of the manuscript. All authors contributed ideas and repeatedly gave feedback on the analysis and the intepretation of the results. All authors helped to improve the manuscript.
Competing interests
The authors declare that no competing interests exist.
Appendix A.: Sensitivity to different definitions of the dimming and brightening periods
Figure A1. Trends in surface solar radiation downwards (SSRD). Same as 1 but for a different choice of the dimming (1951–1977) and brightening (1981–2007) periods.
Download figure:
Standard image High-resolution imageFigure A2. Trends in surface solar radiation downwards (SSRD). Same as 1 but for a different choice of the dimming (1957–1983) and brightening (1983–2009) periods.
Download figure:
Standard image High-resolution imageFigure A3. Surface solar downwelling radiation clear-sky (SSDRC) climatology and trends in the ECMWF twentieth century reanalyses. Same as figure 4 but for a different choice of the dimming (1951–1977) and brightening (1981–2007) periods.
Download figure:
Standard image High-resolution imageFigure A4. Surface solar downwelling radiation clear-sky (SSDRC) climatology and trends in the ECMWF twentieth century reanalyses. Same as figure 4 but for a different choice of the dimming (1957–1983) and brightening (1983–2009) periods.
Download figure:
Standard image High-resolution imageAppendix B.: Additional variables ECMWF reanalyses
Figure B5. Surface solar net radiation clear-sky (SSRC) climatology and trends in the ECMWF twentieth century reanalyses. See caption of figure 3 for details.
Download figure:
Standard image High-resolution imageFigure B6. Two meter temperature (T2m) climatology and trends in the ECMWF twentieth century reanalyses. See caption of figure 3 for details.
Download figure:
Standard image High-resolution imageAppendix C.: Brightening in MERRA2
Figure C7. Surface solar radiation downwards (SSRD) in MERRA2. The left subplots presents the climatology and the right hand side the trends, both calculated over the period from 1980 to 2009. Hatching denote trends that are not statistically significant at a 95% confidence level.
Download figure:
Standard image High-resolution imageAppendix D.: Ensemble spread
Figure D8. Surface solar radiation downwards (SSRD) trends for the period 1979–2009 in CERA20 computed for the individual ensemble members. Each subplot (a-j) denotes one member of the 10 member ensemble. Trends are displayed relative to the climatology. Hatching indicates that trends are not statistically significant at the 95% level.
Download figure:
Standard image High-resolution imageFigure D9. Surface solar radiation downwards (SSRD) trends for the period 1979–2009 in ERA20CM computed for the individual ensemble members. For details, see figure D8.
Download figure:
Standard image High-resolution imageFigure D10. Surface solar radiation clear-sky (SSDRC) trends for the period 1979–2009 in CERA20 computed for the individual ensemble members. For details, see figure D8.
Download figure:
Standard image High-resolution imageFigure D11. Surface solar radiation clear-sky (SSDRC) for the period 1979–2009 in ERA20CM computed for the individual ensemble members. For details, see figure D8.
Download figure:
Standard image High-resolution imageAppendix E.: Focus area timeseries of SSRD
Figure E12. Temporal evolution of annual SSRD averaged over a box (10–30°E, 40–50°N).
Download figure:
Standard image High-resolution imageAppendix F.: Total column ozone (TCO3)
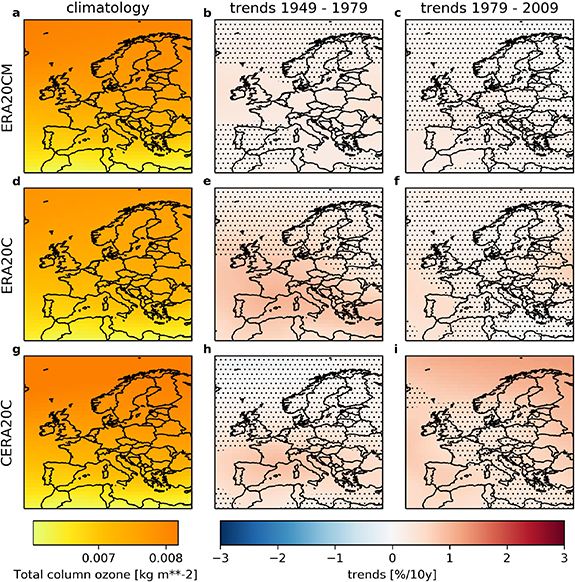
Ozone affects both clear-sky and all-sky radiation through absorption and scattering of incoming solar radiation. The general comments made in section 3.3.1 about TCW therefore also apply to TCO3.
Ozone trends are positive in all reanalyses and during the dimming and brightening periods (see figure F13). Trends are of different different statistical significance. ERA20C (dimming) and CERA20C (brightening) stand out as featuring significant trends over large areas. ERA20CM generally has non-significant and weak positive trends.
We conclude that ozone can not give rise to dimming and brightening in the ECMWF centennial reanalyses because its evolution during the two phases has the same sign. It can also not explain the qualitative difference in the clear-sky surface radiation trends because there are no distinct differences between CERA20C and ERA20C/ERA20CM.
Moreover, the strongest and most significant positive ozone trends occur during the brightening phase in CERA20C. From ozone alone, one would thus expect a reduction in surface radiation which is opposite of the observed effect. Similarly, ozone increases significantly in the southern half of the continent in ERA20C during the dimming phase which in isolation would lead to dimming over this area. However, dimming is less pronounced in ERA20C as in CERA20C despite the latter having a weaker ozone signal in this period. Overall, we conclude that ozone - while being part of the complex processes at work - is not a determining factor of dimming and brightening in these reanalyses.
Figure F13. Total column ozone (TCO3) climatology and trends in the ECMWF twentieth century reanalyses. See caption of figure 3 for details.
Download figure:
Standard image High-resolution image

