What We Do in the Shallows: Natural and Anthropogenic Seafloor Geomorphologies in a Drowned River Valley, New Zealand
 Sally J. Watson1*
  Helen Neil1
  Marta Ribó2
  Geoffroy Lamarche1,2,3 Lorna J. Strachan2 Kevin MacKay1 Steve Wilcox1 Tim Kane1 Alan Orpin1
  Scott Nodder1 Arne Pallentin1 Tilmann Steinmetz1
- 1National Institute of Water and Atmospheric Research (NIWA), Wellington, New Zealand
- 2School of Environment, University of Auckland, Auckland, New Zealand
- 3Office of the Parliamentary Commissioner for the Environment, Wellington, New Zealand
The shallow marine environment represents a region of high biological productivity, ecological diversity, and complex oceanographic conditions, and often supports various human activities and industries. Mapping of the seafloor in shallow marine environments reveals seafloor features in detail, shedding light on a range of natural and anthropogenic processes. We present a high-resolution (2-m) multibeam dataset, combined with geologic samples that reveals a complete map of the seafloor from the land-water interface to ∼350 m water depth within Queen Charlotte Sound/Tōtaranui (QCS) and Tory Channel/Kura Te Au (TC), Marlborough Sounds, New Zealand. These data reveal that the seafloor geomorphology and distribution of natural and anthropogenic features varies spatially from the inner QCS to the Cook Strait. Tidal currents play a large role in the erosion, transport, and deposition of sediments in QCS and TC. The distribution and depth of seafloor scouring suggests that tidal flow is locally intensified by coastal geometry and bathymetric barriers, resulting in concentrated scouring where tidal flow is restricted or redirected. In addition, superimposed bedforms reflect localized variations in flow direction that have likely developed across a range of spatial and temporal scales. Evidence for extensive seafloor fluid expulsion is preserved in > 8500 pockmarks mainly located within the inner and central QCS. The size and spatial distribution of pockmarks suggest multiple fluid sources in the region. The cumulative anthropogenic footprint on the seafloor within QCS represents 6.4 km2 (∼1.5%) of the total seafloor area and is predominantly related to maritime activities including anchor dragging (47.5%) and mooring blocks (24%). This study provides a unique example of the information that can be revealed by a comprehensive survey programme that mapped from the land-water interface to the subtidal zone. Results presented in this study form a robust basis upon which to develop improved hydrodynamic models and benthic habitat maps and to assess the full extent of anthropogenic activities in the shallow marine realm.
Introduction
The shallow marine zone from 0 to 200 m water depth makes up a small proportion of the global ocean (∼7.3%; Mayer et al., 2018) but represents a dynamic region, characterized by high biological productivity (Gray, 1997) and complex hydrodynamic processes (Stride, 1982; Simpson and Sharples, 2012). It is also an area of intense human interaction, proximal to population centers, and increasingly supports a range of activities and industries (e.g., Anthony et al., 2014; Fogarin et al., 2019). Complete and high-resolution multibeam bathymetric mapping of the shallow marine realm is critical to inform our understanding of natural and anthropogenic processes, and thus our ability to effectively conserve these valuable marine areas (Wölfl et al., 2019).
This study presents a 2 m (grid) resolution multibeam bathymetric dataset, combined with geological seafloor sediment samples, which collectively reveal for the first time the complexity and variability of the seafloor within the Queen Charlotte Sound/Tōtaranui and Tory Channel/Kura te Au (referred to hereafter as QCS and TC, respectively). These data provide a complete and detailed picture of the seafloor from the land-water interface to ∼350 m water depth, at a spatial resolution that offers insights into natural and anthropogenically driven shallow marine processes. Using these data we are able to: (1) comprehensively describe the seafloor morphology of the QCS and TC; (2) quantify and compare the spatial distribution of natural and anthropogenic seafloor geomorphologies; (3) document the influence of modern oceanographic processes and complex coastal geometry on seafloor structure, sediment distribution and bedform morphology; and, (4) determine the extent and intensity of the anthropogenic footprint on the seafloor within the QCS and TC.
Benefits and Challenges Associated With Mapping the Shallow Marine Realm
The health of the coastal and shallow marine zone has been identified as a key research priority in New Zealand, due to its cultural, social, ecological, and economic importance (Jarvis and Young, 2019). However, gaps in bathymetric data coverage in the shallow marine realm can hinder sustainable management. The benefits of mapping of the shallow marine zone have been demonstrated to produce accurate and detailed sediment and benthic habitat maps (e.g., Micallef et al., 2012; Ierodiaconou et al., 2018), identify and characterize offshore geological hazards such as volcanism (e.g., Bosman et al., 2015) and submarine dune migration (e.g., Ernstsen et al., 2005), and for management of offshore resources (both living and non-living e.g., fisheries, groundwater; Pickrill and Todd, 2003).
Although the quantification of human activities being exerted on the shallow marine realm globally are not fully realized, the most pronounced anthropogenic impacts are occurring in coastal and shelf environment, where the close proximity of coastal populations, infrastructure and marine resources coalesce (Harris, 2020). Increasingly, studies show that population growth and anthropogenic activities near the coast are resulting in major changes to the seafloor geomorphology and patterns of sedimentation (Paradis et al., 2017, 2018; Madricardo et al., 2019), destruction of shallow marine habitats (Courrat et al., 2009; Lastras et al., 2016; Carminatto et al., 2020) and introduction of foreign materials into the shallow marine environment, including pollution, sediments and excess nutrients (Yasuhara and Yamazaki, 2005; Milliman and Farnsworth, 2013; Alomar et al., 2016; Buhl-Mortensen and Buhl-Mortensen, 2017).
Accurate, high-resolution and complete seafloor mapping within shallow marine environments is a critical first step toward characterizing the seascape and has significant uses by revealing a range of seafloor features in detail. However, the nature of ship-based acoustic mapping techniques means that surveying the shallow marine zone can be more hazardous and inefficient due to the reduced footprint of the acoustic beam in shallow water compared to deeper water (Lurton, 2002; Mayer et al., 2018; Wölfl et al., 2019). The estimated time it would take to comprehensively survey the shallow marine zone (from 0 – 200 m) using ship-based acoustic methods is between three to eight times longer than it would take to map the deep ocean, even though it represents a much smaller surface area (Mayer et al., 2018). As a result of this high resourcing demand, there is a global paucity of complete high-resolution bathymetric maps in the highly productive, dynamic and impacted shallow-water environment.
Hydrographic Survey 51
In 2016, the National Institute of Water and Atmospheric Research (NIWA) was contracted by Land Information New Zealand (LINZ) to undertake hydrographic surveying services for the QCS and TC (herein referred to as the HS51 project). This work was commissioned by a partnership between LINZ and the Marlborough District Council (MDC) and included the comprehensive collection of multibeam bathymetry, backscatter and ground-truth data (including seafloor grab and camera samples) in the shallow marine QCS and TC from the land-water interface to ∼350 m water depth. The survey comprised both hydrographic and habitat mapping requirements that were met by a NIWA-led partnership with Discovery Marine Limited (DML) under LINZ project HYD-2016/17-01 (HS51; Contract No. 20058). For a full survey report including acoustic and sampling methodologies, and field interpretations, refer to Neil et al. (2018). The present study is based extensively on the baseline information provided by the HS51 project and provides an example of the down-stream scientific benefits afforded from the collection of comprehensive high-resolution data complete from the land-water interface to the subtidal zone.
Queen Charlotte Sound and Tory Channel: Regional Context
The QCS and TC (Figure 1a) lie in the eastern Marlborough Sounds/Te Tau Ihu o te Waka a Māui, north-eastern South Island/Te Waipounamu of New Zealand/Aotearoa and have been shaped by a range of geologic, oceanographic, and anthropogenic processes. Since the last-glacial maximum (∼18 ka), the QCS and TC region has been subject to tectonic subsidence (Nicol, 2011), sea level fluctuations (Lauder, 1970, 1987; Cotton and Collins, 1974; Proctor and Carter, 1989; Singh, 2001), and dynamic tidal currents (Walters et al., 2010; Heath, 1974; Hadfield et al., 2014), and has come under increasing pressure from anthropogenic activities including coastal settlement, recreational and industrial maritime operations, and marine farming (e.g., Fahey and Coker, 1992; Coker et al., 1993; Parnell et al., 2007).
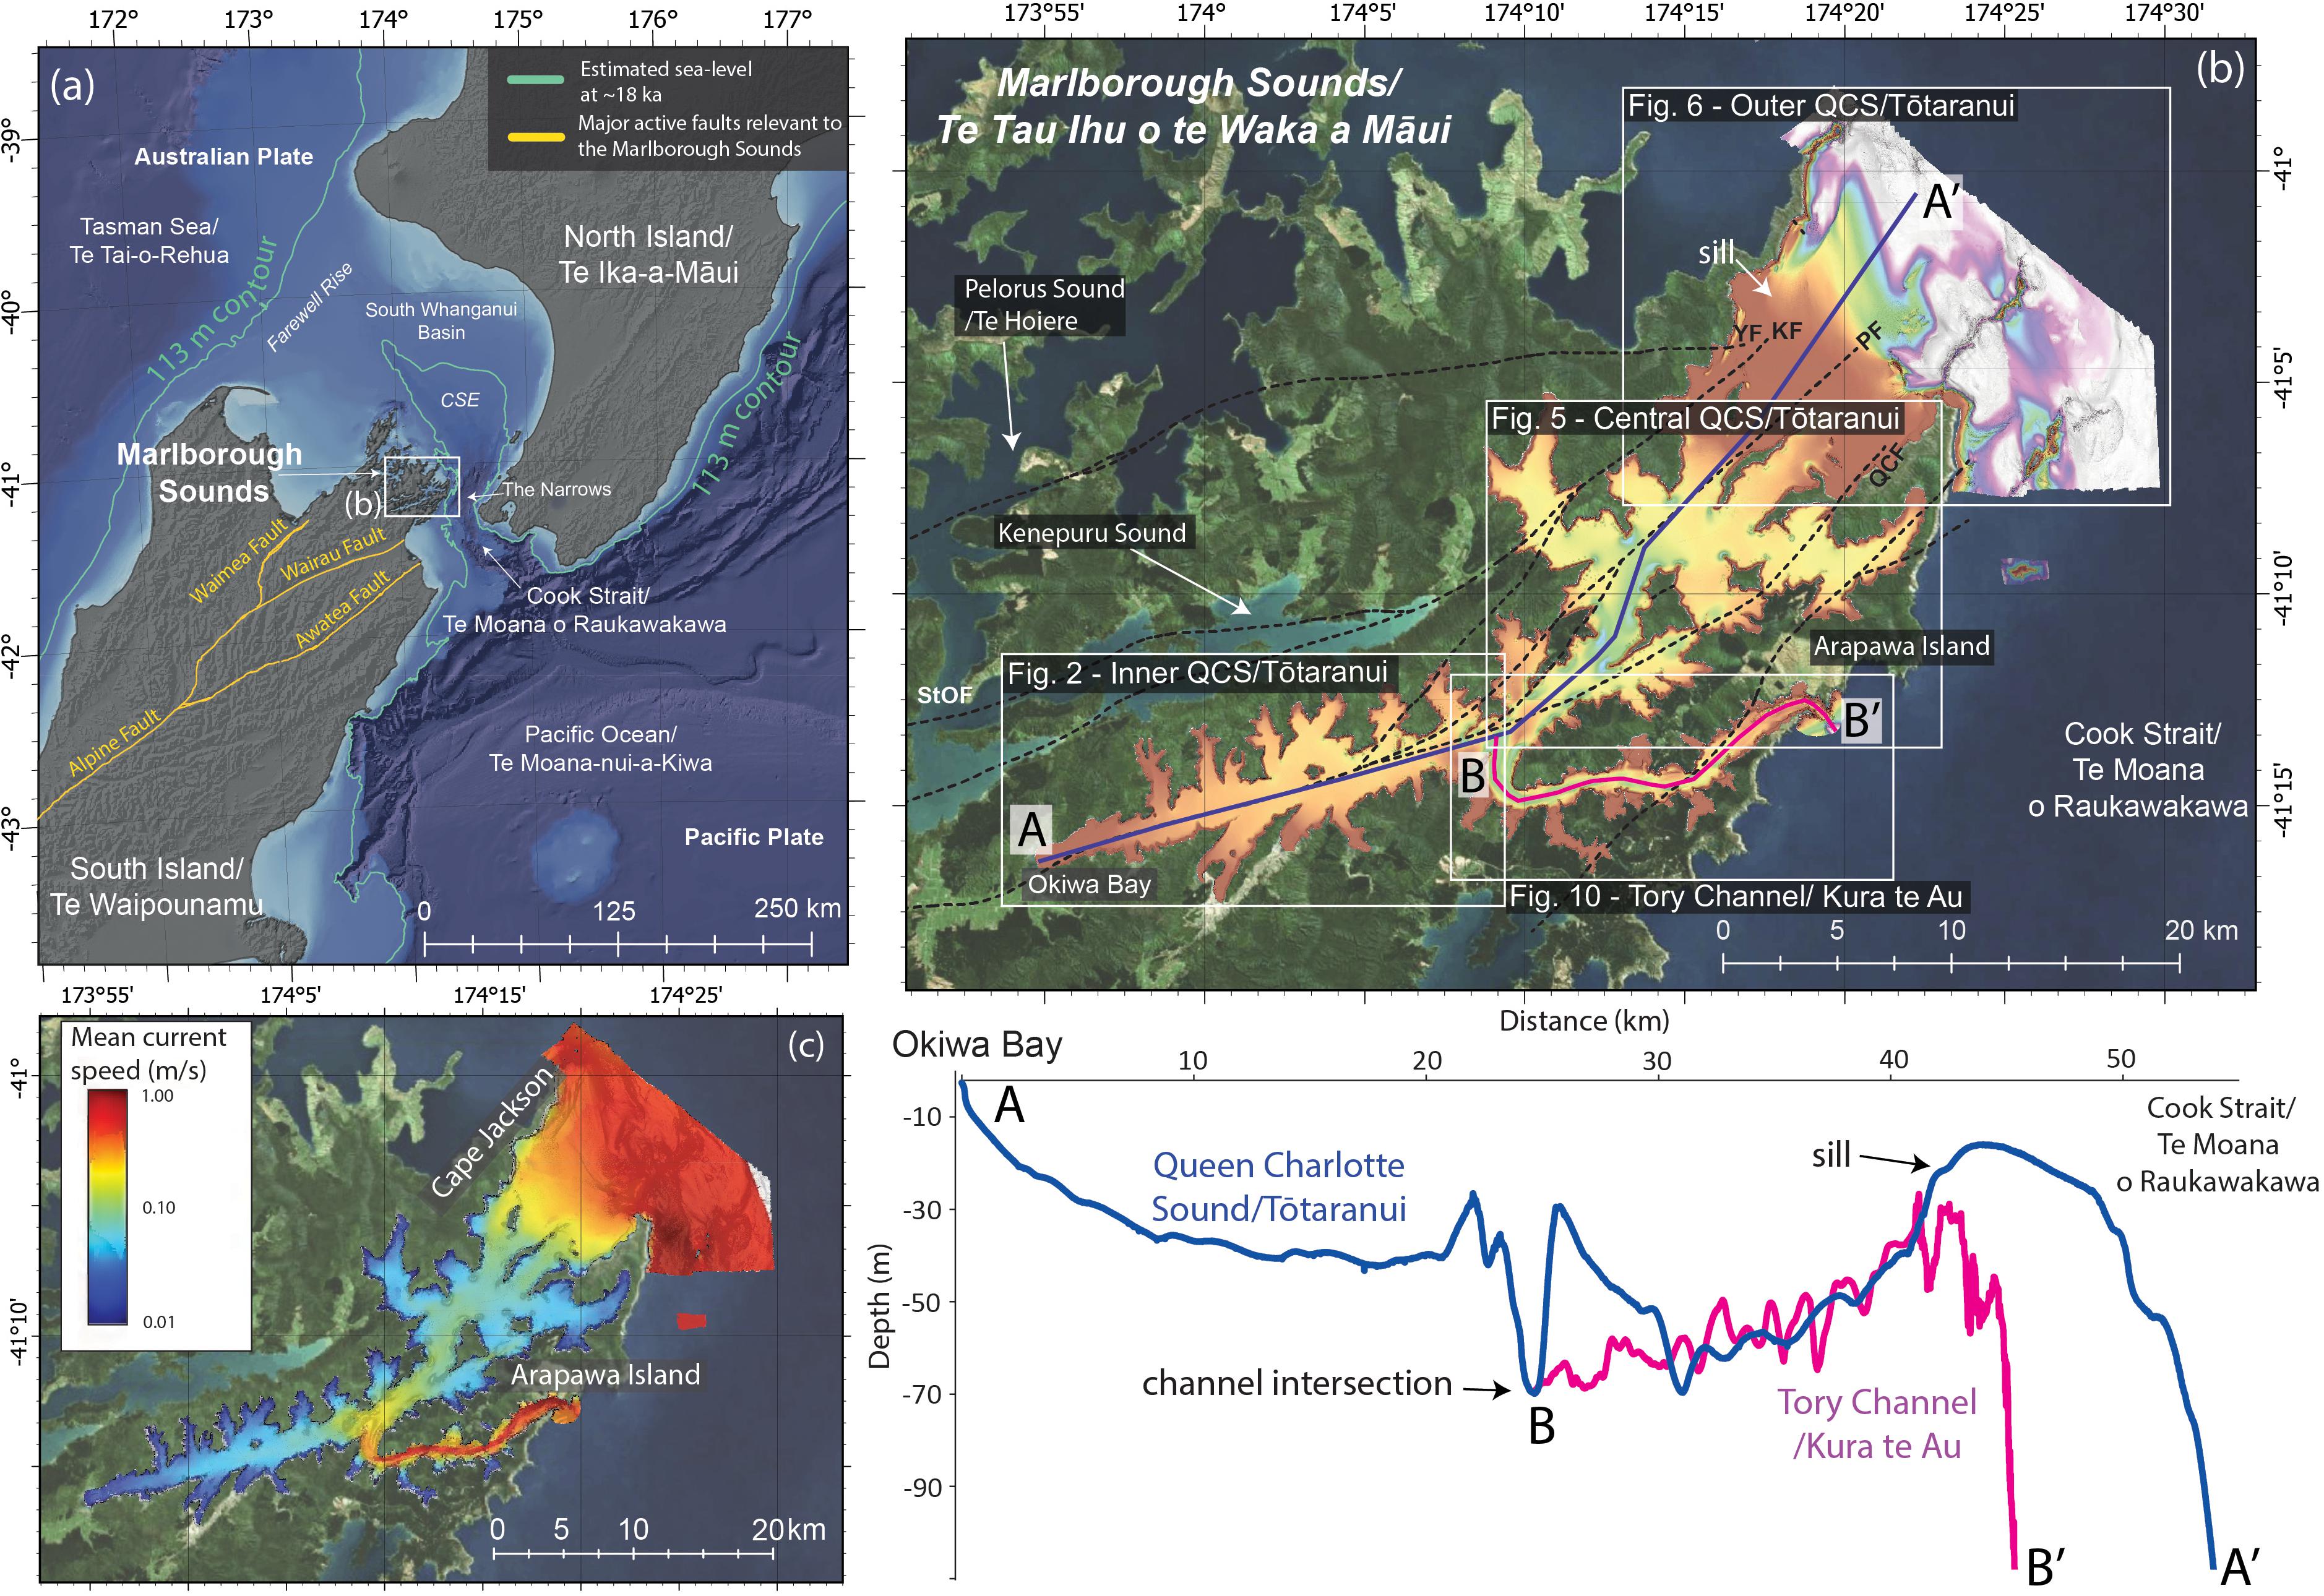
Figure 1. (a) Location map of the Marlborough Sounds/Te Tau Ihu o te Waka a Māui region with labeled features described in the text. Green line represents the 113 m bathymetric contour which, depicts the estimated last glacial sea-level drop at ∼18 ka (Te Punga, 1953; Stevens, 1974; Proctor and Carter, 1989). CSE = Cook Strait Embayment. Yellow lines are the major active faults relevant to Marlborough Sounds (Langridge et al., 2016). White rectangle shows the location of the study area and inset (b). (b) Regional view of QCS and TC with satellite imagery overlain by the area mapped by multibeam echosounders (HS51 data). White rectangles show locations of Figures 2, 5, 6, 10 and the division of the QCS and TC into 4 distinct geomorphological domains. Navy blue line represents the location of Profile A-A’ from Okiwa Bay in the inner QCS to the Cook Strait/Te Moana o Raukawakawa in the outer QCS. Pink line shows the location of Profile B-B’ from the channel intersection between QCS and TC and Cook Strait. Dashed black lines are inferred concealed faults from Begg and Johnston (2000), including Picton Fault (PF), Queen Charlotte Fault (QCF), Kenepuru Fault (KF), St Omer Fault (StOF), Yncyca Fault (YA) and several unnamed faults. Contextual information and features described in the main text are labeled. (c) Modeled mean current speeds (ms–1) in the QCS and TC at 5 m water depth, based on one year’s hourly data from the 200 m resolution model of Hadfield et al. (2014). Note: color scale is logarithmic.
The Marlborough Sounds/Te Tau Ihu o te Waka a Māui (Figure 1a) is a large network of northeast-trending, narrow, sea-drowned valleys, embayments and islands covering ∼4000 km2. The Marlborough Sounds are characterized by a complex coastal geometry, and with a coastline length of ∼1400 km, it represents ∼10% of New Zealand’s total coastline (Figure 1b; Singh, 2001; Nicol, 2011). Arapawa Island separates the eastern Marlborough Sounds into two distinctive arms, QCS and TC, that open at the seaward end into Cook Strait/Te Moana o Raukawakawa (Figure 1b). The Cook Strait is the narrow (20 - 60 km wide) oceanic passage between the North and South islands (Te Ika a Māui and Te Waipounamu) of New Zealand/Aotearoa, connecting the Tasman Sea/Te Tai o Rehua on the west to the Pacific Ocean/Te Moana nui a Kiwa on the east. The Cook Strait has been shaped by a complex combination of tectonic, climatic and oceanographic processes (Harris, 1990; Lewis et al., 1994).
Tectonics and Marine Transgression: The Drowning of a River Valley
The Marlborough Sounds region is bounded to the southeast by the active Wairau Fault and to the northwest by the Waimea-Flaxmore Fault (Langridge et al., 2016; Figure 1a). In the QCS and TC, the distribution of active faults and the continuation of known structural faults offshore is not well constrained, although it is inferred that each of the main sounds have developed along predominantly ENE-striking faults of the Queen Charlotte Fault System (Begg and Johnston, 2000). The alignment of the TC does not appear to be directly fault-related with N-ENE faults cross-cutting obliquely across the main W-E-aligned geomorphological axis of the inner and middle channel, although the orientation of the outer channel could be affected by a ENE-striking structural fault (Figure 1b; Begg and Johnston, 2000). The main basement rock units within the Marlborough Sounds include the Pelorus Group – Mesozoic greywacke and argillite and the Marlborough Schist (Beck, 1964; Brown and LJ, 1981; Lauder, 1987). Geologically, the QCS and TC is defined by the presence of an important basement rock boundary, with metamorphic terranes brought into juxtaposition within a structurally complex fault zone (Arapawa lithologic association) (Begg and Johnston, 2000). The hills on the northern side of the QCS comprise predominantly Permian-early Triassic Caples Group rocks, with middle-late Triassic Arapawa lithologic association sandstones and siltstones fringing the sound on promontories along the northern and southern shores, including Arapawa Island. The contact between these basement rock terranes is marked by the Picton Fault, which has an inferred Miocene age for thrusting along this fault (Nicol and Campbell, 1990), leading to the presence of very localized outcrops of Oligocene rocks in the inner part of QCS near Picton Harbour (Begg and Johnston, 2000). The Marlborough Sounds formed by river incision of the land, followed by tectonic subsidence and marine transgression (Lauder, 1970, 1987; Cotton and Collins, 1974; Singh, 2001). The primary river valleys date as far back as, and possibly predate, 5 Ma (end of the Miocene Epoch; Nicol, 2011). The subsequent drowning of the river valleys is related to tectonic subsidence in the South Whanganui Basin since 1.5 Ma, which resulted in the north-eastwards tilting of the Sounds between 20 and 6 ka and eustatic sea level rise (Figure 1a; Singh, 2001; Nicol, 2011). During the last-glacial maximum, ∼18 ka, sea level was ∼113 m below present-day (Figure 1a), forming a land bridge called the Farewell Rise, connecting the North and South islands (Figure 1a; Te Punga, 1953; Stevens, 1974; Nodder, 1995; Proctor and Carter, 1989). At this time, the Marlborough Sounds was above sea level and the region to the northeast of Marlborough Sounds was occupied by a narrow enclosed bay known as the Cook Strait Embayment, characterized by extreme tidal ranges as the resonance frequency in the bay was close to the oceanic tidal frequency (Proctor and Carter, 1989). By 11 ka, rising sea level resulted in the flooding of Cook Strait Embayment and Farewell Rise and the formation of the Cook Strait passage (Proctor and Carter, 1989; Nodder, 1995; Gillespie et al., 1998). Subsidence and sea level rise resulted in post-glacial sediment deposition within the QCS and TC paleo-river valleys, with estimated sediment thicknesses of up to 400 m in the inner QCS (Lauder, 1987; Singh, 2001; Nicol, 2011). Late Quaternary-Holocene deposits are relatively rare along the length of the QCS-TS, occurring sporadically in the head of only some embayments and inlets (e.g., Waikawa Bay, Picton Harbour, Lochmara Bay, Bay of Many Coves), mainly comprising landslide, alluvial fan and colluvium deposits (Begg and Johnston, 2000).
Modern Oceanographic Conditions
Modern oceanographic conditions within the Cook Strait are related to the interaction between tidal and wind forcing and regional ocean currents (Bowman et al., 1980; Harris, 1990; Walters et al., 2010). Numerical modeling of paleo-tidal conditions shows that tidal stress has reduced since the flooding of Cook Strait through the early Holocene, due to the near resonance frequency of the Cook Strait Embayment (Proctor and Carter, 1989). Today, the lunar semi-diurnal tides (M2) are out of phase on either side of Cook Strait, resulting in some of the strongest tidal currents in the world (Bowman et al., 1980; Walters et al., 2010; Stevens, 2014). Modeled hydrodynamics in QCS and TC suggest that flows in the region are variable throughout the system, with the highest current velocities in the outermost QCS, seaward of Cape Jackson and Arapawa Island, and in the TC (Hadfield et al., 2014; Figure 1c). The QCS displays seasonal stratification of the water column, whereas the TC remains well-mixed year-round (Hadfield et al., 2014). Pronounced tidal flows, which can reach velocities of over 2 ms–1 (i.e., spring tide; Plew and Stevens, 2013) and tidal volume fluxes are between 20–30 km3/s, resulting in the TC acting as a regionally significant conduit for water motions into and out of the central QCS (Hadfield et al., 2014). Tidal current eddies downstream from promontories or bathymetric barriers have been shown to further accelerate the tidal flow in other parts of Marlborough Sounds (Walters et al., 2010) leading to substantial erosion and the formation of the large seafloor depressions off many of the promontories in the outer Marlborough Sounds that extend into the greater Cook Strait (Proctor and Carter, 1989; Mitchell, 1996). No large rivers flow into QCS, such that the hydrography of this system is not significantly affected by freshwater inputs (Heath, 1974).
Human-Induced Change in the Marlborough Sounds
Changes to the seabed related to anthropogenic activities have been previously documented in the QCS and include accelerated sediment and nutrient discharge related to deforestation and land-use changes, and seafloor disturbance related to maritime activities and coastal development (Handley, 2016). Indigenous Māori settlement in the Marlborough Sounds since ca. 1500 AD mostly included relatively minor land-use changes for dwellings and agriculture (Wadsworth, 2015), while European settlement (mid to late 1800’s) resulted in widespread changes in land-use, including the wholesale removal of native vegetation for timber, conversion to steep pastoral land and coastal developments. Deforestation, infrastructure development, marine farming and increasing maritime activities since European settlement has been linked to increased erosion and marine sedimentation, shoreline habitat degradation and reduced abundance of kaimoana (seafood) and marine megafauna (Davidson and Richards, 2015; Handley, 2016; Handley et al., 2020). For example, sediment accumulation rates in the Abel Tasman National Park estuaries, to the west of the Marlborough Sounds, has increased by more than six times from pre-human (0.5 – 1.7 mm/yr) to modern estimates (2.3 – 3.3 mm/yr; Goff and Chagué-Goff, 1999; Handley, 2016).
Materials and Methods
A total of 433 km2 of multibeam echosounder seafloor data and 130 geological samples were acquired in the QCS and TC are used in the present study to illustrate the range of anthropogenic and natural processes shaping the seafloor in this region. The survey included full seafloor bathymetric coverage from the land-water interface to the deep water in the outer mouths of the QCS and TC, facing the Cook Strait. Due to the range of depths within the surveyed area, a combination of satellite derived bathymetry and two acoustic systems were used to obtain seafloor depths all the way to instantaneous land-water interface, which was subsequently processed to chart datum. A Kongsberg EM2040 Multibeam Echosounder (MBES) was used to map the seafloor in water depth deeper than 5 m and a Kongsberg Geoswath Plus phase measuring bathymetric system with steep grazing angle was used in water depths between land-water interface and 5 m (minimum to the drying line), as well as along coastline areas not surveyed by the EM2040 multibeam. Satellite derived bathymetry was used to infill any sections of the seafloor that were not covered by the two acoustic systems. Acoustic data processing was completed using CARIS HIPS software. For detailed technical information about the acoustic acquisition parameters and data processing, refer to Neil et al. (2018).
Bathymetric data were gridded at 2 m horizontal resolution and complementary seafloor backscatter data are presented as 0.5 m mosaic. Seafloor backscatter is the echo intensity of the incoming sound wave recorded by the sonar receiver (Lurton, 2002). Seafloor backscatter intensity can be related to sediment grain size and micro-topography and has been used as a proxy for seafloor substrate (e.g., Brown et al., 2011; Lamarche et al., 2011; Lucieer and Lamarche, 2011; McGonigle and Collier, 2014). In this study, seafloor backscatter provided additional qualitative information about the substrates, in conjunction with sediment samples to better constrain the geologic nature of the seafloor. Bathymetry and backscatter data were used, alongside bathymetric derivatives (slope, hillshade, curvature, rugosity etc.) to describe and quantify the spatial distribution of natural and anthropogenic features within the QCS and TC. Geomorphological analyses were performed in ArcGIS Pro V 2.4.2.
Seabed samples (n = 130) were collected using sediment grabs (Dietz-Lafond and Van Veen grabs). Sedimentary samples were processed at the NIWA laboratory following well established laboratory procedures for heterogeneous marine sediments and a systematic methodology of homogenization, sub-sampling, and particle size analysis (by laser diffraction and sieve methods). Homogenous sub-samples of ∼1 cm3 were used for laser sizing. Sedimentary components less than 2000 μm in size were analyzed for particle size distributions using a Beckman Coulter LS 13 320 Dual Wavelength Laser Particle Sizer. The result is a particle size distribution ranging from 0.4–2000 μm displayed as volume percent. Sediment textural descriptions follow the well-established guidelines of Udden (1914) and Wentworth (1922), but to also align with hydrographic definitions “gravel” refers to all material > 2 mm. The gravel component was estimated from the remaining sub-sample and passed through the 1.6 mm sieve, then the components dried and weighed to estimate the gravel content. For visual clarity, pie charts showing grainsize distributions represent only a subset of those collected to reflect the regional sediment grainsize distribution. For locations and grainsize proportions of all samples, see Supplementary Material 1. For a detailed technical information about geological sampling and processing, refer to Neil et al. (2018).
Results
We describe and characterize the mapped seabed area in the Marlborough Sounds into four distinct zones (Figure 1b): the inner Queen Charlotte Sound (QCS), the central QCS, the outer QCS and Tory Channel (TC), based on the spatial distribution of natural and anthropogenic morphologies, seafloor backscatter, and geological seafloor samples.
Inner QCS
The inner QCS is characterized by water depths ranging from 0 – 70 m, with an average depth of 28 m (Figure 2a). The seafloor within the inner QCS is mostly flat to gently sloping (< 2°) with low intensity backscatter in the main channel. Within 200 m of the coastline, the seafloor increases in slope and shoals dramatically (in places exceeding 30°) and is characterized by high intensity backscatter (Figure 2b). The main inner QCS channel extends from Okiwa Bay for ∼27 km along an ENE-SWS direction, with ∼ 16 major embayments connecting either perpendicularly or obliquely to the main inner QCS channel. There is no major distinction in seafloor depth, slope, backscatter or sediment grainsize within the embayments compared to the main channel of the inner QCS. Two islands are located within the inner QCS: Allports Island and Mabel Island (Figure 2a). Most (∼70%) of the sediment samples from the inner QCS (n = 28) have high (> 90%) proportions of silt, except for one sample located adjacent to Picton port that contains 98% gravel (Figure 2b). Toward the TC junction, moats up to 70 m deep and 500 m across occur at the base of promontories that extend into the inner QCS.
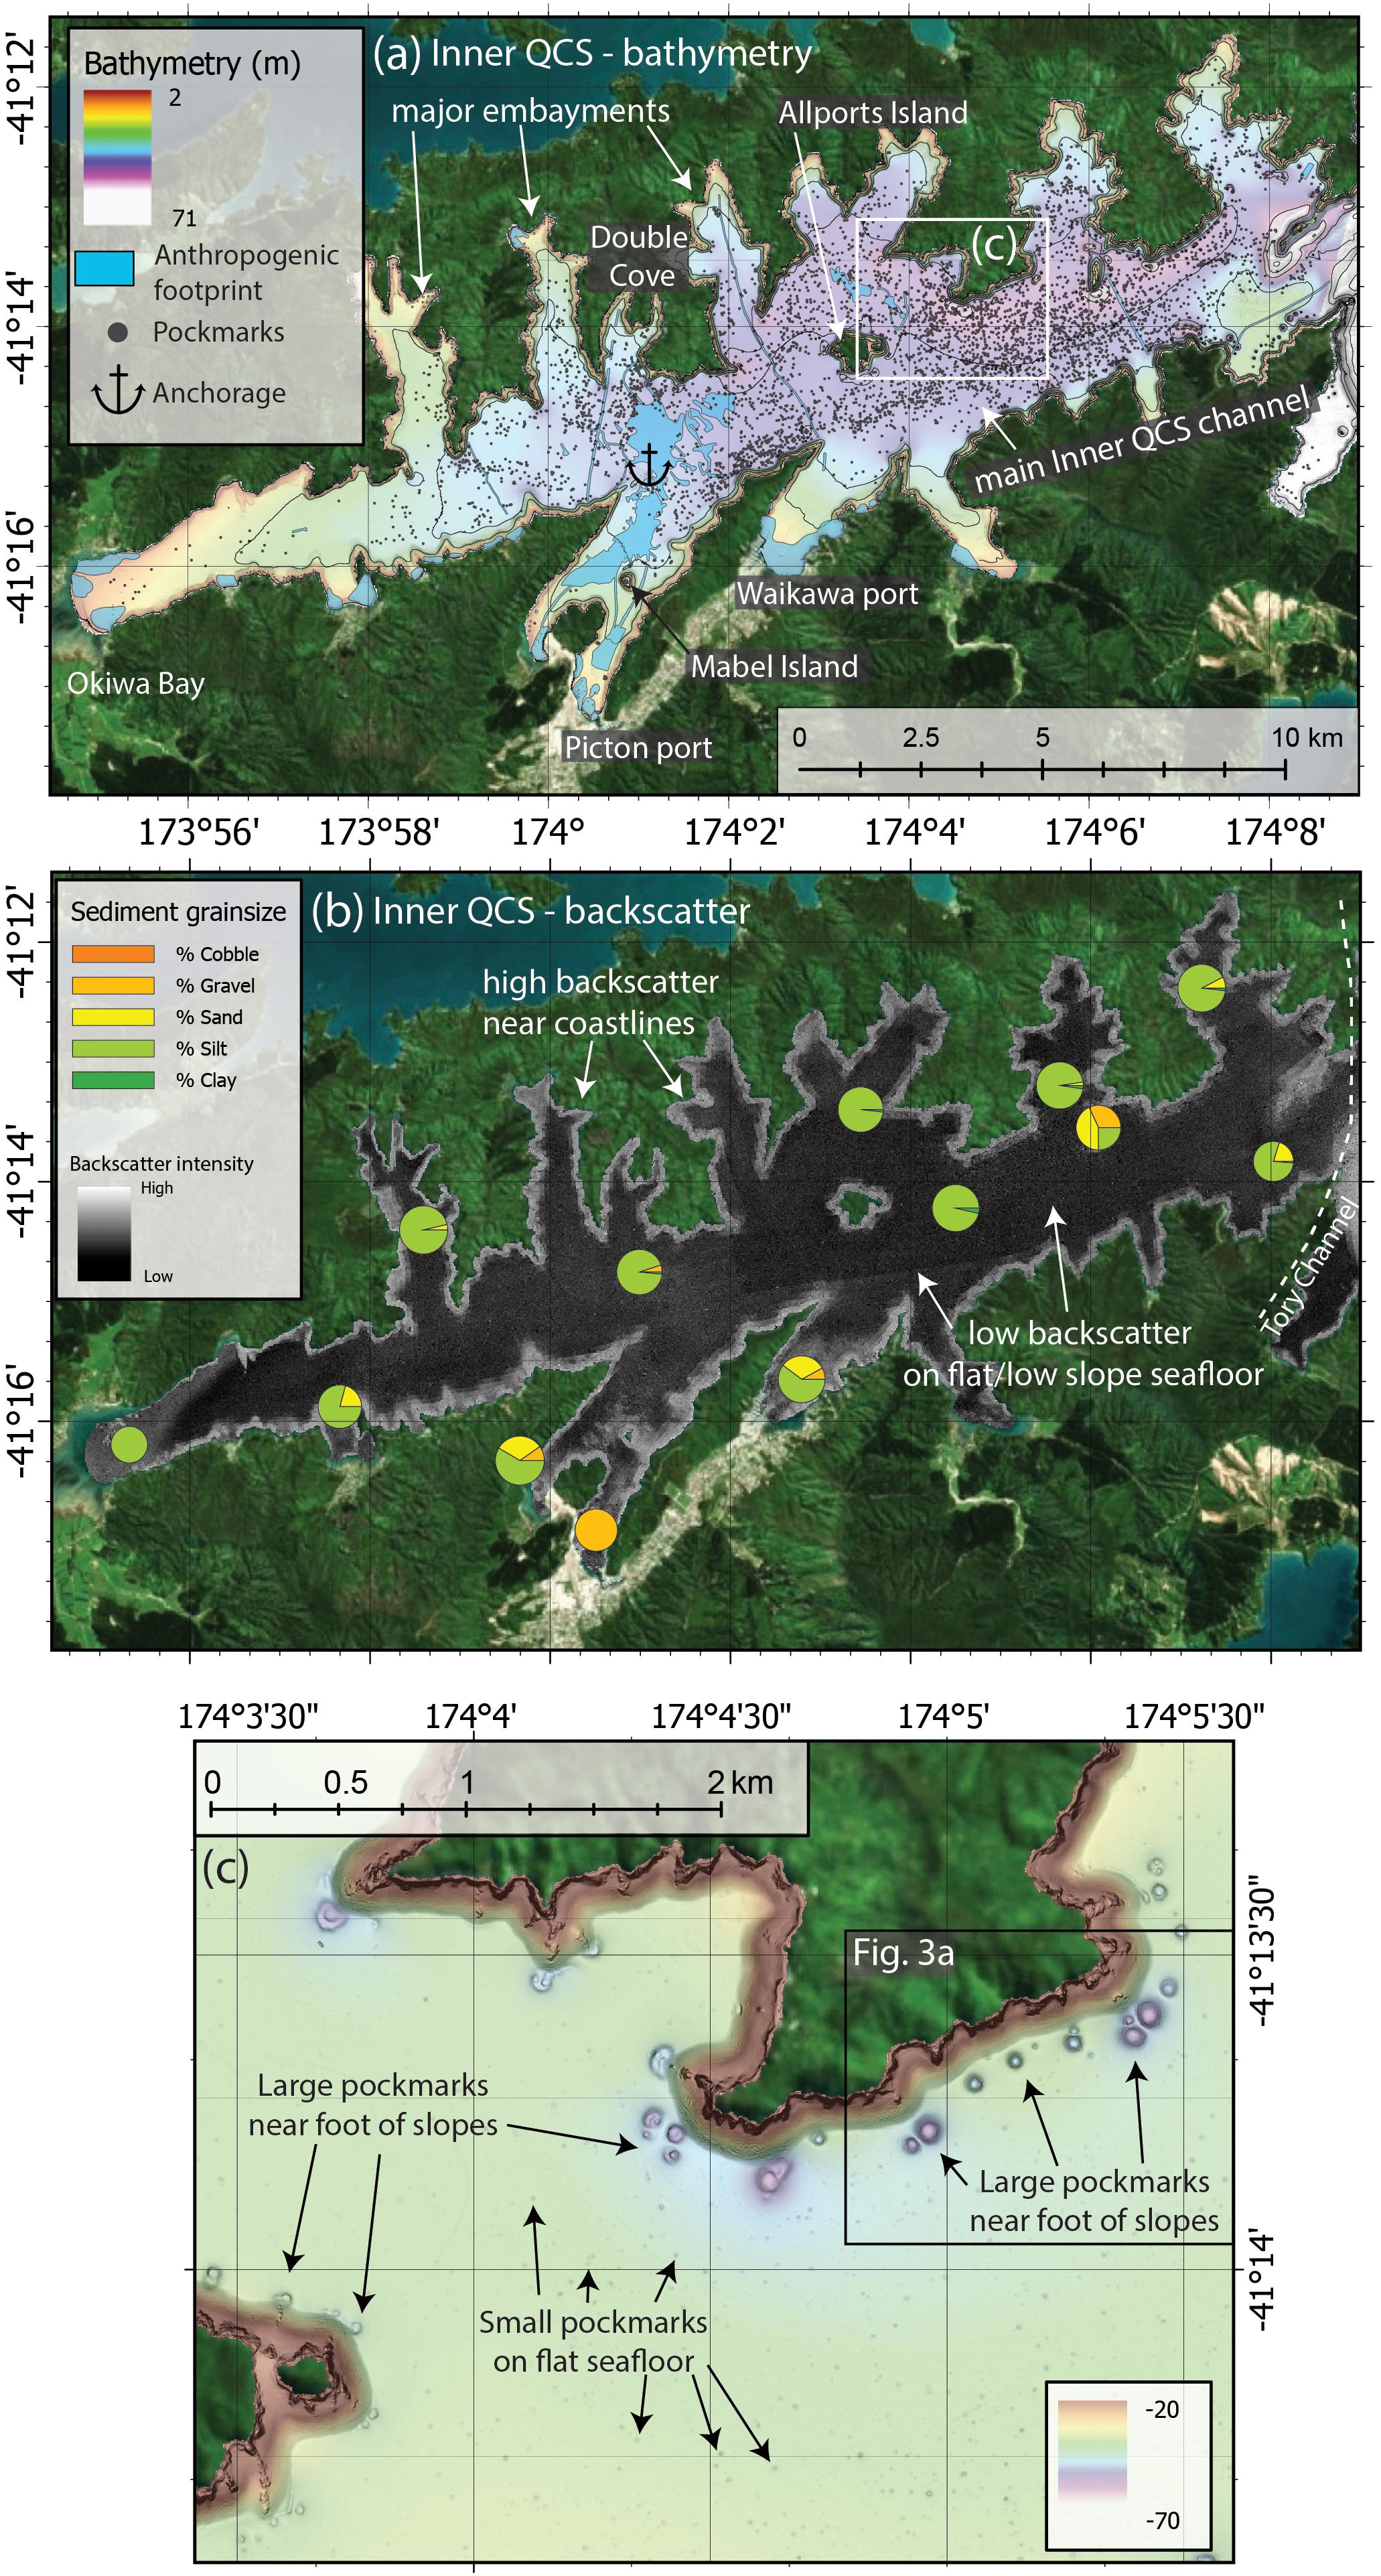
Figure 2. (a) Gridded 2-m bathymetry overview of the inner QCS. For location of inner QCS see Figure 1b. Features described in the main text are labeled. Blue transparent polygons are seafloor regions affected by anthropogenic activities, black points are locations of pockmarks, black lines are bathymetric contours at 10 m intervals. Anchor symbol represents the location of the Picton Anchorage. White square shows location of inset (c). (b) Gridded 0.5 m seafloor backscatter mosaic in the inner QCS. For clarity, pie charts show a subset of sample grain-size distributions that are representative of the trends observed in the complete dataset (for locations and grainsize distribution data for all samples collected in the HS51 project, refer to Supplementary Material 1). (c) Zoomed in view of small and large pockmarks and their typical spatial distributions. For image location see inset a. Black rectangle shows the location of Figure 3a.
Pockmarks are a prolific natural geomorphic feature within the inner QCS (n = 4181 or 49% of the total pockmarks observed within the entire Marlborough Sounds study area (Figure 2a). In the inner QCS they occur mostly at 25 – 50 m water depth and collectively cover 1.1 km2. Two main groups of pockmarks observed in the present study can be differentiated based on size and spatial distribution (Figure 2c). Large pockmarks: characterized by having an individual surface area > 1000 m2, are concentrated along the foot of slopes immediately adjacent to coastlines (between 100 – 500 m to nearest coastline); and small pockmarks (< 1000 m2), which are distributed mostly within the flat regions in the embayments and central channel (Figures 3a–c, Profile A-A’). Large pockmarks make up only 7% (n = 601) of all pockmarks observed in this study. In the inner QCS, pockmarks are more densely distributed within the embayments to the NW of the main channel and increase in concentration between Allports Island and the TC intersection (Figure 2a). Almost a third (29%, n = 172) of all large pockmarks observed in the entire QCS-TC region are located in the inner QCS.
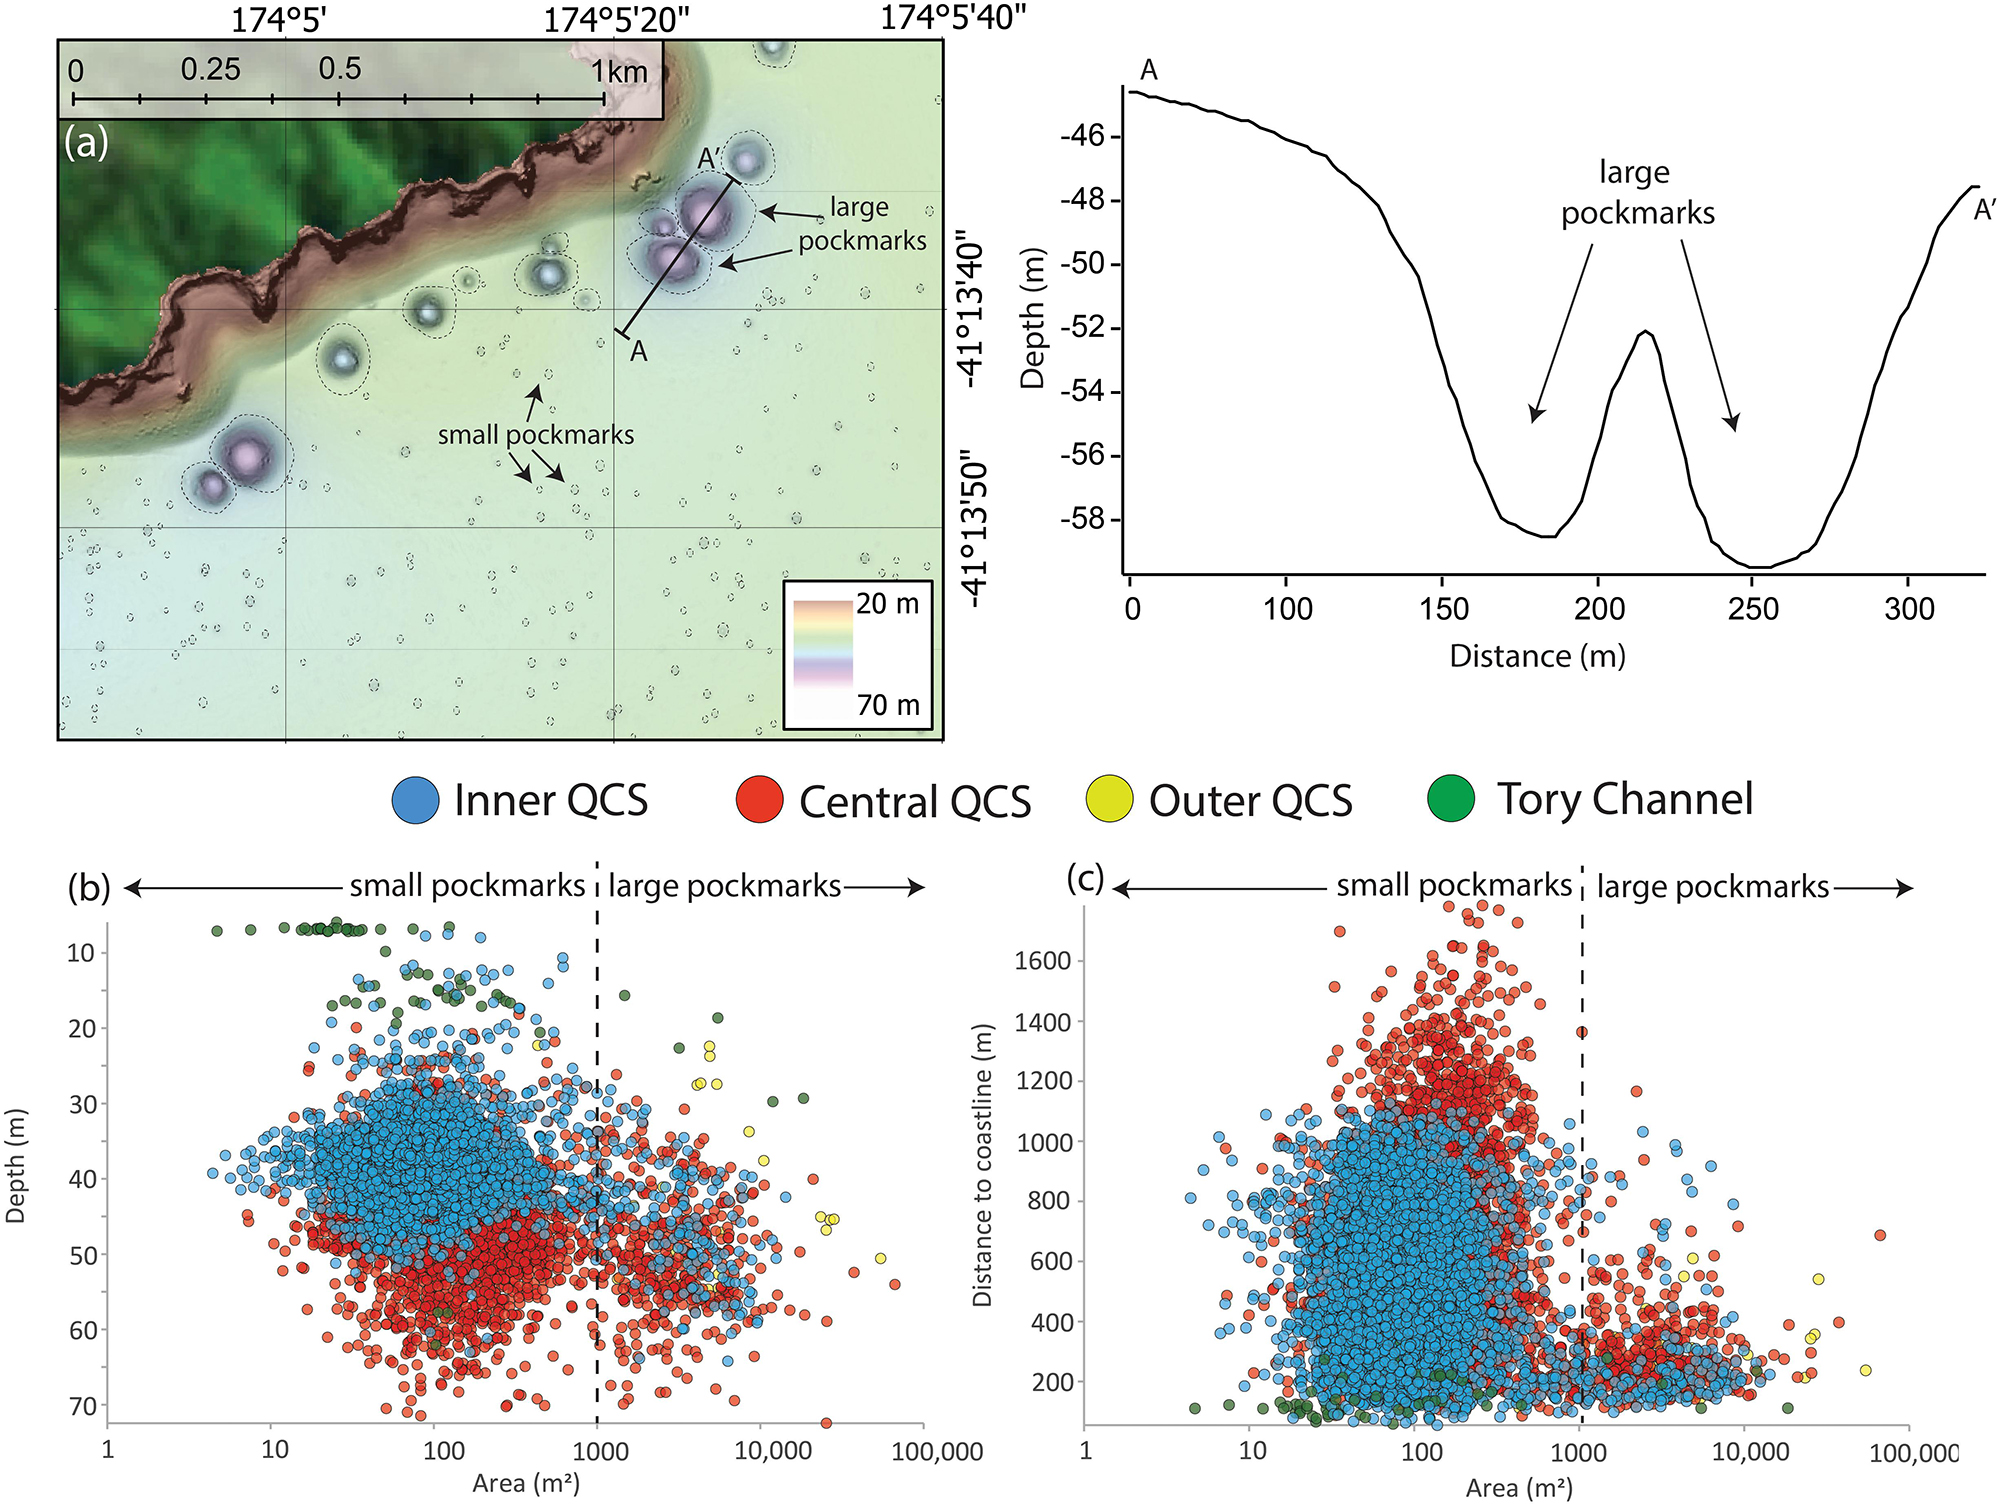
Figure 3. (a) Zoomed in view of small and large pockmark seafloor morphology in the inner QCS, dashed black lines highlight the locations of pockmarks. Location of profile A-A’ is shown, traversing two large pockmarks. (b) Plot showing the pockmark area vs. water depth and (c) pockmark area vs. distance to nearest coastline, for all pockmarks in the QCS and TC. Colors represent the four main regions: inner QCS (blue), central QCS (red), outer QCS (yellow) and TC (green). Dashed lines show the distinction between small (< 1000 m2) and large (> 1000 m2) pockmarks.
High resolution bathymetry reveals evidence of human modification or disturbance on the seafloor. In the inner QCS, doughnut-shaped troughs up to 40 m across and < 0.5 m deep with a central mound, ∼0.5 m high (Figure 4A) occur mostly near the coast and are attributed to mooring blocks (Figure 2a). Linear ridges extend up to 250 m into the shallow marine environment from the coastline, associated with coastal infrastructure such as wharves and jetties (Figure 4B). Intense linear scouring related to anchor drag on the seabed is a common feature in the inner QCS, particularly near Picton Port and Anchorage (Figures 2a, 4C). These features make up the anthropogenic footprint in the QCS and TC and include emplacement of structures onto or disturbance of the seafloor by mooring blocks, wharves, anchor drag, marine farms, pipelines, cables and shipwrecks (Figures 4A–F). The inner QCS hosts 64% (4.1 km2) of the observed anthropogenic footprint observed in the entire mapped area. Approximately 6% of the seafloor in the inner QCS has been modified or disturbed by anthropogenic activities.
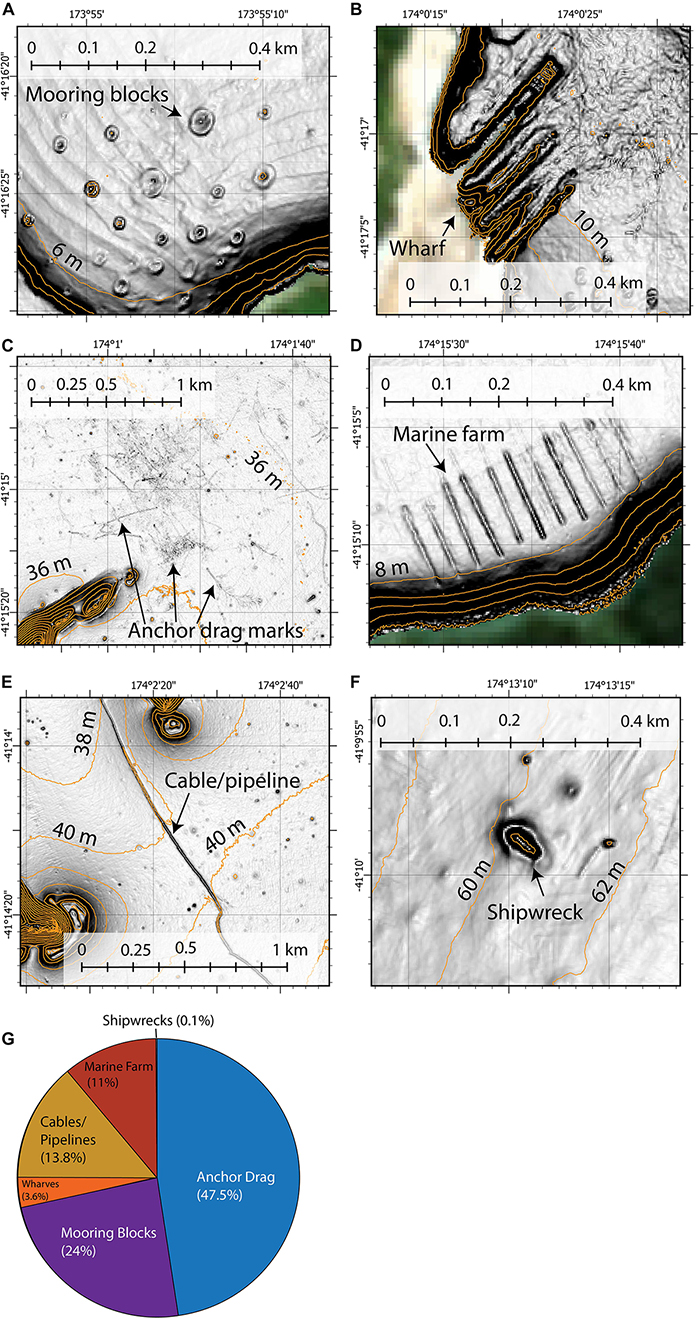
Figure 4. Hill-shaded examples of the anthropogenic footprint observed in the QCS and TC; orange lines are 2 m contours. (A) mooring blocks in the inner QCS, (B) wharves near Picton Port, (C) anchor drag marks at the Picton Anchorage, (D) marine farm in TC, (E) seafloor cable or pipeline in inner QCS, (F) shipwreck in the central QCS, (G) pie chart showing the different types of anthropogenic footprint observed in the QCS and what proportion of area they contribute as a percentage.
Central QCS
The central QCS is characterized by water depths of up to 80 m (deepest near Blumine Island), with an average water depth of 40 m (Figure 5a). The main channel of the central QCS is divided by number of islands including Blumine, Pickersgill, and Long islands, which are the largest islands within the entire QCS and TC (Figure 5a). The central QCS widens substantially from 2.6 km across near the TC intersection, to > 9 km across near the boundary to the outer QCS. The central QCS has a complex coastal geometry, with two major embayments (Endeavor Inlet and East Bay/Onauku Bay) extending ∼3 km to the west and east, respectively, of the central QCS channel.
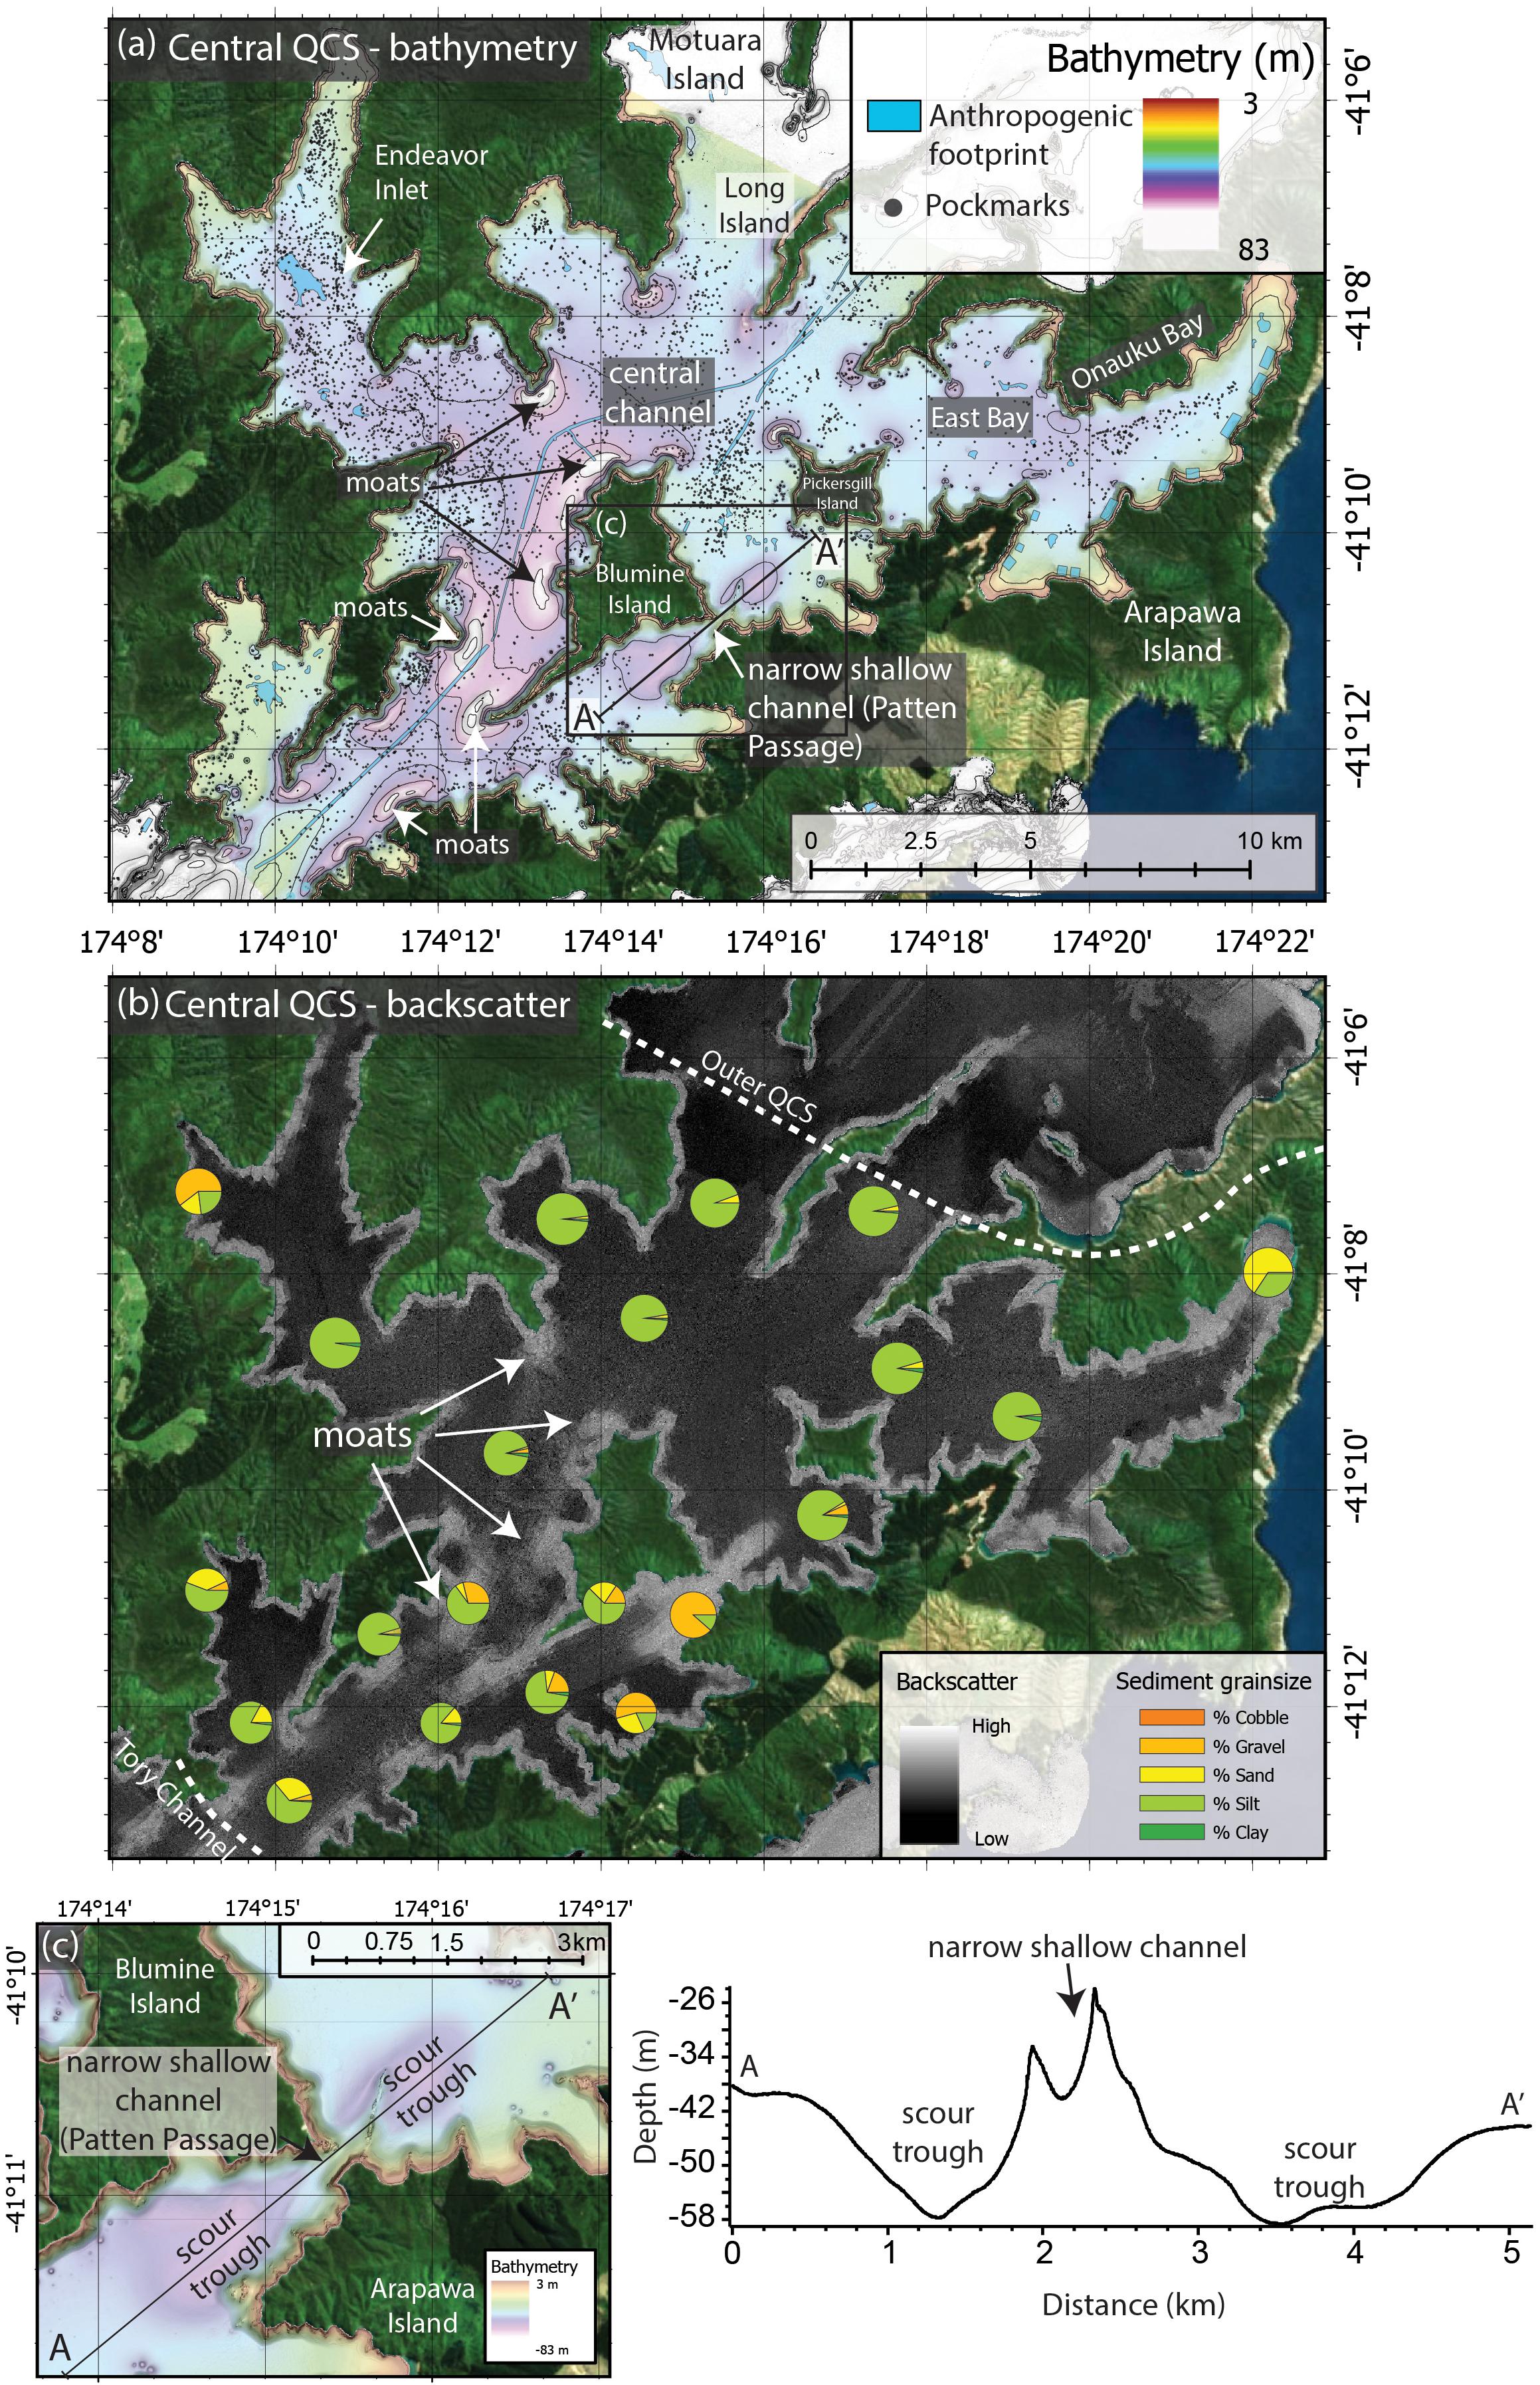
Figure 5. (a) Gridded 2-m bathymetry overview of the central QCS. For location of central QCS see Figure 1b. Features described in the main text are labeled. Blue transparent polygons are regions affected by anthropogenic activities, black points are locations of pockmarks, black lines are bathymetric contours at 10 m intervals. Black square shows location of inset (c). (b) 0.5 m seafloor backscatter mosaic in the central QCS. For clarity, pie charts show a subset of sample grain-size distributions that are representative of the trends observed in the complete dataset (for locations and grainsize distribution data for all samples collected in the HS51 project, refer to Supplementary Material 1). (c) Zoomed in view of elongated bathymetric troughs extending in a NE-SW direction either side of the narrow shallower (∼30 m deep) channel between Blumine Island and Arapawa Island. Black line shows the location of profile A-A’.
The seafloor within the central QCS is relatively flat to gently sloping (< 2°), with regions of high slope (> 30°) around the coastlines. The seafloor in the relatively flat central channel is mainly dominated by silts and homogenous low backscatter (Figure 5b), similar to the inner QCS central channel. However, unlike the inner QCS, the central QCS displays isolated regions characterized by higher proportions of sand and gravel, with higher intensity heterogeneous seafloor backscatter. Coarser grainsizes (sand to gravel) are also found in Endeavor Inlet, Onauku Bay, near Blumine Island and close to the TC intersection. Seafloor depressions, or moats, are common features occurring adjacent to headlands and promontories from the junction of TC to the west of Blumine Island (Figure 5a), characterized by higher intensity seafloor backscatter compared to the flat seafloor in the central channel (Figure 5b). The central QCS is separated from the outer QCS by a prominent bathymetric sill (see description in Section “Outer QCS”).
A pair of elongated bathymetric troughs, reaching ∼58 m water depth, extend in a NE-SW direction either side of the narrow shallower (∼30 m) channel between Blumine Island and Arapawa Island, known as the Patten Passage (Figure 5c). Higher intensity backscatter signatures and large sediment grain-sizes are collected across both troughs compared to outside of the troughs (Figure 5b).
There are 4234 pockmarks within the central QCS (50% of all pockmarks mapped in the study area), mostly situated in water depths between 30 and 60 m (Figures 3b,c, 5a) and collectively cover 2.1 km2. The central QCS hosts 66% (n = 396) of all the large pockmarks that were mapped by the survey. The spatial distribution of pockmarks in the central QCS is similar to the inner QCS, where large pockmarks are primarily found adjacent to the coastline and small pockmarks are distributed across the flat central channel. The present study shows that pockmarks are most prevalent in the inner and central QCS (Figures 3b,c). Large pockmarks (> 1000 m2 in area) are mostly situated close to coastlines (Figure 3c) and represent 7% of all pockmarks observed, whereas small pockmarks (area < 1000 m2), make up 93% of all pockmarks and are widespread across the seafloor within both the inner and central QCS (Figures 3a–c). The inner QCS has almost double the concentration of pockmarks per unit area (63 pockmarks per km2) compared to the central QCS (36 pockmarks per km2); however, the central QCS has a higher proportion of large pockmarks in (66%) compared to the inner QCS (29%).
In the central QCS, arrays of linear ridges between 100 to 300 m long running parallel or perpendicular to the coastline and are particularly common in Onauku Bay (Figure 4D) and where marine farms are operating. A prominent ∼27 km linear trough of < 1 m depth along the seabed (Figure 4E), runs parallel to the long axis of the main QCS channel, and is attributed to the troughs excavated to install seafloor cables and/or pipelines. Collectively, the anthropogenic footprint in the central QCS consists of anchor drag marks, and marine infrastructure such as mooring blocks, cables/pipelines and wharves, and is observed across 1.4% of the total area of the central QCS, substantially lower than the inner QCS. Nonetheless, the anthropogenic footprint in the central QCS covers a cumulative area of ∼1.7 km2 and represents ∼27% of the total anthropogenic footprint mapped in the present study.
Outer QCS
The boundary between the central and outer QCS is marked by the presence of a sill, characterized by a distinct change in seafloor geomorphology, rugosity, change of seafloor backscatter and variation of sediment grainsize (Figures 6a–d). Landward of the sill (central QCS; Figures 5a,b) the seafloor is relatively flat (< 2°), with low intensity backscatter and high proportions of silt, whereas seaward of the sill (outer QCS; Figures 6a–c) the seafloor is highly variable with high intensity backscatter, and sand-gravel dominated sediments. The expansive bathymetric rise, or sill, located between Long Island and the mouth of the QCS covers an area of ∼7.6 km2 and shoals to ∼15 m water depth (Figures 6a,b, 1– Profile A-A’). The subsurface composition of the sill has not been determined but it spans the full width of the QCS mouth (up to 10 km wide), has a general smooth surface morphology, and sediment waves on the seaward side. Geological samples obtained from the outer QCS are characterized by high proportions of sand (up to 98%) and gravel (up to 96%), and those collected from east of Arapawa Island closest to the Cook Strait, are composed entirely of cobble-sized grains (Figure 6c).
Figure 6. (a) Gridded 2-m bathymetry overview of the outer QCS. For location of outer QCS see Figure 1b. Features described in the main text are labeled. Blue transparent polygons are regions affected by anthropogenic activities, black points are locations of pockmarks, black lines are bathymetric contours at 10 m intervals. Black rectangles show locations of Figures 7, 8 as labeled. (b) Large-scale (km) seafloor geomorphology in the outer QCS showing the highly variable nature of the seafloor in this part of the study area. Geomorphological analysis determined by bathymetry, bathymetric derivatives (slope, rugosity, curvature) and seafloor backscatter intensity. (c) Gridded 0.5 m seafloor backscatter mosaic in the outer QCS. For clarity, pie charts show a subset of sample grain-size distributions that are representative of the trends observed in the complete dataset (for locations and grainsize distribution data for all samples collected in the HS51 project, refer to Supplementary Material 1). (d) Rugosity raster generated at 3 × 3 neighborhood size. Regions shaded red represent higher rugosity compared to regions shaded blue.
The only observed anthropogenic footprint on the seafloor in the outer QCS is a small section of cable or pipeline east of Long Island, and mooring blocks and anchor drag marks south-west of Motuara Island totaling a cumulative area of < 0.3 km2 (i.e., < 5% of the total anthropogenic footprint and covering only 0.09% of the total seafloor area in the outer QCS).
The outer QCS displays highly variable geomorphology including a range of erosional (scours) and depositional/migratory features (sand waves, dunes, ripples; Figure 6b). Along the north-western Cape Jackson coastline, the sill is incised by a 6 km long and 2 km wide bathymetric trough that attains a maximum depth of 136 m water depth (Figures 6a, 7a). Bathymetric troughs are widespread in the outer QCS, commonly found adjacent to structural highs and/or coastal promontories and occupy a total area of 61 km2 (Figure 6b). The trough that runs adjacent to the Cape Jackson coastline displays high intensity backscatter at the opening to the Cook Strait to the north and is associated with decreases in backscatter intensity and increases in rugosity toward the south (Figures 6c,d). At the southernmost end of the trough, barchan bedforms, < 0.5 m wave height and ∼25 m wavelength, with strong alternating high (peaks) and low (troughs) intensity backscatter fanning out across the sill (Figure 7b). These barchan mega-ripples are oriented approximately E-W along their axis, with the “horns” angled toward the south.
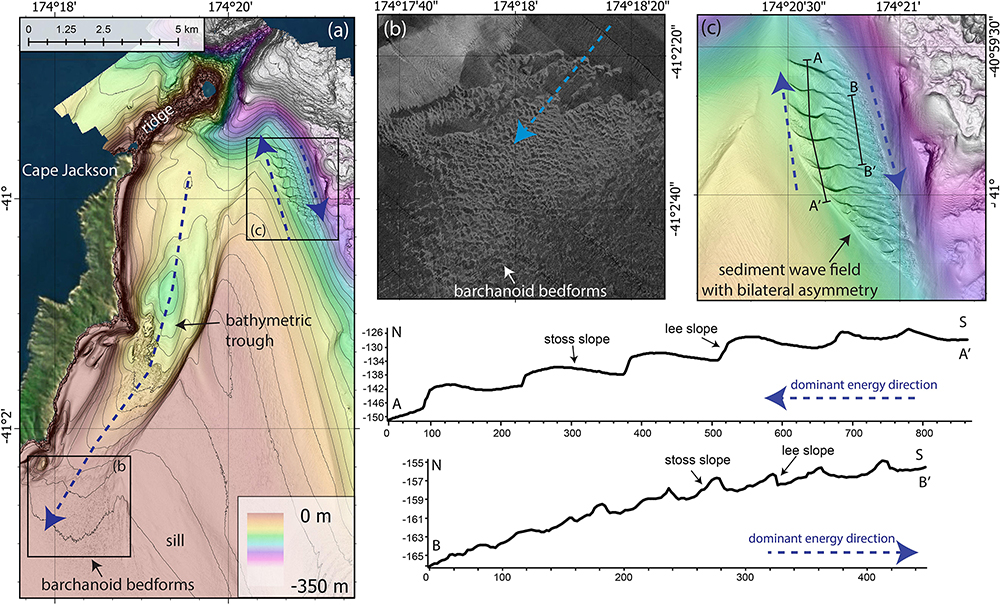
Figure 7. (a) Detailed view of the bathymetric trough that runs adjacent to the Cape Jackson coastline. Black squares show locations of insets b & c. black lines are bathymetric 10 m contours. Navy blue arrows show dominant transport direction as interpreted from seafloor geomorphology. (b) seafloor backscatter signature of barchanoid mega-ripples at the southern end of the Cape Jackson trough, showing strong alternating highs (peaks) and lows (troughs) intensity seafloor backscatter. (c) Sedimentary waves east of Cape Jackson displaying bilateral asymmetry, where the bedforms on the western side of the wave field indicate northward transport, and the bedforms ∼600 m to the east in the same wave field indicate southward transport. Locations of Profiles A-A’ and B-B’ are shown. Profiles A-A’ and B-B’ show differences in the size and transport direction of bedforms.
On the northern seaward side of the sill, we observe a field of sand waves and mega-ripples that covers ∼0.7 km2. The sand waves and mega-ripples on the western side of the sediment wave field displays larger bedforms (∼150 m wavelengths, ∼4 m amplitudes; Figure 7- Profile A-A’), with steep lee slopes facing north. Within the same field, ∼600 m to the east, the dune crests bifurcate into smaller mega-ripples (∼50 m wavelength and < 2 m amplitudes; Figure 7- Profile B-B’), with the high angle lee slope facing south, resulting in a bilateral asymmetry of the sediment wave field.
Three narrow submarine ridges extend at least 10 km north from Cape Jackson, Arapawa Island and The Brothers islands trending north-east toward Cook Strait (Figure 6b). The submarine ridges are 1 km at widest section, rising to 240 m above surrounding seafloor. The composition and formation of these ridges cannot be constrained using the current dataset as they have not been directly sampled. All three ridges are bordered by bathymetric troughs and sediment wave fields resulting in a symmetrical sediment wave-trough-ridge morphology, mirrored about the ridge (Figures 6b, 8). The ridge extending from Arapawa Island is oriented NE-SW and is bordered on both the NW and SE side by troughs that descend to 250 m water depth (Figure 8). The troughs are deepest immediately adjacent to the ridge but shoal steeply to ∼100 m depth within 1 km distance perpendicular to the emergent ridge crests. Bordering the trough flanks are sediment waves fields comprising a range of bedform sizes and morphologies (Figures 9A,B). Samples collected on or near sediment wave fields are composed primarily of sand, gravel and in places cobbles, with small proportions of silt (Figure 6c).
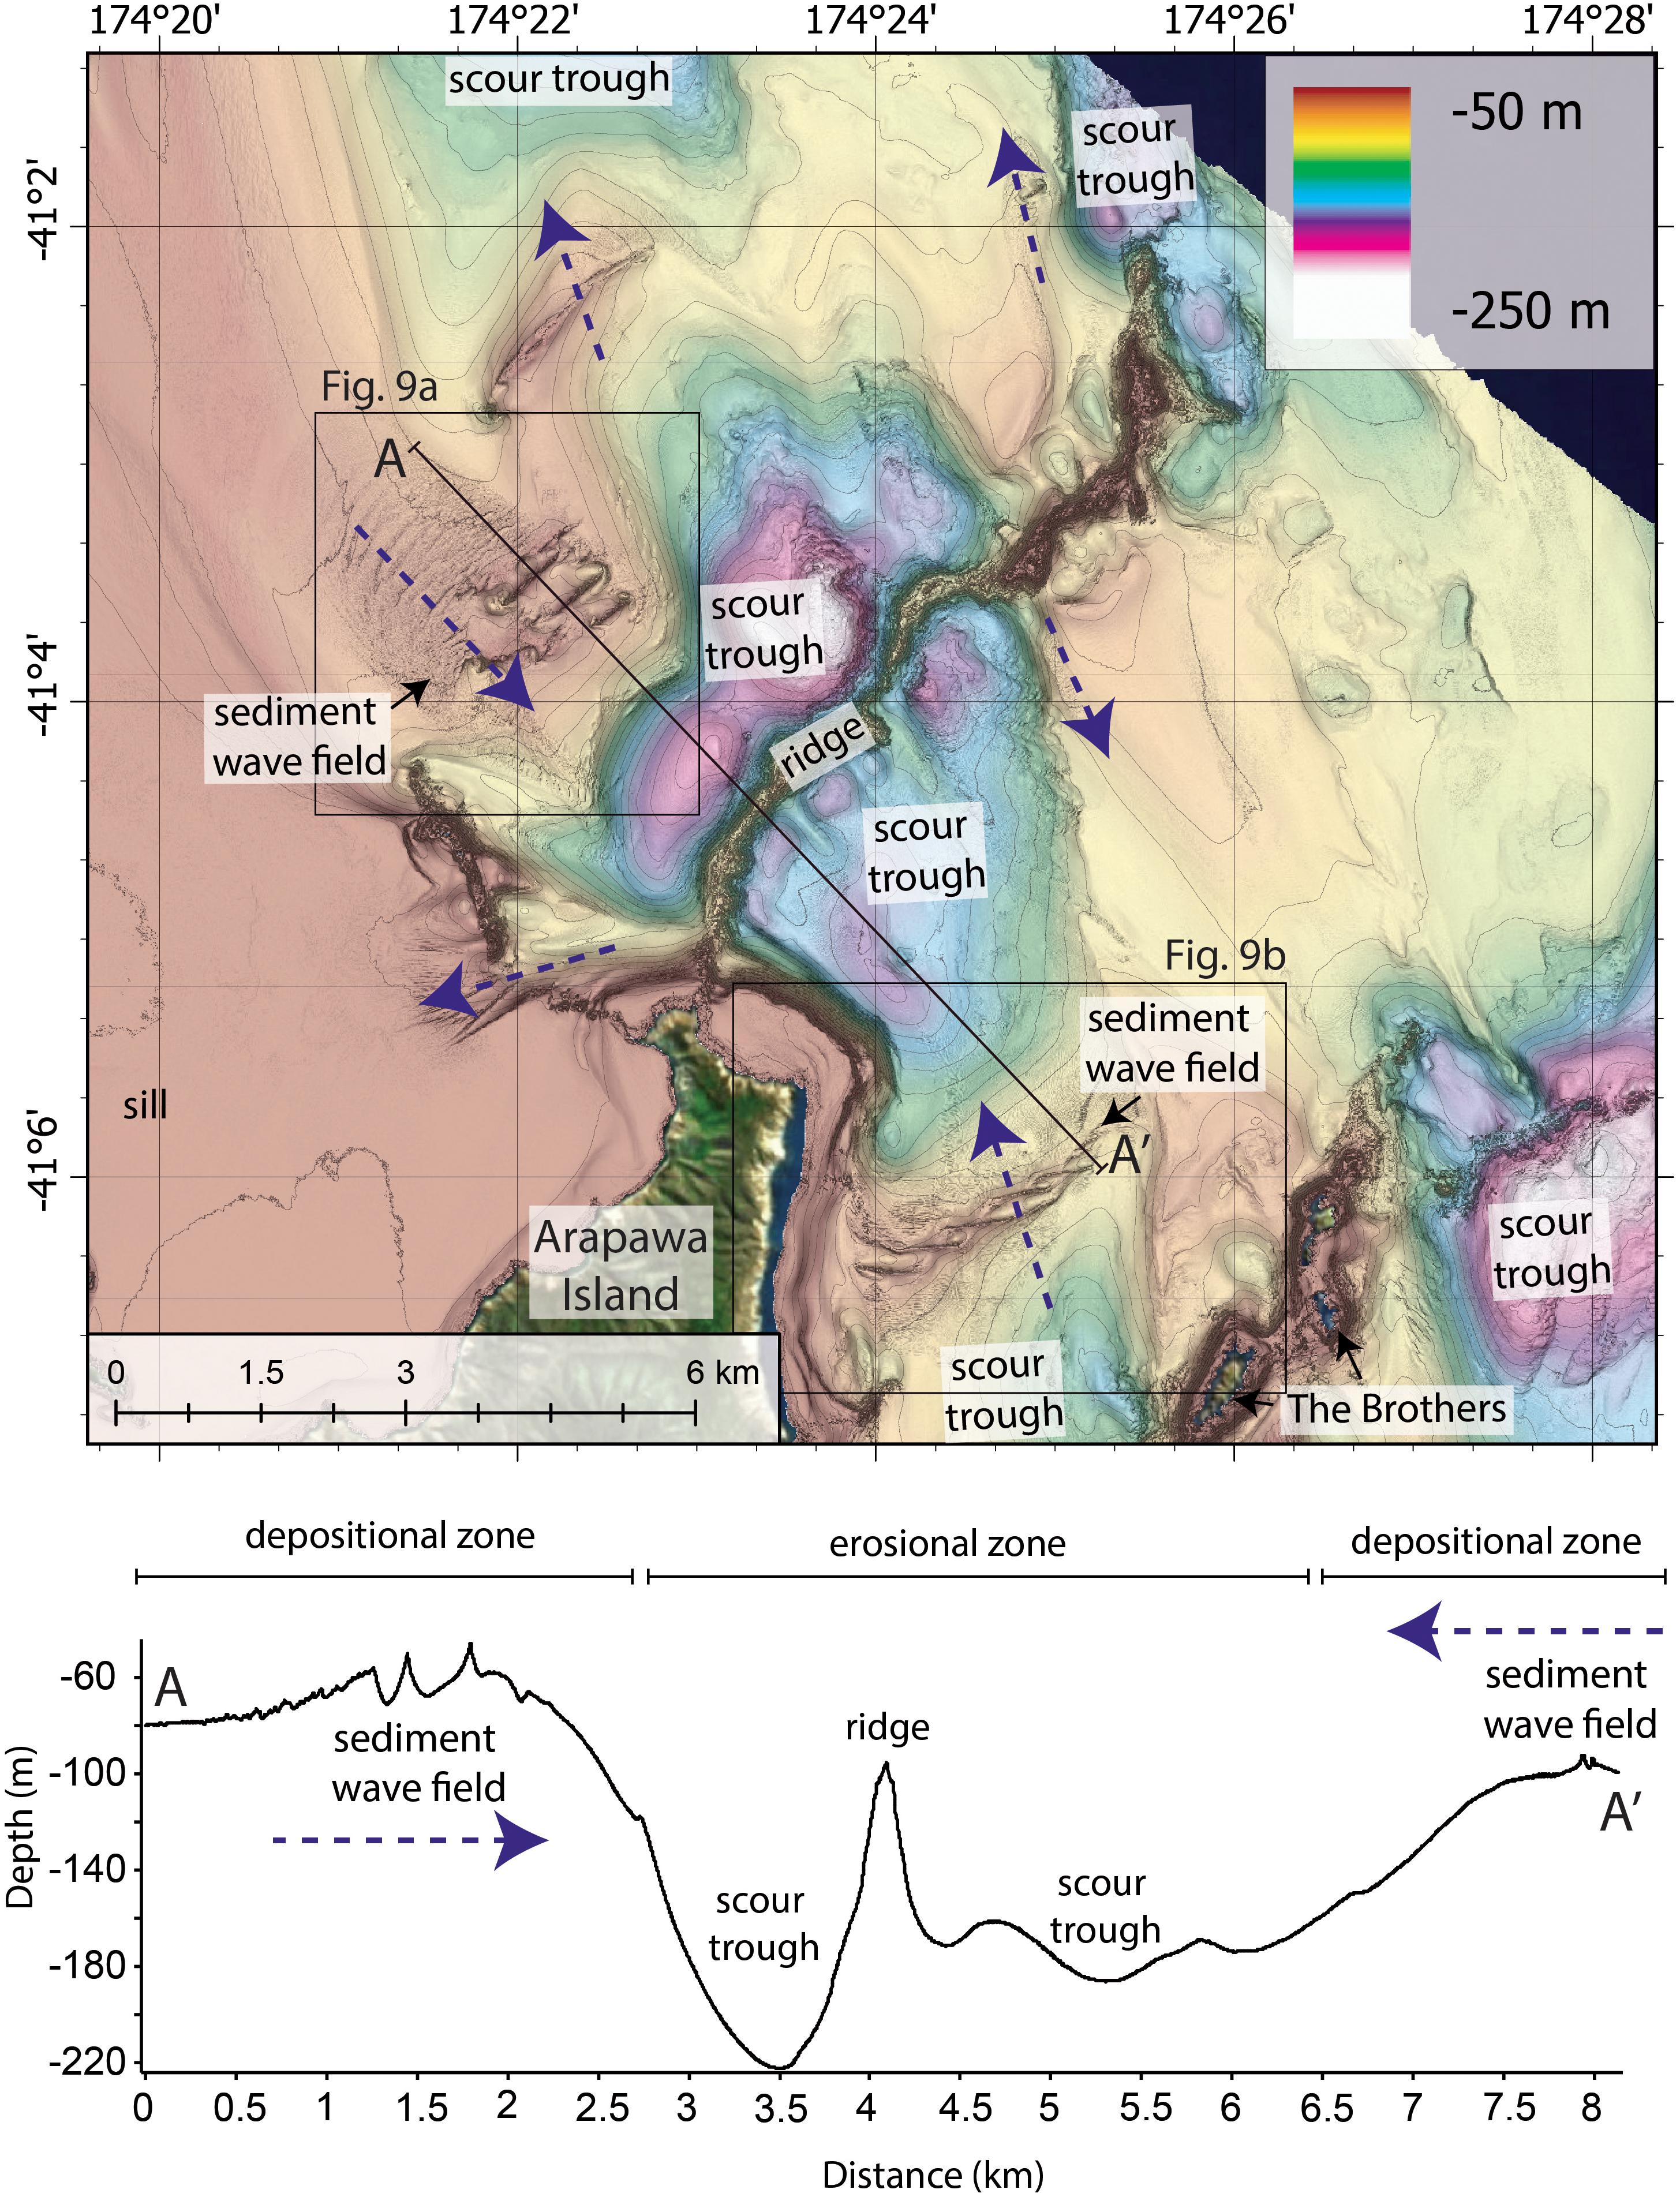
Figure 8. Detailed view of the submarine ridge extended from Arapawa Island. Black lines are 10 m bathymetric contours and black rectangles show the location of Figures 9A,B. The location of Profile A-A’ is shown, which shows mirrored sediment wave-trough-ridge sequences that are symmetrical about the submarine ridge. Navy blue arrows show the dominant transport direction as interpreted from seafloor geomorphology.
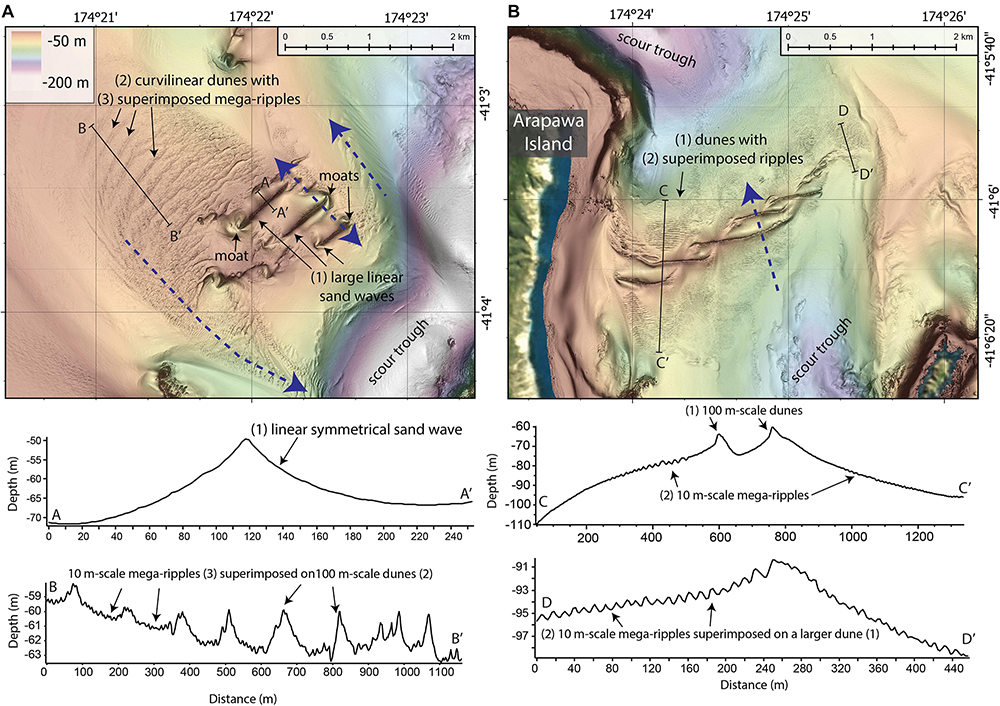
Figure 9. Detailed view of sediment wave fields that lie to the NW (A) and SE (B) of the submarine ridge extending from Arapawa Island. For locations of sediment wave fields see Figure 8. Navy blue arrows show the dominant transport direction as interpreted from seafloor geomorphology. Locations of profiles are shown. Features are labeled as described in the text. Profiles A-A’ shows the profile morphology of the linear symmetrical sediment wave, Profile B-B shows mega-ripples superimposed onto larger dunes, Profiles C-C’ and D-D’ shows asymmetrical en echelon dunes with superimposed symmetrical mega-ripples.
The sediment wave field to the north-west of the Arapawa Island ridge lies in 50–120 m water depth is composed of three main types of bedforms (Figure 9A): (1) three large, linear, symmetrical (∼300 m wavelength and 20 m amplitudes) sand waves with straight crests trending NE-SW, over 300 – 600 m in length and with isolated depressions or moats at each end up to 20 m deep; (2) a field of smaller, weakly asymmetrical to symmetrical, curvilinear dunes (∼100 m wavelengths) that bifurcate forming a complex plan-view pattern; and (3) asymmetrical mega-ripples (∼10 m wavelengths) superimposed onto the dunes, which have high-angle lee-slopes facing south in cross section (Figure 9A, Profile A-A’ and B-B’). All sand waves, dunes and mega-ripples have crests that are oriented NE-SW approximately parallel to the ridge extending from Arapawa Island and are composed of sand-gravel sized sediments inferred from sedimentary samples and high backscatter intensity (Figure 6c).
In comparison, the sediment wave field to the south-east of the Arapawa Island lies in 60 - 100 m water depth ridge is composed of two main types of bedforms (Figure 9B- Profile C-C’ and D-D’): (1) large asymmetrical dunes (∼100 m wavelengths and 15 m amplitudes), with curvilinear crests that braid together forming an en echelon array that trend NE-SW, and (2) small scale symmetrical mega-ripples (∼10 m wavelengths, ∼1 m amplitudes) that are superimposed onto the flanks of the larger dunes. The larger dune network has high-angle lee-slopes facing north (Figure 9B- Profile C-C’).
Tory Channel
The TC extends from the easternmost inner QCS ∼24 km to the NE and opens into Cook Strait. The TC has ∼12 major embayments characterized by relatively shallow (< 20 m water depth), flat seafloor (< 3°) with low backscatter intensity. The embayments are distinct from the main central channel of the TC, which is substantially deeper (30 – 80 m water depth), with more irregular morphology and higher intensity backscatter (Figures 10a,b). At the intersection between the TC and the QCS the seafloor deepens from ∼30 m within QCS to 70 m in the TC. The TC is substantially deeper than both the inner and central QCS reaching water depths up to 80 m in the central channel (Figure 10c - Profile A-A’). The easternmost TC is characterized by very irregular seafloor and two prominent elongated troughs up to 60 m deep, oriented parallel to the main channel. In particular, the mouth of TC displays irregular, rocky seafloor morphology where TC intersects the western Cook Strait. There is one island within the TC: Moioio Island, located adjacent to the main channel on the southern side of TC. Samples collected from the main channel of the TC have high (20–99%) proportions of gravel and sand, whereas those collected within the shallow embayments are mostly composed of silt (61–83%) and sand (15–38%).
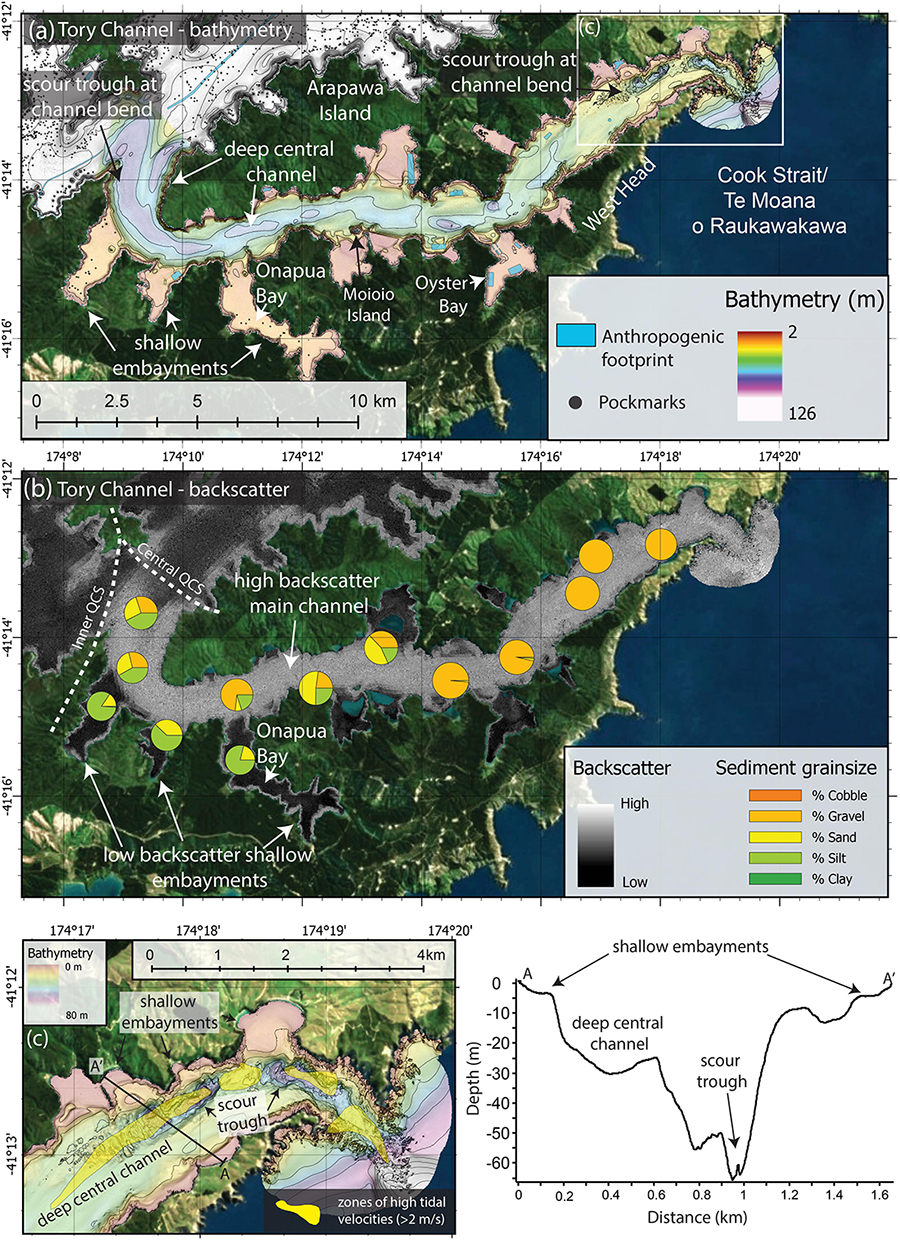
Figure 10. (a) Gridded 2-m bathymetry overview of the TC. For location of TC see Figure 1b. Features described in the main text are labeled. Blue transparent polygons are regions affected by anthropogenic activities, black points are locations of pockmarks, black lines are bathymetric contours at 10 m intervals. Black rectangle shows location of inset c. (b) 0.5 m seafloor backscatter mosaic in the TC. For clarity, pie charts show a subset of sample grain-size distributions that are representative of the trends observed in the complete dataset (for locations and grainsize distribution data for all samples collected in the HS51 project, refer to Supplementary Material 1). (c) detailed view of TC entrance to Cook Strait and the channel bend characterized by intense seafloor scouring that is spatially correlated zones of high tidal velocities (> 2ms–1; Plew and Stevens, 2013; Yellow polygons). Location of Profile A-A’ is shown, which highlights the distinctive difference in depth between the central channel and the TC embayments.
There are only 60 pockmarks within the TC (< 0.5% of total pockmarks observed), all of which occur in < 30 m water depth within the shallow embayments. There are no pockmarks visible within the central TC.
Tory Channel is the main shipping passageway from Cook Strait into the QCS ports, and is the path taken routinely by the regular passenger and freight services that operate across Cook Strait between the North and South islands. The anthropogenic footprint covers 1.2% of the seafloor in TC, relatively small compared to the inner, and represents only ∼6% (∼0.4 km2) of the total footprint observed in the study area. The most common anthropogenic footprint is marine farms, which are mostly located in shallow waters (< 30 m depth) close to coastlines in the embayments (e.g., Oyster Bay; Figure 10a). Other anthropogenic features in TC include mooring blocks, wharves, and shipwrecks.
In general, the largest physical human footprint on the seafloor in the QCS and TC comes from maritime-related activities including anchor drag marks (47.5%) and mooring blocks (24%), followed by marine and coastal infrastructure including cable/pipelines (13.8%), marine farms (11%) and wharves (3.6%; Figure 4G). Shipwrecks make up only 0.1% of the physical anthropogenic footprint. The inner QCS hosts the largest anthropogenic footprint on the seabed (Figure 11), totaling 6% of seafloor (Figure 2a), almost six times the measured footprint in the TC (1.2%; Figure 10a) and central QCS (1.4%; Figure 5a), and substantially higher than that observed in the outer QCS (0.09%; Figure 6a).
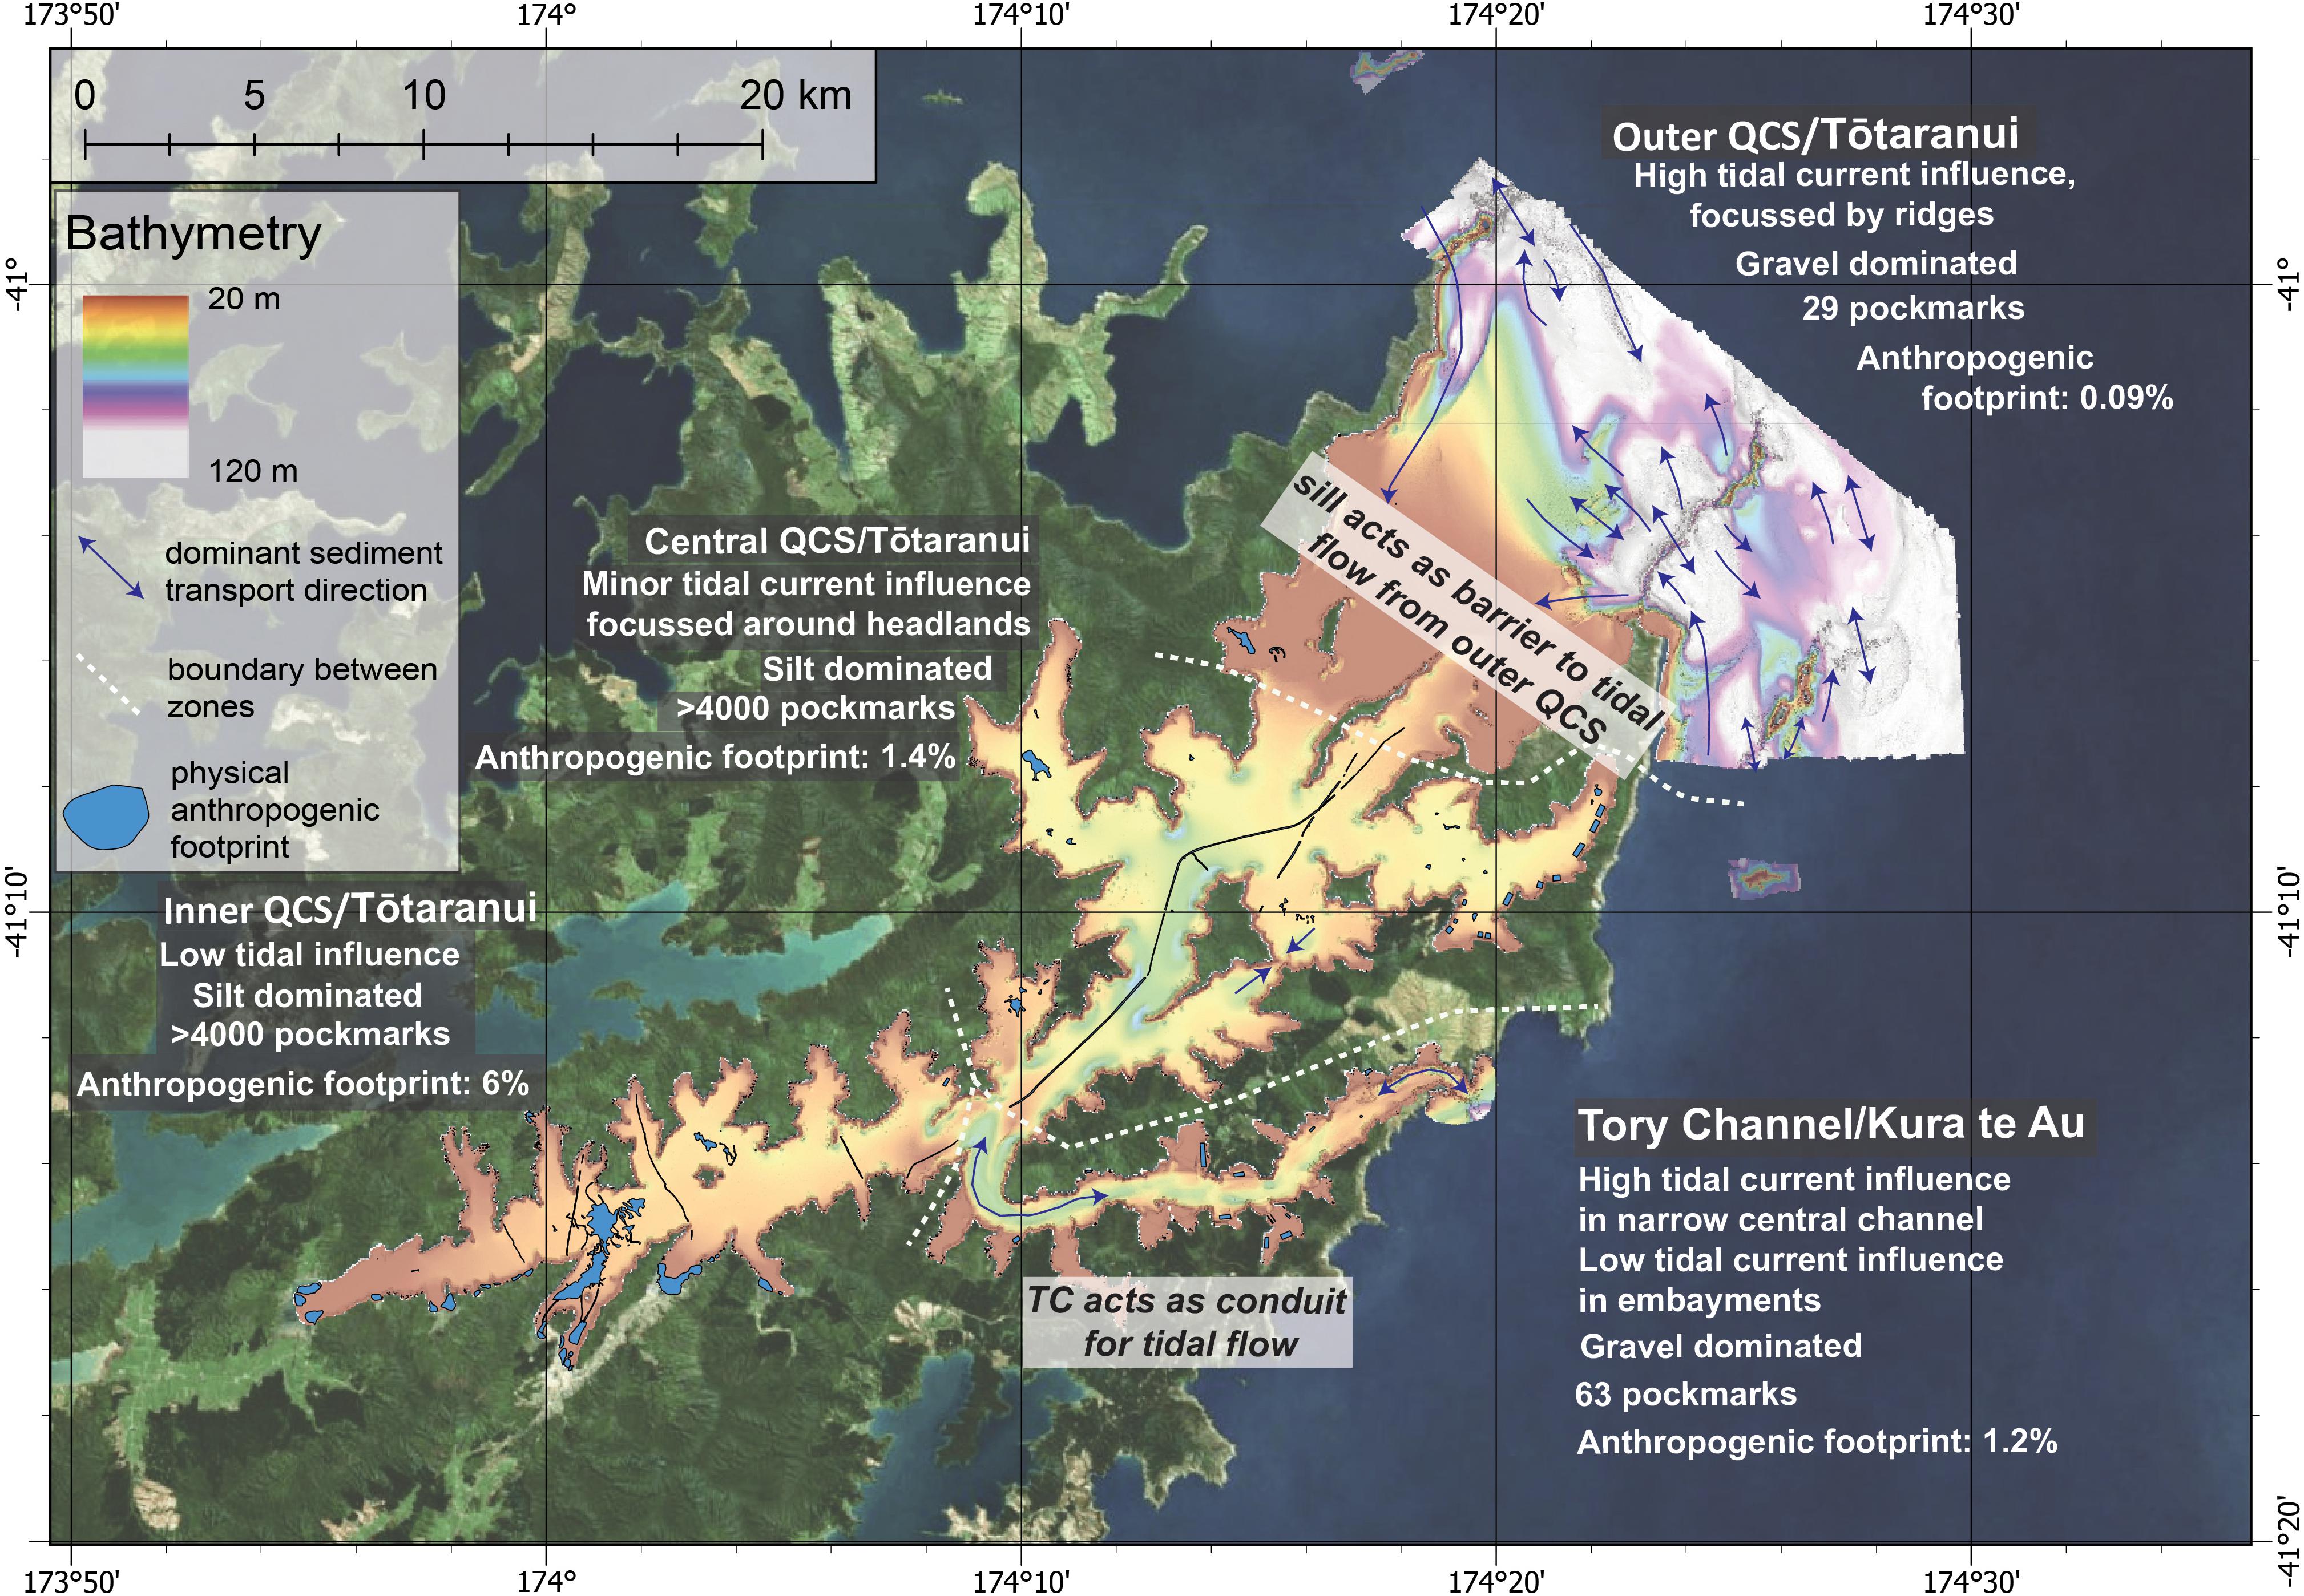
Figure 11. Regional view of the QCS and TC bathymetry (2 m resolution). The study area is divided into geographic zones: inner QCS, central QCS, outer QCS and TC. Our findings show that each zone has distinctive distributions and concentrations of natural and anthropogenic features (annotated), demonstrating the range and variability of processes shaping the seafloor in each zone. White dashed lines represent the boundary between these zones. Navy blue arrows show the dominant sediment transport direction as interpreted from seafloor geomorphology.
Discussion
Natural Geomorphology
Tidal Currents and Coastal Geometry
Tidal currents are known to play a major role in shaping the seafloor in the Cook Strait (Carter, 1992; Lewis et al., 1994). Elevated bed shear stresses related to strong tidal currents in the nearby Cook Strait are also regarded to represent a major forcing mechanism in the western Marlborough Sounds (Walters et al., 2010), and is therefore likely to strongly influence the seafloor geomorphology and grainsize distribution within QCS and TC. Modeled mean near-bottom current speeds are variable within the study area, with current speeds an order of magnitude higher in the outer QCS and TC compared to the inner and central QCS (Hadfield et al., 2014; Figure 1c). Our results show that deeper, more irregular seafloor morphology, larger modal grainsizes (sand to gravel) and higher intensity backscatter are signatures that are spatially correlated with higher mean current speeds (> 0.5 ms–1, Figure 1c), for example in the outer QCS seaward of the sill (Figures 6a–c) and the TC (Figures 10a,b). In the TC, high tidal velocities (> 2 ms–1) near the mouth of TC are spatially correlated with seabed scouring (Figure 10c) and have been suggested as a potential source of renewable energy using tidal turbines (Plew and Stevens, 2013). Regions with relatively low (< 0.1 ms–1) modeled mean near-bottom current speed are associated with relatively flat seafloor, smaller modal grainsizes (silt) and lower intensity backscatter (Figure 1c). For example, the inner QCS has relatively low modeled mean current speed (Figure 1c), and only minor evidence of current scour near the TC junction (Figure 11), indicating that strong tidal motions are not playing a major role in shaping the seafloor in the inner QCS. Results presented in our study from the outer QCS and TC suggest that the intensity of seafloor scouring, and the spatial distribution of larger modal grain-sizes in the QCS and TC is related, at least in part, to tidal currents from Cook Strait.
Across QCS and TC, the spatial distribution of erosional features related to tidal currents is strongly determined by the shoreline geometry. Patterns of scouring and moat development are consistent with other locations in the Marlborough Sounds (e.g., Pelorus Sound, Walters et al., 2010), showing that erosion is concentrated around headlands, channel bends and through narrow passages, and is likely related to tidal currents. In the TC, we suggest that the narrow and meandering shoreline intensifies localized seafloor erosion by tidal currents, resulting in a much deeper and more scoured central channel (Figures 10a,b). Scouring, high intensity backscatter and high modal grain-sizes (sand-gravel) are present throughout the entire TC, indicative of higher current energy, which is consistent with the distribution of elevated modeled current speeds (Figure 1c). Tidal currents, therefore, have a sustained influence along the entire TC, from the entrance to Cook Strait to the QCS channel junction (Figures 10a,b, 11). In the central QCS, even though modeled current speeds are lower (generally < 0.5 ms–1; Figure 1c) moats and scouring are mostly concentrated around headlands and through narrow passages, suggesting that the shoreline geometry locally intensifies the tidal flow (Figures 5a–c). We suggest that the complex coastal geometry characteristic of much of the Marlborough Sounds is causing localized intensification of tidal currents, which results in QCS and TC having notably contrasting morphologies. Patterns of seafloor erosion related to currents interacting with complex shoreline geometry is observed elsewhere in New Zealand and globally for example, the Narrows, Cook Strait (Carter, 1992; Lewis et al., 1994; Lamarche et al., 2011; Longhitano, 2018), Portland Bill, southern United Kingdom (Bastos et al., 2002), the Minas Passage, Bay of Fundy (Shaw et al., 2012), the San Juan Channel sand wave field in the San Juan Archipelago (Greene et al., 2017) and in Boundary Pass and Haro Strait in the Georgia Basin, on the Pacific margin of Canada (Barrie et al., 2005, 2009).
The outer QCS is characterized by strong tidal current velocities (Figure 1c), highly variable geomorphology, high intensity backscatter and large modal grainsizes (Figures 6a–c). Erosional features including moats, scours and troughs cumulatively make up 64 km2 (29%) of the total area in the outer QCS; however, the spatial distribution of scouring in this area is most pronounced where currents are redirected or restricted by coastal geometry and/or ridges (or structural highs; Figure 8). Submarine ridges that extend into Cook Strait from islands or headlands are approximately transverse to the modeled tidal current flow (Hadfield et al., 2014). Tidal flow peaks (∼1.53 ms–1 just above the seabed) at the north-eastern tip of the Marlborough Sounds due to the broad scale coastal geometry of the Cook Strait (Carter, 1992; Lewis et al., 1994). Although we cannot constrain the composition and formation of the submarine ridges with the current dataset, the high slope angle (> 30°), relative resistance to erosion, rocky morphology and high backscatter intensity suggest they are composed of consolidated rock. The submarine rocky ridges act to focus tidally induced bottom flows resulting in accelerated and more turbulent water motions. As a result, we observe seafloor scouring and development of sediment waves mirrored on both sides of the ridges, forming symmetrical sediment wave-scour-ridge-scour-sediment wave sequences (Figure 8). The scoured region adjacent to the ridge represents a zone of erosion, where the tidal flow is most constrained and strongest (Shaw et al., 2012). In the context of the outer QCS, the tidal flow over the ridge is constricted vertically (Figure 8), rather than related to narrowing of a coastal passage such as observed in TC. The scoured zone is bordered by sand-to-gravel sized substrates that comprise sand waves and dune fields and which indicate reduced current energy and bed shear stress. The entire sediment wave-scour-ridge sequence in the outer QCS extends ∼8 km in length (Figure 8), suggesting that flow strength varies substantially across this area, and that flow strength is strongly modified by bathymetric features, in this case the submarine ridges. This style of interaction between tides and geomorphology resulting in symmetrical erosion-depositional sequences is a common in modern tidal straits globally. For example, the entrance to San Francisco Bay (the Golden Gate), is confined horizontally by narrowing of strait to < 2 km causing scouring in the narrowest, most confined section of channel, with mirrored bedform formation where the straight widens (Barnard et al., 2006; Longhitano, 2013). The Messina Strait is confined horizontally between Sicily and mainland Italy, and vertically by elevated exposed bedrock in the center of the channel (Longhitano, 2018). This has resulted in a scour zone in the center of the straight, where the tidal current is the strongest, mirrored on both sides by depositional dune sequences that represent a down-current decrease in current speed. Symmetrical patterns related to tidal constriction are also observed in the adjacent Cook Strait to the east of the QCS and TC, where the strait narrows to 22 km (Lamarche et al., 2011; Longhitano, 2013).
Adjacent to the Cape Jackson coastline, on the north-western side of the outer QCS, a large bathymetric trough runs sub-parallel to the coast, incising the sill across the Cook Strait entrance to the outer QCS by up to 65 m (Figure 7a). As the mean current speed decreases landward (Figure 1c), we observe a change from an erosional regime within the Cape Jackson trough to a depositional regime at the southern end of the trough as indicated by the presence of barchanoid mega-ripples (Figure 7a). Barchanoid mega-ripples are well imaged by seafloor backscatter (Figure 7b), where coarser grained sediments (higher intensity backscatter) are deposited onto finer grained seafloor (low intensity backscatter). Submarine barchan dunes have been documented to occur in regions that are typically sand-starved (Todd, 2005; Daniell and Hughes, 2007; Todd et al., 2014) and have been documented in other continental shelf environments including Chignecto Bay and Scots Bay in the Bay of Fundy (Todd, 2005; Todd et al., 2014), and Georges Bank, off Cape Cod (Shaw et al., 2012; Todd and Valentine, 2012; Li et al., 2014). The southward orientation of the horns on the barchanoid mega-ripples indicates they are migrating southward across the sill in the outer QCS. The location of the sill is correlated with a sharp decrease in modeled current velocity (Figure 1c), suggesting that the sill may act as a physical barrier to tidal currents entering the QCS from Cook Strait (Figure 11).
Sedimentary Bedforms That Indicate Multidirectional Flow Over Multiple Time Scales
Sedimentary bedforms in the outer QCS region are composed of predominantly sand- to gravel-sized sediments, indicating that these sediment wave fields formed in a high-energy environment (Figures 6b,c; Allen, 1980; Belderson et al., 1982). Similar sized sand waves are also found in the central Cook Strait and at the entrance to Wellington Harbour (Carter, 1992; Carter and Lewis, 1995; Lamarche et al., 2011). The coarse modal grainsize likely contributes to the observed bedform morphologies as coarser grain-sizes typically form larger sediment waves (Van Landeghem et al., 2009).
In the outer QCS, bedform crests are linear to curvilinear in plan-view and are oriented predominantly NE-SW, irrespective of bedform size (since all bedforms are oriented from 87°- 140°). Sediment wave fields to the southeast of Cape Jackson display bilateral asymmetry across distances < 1 km, consistent with small-scale variations in current direction, and bedform formation under a range of transport directions (Figure 7c; Ashley, 1990). In other strongly tidal environments such as Scots Bay, Bay of Fundy, sediment wave fields that display bilateral asymmetry are correlated with the location of tidal gyres and eddies (Wu et al., 2011; Shaw et al., 2012; Todd et al., 2014). This suggests that sediment wave fields displaying bilateral asymmetry in the outer QCS may potentially represent sites where transient tidal eddies or gyres develop (e.g., Figure 7c).
Dunes with superimposed mega-ripples, such as those observed on both the north-western and eastern side of Arapawa Island in the outer QCS (Figures 9A,B), are a common feature in other shallow, nearshore and high-energy tidal environments (Jones and Traykovski, 2019). These sediment wave fields show a range of bedform sizes and morphologies, which likely reflect both spatial and temporal variations in current intensity and direction (Belderson et al., 1982). Modeling of the formation of superimposed bedforms in a unidirectional flow environment show ripples emerge first on the stoss slope of dunes, downstream from slight variations in slope, however, the formation mechanisms behind superimposed bedforms are not fully understood (Doré et al., 2016). Large dunes can also play a role in the development of small-scale turbulence resulting in moats or depressions at the tips of dune crests, as observed adjacent to the linear sand waves on the north-western side of Arapawa Island (Figure 9A), and similarly observed in the bedforms in the Bay of Fundy (Todd et al., 2014). The distinctive en echelon bedforms on the eastern side of Arapawa Island (Figure 9B) comprise large asymmetrical, interwoven dunes decreasing in size to the east, with superimposed small symmetrical mega-ripples. The braided nature of the dunes may reflect oblique dune migration with the larger dunes representing the more persistent hydrodynamic conditions, and the smaller superimposed mega-ripples resulting from small-scale turbulence due to current interactions with local bathymetry (Lo Iacono et al., 2020). Belderson et al. (1982) suggests that the presence of superimposed mega-ripples reflects active sediment transport, that when persisting result in the establishment of larger dunes. Alternatively, the smaller mega-ripples may reflect mean energy environment, with larger dunes forming during higher energy flooding events (Allen and Collinson, 1974) or by paleo-hydrodynamic conditions (Manighetti and Carter, 1999).
As superimposed bedforms develop across dunes, they deteriorate the dune and slow its growth (Doré et al., 2016; Jones and Traykovski, 2019). In general, larger bedforms are suggested to be temporally more stable and migrate slower compared to superimposed bedforms which may exhibit daily to weekly changes (Allen, 1976; Ashley, 1990; Ikehara, 1998). We suggest the nature of tidal flow in the outer QCS, with the addition of complex seabed bathymetry, results in complex morpho-sedimentary patterns that likely develop over multiple timescales. The stable larger sand waves and dunes reflect either longer (months to years) term growth or development under less common higher energy events, while the superimposed mega-ripples reflect shorter timescale (tidal cycles to days) timescale involving more active sediment transport (Figures 9A,B). Constraining the spatial and temporal migration and development of the sediment waves, dunes and mega-ripples in the outer QCS could be achieved with repeat multibeam mapping surveys.
Pockmarks
Pockmarks represent sites of fluid escape on the seafloor and are common in a variety of geologic settings, from shallow marine to deep ocean across a range of latitudes (Hovland and Judd, 1988; Judd and Hovland, 2009). In the QCS and TC, the distinction between large pockmarks (> 1000 m2), that are found mostly adjacent to the coast, and small pockmarks (< 1000 m2), that are found within the flat regions within the embayments and central channel, suggests there may be multiple sources of fluid escape and that large and small pockmarks may be caused by different mechanisms. Analogous to pockmark formation in other shallow marine environments globally, we suggest that the pockmarks within the QCS and TC are most likely to be related to seepage of shallow subsurface gas related to biogenic or thermogenic reduction of organic matter (e.g., Scanlon and Knebel, 1989; Hovland et al., 1992; Fleischer et al., 2001; Rogers et al., 2006) and/or freshwater expulsion from subsurface springs or groundwater aquifers (e.g., Whiticar and Werner, 1981; Whiticar, 2002). The preservation of pockmarks structures on the seafloor in the QCS and TC may be related in part to regions characterized by low bed shear stress and low sediment deposition as pockmarks are typically preserved under low sedimentation conditions (Schattner et al., 2016). Therefore, the observed concentration of pockmarks in the inner and central QCS compared to the outer QCS and TC (Figure 11), could be related to differences in sediment transport and depositional regimes.
The pockmarks observed in the QCS and TC could be active, transient or reflect relict fluid seepage. However, it is likely that the larger, more defined pockmarks represent more sustained fluid flow from established fluid conduits, possibly related to groundwater seepage, whereas the smaller pockmarks may represent transient or isolated fluid expulsion, such as shallow subsurface gas. Analysis of water column backscatter over the pockmarks, combined with additional acoustic surveys to image the shallow subsurface, and geochemical analysis of water samples and/or near-surface sediments are required to better constrain pockmark activity and the origins of fluids forming the pockmarks in the QCS and TC. Determining areas of active gas or groundwater seepage may have implications for the distribution of benthic habitats and ecology in the QCS and TC (e.g., Miller and Ullman, 2004; Ingrassia et al., 2015).
The Anthropogenic Footprint
Globally, there is a trend toward elevated anthropogenic influence in coastal and shallow marine environments due to higher populations living on or near the coast (Small and Nicholls, 2003). Land use changes, and coastal and marine human activities in the Marlborough Sounds region have shown to have a measurable influence on the shoreline geomorphology (Parnell et al., 2007), nearshore and sub-tidal sedimentation (Lauder, 1987; Handley et al., 2020), increase suspended sediment concentrations (Coker et al., 1993), decrease/degrade water quality (Fahey and Coker, 1992) and modify benthic habitats (Greene et al., 2013).
The Physical Human Footprint
The present study represents the first to measure and quantify the physical anthropogenic footprint on the seafloor within the QCS and TC using 2-m resolution multibeam bathymetry. These data provide the complete spatial information necessary to measure the extent of the physical human footprint from the land-water interface to ∼350 m water depth and provide a baseline from which we can assess temporal changes to measure the rates of anthropogenic influence. Our results show that the physical anthropogenic footprint in the QCS and TC extends from the shoreline to hundreds of meters water depth is unevenly distributed (Figure 11), and includes marine infrastructure (marine farms, cables/pipelines and wharves; Figures 4B,D,E), and impacts from maritime activities (mooring blocks, anchor drag marks, and shipwrecks; Figures 4A,C,F). The greater extent of anthropogenic influence in the inner QCS (∼6% of the seafloor) is most likely to be related to the high population near the coast in the inner QCS, centered on the township of Picton, and the presence of the Picton and Waikawa ports (Figure 2a). Furthermore, the inner QCS is characterized by relatively low influence from tidal currents (Figure 1c) with only very minor evidence of scouring, suggesting that human-induced seafloor disturbance may be better preserved in this part of the sounds compared to other higher energy environments (e.g., outer QCS). However, we expect that the true spatial extent of physical disturbance related to anthropogenic activities is likely to be even more extensive than estimated in this study as the physical anthropogenic footprint measured using the multibeam bathymetric data only captures seabed features observable in the 2 m resolution data (i.e., > 2 × 2 pixels or 4 × 4 m). Furthermore, the extent of anthropogenic influence on shallow marine zones extends well beyond physical disturbance to the seabed, and can include chemical pollution (Aksu et al., 1998; Coskun et al., 2016), marine litter (Ramirez-Llodra et al., 2013), changes in sedimentation (Kerner, 2007; Anthony et al., 2014; Paradis et al., 2018) and to the composition of sediments (Syvitski et al., 2005), and modifications and eradication of benthic habitats (Erftemeijer and Lewis, 2006; Bracchi et al., 2016; Lastras et al., 2016; Ribó et al., in review). Further research assessing the impact of human activities beyond the physical footprint (e.g., chemical, and biological) is necessary to fully understand the influence humans are having in the shallow marine realm.
Seabed Disturbance Related to Maritime Activities
Maritime activities (anchor drag marks, mooring blocks, and shipwrecks; Figures 4A,C,F) make up ∼72% of the total anthropogenic footprint in QCS and TC, with anchor drag marks making up almost half the entire anthropogenic footprint observed (47.5%; Figure 4G). Anchor drag marks are a common feature adjacent to ports globally and can excavate the seabed by up to 0.5 m, enough to destroy benthic soft sediment habitats and potentially put at risk other seafloor infrastructure such as cables and pipelines (Coskun et al., 2016; Davis et al., 2016; Tawekal et al., 2017). The extent and implications of periodic seabed disturbance and excavation by anchor drag is not well understood generally (Davis et al., 2016) and has not been investigated in the QCS and TC. However, seafloor excavation by dredging has been shown to result in deterioration of the seabed by modifying the morphology, changing hydrodynamics patterns, changing salinity stratification and elevated sediment resuspension (Newell et al., 1998; Van Maren et al., 2015; Davis et al., 2016; Fogarin et al., 2019). The dramatic increases in global marine traffic since the 1990s (Tournadre, 2014) with trends of growth predicted in the coming decades (Davis et al., 2016; Moore et al., 2018), may mean that seafloor disruption by anchor dragging becomes a major concern for marine habitats and therefore ecosystem health for shallow marine regions like QCS and TC.
Seafloor disturbance related to mooring block makes up 24% of the total area affected by anthropogenic activities (Figure 4G). Artificial hard structures such as mooring blocks form artificial reef and may provide suitable habitat for benthic communities to colonize (Bulleri and Chapman, 2010), which can increase habitat heterogeneity and biodiversity. However artificial hard structures may also promote settlement of non-native species (Glasby et al., 2007) and lead to a degradation of benthic flora, such as loss and degradation of seagrass (Hastings et al., 1995; Demers et al., 2013).
Marine Infrastructure
The urbanization of the coastal zone has resulted in increasing coastal and marine infrastructure, including all anthropogenic structures or features placed into the nearshore or marine environment (Bulleri and Chapman, 2010). Coastal and marine infrastructure has been shown to modify local sediment transport trends, spatial patterns of sediment grain-sizes distribution (Villatoro Lacouture, 2010; Fogarin et al., 2019), and focus current energy, enhancing scouring around submarine structures (Whitehouse et al., 2011). Marine farm structures have been shown to also modify local current speeds and vertical mixing of the water column (Plew et al., 2005), and have had measurable impacts on sediment enrichment and nutrient concentrations in the QCS and TC (Plew, 2019).
In the QCS and TC, we show that marine infrastructure represents almost a third of the anthropogenic footprint (28%; Figure 4G) and includes wharves (3.6%), cables/pipelines (13.8%) and marine farms (11%). Data presented in this study reveal the range of environments in QCS and TC that host existing marine infrastructure (e.g., wharves and marine farms; Figures 4B,D) and others that could present possible sites for future development of marine infrastructure (e.g., tidal turbines in TC and Cook Strait (Huckerby et al., 2008; Plew and Stevens, 2013). Comprehensive and high-resolution mapping, geological sampling and geomorphological analyses, such as those presented in this study, are a critical first step for offshore infrastructure planning, site surveys and to sustainably manage the long-term integrity of offshore structures (Matutano et al., 2013; Nielsen et al., 2013). For example, sediment waves such as those observed in the outer QCS, if active, could be hazards due to their migration and dynamic changes that may have not been accounted for in their design life of human-made structures (Barrie et al., 2005; Whitehouse et al., 2011; Todd et al., 2014).
Conclusion
Collection and analysis of high resolution multibeam bathymetry and backscatter data, complemented by seabed sediment samples reveal the first complete map of the QCS and TC from the land-water interface to ∼350 m water depth. Using these data, we are able to locate, describe and characterize the range of natural and anthropogenic features on the seafloor. These findings provide a measure/proxy of the dominant processes shaping the seafloor in the QCS and TC, including strong tidal currents, seafloor fluid expulsion, and a range of anthropogenic activities (Figure 11).
Tidal currents have a strong influence on sediment grain-size distributions as well as the erosion, transport and deposition of sediments across the entire study area. Patterns of seafloor scouring and depositional bedforms morphology suggest that the irregular shoreline geometry and bathymetric barriers intensify or redirect tidal flow, leading to localized variations in current strength and direction (Figure 11). In the outer QCS, the range of sedimentary bedform sizes and morphologies indicate formation under multi-directional flows that vary across a spatial and temporal scales. The depth of the QCS and TC and paleo-sea level estimates for the greater Cook Strait region suggest that the modern seafloor geomorphologies must have developed since the flooding of the river valley to form the QCS. However, the sill at the mouth of the QCS may be related to a period of high sediment supply and widespread deposition during the last sea-level low stand (∼18 ka).
Pockmarks are highly concentrated in the inner and central QCS (Figure 11). Although their activity and origins remain ambiguous, the two distinct types of pockmarks observed in this study may indicate multiple origins for fluid seepage, possibly related to shallow subsurface gas and/or freshwater seepage.
The anthropogenic footprint in the QCS and TC is most prominent in the inner QCS, where it covers 6% of the seafloor (Figure 11). In general, anthropogenic footprints on the seafloor are mostly related to maritime activities including anchor drag and mooring blocks. The rate of recovery of the seafloor from anthropogenic disturbance is not documented for the QCS and TC.
Our study demonstrates the benefits of a comprehensive hydrographic survey programme within a specific coastal system that reveals the entire seascape to the land-water interface. Results presented in this study provide an important baseline for future research in the Marlborough Sounds, including classification and validation of seafloor backscatter, improved benthic habitat mapping and habitat suitability maps (Ribó et al., in review), hydrodynamical modeling, assessment of the temporal migration of sedimentary bedforms, understanding the origins of pockmarks and measuring the full extent of and recovery from anthropogenic activities.
Data Availability Statement
Publicly available datasets were analyzed in this study. This data can be found here: https://marlborough.maps.arcgis.com/apps/MapSeries/index.html?appid=155a89b0beb74035bd1c4c71f 6f36646.
Author Contributions
TK: HS51 data collection, processing, and report writing. GL and AO: scientific development, preparation writing and editing of report and journal manuscript. KM, AP, and SW: HS51 survey design, data collection, processing, and report writing. HN: HS51 project lead, survey design, data collection, processing, and report writing. SN: report writing and editing of journal manuscript. MR and LS: scientific development, writing and editing of journal manuscript. SJW: data analysis, scientific evelopment writing and editing of journal manuscript. All authors contributed to the article and approved the submitted version.
Conflict of Interest
The authors declare that the research was conducted in the absence of any commercial or financial relationships that could be construed as a potential conflict of interest.
Funding
Funding for NIWA staff came from the Ministry of Business, Innovation, and Employment (MBIE) Strategic Science Investment Fund (SSIF) Marine Geological Processes Programme of the NIWA Coasts and Oceans Centre. MR was funded by the University of Auckland Faculty of Science Faculty Research Development Fund (FRDF) in the frame of the Evaluating Suspended Sediment Impacts on Benthic Ecosystems project (project number 3719981; LS).
Acknowledgments
We would like to thank the people and businesses of Picton and the Queen Charlotte Sound region for embracing us within your community over a year-long field campaign to collect the HS51 dataset. We acknowledge Te Atiawa o Te Waka-a-Māui, Department of Conservation (DoC) and community members of the Marine Mammal Liaison Group; as well as Land Information New Zealand (LINZ) and Marlborough District Council (MDC). We would like to acknowledge the field survey personnel from DML, National Institute of Water and Atmospheric Research (NIWA) that assisted with of data collection for HS51. We would also like to thank the journal editor and the two reviewers whose constructive feedback helped to improve and clarify this manuscript.
Supplementary Material
The Supplementary Material for this article can be found online at: https://www.frontiersin.org/articles/10.3389/fmars.2020.579626/full#supplementary-material
References
Aksu, A. E., Yasar, D., and Orhan, U. (1998). Assessment of marine pollution in Izmir Bay: Heavy metal and organic compound concentrations in surficial sediments. Turk. J. Eng. Environ. Sci. 22, 387–416.
Allen, J. R. L. (1976). Bed forms and unsteady processes: Some concepts of classification and response illustrated by common one-way types. Earth Surf. Process. 1, 361–374. doi: 10.1002/esp.3290010405
Allen, J. R. L. (1980). Sand waves: a model of origin and internal structure. Sediment. Geol. 26, 281–328. doi: 10.1016/0037-0738(80)90022-6
Allen, J. R. L., and Collinson, J. D. (1974). The superimposition and classification of dunes formed by unidirectional aqueous flows. Sediment. Geol. 12, 169–178. doi: 10.1016/0037-0738(74)90008-6
Alomar, C., Estarellas, F., and Deudero, S. (2016). Microplastics in the Mediterranean Sea: deposition in coastal shallow sediments, spatial variation and preferential grain size. Mar. Environ. Res. 115, 1–10. doi: 10.1016/j.marenvres.2016.01.005
Anthony, E. J., Marriner, N., and Morhange, C. (2014). Human influence and the changing geomorphology of Mediterranean deltas and coasts over the last 6000years: from progradation to destruction phase? Earth Sci. Rev. 139, 336–361. doi: 10.1016/j.earscirev.2014.10.003
Ashley, G. M. (1990). Classification of large-scale subaqueous bedforms; a new look at an old problem. J. Sediment. Res. 60, 160–172.
Barnard, P. L., Hanes, D. M., Rubin, D. M., and Kvitek, R. G. (2006). Giant sand waves at the mouth of San Francisco bay. Eos Trans. Am. Geophys. Union 87, 285–289. doi: 10.1029/2006eo290003
Barrie, J. V., Conway, K. W., Picard, K., and Greene, H. G. (2009). Large-scale sedimentary bedforms and sediment dynamics on a glaciated tectonic continental shelf: examples from the Pacific margin of Canada. Cont. Shelf Res. 29, 796–806. doi: 10.1016/j.csr.2008.12.007
Barrie, J. V., Hill, P. R., Conway, K. W., Iwanowska, K., and Picard, K. (2005). Environmental Marine Geoscience 4. Georgia Basin: seabed features and marine geohazards. Geosci. Can 32, 145–156.
Bastos, A. C., Kenyon, N. H., and Collins, M. (2002). Sedimentary processes, bedforms and facies, associated with a coastal headland: Portland Bill, Southern UK. Mar. Geol. 187, 235–258. doi: 10.1016/s0025-3227(02)00380-8
Beck, A. C. (1964). Geological map of New Zealand 1:250,000 Sheet 14 Marlborough Sounds. Wellington: Department of Scientific and Industrial Research.
Begg, J. G., and Johnston, M. R. (2000). “Geology of the Wellington area. 1:250 000,” in Institute of Geological & Nuclear Sciences Geological Map, Vol. 10, (Lower Hutt: Institute of Geological & Nuclear Sciences).
Belderson, R. H., Johnson, M. A., and Kenyon, N. H. (1982). Bedforms. In Offshore Tidal Sands: Processes and Deposits. Dordrecht: Springer, 27–55.
Bosman, A., Casalbore, D., Anzidei, M., Muccini, F., Carmisciano, C., and Francesco Latino, C. (2015). The first ultra-high resolution digital terrain model of the shallow-water sector around Lipari Island (Aeolian Islands, Italy). Ann. Geophys 58, 1–11. doi: 10.1016/j.jmarsys.2013.10.001
Bowman, M. J., Kibblewhite, A. C., and Ash, D. E. (1980). M 2 tidal effects in greater Cook Strait. New Zealand. J. Geophys. Res. Oceans 85, 2728–2742. doi: 10.1029/jc085ic05p02728
Bracchi, V. A., Marchese, F., Savini, A., Chimienti, G., Mastrototaro, F., Tessarolo, C., et al. (2016). Seafloor integrity of the Mar Piccolo Basin (Southern Italy): quantifying anthropogenic impact. J. Maps 12, 1–11. doi: 10.1080/17445647.2016.1152920
Brown, C. J., Todd, B. J., Kostylev, V. E., and Pickrill, R. A. (2011). Image-based classification of multibeam sonar backscatter data for objective surficial sediment mapping of Georges Bank. Canada. Cont. Shelf Res. 31, S110–S119.
Brown, L. J., and Lj, B. (1981). Water Well Data Northern Malborough. Lower Hutt: NZ Geological Survey.
Buhl-Mortensen, L., and Buhl-Mortensen, P. (2017). Marine litter in the Nordic Seas: distribution composition and abundance. Mar. Pollut. Bull. 125, 260–270. doi: 10.1016/j.marpolbul.2017.08.048
Bulleri, F., and Chapman, M. G. (2010). The introduction of coastal infrastructure as a driver of change in marine environments. J. Appl. Ecol. 47, 26–35. doi: 10.1111/j.1365-2664.2009.01751.x
Carminatto, A. A., Rotundo, M. M., Butturi-Gomes, D., Barrella, W., and Junior, M. P. (2020). Effects of habitat complexity and temporal variation in rocky reef fish communities in the Santos estuary (SP). Brazil. Ecol. Indic. 108:105728. doi: 10.1016/j.ecolind.2019.105728
Carter, L. (1992). Acoustical characterisation of seafloor sediments and its relationship to active sedimentary processes in Cook Strait, New Zealand. N.Z. J. Geol. Geophys. 35, 289–300. doi: 10.1080/00288306.1992.9514522
Carter, L., and Lewis, K. (1995). Variability of the modern sand cover on a tide and storm driven inner shelf, south Wellington, New Zealand. N.Z. J. Geol. Geophys. 38, 451–470. doi: 10.1080/00288306.1995.9514671
Coker, R. J., Fahey, B. D., and Payne, J. J. (1993). Fine sediment production from truck traffic, queen charlotte forest, marlborough sounds, New Zealand. J. Hydrol. N. Z 31, 56–64.
Coskun, S., Dondurur, D., Cifci, G., Aydemir, A., and Drahor, M. G. (2016). Natural and anthropogenic submarine morphologies revealed by high resolution acoustic data in the Gulf of Izmir, western Turkey. Mar. Pet. Geol. 71, 211–224. doi: 10.1016/j.marpetgeo.2015.12.012
Cotton, C. A., and Collins, B. W. (1974). Bold Coasts: Annotated Reprints of Selected Papers on Coastal Geomorphology. Ithaca, NY: Cornell University.
Courrat, A., Lobry, J., Nicolas, D., Laffargue, P., Amara, R., Lepage, M., et al. (2009). Anthropogenic disturbance on nursery function of estuarine areas for marine species. Estuar. Coast. Shelf Sci. 81, 179–190. doi: 10.1016/j.ecss.2008.10.017
Daniell, J. J., and Hughes, M. (2007). The morphology of barchan-shaped sand banks from western Torres Strait, northern Australia. Sediment. Geol. 202, 638–652. doi: 10.1016/j.sedgeo.2007.07.007
Davidson, R. J., and Richards, L. A. (2015). Significant Marine Site Survey and Monitoring Programme: Summary 2014-2015. Blenheim: Marlborough District Council.
Davis, A. R., Broad, A., Gullett, W., Reveley, J., Steele, C., and Schofield, C. (2016). Anchors away? The impacts of anchor scour by ocean-going vessels and potential response options. Mar. Policy 73, 1–7. doi: 10.1016/j.marpol.2016.07.021
Demers, M.-C. A., Davis, A. R., and Knott, N. A. (2013). A comparison of the impact of ‘seagrass-friendly’boat mooring systems on Posidonia australis. Mar. Environ. Res. 83, 54–62. doi: 10.1016/j.marenvres.2012.10.010
Doré, A., Bonneton, P., Marieu, V., and Garlan, T. (2016). Numerical modeling of subaqueous sand dune morphodynamics. J. Geophys. Res. Earth Surf. 121, 565–587. doi: 10.1002/2015jf003689
Erftemeijer, P. L., and Lewis, R. R. R. I. I. I. (2006). Environmental impacts of dredging on seagrasses: a review. Mar. Pollut. Bull. 52, 1553–1572. doi: 10.1016/j.marpolbul.2006.09.006
Ernstsen, V. B., Noormets, R., Winter, C., Hebbeln, D., Bartholomä, A., Flemming, B. W., et al. (2005). Development of subaqueous barchanoid-shaped dunes due to lateral grain size variability in a tidal inlet channel of the Danish Wadden Sea. J. Geophys. Res. Earth Surf 110, F04S08.
Fahey, B. D., and Coker, R. J. (1992). Sediment production from forest roads in Queen Charlotte Forest and potential impact on marine water quality, Marlborough Sounds, New Zealand. N.Z. J. Mar. Freshw. Res. 26, 187–195. doi: 10.1080/00288330.1992.9516514
Fleischer, P., Orsi, T., Richardson, M., and Anderson, A. (2001). Distribution of free gas in marine sediments: a global overview. Geo-Mar. Lett. 21, 103–122. doi: 10.1007/s003670100072
Fogarin, S., Madricardo, F., Zaggia, L., Sigovini, M., Montereale-Gavazzi, G., Kruss, A., et al. (2019). Tidal inlets in the Anthropocene: geomorphology and benthic habitats of the Chioggia inlet, Venice Lagoon (Italy). Earth Surf. Process. Landf‘ 44, 2297–2315. doi: 10.1002/esp.4642
Gillespie, J. L., Nelson, C. S., and Nodder, S. D. (1998). Post-glacial sea-level control and sequence stratigraphy of carbonate–terrigenous sediments, Wanganui shelf, New Zealand. Sediment. Geol. 122, 245–266. doi: 10.1016/s0037-0738(98)00109-2
Glasby, T. M., Connell, S. D., Holloway, M. G., and Hewitt, C. L. (2007). Nonindigenous biota on artificial structures: could habitat creation facilitate biological invasions? Mar. Biol. 151, 887–895. doi: 10.1007/s00227-006-0552-5
Goff, J. R., and Chagué-Goff, C. (1999). A late Holocene record of environmental changes from coastal wetlands: abel tasman national park, New Zealand. Quat. Int. 56, 39–51. doi: 10.1016/s1040-6182(98)00016-0
Gray, J. S. (1997). Marine biodiversity: patterns, threats and conservation needs. Biodivers. Conserv. 6, 153–175.
Greene, H. G., Cacchione, D. A., and Hampton, M. A. (2017). Characteristics and dynamics of a large sub-tidal sand wave field—habitat for Pacific sand lance (Ammodytes personatus), Salish Sea, Washington, USA. Geosciences 7:107. doi: 10.3390/geosciences7040107
Greene, H. G., Endris, C., Vallier, T., Golden, N., Cross, J., Ryan, H., et al. (2013). Sub-tidal benthic habitats of central San Francisco Bay and offshore Golden Gate area — A review. Mar. Geol. 345, 31–46. doi: 10.1016/j.margeo.2013.05.001
Hadfield, M., Broekhuizen, N., and Plew, D. (2014). A biophysical model for the Marlborough Sounds: Queen Charlotte Sound and Tory Channel. Christchurch, NY: NIWA.
Handley, S. (2016). History of benthic change in Queen Charlotte Sound/Tōtaranui, Marlborough. Prepared for Marlborough District Council. Peter Hamil: NIWA. NIWA Client Report No. NEL2015-018.
Handley, S. J., Swales, A., Horrocks, M., Gibbs, M., Carter, M., Ovenden, R., et al. (2020). Historic and contemporary anthropogenic effects on granulometry and species composition detected from sediment cores and death assemblages, Nelson Bays, Aotearoa-New Zealand. Cont. Shelf Res. 202:104147. doi: 10.1016/j.csr.2020.104147
Harris, P. T. (2020). Anthropogenic threats to benthic habitats. In Seafloor Geomorphology as Benthic Habitat. Amsterdam: Elsevier, 35–61.
Harris, T. F. W. (1990). Greater Cook Strait: form and flow. Wellington, NZ: DSIR Marine and Freshwater.
Hastings, K., Hesp, P., and Kendrick, G. A. (1995). Seagrass loss associated with boat moorings at Rottnest Island, Western Australia. Ocean Coast. Manag. 26, 225–246. doi: 10.1016/0964-5691(95)00012-q
Heath, R. A. (1974). Physical oceanographic observations in Marlborough Sounds. N.Z. J. Mar. Freshw. Res. 8, 691–708. doi: 10.1080/00288330.1974.9515538
Hovland, M., and Judd, A. G. (1988). ). Seabed Pockmarks and Seepages: Ispact on Geology, Biology a. the Marine Environment. London: Graham.
Hovland, M., Judd, A. G., and Burke, R. A. (1992). The global production of methane from shallow submarine sources. Cont. Shelf Res. 12, 1231–1238. doi: 10.1016/0278-4343(92)90082-u
Huckerby, J. A., Johnson, D., and Nobs Line, N. P. (2008). “New Zealand’s wave and tidal energy resources and their timetable for development,” in Proceedings of the International Conference on Ocean Energy (ICOE), Brest, 15–17.
Ierodiaconou, D., Schimel, A. C. G., Kennedy, D., Monk, J., Gaylard, G., Young, M., et al. (2018). Combining pixel and object based image analysis of ultra-high resolution multibeam bathymetry and backscatter for habitat mapping in shallow marine waters. Mar. Geophys. Res. 39, 271–288. doi: 10.1007/s11001-017-9338-z
Ikehara, K. (1998). Sequence stratigraphy of tidal sand bodies in the Bungo Channel, southwest Japan. Sediment. Geol. 122, 233–244. doi: 10.1016/s0037-0738(98)00108-0
Ingrassia, M., Martorelli, E., Bosman, A., Macelloni, L., Sposato, A., and Chiocci, F. L. (2015). The zannone giant pockmark: first evidence of a giant complex seeping structure in shallow-water, central Mediterranean Sea, Italy. Mar. Geol. 363, 38–51. doi: 10.1016/j.margeo.2015.02.005
Jarvis, R. M., and Young, T. (2019). Key research priorities for the future of marine science in New Zealand. Mar. Policy 106:103539. doi: 10.1016/j.marpol.2019.103539
Jones, K. R., and Traykovski, P. (2019). Interaction of superimposed megaripples and dunes in a tidally energetic environment. J. Coast. Res. 35, 948–958. doi: 10.2112/jcoastres-d-18-00084.1
Judd, A., and Hovland, M. (2009). Seabed Fluid Flow: The Impact on Geology, Biology and the Marine Environment. Cambridge: Cambridge University Press.
Kerner, M. (2007). Effects of deepening the Elbe Estuary on sediment regime and water quality. Estuar. Coast. Shelf Sci. 75, 492–500. doi: 10.1016/j.ecss.2007.05.033
Lamarche, G., Lurton, X., Verdier, A.-L., and Augustin, J.-M. (2011). Quantitative characterisation of seafloor substrate and bedforms using advanced processing of multibeam backscatter—Application to Cook Strait, New Zealand. Cont. Shelf Res. 31, S93–S109.
Langridge, R. M., Ries, W. F., Litchfield, N. J., Villamor, P., Van Dissen, R. J., Barrell, D. J. A., et al. (2016). The New Zealand active faults database. N.Z. J. Geol. Geophys. 59, 86–96. doi: 10.1080/00288306.2015.1112818
Lastras, G., Canals, M., Ballesteros, E., Gili, J.-M., and Sanchez-Vidal, A. (2016). Cold-water corals and anthropogenic impacts in La Fonera submarine Canyon head, northwestern mediterranean sea. PLoS One 11:e0155729. doi: 10.1371/journal.pone.0155729
Lauder, G. A. (1987). Coastal Landforms and Sediments of the Marlborough Sounds. Christchurch: University of Canterbury.
Lauder, W. R. (1970). The ancient drainage of the Marlborough Sounds. N.Z. J. Geol. Geophys. 13, 747–749. doi: 10.1080/00288306.1970.10431351
Lewis, K. B., Carter, L., and Davey, F. J. (1994). The opening of Cook Strait: Interglacial tidal scour and aligning basins at a subduction to transform plate edge. Mar. Geol. 116, 293–312. doi: 10.1016/0025-3227(94)90047-7
Li, M. Z., Shaw, J., Todd, B. J., Kostylev, V. E., and Wu, Y. (2014). Sediment transport and development of banner banks and sandwaves in an extreme tidal system: upper Bay of Fundy, Canada. Cont. Shelf Res. 83, 86–107. doi: 10.1016/j.csr.2013.08.007
Lo Iacono, C., Guillén, J., Guerrero, Q., Durán, R., Wardell, C., Hall, R. A., et al. (2020). Bidirectional bedform fields at the head of a submarine canyon (NE Atlantic). Earth Planet. Sci. Lett. 542:116321. doi: 10.1016/j.epsl.2020.116321
Longhitano, S. G. (2013). A facies-based depositional model for ancient and modern, tectonically–confined tidal straits. Terra Nova 25, 446–452. doi: 10.1111/ter.12055
Longhitano, S. G. (2018). Between Scylla and Charybdis (part 1): the sedimentary dynamics of the modern Messina Strait (central Mediterranean) as analogue to interpret the past. Earth Sci. Rev. 185, 259–287. doi: 10.1016/j.earscirev.2018.06.008
Lucieer, V., and Lamarche, G. (2011). Unsupervised fuzzy classification and object-based image analysis of multibeam data to map deep water substrates, Cook Strait, New Zealand. Cont. Shelf Res. 31, 1236–1247. doi: 10.1016/j.csr.2011.04.016
Lurton, X. (2002). An Introduction to Underwater Acoustics: Principles and Applications. Berlin: Springer Science & Business Media.
Madricardo, F., Foglini, F., Campiani, E., Grande, V., Catenacci, E., Petrizzo, A., et al. (2019). Assessing the human footprint on the sea-floor of coastal systems: the case of the Venice Lagoon. Italy. Sci. Rep. 9, 1–13.
Manighetti, B., and Carter, L. (1999). Across-shelf sediment dispersal, Hauraki Gulf, New Zealand. Mar. Geol. 160, 271–300. doi: 10.1016/s0025-3227(99)00024-9
Matutano, C., Negro, V., López-Gutiérrez, J.-S., and Esteban, M. D. (2013). Scour prediction and scour protections in offshore wind farms. Renew. Energy 57, 358–365. doi: 10.1016/j.renene.2013.01.048
Mayer, L., Jakobsson, M., Allen, G., Dorschel, B., Falconer, R., Ferrini, V., et al. (2018). The Nippon foundation—GEBCO seabed 2030 project: the quest to see the world’s oceans completely mapped by 2030. Geosciences 8:63. doi: 10.3390/geosciences8020063
McGonigle, C., and Collier, J. S. (2014). Interlinking backscatter, grain size and benthic community structure. Estuar. Coast. Shelf Sci. 147, 123–136. doi: 10.1016/j.ecss.2014.05.025
Micallef, A., Le Bas, T. P., Huvenne, V. A. I., Blondel, P., Hühnerbach, V., and Deidun, A. (2012). A multi-method approach for benthic habitat mapping of shallow coastal areas with high-resolution multibeam data. Cont. Shelf Res. 3, 14–26. doi: 10.1016/j.csr.2012.03.008
Miller, D. C., and Ullman, W. J. (2004). Ecological Consequences of Ground Water Discharge to Delaware Bay, United States. Groundwater 42, 959–970. doi: 10.1111/j.1745-6584.2004.tb02635.x
Milliman, J. D., and Farnsworth, K. L. (2013). River Discharge to the Coastal Ocean: A Global Synthesis. Cambridge: Cambridge University Press.
Mitchell, J. S. (1996). Cook Strait bathymetry, 3rd edition. Chart, Coastal Series, 1:200 000. Christchurch: New Zealand Oceanographic Institute.
Moore, T. J., Redfern, J. V., Carver, M., Hastings, S., Adams, J. D., and Silber, G. K. (2018). Exploring ship traffic variability off California. Ocean Coast. Manag. 163, 515–527. doi: 10.1016/j.ocecoaman.2018.03.010
Neil, H., Mackay, K., Wilcox, S., Kane, T., Lamarche, G., Wallen, B., et al. (2018). What lies beneath? Guide to Survey Results and Graphical Portfolio, Queen Charlotte Sound/Tōtaranui and Tory Channel/Kura Te Au (HS51) Survey (NIWA). NIWA Client Report No. 2018085WN. Christchurch: New Zealand Oceanographic Institute
Newell, R. C., Seiderer, L. J., and Hitchcock, D. R. (1998). The impact of dredging works in coastal waters: a review of the sensitivity to disturbance and subsequent recovery of biological resources on the sea bed. Oceanogr. Mar. Biol. Annu. Rev. 36, 127–178.
Nicol, A. (2011). Landscape history of the Marlborough sounds, New Zealand. N.Z. J. Geol. Geophys. 54, 195–208. doi: 10.1080/00288306.2010.523079
Nicol, A., and Campbell, J. K. (1990). Late Cenozoic thrust tectonics, Picton, New Zealand. N.Z. J. Geol. Geophys. 33, 485–494. doi: 10.1080/00288306.1990.10425703
Nielsen, A. W., Liu, X., Sumer, B. M., and Fredsøe, J. (2013). Flow and bed shear stresses in scour protections around a pile in a current. Coast. Eng. 72, 20–38. doi: 10.1016/j.coastaleng.2012.09.001
Nodder, S. D. (1995). Late quaternary transgressive/regressive sequences from Taranaki continental shelf, western New Zealand. Mar. Geol. 123, 187–214. doi: 10.1016/0025-3227(95)00004-i
Paradis, S., Puig, P., Masqué, P., Juan-Díaz, X., Martín, J., and Palanques, A. (2017). Bottom-trawling along submarine canyons impacts deep sedimentary regimes. Sci. Rep. 7:43332.
Paradis, S., Puig, P., Sanchez-Vidal, A., Masqué, P., Garcia-Orellana, J., Calafat, A., et al. (2018). Spatial distribution of sedimentation-rate increases in Blanes Canyon caused by technification of bottom trawling fleet. Prog. Oceanogr. 169, 241–252. doi: 10.1016/j.pocean.2018.07.001
Parnell, K. E., McDonald, S. C., and Burke, A. E. (2007). Shoreline effects of vessel wakes, Marlborough sounds, New Zealand. J. Coast. Res 50, 502–506.
Pickrill, R. A., and Todd, B. J. (2003). The multiple roles of acoustic mapping in integrated ocean management, Canadian Atlantic continental margin. Ocean Coast. Manag. 46, 601–614. doi: 10.1016/s0964-5691(03)00037-1
Plew, D. R. (2019). Investigating benthic impacts at salmon farms using eddy covariance measurements of benthic oxygen fluxes. Aquac. Environ. Interact. 11, 337–357. doi: 10.3354/aei00317
Plew, D. R., and Stevens, C. L. (2013). Numerical modelling of the effect of turbines on currents in a tidal channel – Tory Channel, New Zealand. Renew. Energy 57, 269–282. doi: 10.1016/j.renene.2013.02.001
Plew, D. R., Stevens, C. L., Spigel, R. H., and Hartstein, N. D. (2005). Hydrodynamic implications of large offshore mussel farms. IEEE J. Ocean. Eng. 30, 95–108. doi: 10.1109/joe.2004.841387
Proctor, R., and Carter, L. (1989). Tidal and sedimentary response to the late Quaternary closure and opening of Cook Strait, New Zealand: results from numerical modeling. Paleoceanography 4, 167–180. doi: 10.1029/pa004i002p00167
Ramirez-Llodra, E., De Mol, B., Company, J. B., Coll, M., and Sardà, F. (2013). Effects of natural and anthropogenic processes in the distribution of marine litter in the deep Mediterranean Sea. Prog. Oceanogr. 118, 273–287. doi: 10.1016/j.pocean.2013.07.027
Rogers, J. N., Kelley, J. T., Belknap, D. F., Gontz, A., and Barnhardt, W. A. (2006). Shallow-water pockmark formation in temperate estuaries: a consideration of origins in the western gulf of Maine with special focus on Belfast Bay. Mar. Geol. 225, 45–62. doi: 10.1016/j.margeo.2005.07.011
Scanlon, K. M., and Knebel, H. J. (1989). Pockmarks in the floor of Penobscot Bay, Maine. Geo Mar. Lett. 9, 53–58. doi: 10.1007/bf02262818
Schattner, U., Lazar, M., Souza, L. A. P., ten Brink, U., and Mahiques, M. M. (2016). Pockmark asymmetry and seafloor currents in the Santos Basin offshore Brazil. Geo Mar. Lett 36, 457–464. doi: 10.1007/s00367-016-0468-0
Shaw, J., Todd, B. J., Li, M. Z., and Wu, Y. (2012). Anatomy of the tidal scour system at minas passage, Bay of Fundy, Canada. Mar. Geol. 32, 123–134. doi: 10.1016/j.margeo.2012.07.007
Simpson, J. H., and Sharples, J. (2012). Introduction to the Physical and Biological Oceanography of Shelf Seas. Cambridge: Cambridge University Press.
Singh, L. J. (2001). Late Quarternary Sea Level and Tectonic History of Marlborough Sounds: A Thesis Submitted to the Victoria University of Wellington in Fulfilment of the Requirements for the Degree of Doctor of Philosophy in Geology. PhD thesis, Kelburn: Victoria University of Wellington.
Small, C., and Nicholls, R. J. (2003). A global analysis of human settlement in coastal zones. J. Coast. Res. 19, 584–599.
Stevens, C. (2014). Residual flows in Cook Strait, a large tidally dominated strait. J. Phys. Oceanogr. 44, 1654–1670. doi: 10.1175/jpo-d-13-041.1
Stevens, G. R. (1974). Rugged Landscape: The Geology of Central New Zealand, Including Wellington, Wairarapa, Manawatu, and the Marlborough Sounds (Raupo). Wellington: DSIR Publishing.
Stride, A. H. (1982). Offshore Tidal Deposits: Sand Sheet and Sand Bank Facies. In Offshore Tidal Sands. Amsterdam: Springer, 95–125.
Syvitski, J. P., Vörösmarty, C. J., Kettner, A. J., and Green, P. (2005). Impact of humans on the flux of terrestrial sediment to the global coastal ocean. Science 308, 376–380. doi: 10.1126/science.1109454
Tawekal, R. L., Allo, R. P. R., and Taufik, A. (2017). Damage analysis of subsea pipeline due to anchor drag. Int. J. Appl. Eng. Res. 12:6.
Te Punga, M. T. (1953). A late pleistocene land bridge across cook strait, New Zealand. N.Z. J. Sci. Technol. 35, 161–192.
Todd, B. J. (2005). Morphology and composition of submarine barchan dunes on the Scotian Shelf, Canadian Atlantic margin. Geomorphology 67, 487–500. doi: 10.1016/j.geomorph.2004.11.016
Todd, B. J., Shaw, J., Li, M. Z., Kostylev, V. E., and Wu, Y. (2014). Distribution of subtidal sedimentary bedforms in a macrotidal setting: the Bay of Fundy, Atlantic Canada. Cont. Shelf Res. 83, 64–85. doi: 10.1016/j.csr.2013.11.017
Todd, B. J., and Valentine, P. C. (2012). Large Submarine Sand Waves and Gravel Lag Substrates on Georges Bank off Atlantic Canada. In Seafloor Geomorphology as Benthic Habitat. Amsterdam: Elsevier, 261–275.
Tournadre, J. (2014). Anthropogenic pressure on the open ocean: The growth of ship traffic revealed by altimeter data analysis. Geophys. Res. Lett. 41, 7924–7932. doi: 10.1002/2014gl061786
Udden, J. A. (1914). Mechanical composition of clastic sediments. Bull. Geol. Soc. Am. 25, 655–744. doi: 10.1130/gsab-25-655
Van Landeghem, K. J. J., Wheeler, A. J., Mitchell, N. C., and Sutton, G. (2009). Variations in sediment wave dimensions across the tidally dominated Irish Sea, NW Europe. Mar. Geol. 263, 108–119. doi: 10.1016/j.margeo.2009.04.003
Van Maren, D. S., van Kessel, T., Cronin, K., and Sittoni, L. (2015). The impact of channel deepening and dredging on estuarine sediment concentration. Cont. Shelf Res. 95, 1–14. doi: 10.1016/j.csr.2014.12.010
Villatoro Lacouture, M. M. (2010). Sand Transport in Chioggia Inlet, Venice Lagoon and Resulting Morphodynamic Evolution. PhD thesis, Southampton: University of Southampton.
Wadsworth, T. (2015). The Spatial Distribution of pâ in Tōtaranui/Queen Charlotte Sound, New Zealand. Master of Arts thesis, Dunedin: University of Otago.
Walters, R. A., Gillibrand, P. A., Bell, R. G., and Lane, E. M. (2010). A study of tides and currents in cook strait, New Zealand. Ocean Dyn. 60, 1559–1580. doi: 10.1007/s10236-010-0353-8
Wentworth, C. K. (1922). A scale of grade and class terms for clastic sediments. J. Geol. 30, 377–392. doi: 10.1086/622910
Whitehouse, R. J., Harris, J. M., Sutherland, J., and Rees, J. (2011). The nature of scour development and scour protection at offshore windfarm foundations. Mar. Pollut. Bull. 62, 73–88. doi: 10.1016/j.marpolbul.2010.09.007
Whiticar, M. J. (2002). Diagenetic relationships of methanogenesis, nutrients, acoustic turbidity, pockmarks and freshwater seepages in Eckernförde Bay. Mar. Geol. 182, 29–53. doi: 10.1016/s0025-3227(01)00227-4
Whiticar, M. J., and Werner, F. (1981). Pockmarks: submarine vents of natural gas or freshwater seeps? Geo Mar. Lett. 1, 193–199. doi: 10.1007/bf02462433
Wölfl, A.-C., Snaith, H., Amirebrahimi, S., Devey, C. W., Dorschel, B., Ferrini, V., et al. (2019). Seafloor mapping – the challenge of a truly global ocean bathymetry. Front. Mar. Sci 6:283. doi: 10.3389/fmars.2019.00283
Wu, Y., Chaffey, J., Greenberg, D. A., Colbo, K., and Smith, P. C. (2011). Tidally-induced sediment transport patterns in the upper Bay of Fundy: a numerical study. Cont. Shelf Res. 31, 2041–2053. doi: 10.1016/j.csr.2011.10.009
Keywords: shallow marine, multibeam bathymetry, anthropogenic footprint, seafloor geomorphology, bedforms, tidal currents, pockmarks
Citation: Watson SJ, Neil H, Ribó M, Lamarche G, Strachan LJ, MacKay K, Wilcox S, Kane T, Orpin A, Nodder S, Pallentin A and Steinmetz T (2020) What We Do in the Shallows: Natural and Anthropogenic Seafloor Geomorphologies in a Drowned River Valley, New Zealand. Front. Mar. Sci. 7:579626. doi: 10.3389/fmars.2020.579626
Received: 03 July 2020; Accepted: 25 August 2020;
Published: 21 September 2020.
Edited by:
Juan Jose Munoz-Perez, University of Cádiz, SpainReviewed by:
H. Gary Greene, Moss Landing Marine Laboratories, United StatesFederica Foglini, Consiglio Nazionale delle Ricerche (Bologna), Italy
Copyright © 2020 Watson, Neil, Ribó, Lamarche, Strachan, MacKay, Wilcox, Kane, Orpin, Nodder, Pallentin and Steinmetz. This is an open-access article distributed under the terms of the Creative Commons Attribution License (CC BY). The use, distribution or reproduction in other forums is permitted, provided the original author(s) and the copyright owner(s) are credited and that the original publication in this journal is cited, in accordance with accepted academic practice. No use, distribution or reproduction is permitted which does not comply with these terms.
*Correspondence: Sally J. Watson, sally.watson@niwa.co.nz