Article

COVID-19 Pandemic Consequences on Coastal Water Quality Using WST Sentinel-3 Data: Case of Tangier, Morocco

by
El Khalil Cherif
1,2,
Martin Vodopivec
2,
Nezha Mejjad
3,
Joaquim C.G. Esteves da Silva
1,*,
Simona Simonovič
4 and
Hakim Boulaassal
5
1
Chemistry Research Unit (CIQUP), Departamento de Geociências, Ambiente e Ordenamento do Território, Faculty of Sciences of University of Porto, 4169-007 Porto, Portugal
2
Marine Biology Station (MBS), National Institute of Biology, SI-6330 Piran, Slovenia
3
Department of Geology, Laboratory of Applied Geology, Geomatics and Environment, Faculty of Sciences Ben M’Sik, Hassan II University, B.P 7955, Casablanca 20670, Morocco
4
Faculty of Management, University of Primorska, SI-6101 Koper, Slovenia
5
Equipe Geoinformation et Aménagement du Territoire (GAT), Faculty of Sciences and Techniques, University of Abdelmalek Essaadi, Ancienne Route de l’Aéroport, Km 10, Ziaten. B.P:416 Tanger, Morocco
*
Author to whom correspondence should be addressed.
Water 2020, 12(9), 2638; https://doi.org/10.3390/w12092638
Submission received: 29 June 2020 / Revised: 13 September 2020 / Accepted: 16 September 2020 / Published: 21 September 2020
(This article belongs to the Special Issue SARS-CoV-2 in Waters: Rational)

Abstract

:
The west coast of Tangier, in northern Morocco, has been affected by industrial wastewater discharge that reaches the ocean through the Boukhalef river. Therefore, the Jbila and Sidikacem beaches near to the Boukhalef river mouth have been classified as polluted for many years. With the aim of determining the COVID-19 pandemic consequences on the Tangier coastal environment, a linear model using Sentinel 3 water surface temperature (WST) has been tested in several locations. Data from April 2019 and April 2020, before and during the COVID-19 pandemic related emergency status in Morocco, were compared. The results from April 2019 showed high WST values and consequently, the poorest water quality in the sites closest to the Boukhalef river mouth. On the other hand, the results from April 2020 showed normal WST values and high water quality in the same study area. These results illustrate the usefulness of Sentinel 3 WST for the estimation of bathing water quality on the west coast of Tangier. The study shows the positive impact of the COVID-19 pandemic consequences on the coastal environment quality in the study area and indicates the importance of decreasing the industrial discharge on the west coast of Tangier. The same methodology could be used in decision-making processes and to reduce cost, time and human resources for coastal monitoring systems. We demonstrate the potential of using the Sentinel 3 data for coastal waters monitoring, as well as the need for stricter controls of pollutant discharges into the world’s rivers.

1. Introduction

Clean coastal water is an essential requirement for swimmersʹ health and the habitats of aquatic organisms [1]. Coastal water pollution is one of the serious environmental health risks that is affecting most of the world’s coastal environments [2,3]. Therefore, monitoring and improving coastal water quality is becoming an inevitable necessity [4,5,6,7,8,9]. Escherichia coli (E. coli) is one of the commonly used bacteria for indicating the fecal contamination in rivers and coastal waters [10,11,12]. The E. coli concentration is traditionally measured by field sampling and then analyzed in the laboratory [13]. These in-situ measurements are costly, time consuming and labour intensive [5]. The COVID-19 (Corona Virus Disease 2019) was first identified in December 2019 in the city of Wuhan, in eastern China [14]. The World Health Organization (WHO) received the first reports of an unknown virus causing several pneumonia cases in this Chinese city on 31 December 2019. On 31 January 2020, the WHO declared a public health emergency of international concern (PHEIC) over the novel virus. This was the sixth PHEIC after International Health Regulations (IHR) came into force. The risk was designated as very high in China and high in other countries worldwide [15].
The novel virus spread rapidly across the globe and caused a lockdown in numerous countries which followed the WHO global COVID-19 response strategy and national health recommendations [16]. These were meant to efficiently control the spread of the pandemic, reduce the transmission rate, and decrease the mortality rate caused by the virus. Thus, most governments around the world have implemented some control measures in response to COVID-19. These measures have affected almost all business activities such as manufacturing industries, logistics, and transportation, including shipping and aviation, mobility of people inside and outside their countries. However, the environment has mostly benefited from the COVID-19 lockdown and several cities around the world have experienced air quality enhancements [14,17,18,19,20,21,22,23,24,25]. In many Chinese regions air pollution level has significantly decreased by March 12 [1]. The European Space Agency (ESA) detected a clear drop in the nitrous oxide emissions in Milan, Italy, between 1 January and 11 March 2020, as a consequence of the imposed complete lockdown in the Po valley [26]. It has to be noted that the city of Milan is known as one of the most polluted zones in the world [27]. Substantial decreases in CO and NO2 levels (49% and 35% respectively—compared to the preceding days before the lockdown) were registered in Almaty, Kazakhstan, during the COVID-19 lockdown, while the O3 dropped by 15%. This can be attributed to the temporary elimination of urban transport and seasonal changes [19]. Significant reduction of CO (64.8%), NO (77.3%) and NO2 (54.3%) levels with an increase of O3 (30%) concentrations were observed in Rio de Janeiro, Brazil, during the partial lockdown, which caused a considerable improvement of air quality in the city [17,21].
The first case of COVID-19 in Morocco was confirmed on 2 March 2020. The entire country was under lockdown since mid-March 2020; restaurants, shopping malls, fitness centers, schools (elementary, middle, and high schools) and universities have been closed. Restrictions and security measures were imposed on drugstores and supermarkets, such as limited working hours, obligatory social distancing and the use of face masks. Thus, this pandemic has caused the closure of almost all vital economic activities including transportation. Other sectors, such as tourism and manufacturing supply chains, have been indirectly affected by the pandemic due to travel restrictions, the interruption of all international flights and border closures [28].
Tangier is situated in the northern part of Morocco and it is the second largest city in the country.
In response to the COVID-19 outbreak, the industrial activities in the city and its surroundings have been halted temporarily since mid-March to avoid transmission of the virus between employees. The reduced industrial activity and the effects of imposed lockdown on tourism, daily life and local transportation should lead to reduced levels of pollution. Thus, monitoring the bathing water quality of the west coast of Tangier during the COVID-19 era will allow us, on the one hand, to confirm the impacts of human pressures acting on this coastal area and, on the other hand, provide results that could serve as baseline information for future studies which aim to assess bathing water quality.
Cherif et al., (2019) [4] have demonstrated that water surface temperature (WST) can be used as a proxy for fecal pollution detection in the coastal waters around the Boukhalef river estuary and, consequently, this paper is a continued investigation of the bathing water quality on the Atlantic coast of Tangier. The method from [4] was applied to a series of Sentinel-3 WST images recorded before and during the COVID-19 pandemic. In contrast to Landsat 8 images used by Cherif et al., (2019) [4], the images from Sentinel-3 can be obtained in a higher horizontal resolution four times per day and with minimum delay. They require minimal post-processing as the WST is one of the directly available products. This makes them especially useful for near real-time monitoring.
The contribution of the present work is twofold. First, it illustrates the level of bathing water quality improvement during the COVID-19 lockdown and relates the pollution level of the coastal waters to the rate of industrial activity. Secondly, it demonstrates the possible use of Sentinel-3 WST images as an early warning system of pollution of coastal waters in the area around the Boukhalef estuary and similar areas worldwide. Indeed, the analysis shows a significant change in WST and consequently a marked improvement in the E. coli concentration estimate in the western coastal waters of Tangier during the COVID-19 lockdown period.

2. Materials and Methods

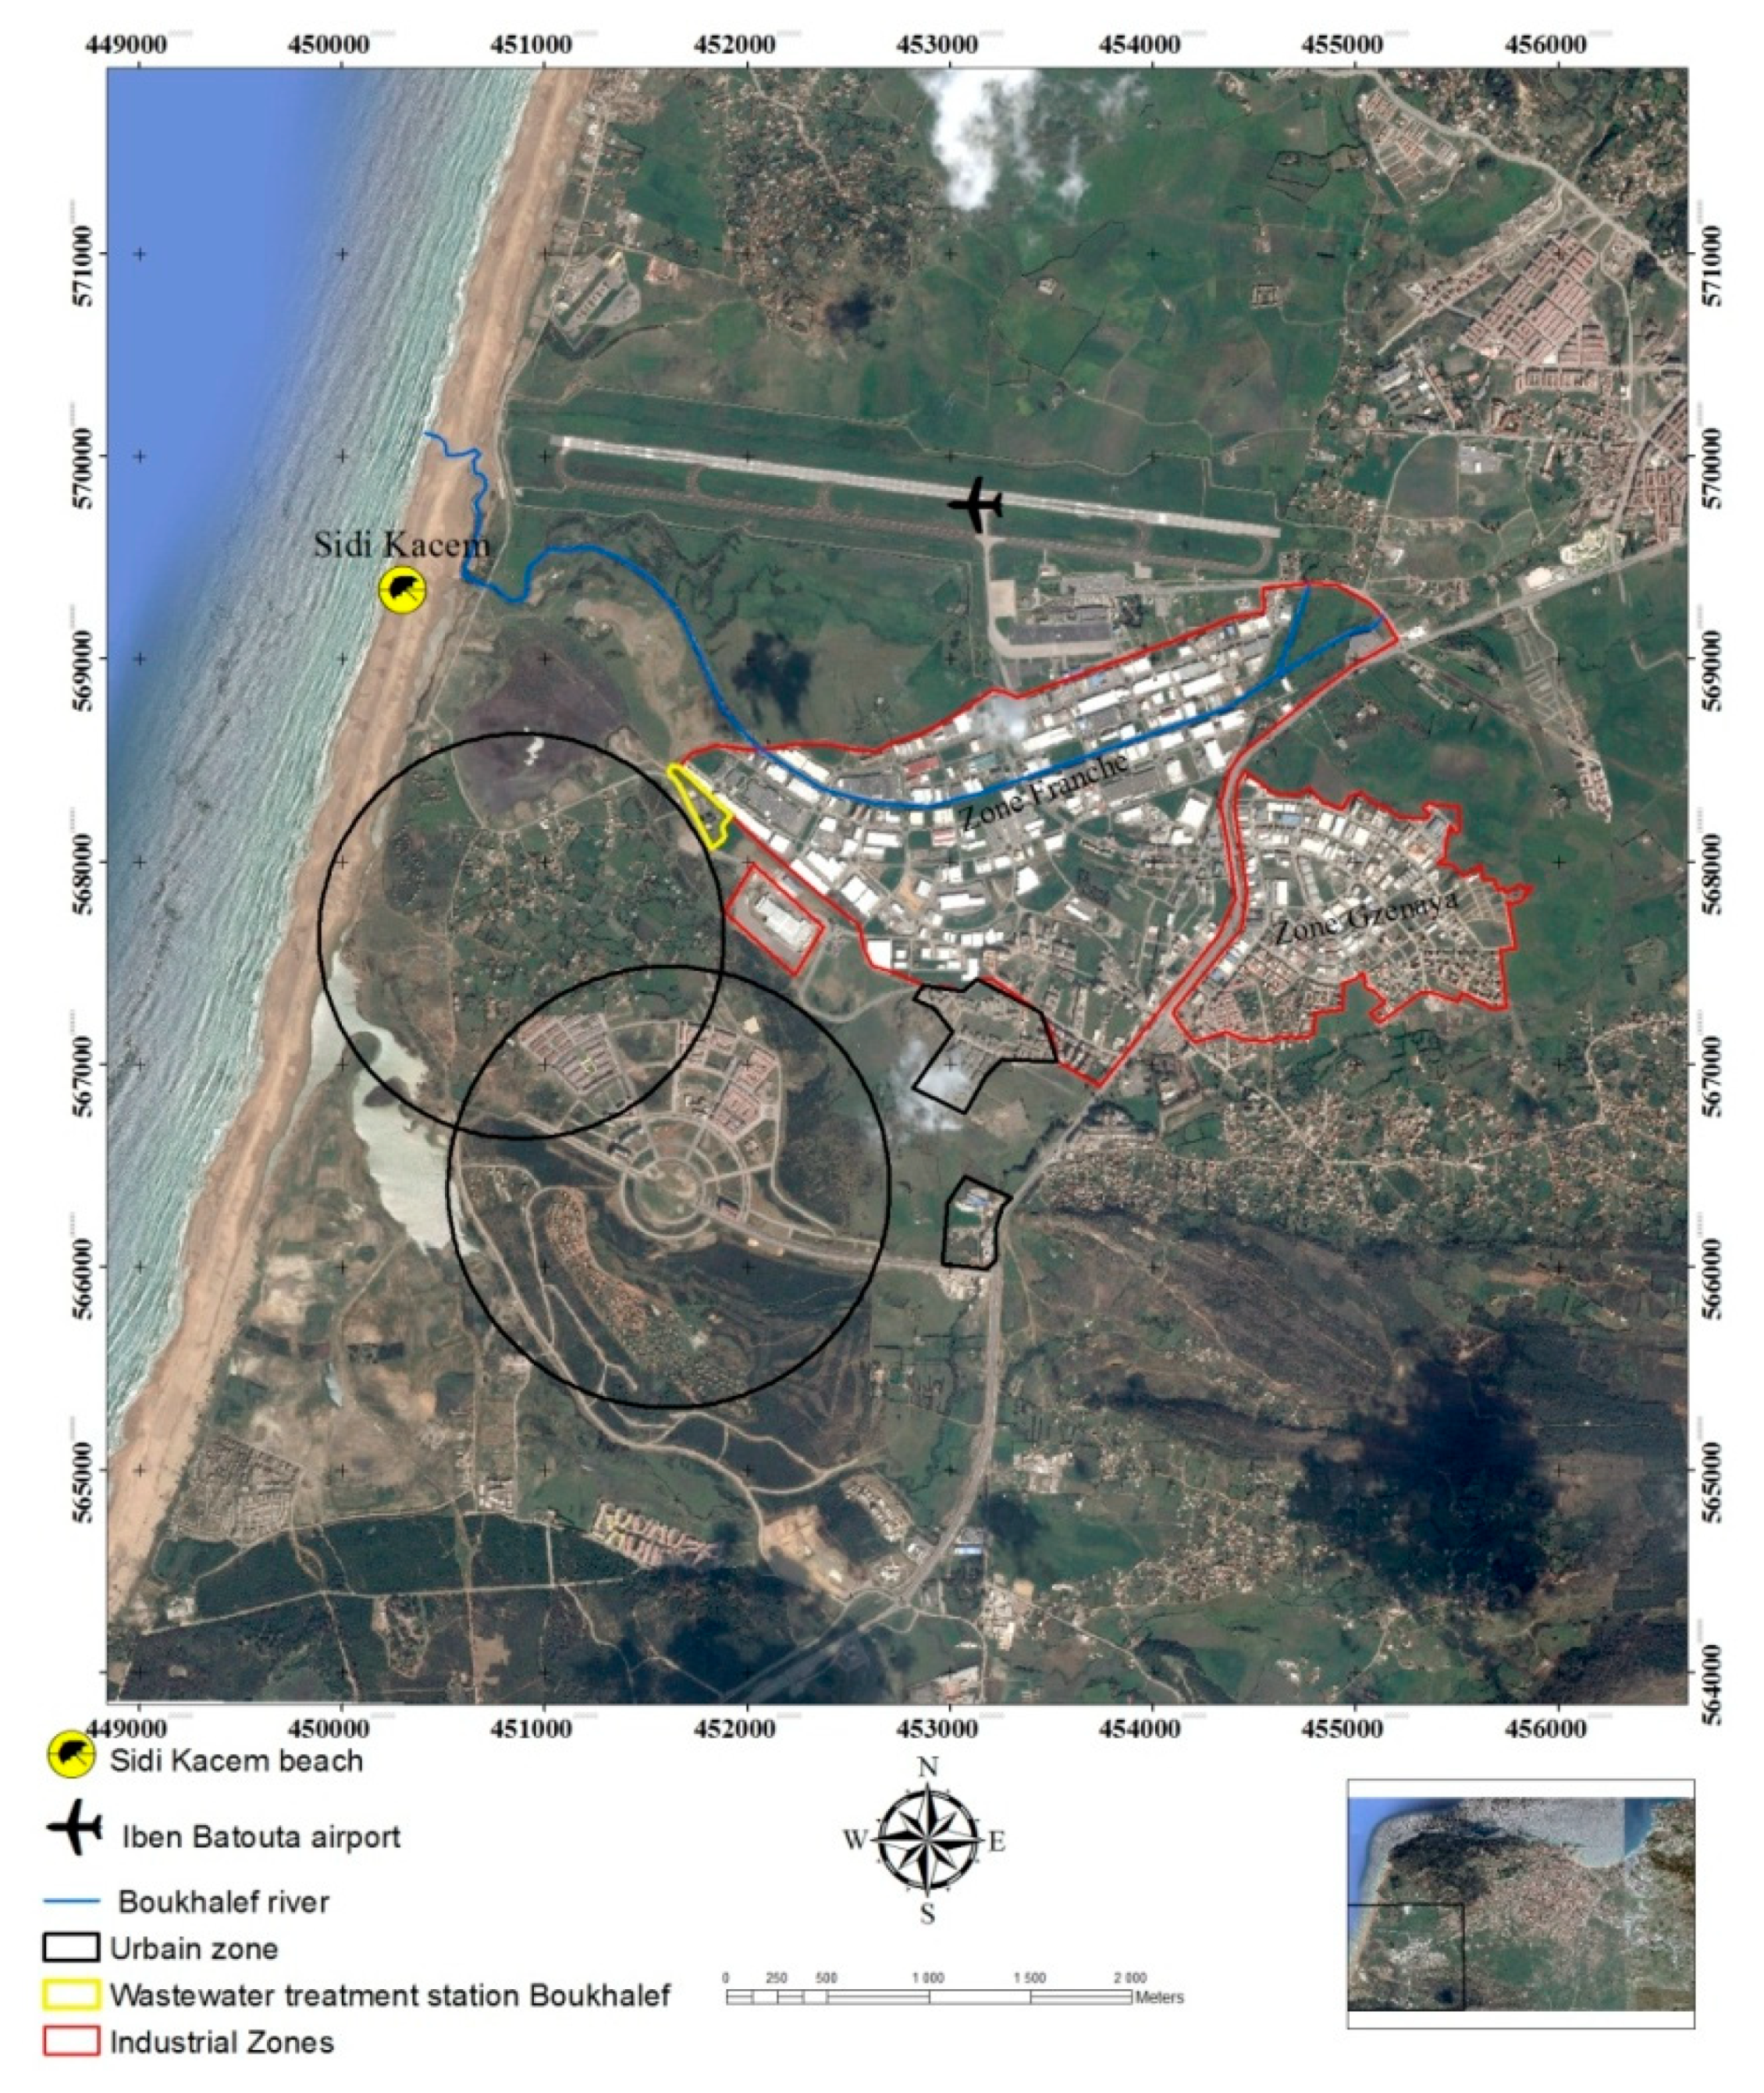
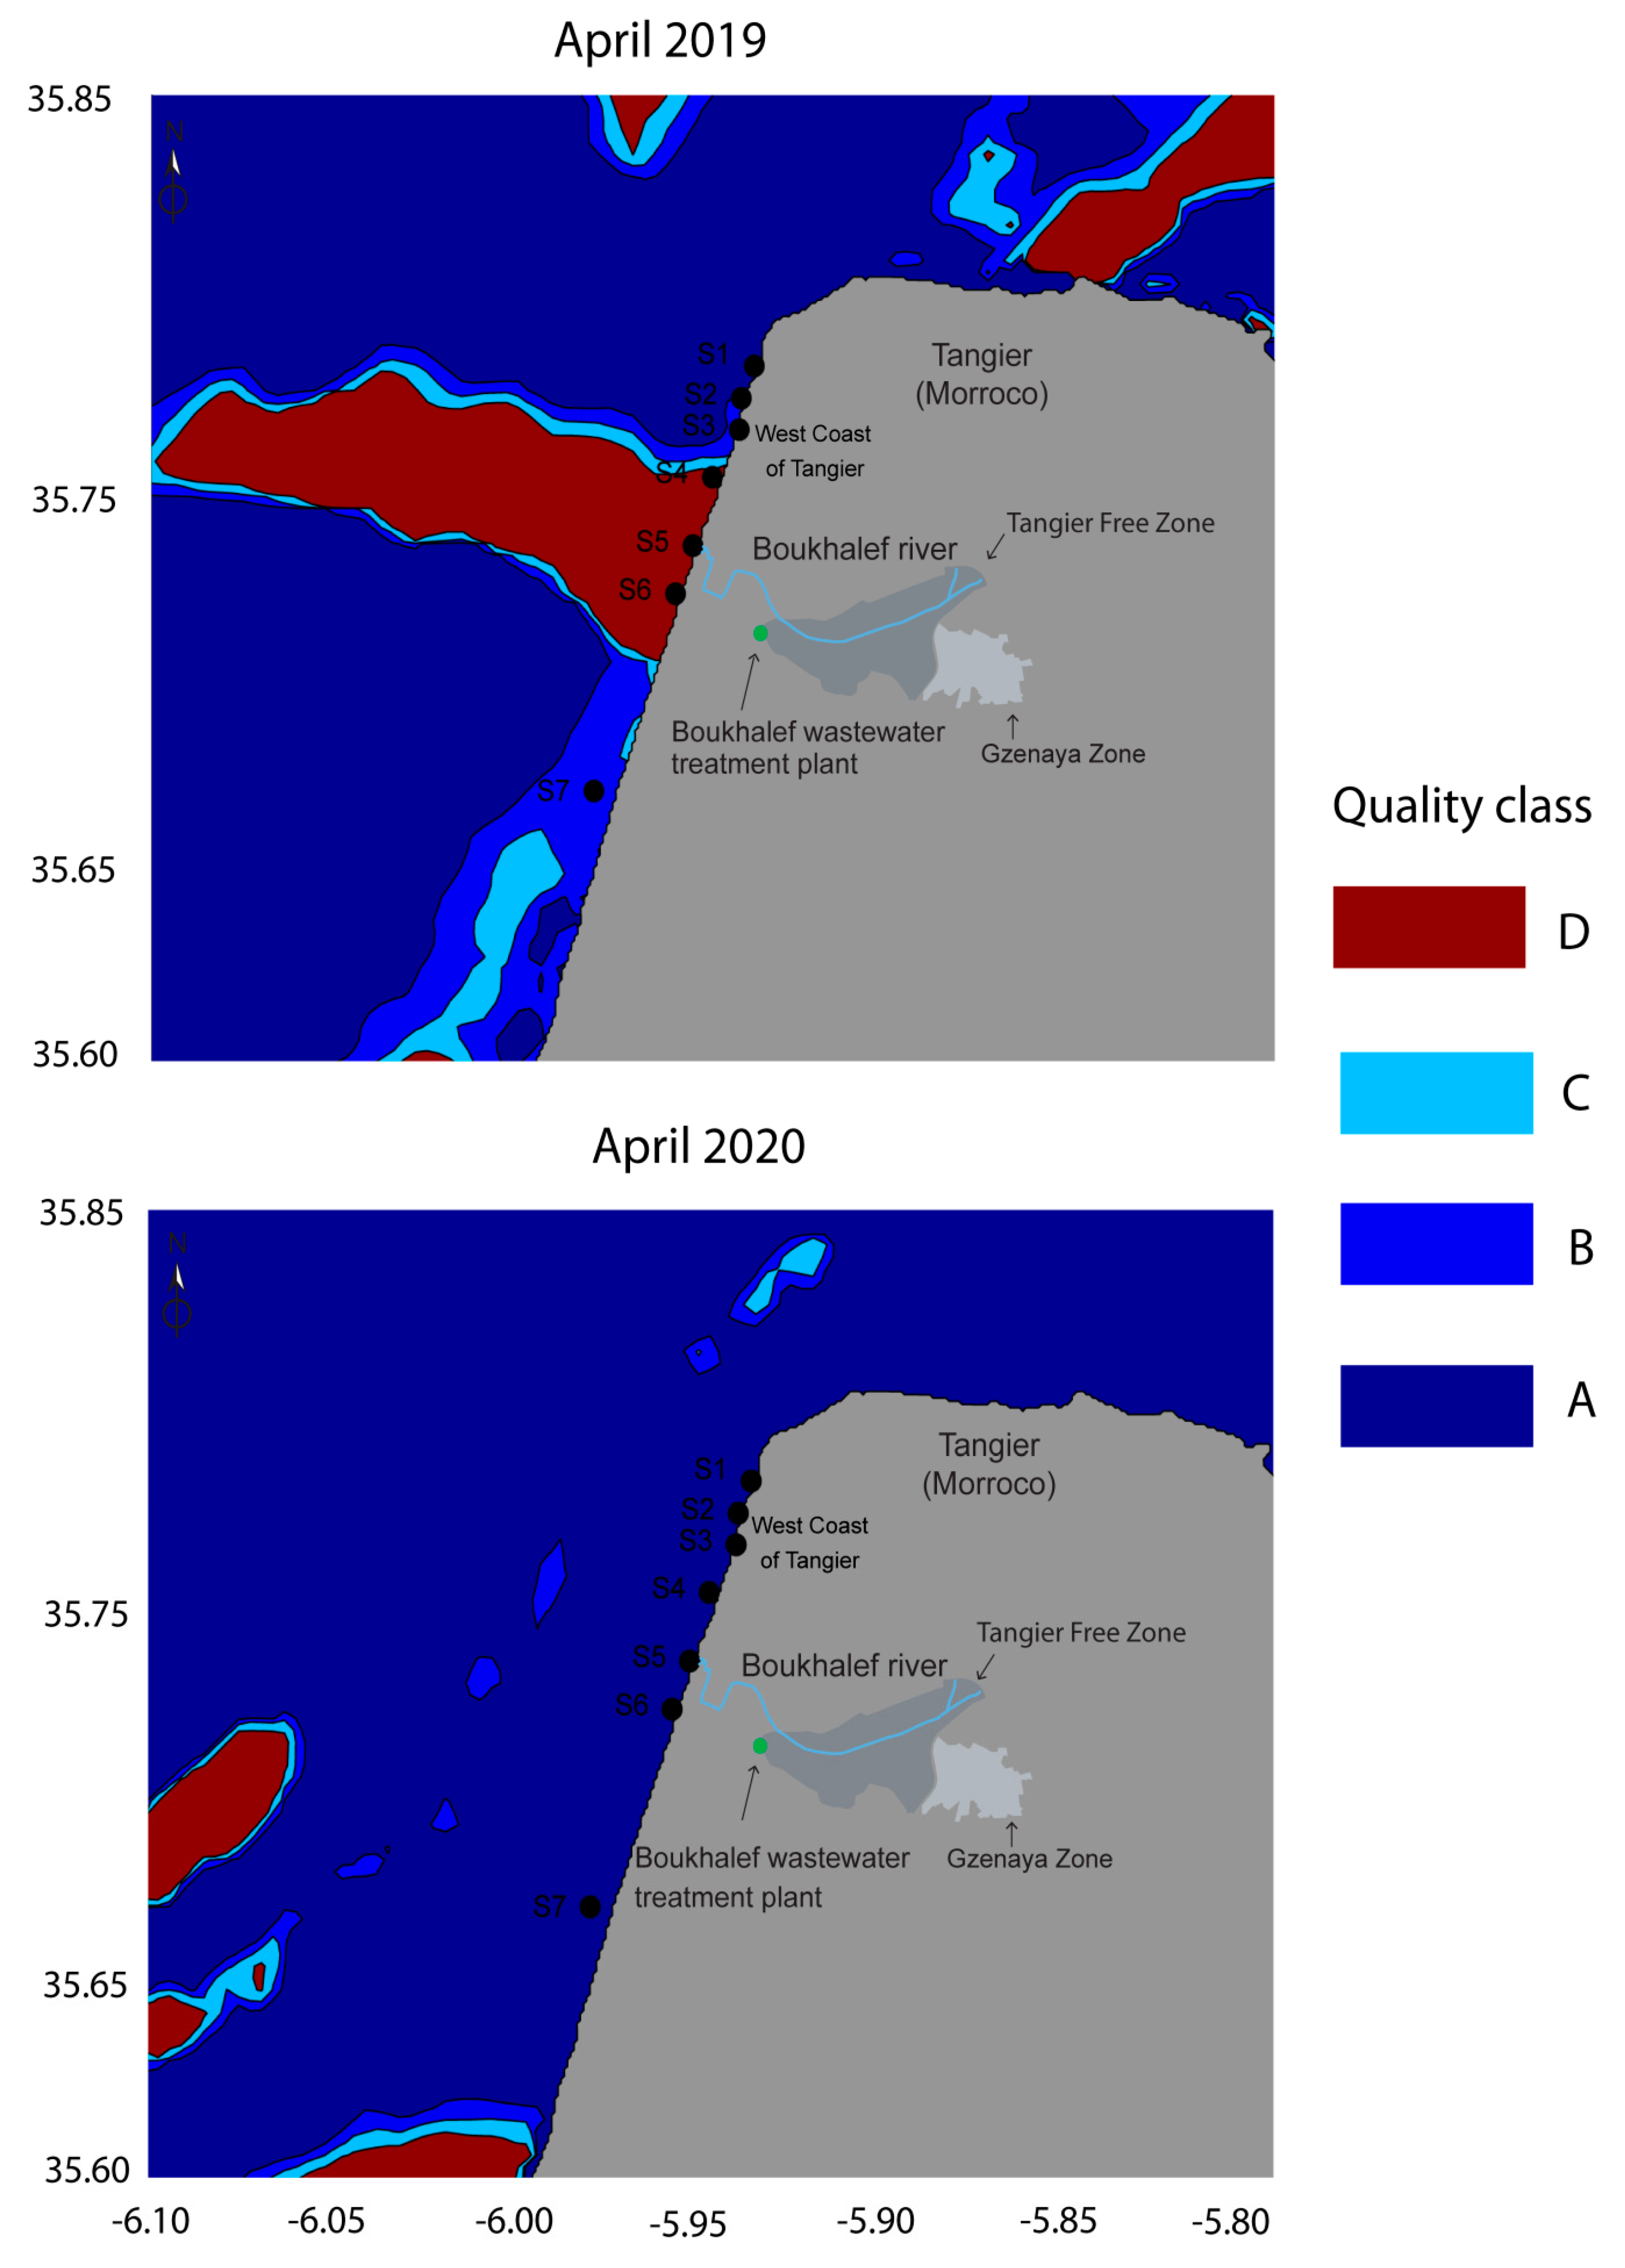
2.1. Site Description

The study area is situated in the north-western part of Morocco (Figure 1) on the western coast of Tangier. It is an area of intense industrial activity [6]—about 43% of the automotive industry in Morocco is concentrated in Tangier [29]. The industrial and other human activities, including urbanization and tourism, are concentrated on the Atlantic coast of Tangier [30,31]. All these activities are the main cause of the deterioration of the natural environment in coastal areas [32] and influence bathing water quality [4]. Er-Raioui et al., (2012) [33], reported that more than 232 tons/day (t/d) of suspended solids are discharged in the Tangier and Tetouan coast and that these marine areas are the most affected by human activities in the Moroccan Mediterranean coastline. Previous studies were carried out in the west coast of Tangier [4,5,6,7,34] to assess its bathing water quality, especially considering the industrial growth that Tangier has experienced in the last decades. The reports concluded that the human activities concentrated along the west coast of Tangier have a potential impact on bathing waters, especially at Jbila and Sidikacem beaches. A variety of pollutants could be associated with urban runoff and often containing microbial contaminants which present a risk to human health [35,36,37].
The main drivers of pollution in the area are two large industrial zones, Tangier Free Zone (TFZ) and Gzenaya Zone (GZ), which extend over a surface of 48.12 km2. The area includes the Boukhalef river and the Boukhalef wastewater treatment plant [6]. The TFZ and GZ are known as the most important industrial zones in the northern part of Morocco [4,7,38]. They represent the core of industrial activities of Tangier city and contain more than 715 industrial units and companies [6] including: agri-food industries (AFI), chemical, para-chemical industries (CPI), textile and leather industries (TLI), mechanical, metallurgical, and electronics industries (MMEI) and other services industries (OSI). The untreated and treated wastewaters released from these industrial activities, which are often characterized by a high concentration of pollutants, are discharged directly into the Boukhalef river and eventually reach the seacoast at Sidikacem beach (Figure 2) [39]. Indeed, Jbila and Sidikacem beaches, located near the Boukhalef River mouth, are known to be chronically contaminated [4,6,8,33]. In addition, those two beaches are the most popular tourist destinations for swimmers with a frequency of up to 8000 individuals per day during the summer season [6].

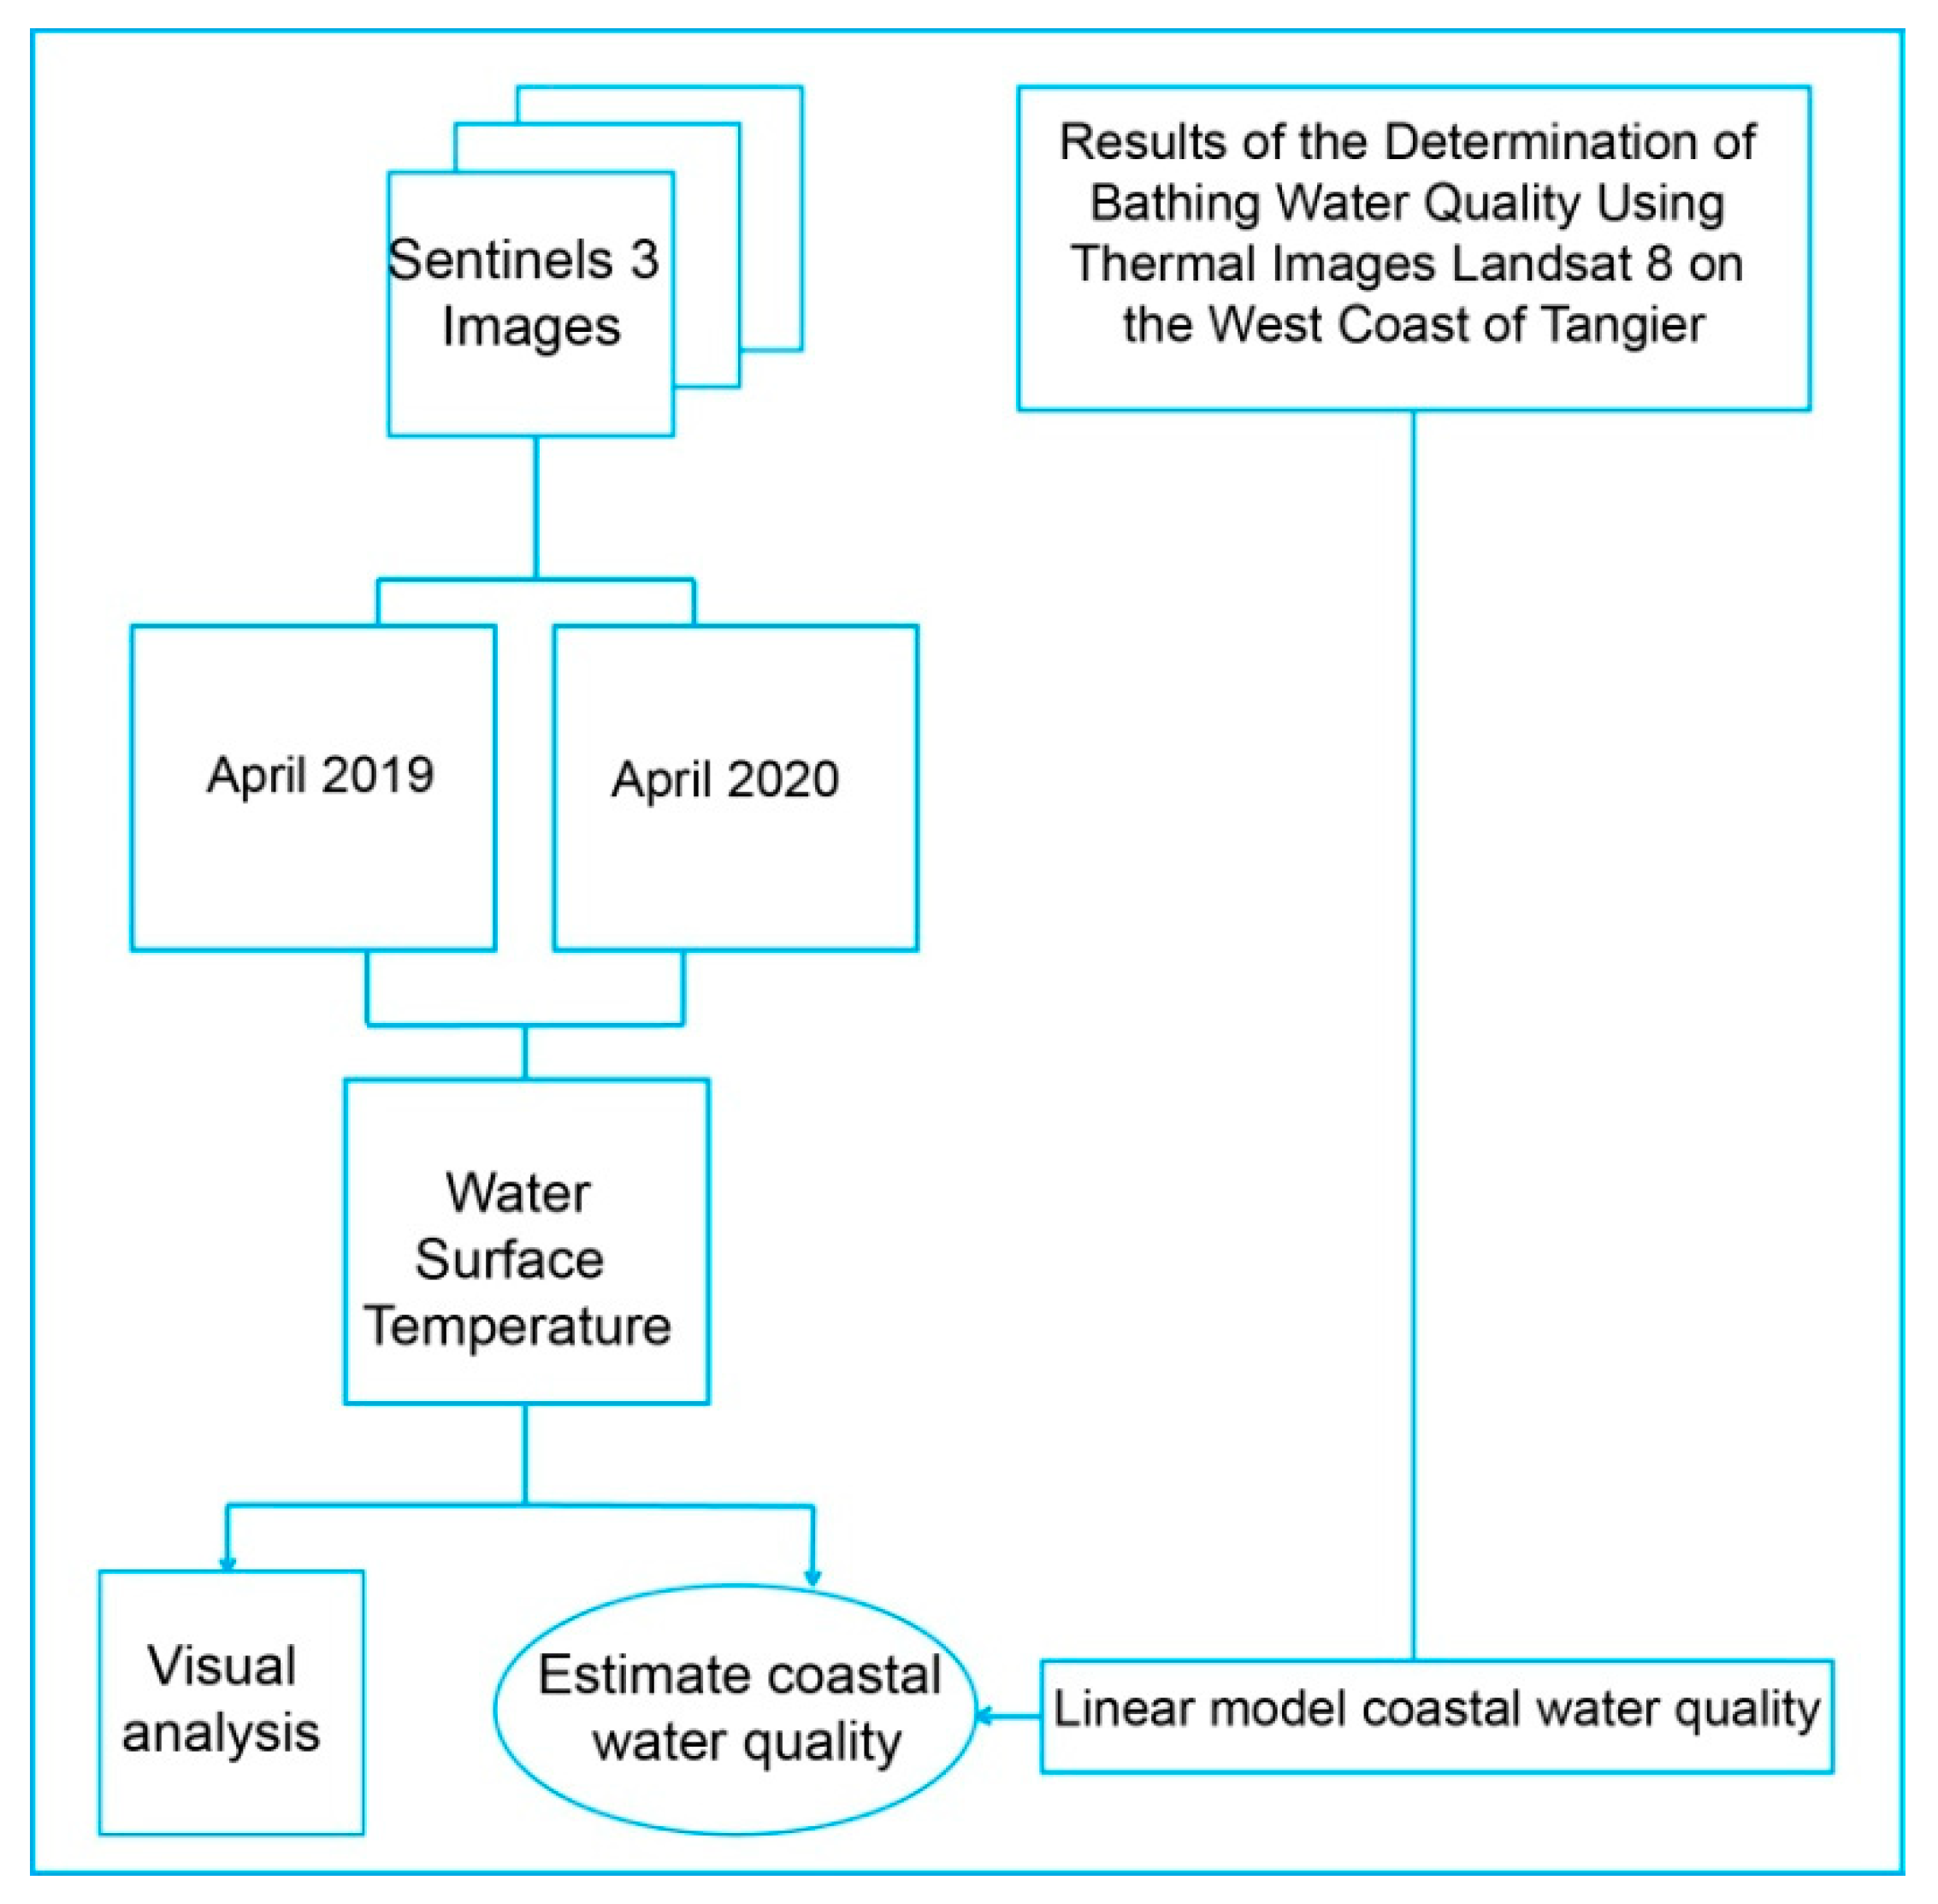
2.2. Study Procedure

In this study, the western Tangier water quality was analyzed using Sentinel 3 images as shown in Figure 3 with details in the following sections.
The WST data for April 2019 and 2020 were extracted from Sentinel 3 images, the first year representing a period of normal industrial production activity in both industrial zones, the Tangier Free Zone and Gzenaya Zone (Figure 2), and the second year representing a period of halt in industrial production due to the Covid-19 pandemic emergency. The linear coastal water quality model developed by Cherif et al., (2019) [4], was used to estimate the E. coli concentration and to estimate the Tangier western coastal waters quality (Figure 3).

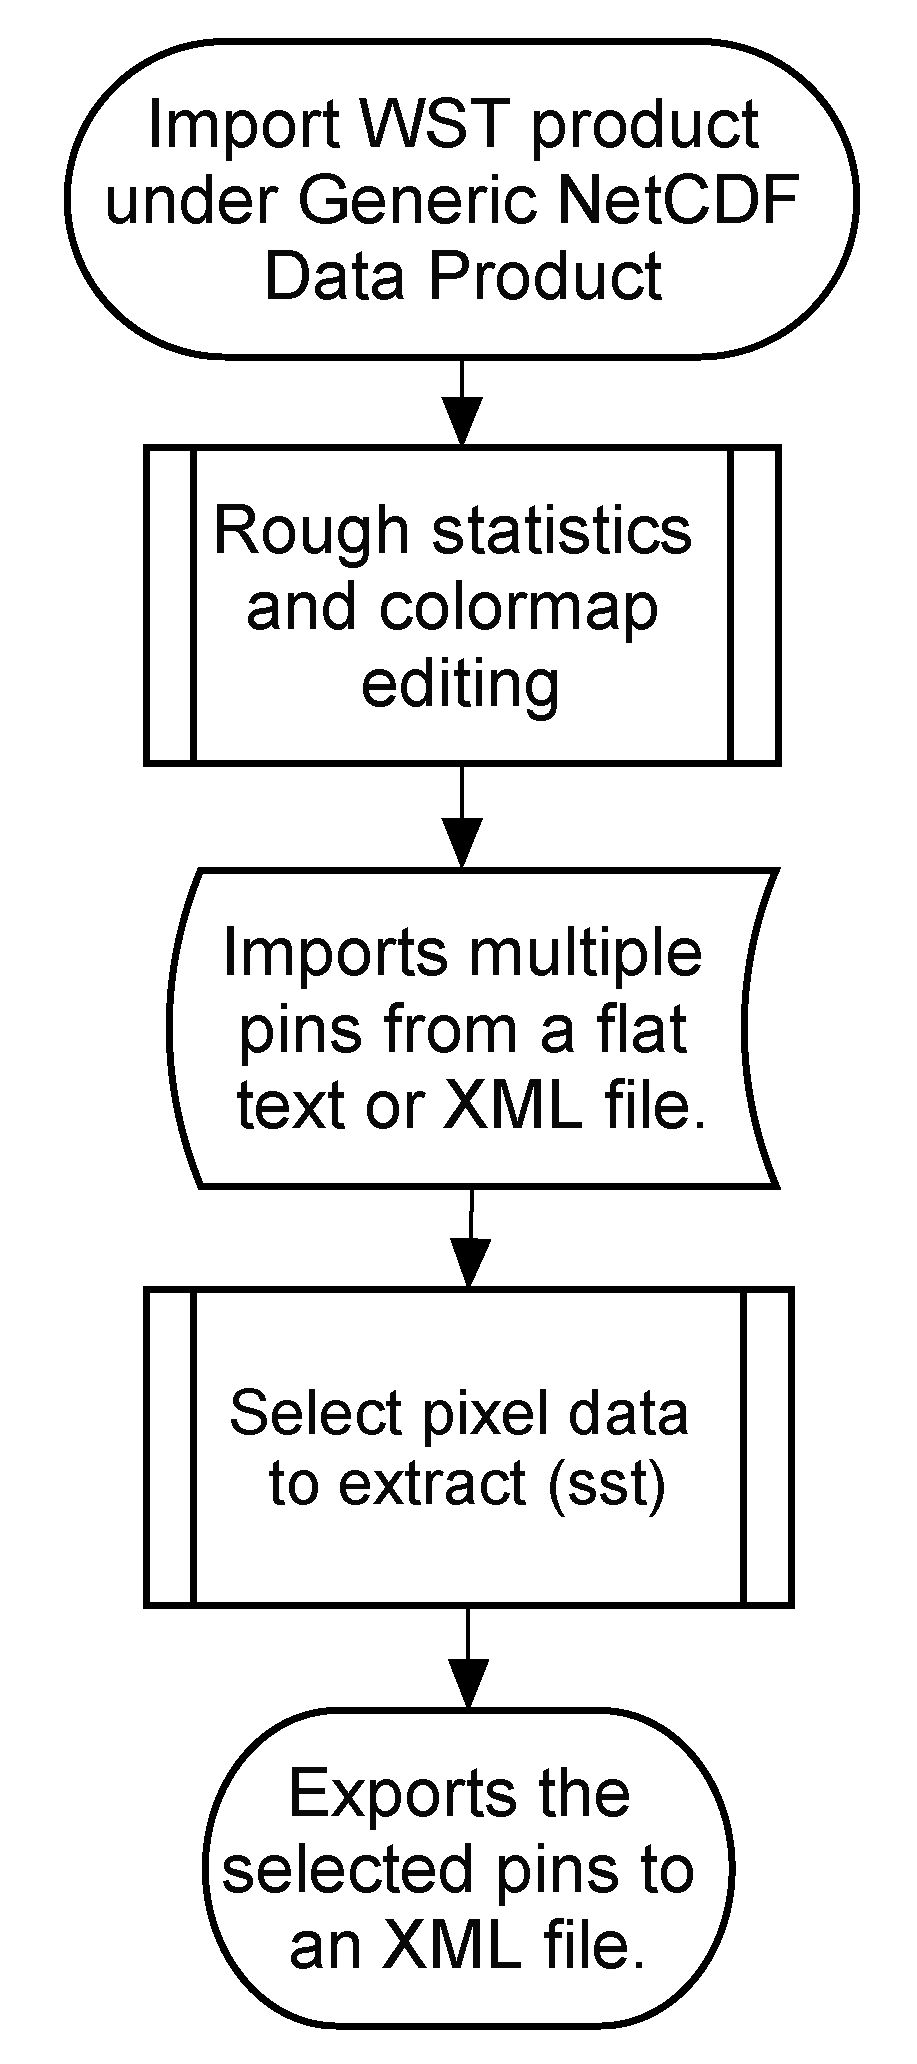
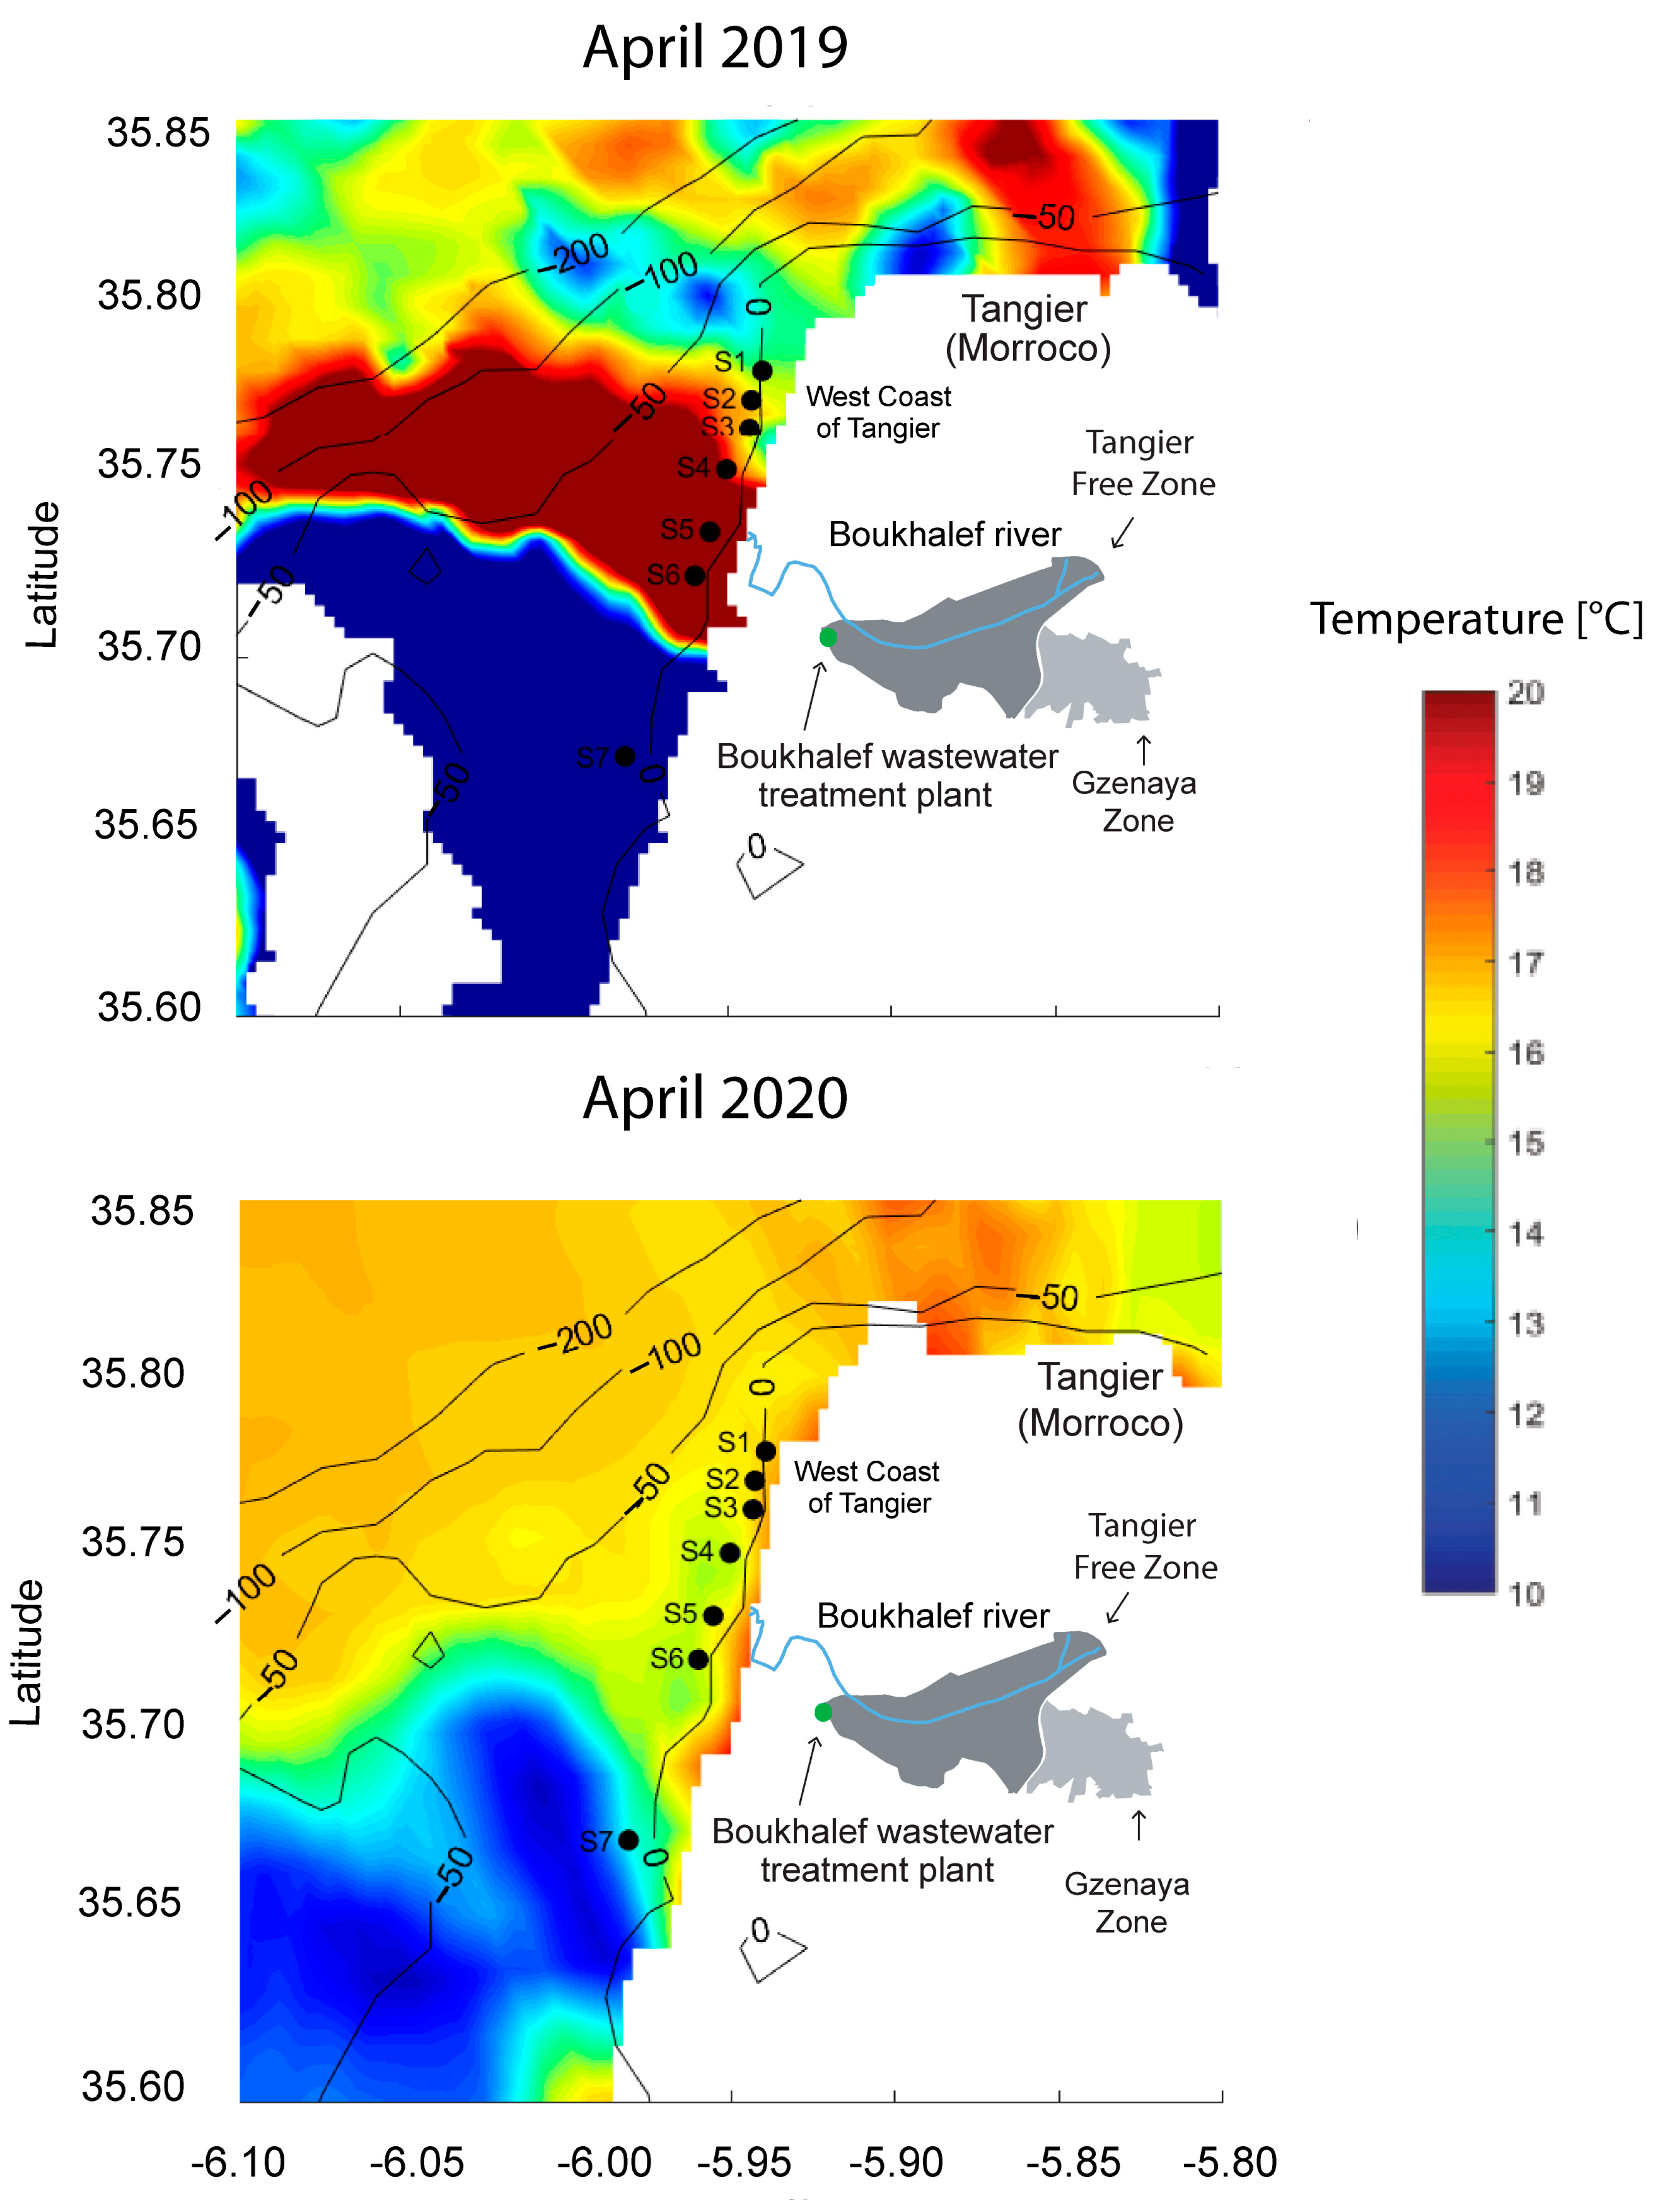
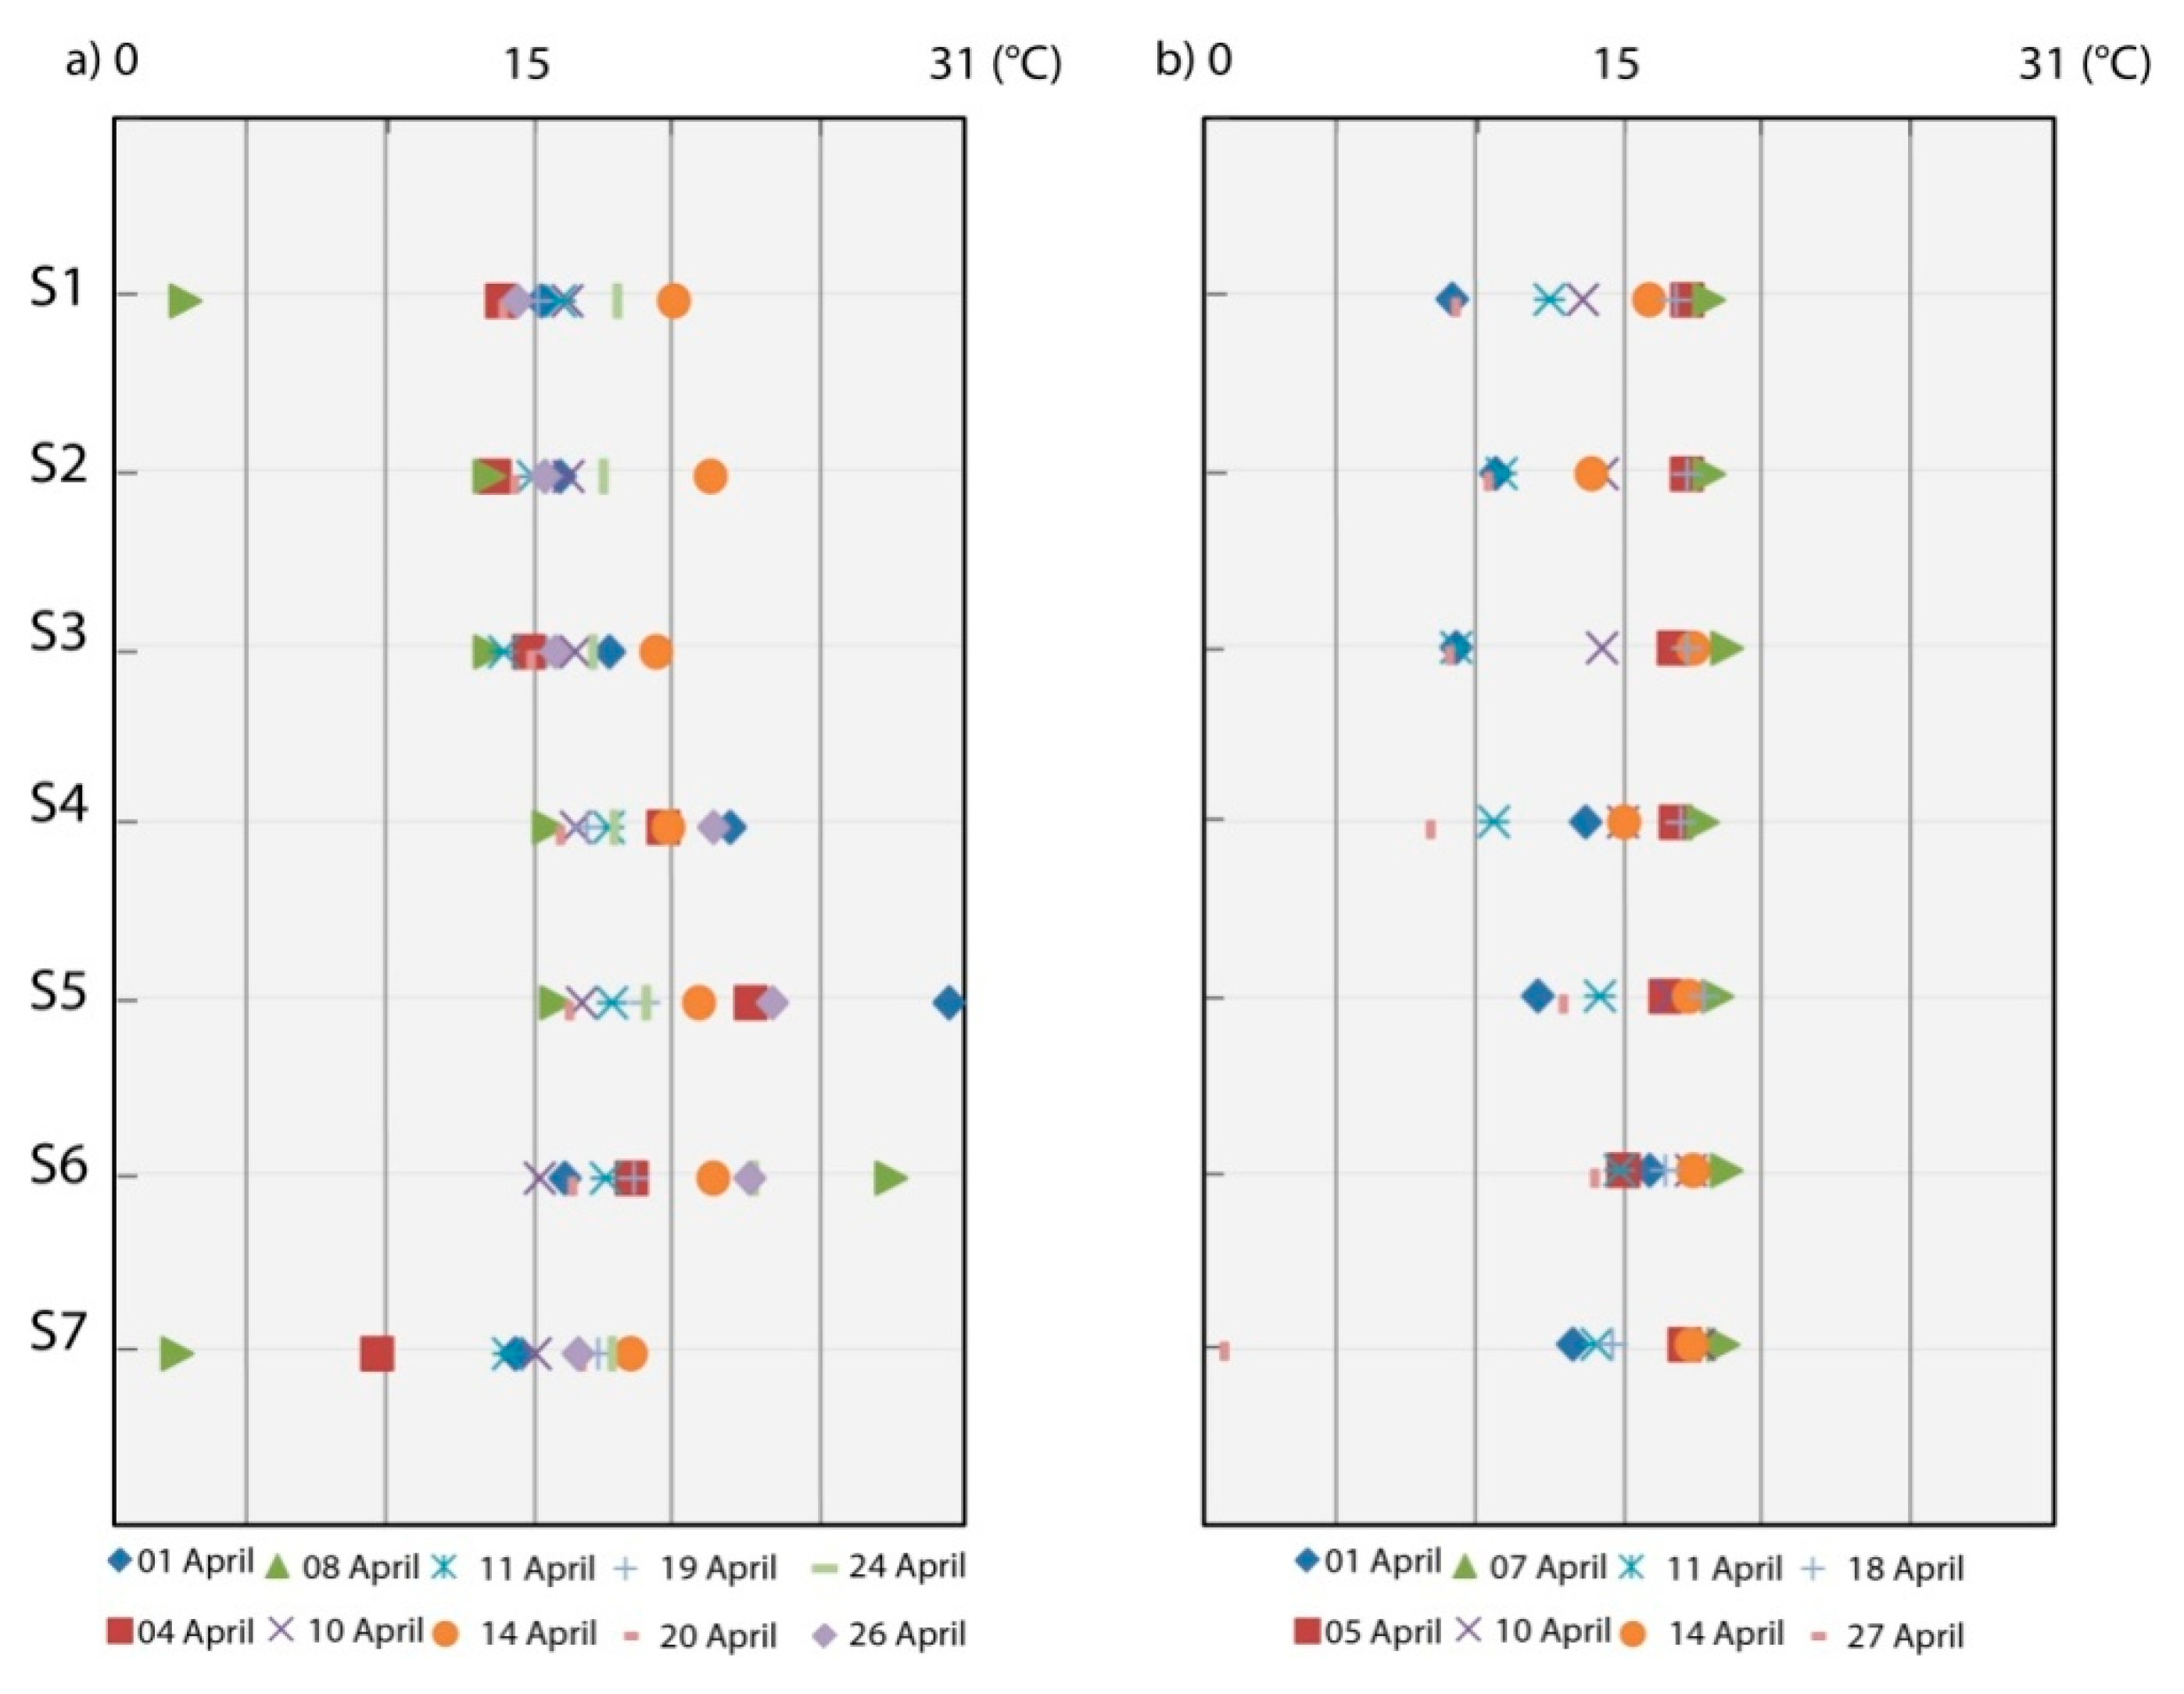
2.2.1. Water Surface Temperature Data

The WST measurements are carried out based on Level-2 WST products derived from the SLSTR (Sea and Land Surface Temperature Radiometer) instrument. The latter has a very wide swath of 1400 km and covers the entire earth surface in about 2 days. It can provide a map of ocean temperatures with extreme accuracy up to 0.1 degrees. SLSTR records the same area from two different angles, which enables (by combining the two images) the correction of atmospheric disturbance effects in order to obtain very precise temperature measurements. SLSTR has 9 channels in visible and infrared (3 in visible and near-infrared, 3 in SW infrared, and 3 in MW infrared). The set of spectral bands covers the range from 0.556 µm to 12.5 µm. More details about the WST products can be found on the official website: https://sentinel.esa.int/web/sentinel/user-guides/sentinel-3-slstr/product-types/level-2-wst. It is also worth mentioning that the SL_2_WST products can be obtained from the Group for High-Resolution Sea Surface Temperature (GHRSST) https://www.ghrsst.org/.
A total of ten WST images from 2019 (01, 04, 08, 10, 11, 14, 19, 20, 24 and 26 April 2019) and eight images from 2020 (01, 05, 07, 10, 11, 14, 18 and 27 April 2020) covering the west coast of Tangier have been used in this study (Table 1). Images from other dates in April 2019 and April 2020 have not been included due to cloud obstruction problems.
Once the suitable images were downloaded, the WST values corresponding to our points of interest were extracted. Figure 4 shows the following steps using SNAP (Sentinel Application Platform) software developed by the European Spatial Agency (ESA) and is freely available from their official website: http://step.esa.int/main/download/snap-download/.

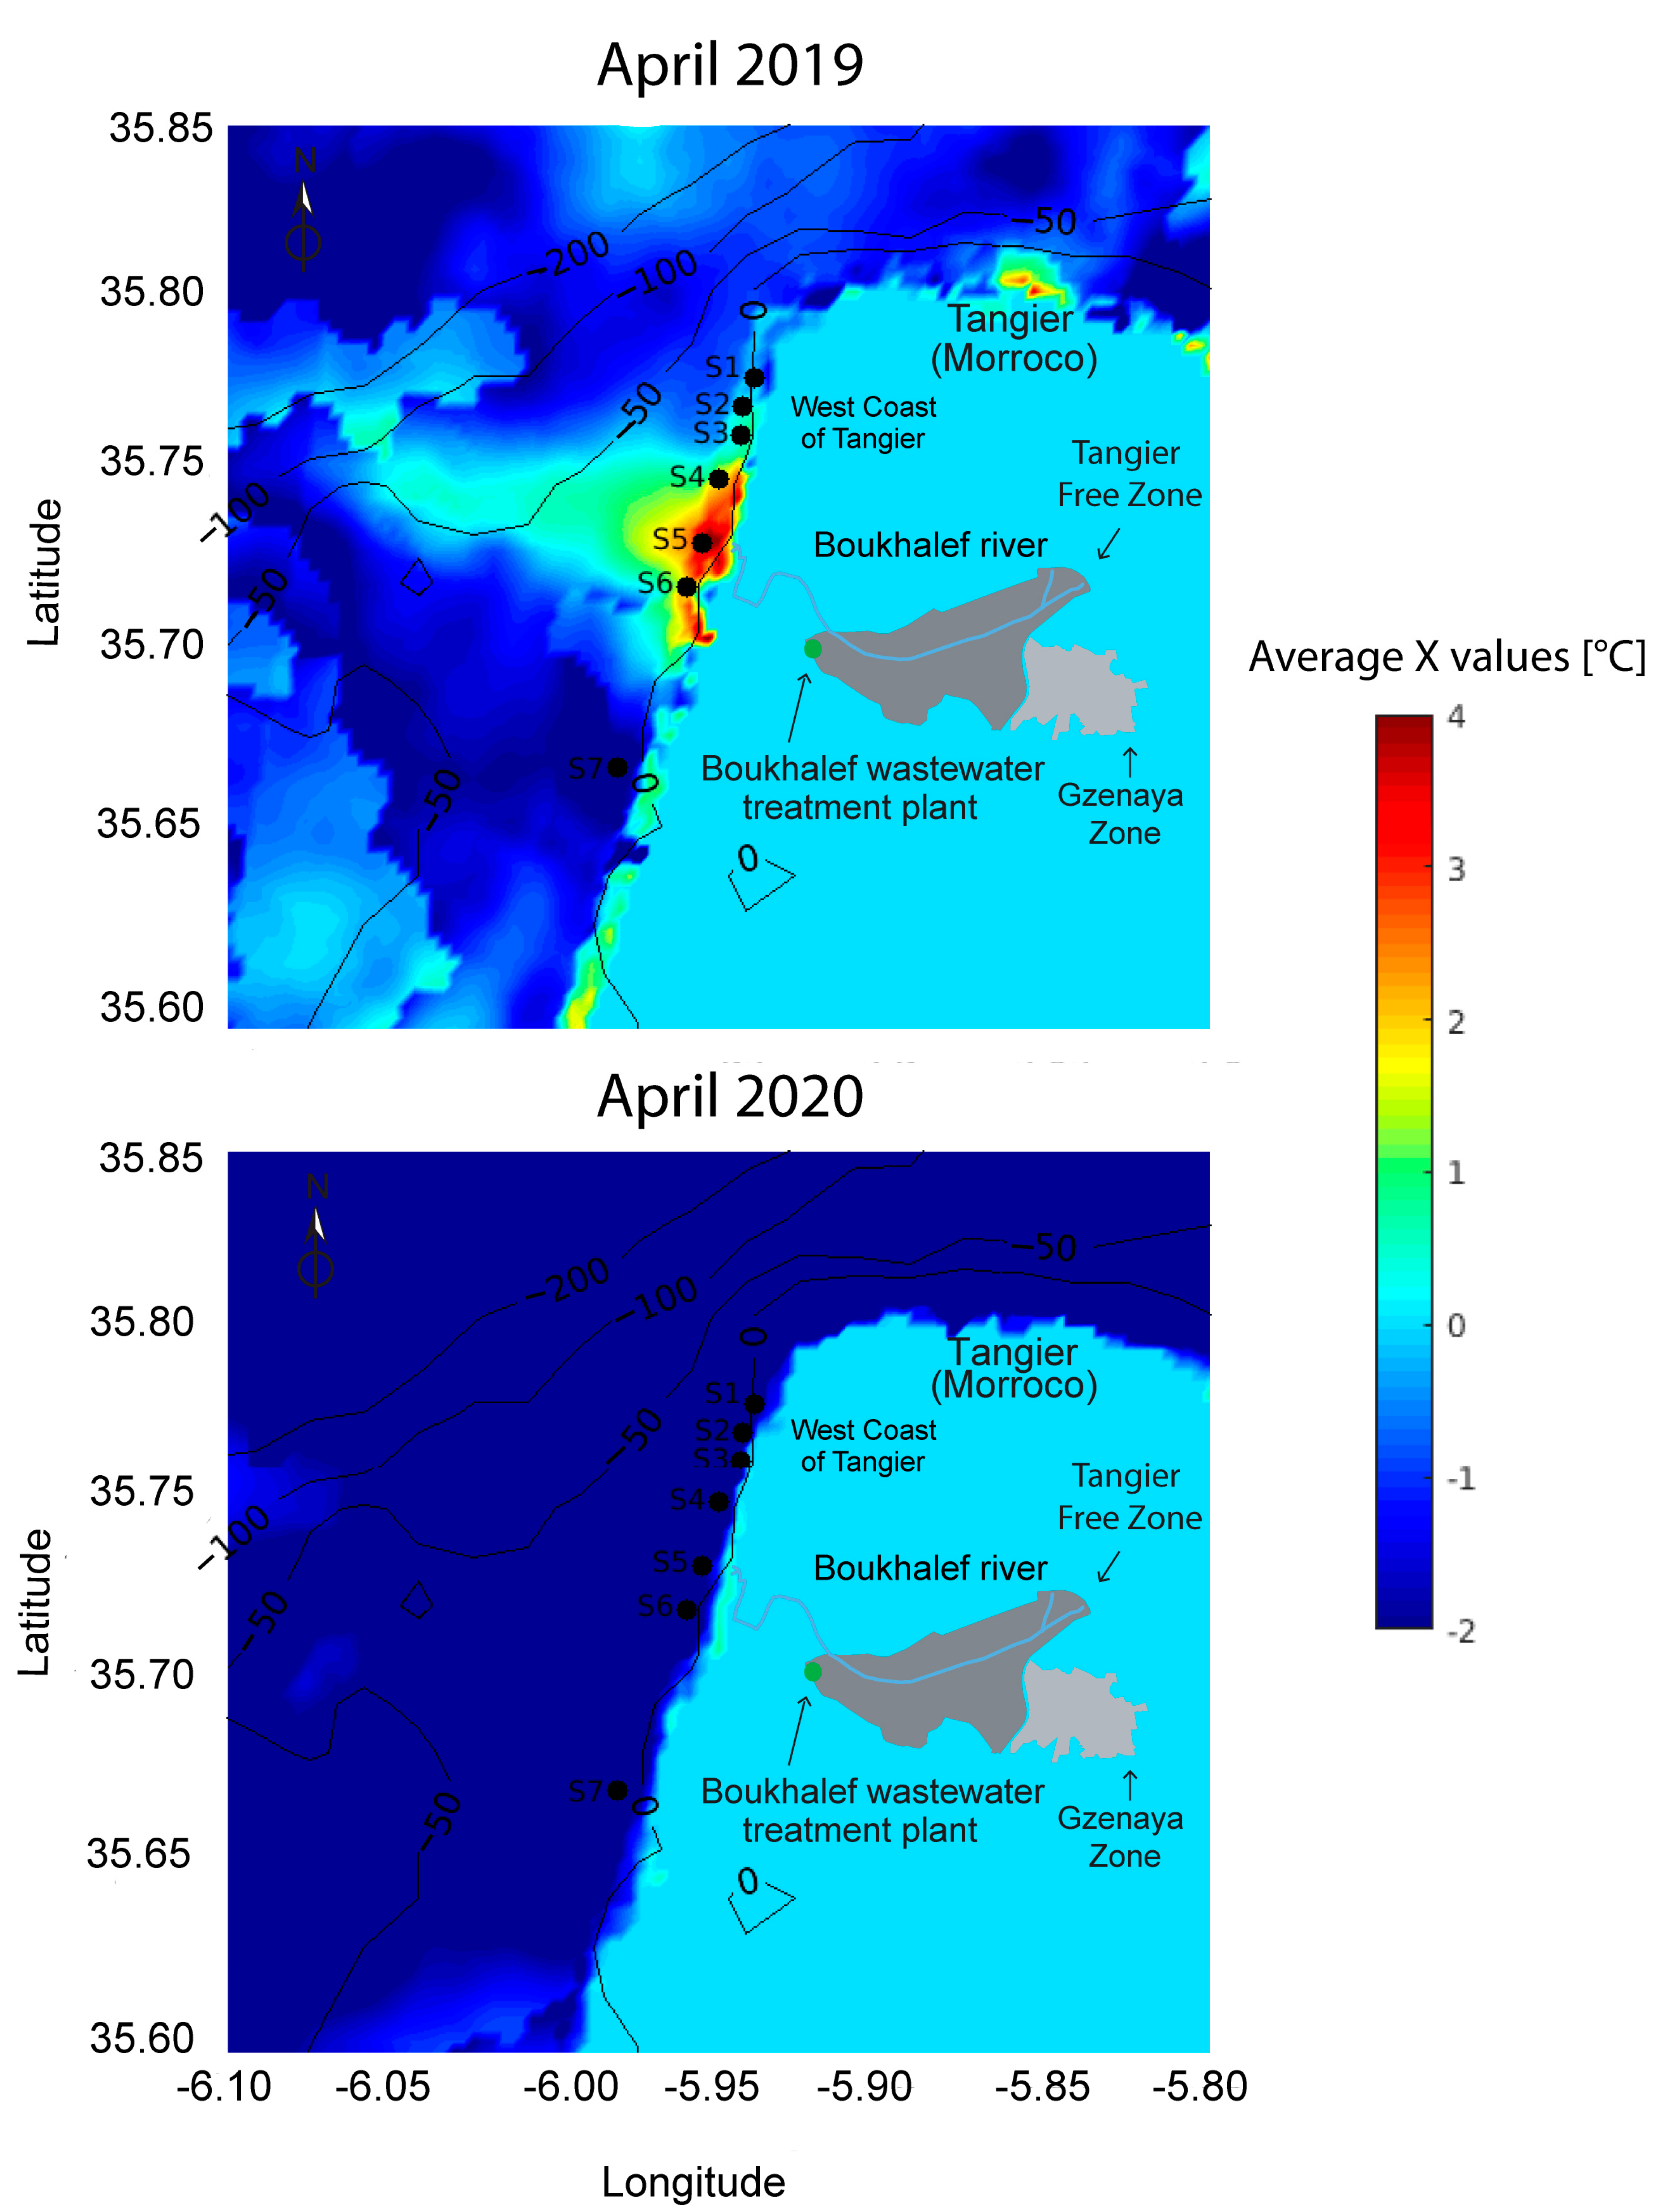
2.2.2. Visual Analysis

The WST data were analyzed using the Matlab environment. A sample image is presented in Figure 5. It depicts the temperature values represented by different colors, ranging from blue for low temperature to dark red for high temperature values.

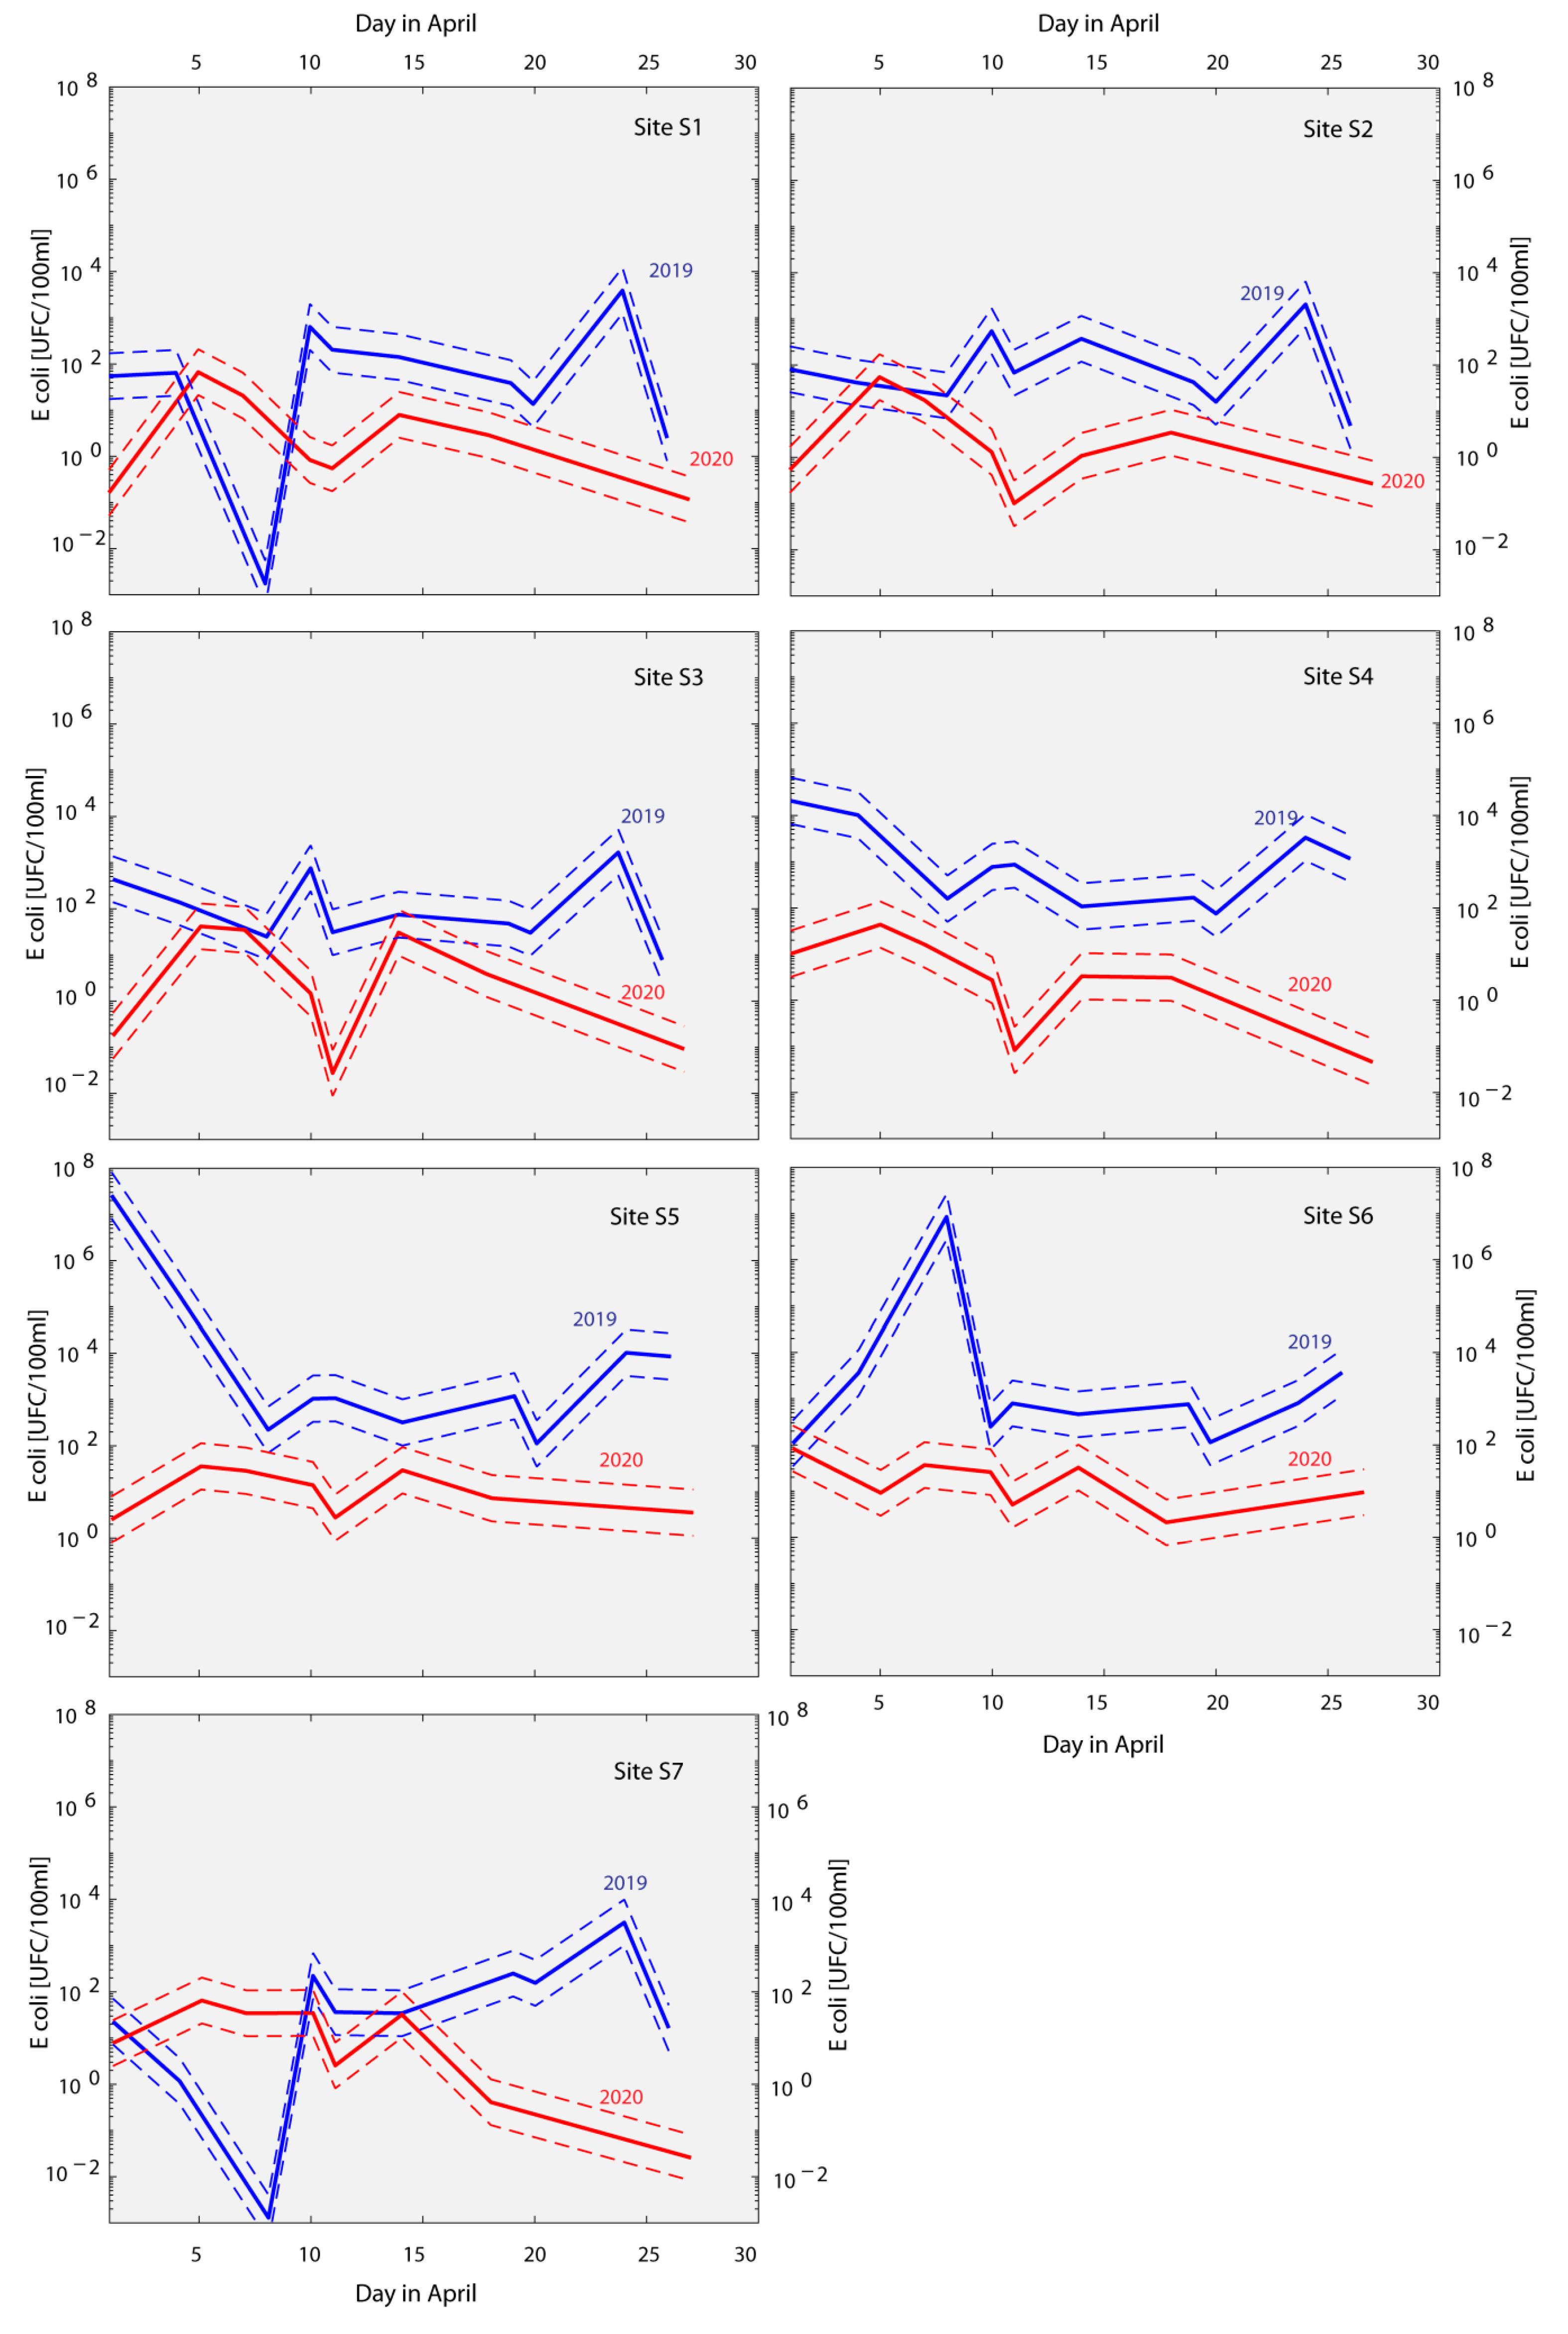
2.2.3. Coastal Water Quality Estimation

In order to determine the Tangier coastal water quality, the equation developed by Cherif et al., (2019) [4] was used. It is a linear model based on the correlation between bacteriological in situ measurements and thermal data from Landsat 8 satellite: Following the equation below (1), we first determined the value of variable X(*) and then calculated the estimated values of E. coli concentration (Y), including the root mean square deviation (RMSD). Quality classes were assigned following the Moroccan quality standards according to the Moroccan norm NM 03.7.200 [40] (see Table 2).
Y = 0.37 X + 2.4; RMSD = 0.5
where: X(*) = WST−Ta, Y = log10 [E. coli (UFC/100mL)].
Where WST represents the water surface temperature and Ta represents air temperature.
The air temperature (Ta) was obtained from the Tangier Ibn Batouta airport weather station (https://www.wunderground.com/history/daily/ma/hjarennhal/GMTT/date/2019-4-2).

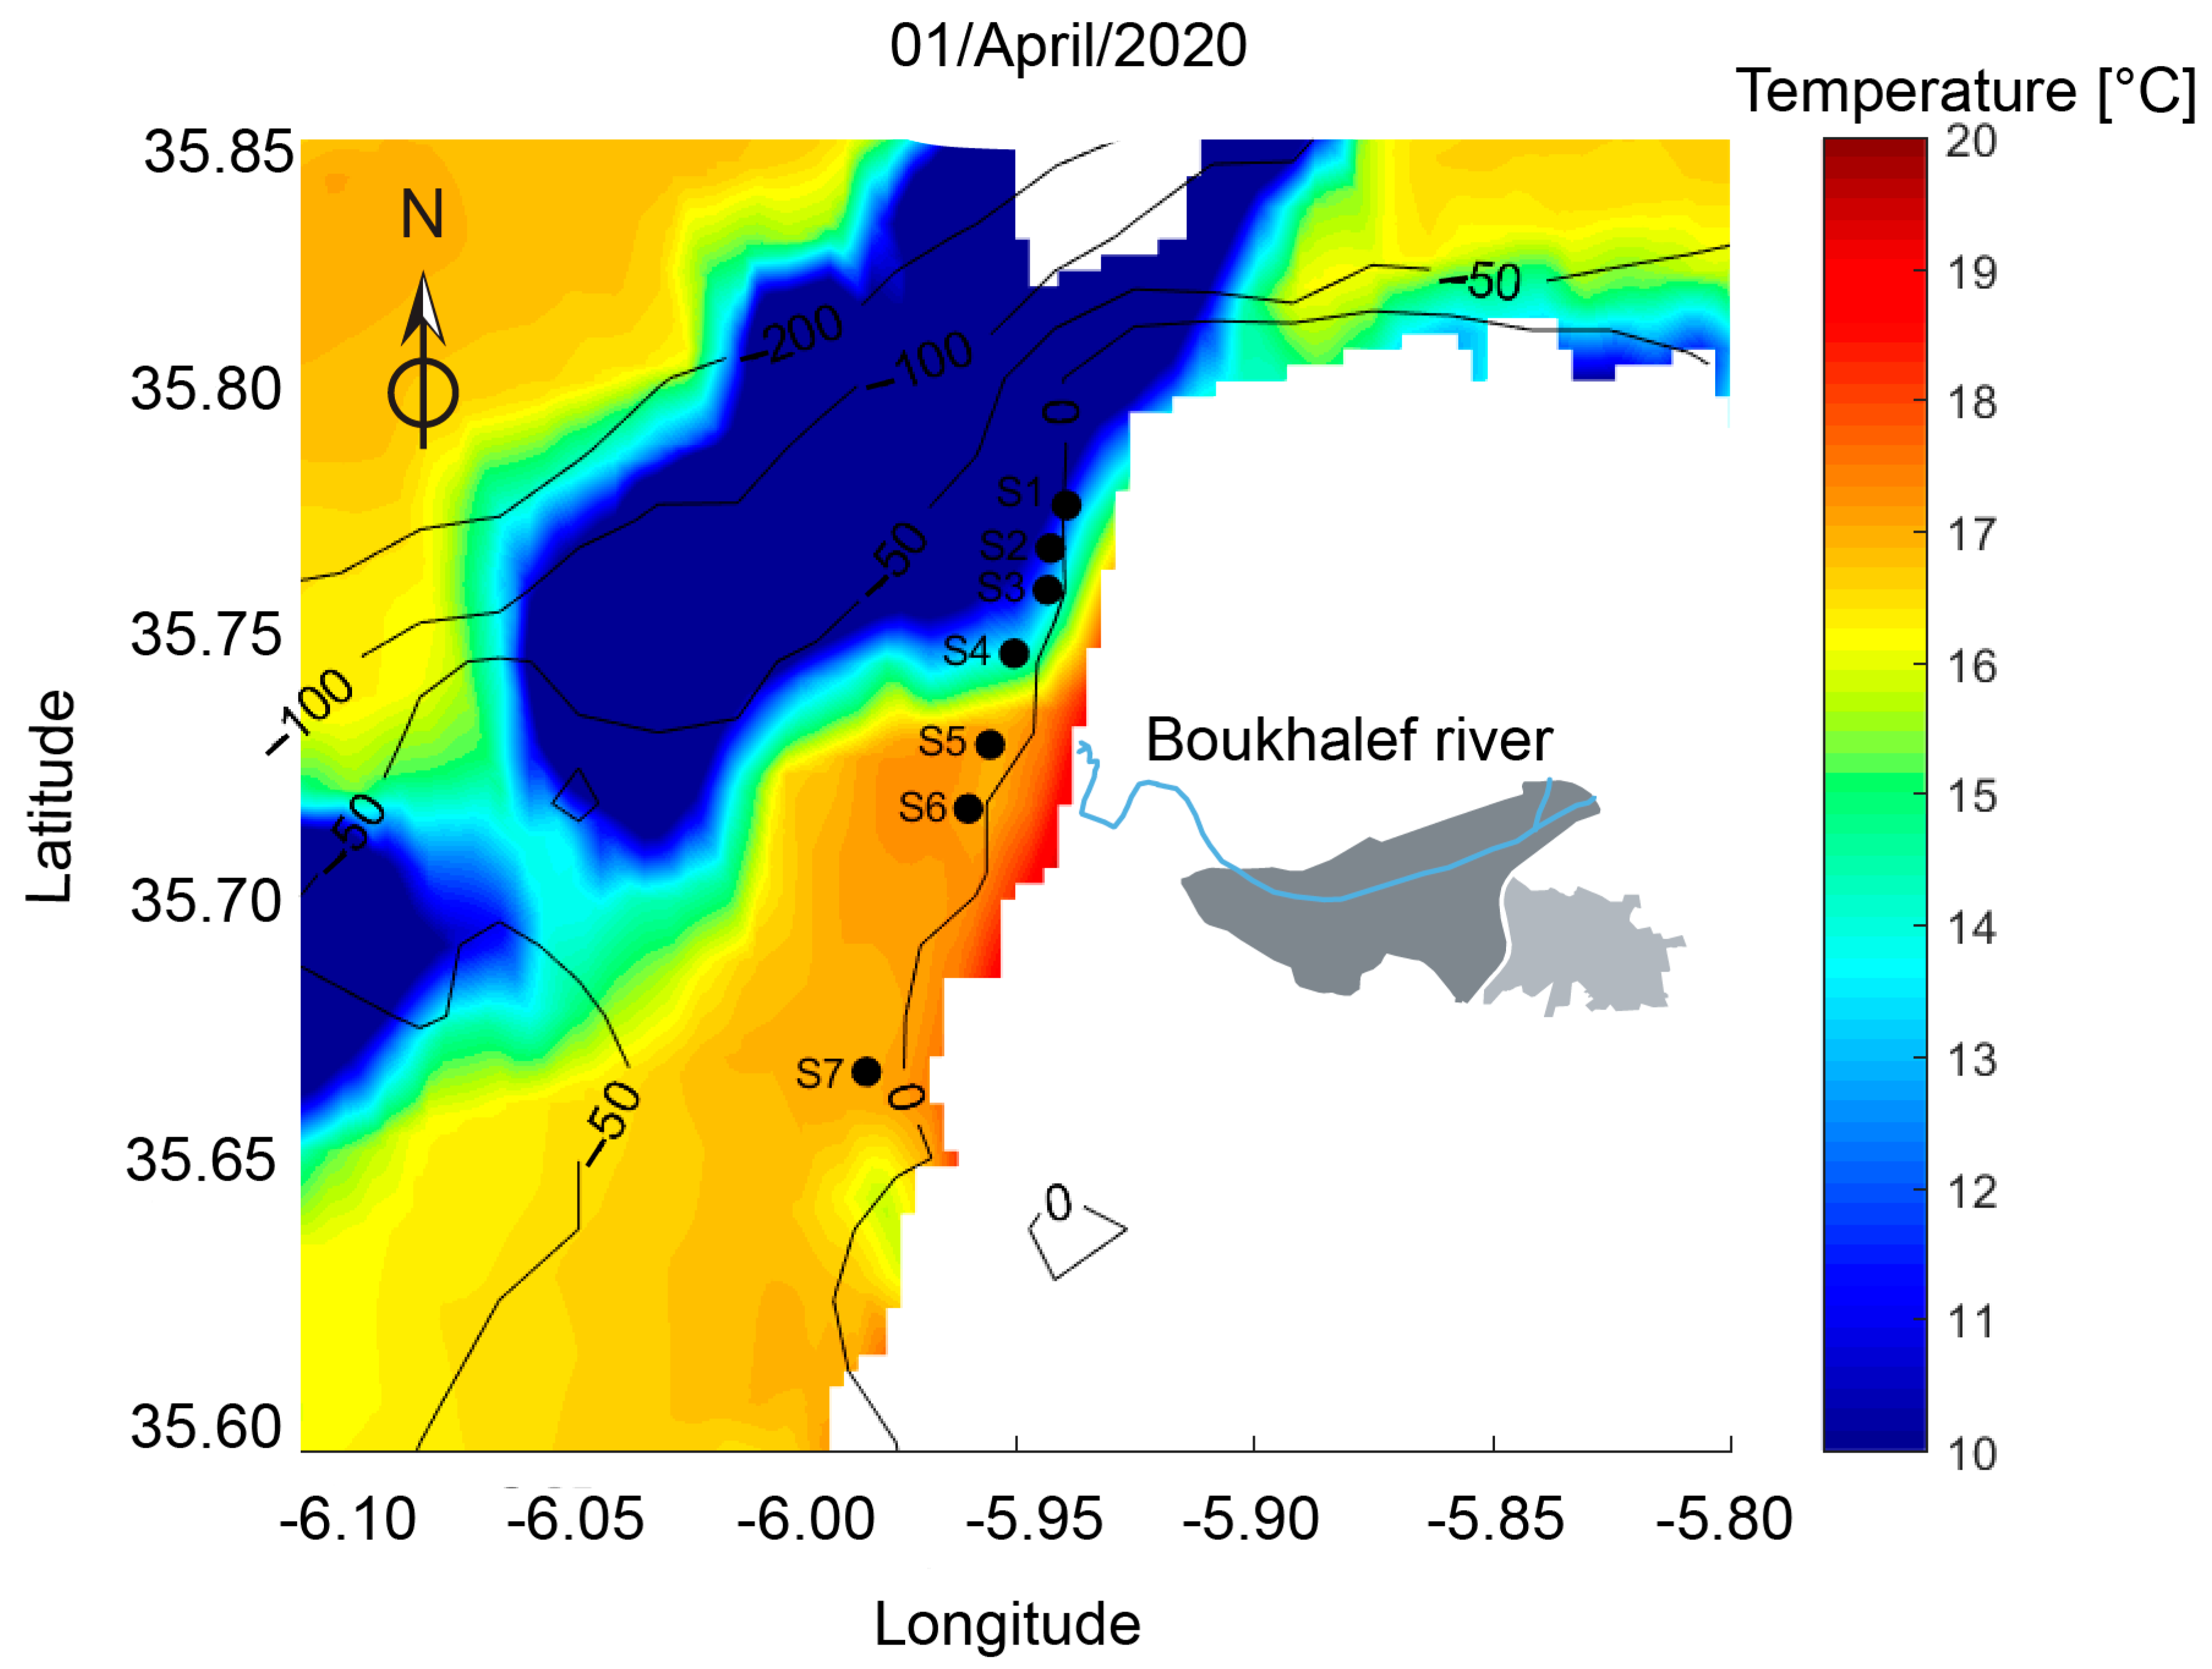
3. Results and Discussion

Given that RS WST data have already been used in an exploratory study to determine the coastal water quality in the north of Morocco [4], we tested the possibility of the developed linear equation (between E. coli and WST data) providing significant results for examining the impact of reduced industrial activities on the coastal water quality. The COVID-19 pandemic immobilized the TFZ and GZ activities, which presented a convenient opportunity to study the western Tangier coastal water quality in low wastewater outflow period. Since it was not possible to take in situ measurements, the Sentinel 3 data seemed to be an adequate tool to assess the possible change of bathing water quality in the studied area. The Sentinel 3 data have already proved useful in monitoring high levels of pollution in coastal areas, and presents a new tool for surveying the ocean [41,42], as well as the runoff of many river mouths [43].
The preliminary results of the western Tangier coastal water quality obtained by Cherif et al., (2019) [4] that were based on Landsat 8 imagery, namely, Thermal Infrared Sensor (TIRS) bands were analyzed to monitor a narrow strip of near-shore water where increased levels of pollution had been previously observed. The area of interest included the Boukhalef river mouth and both nearby beaches, Jbila and Sidikacem, as well as non-polluted waters at Sol, Bakacem, Achekar, and Diplomatic Forest beaches, which are quite distant from the river estuary. It was reported in a previous study carried out in this Tangier coastal area [5] that high spatial resolution images, such as those from ESA Sentinel 2 imaging spectrometer, often revealed patches of increased water reflectance values of the Boukhalef river mouth.
An observation example is given in Figure 6, which shows a WST Sentinel 3 acquisition dated on 5 April 2019 and 8 April 2020 (10h00m UTC). A closer inspection quickly reveals areas with very low WST values north and south of the Boukhalef estuary. Between those, an area of increased WST values is usually located and can be clearly seen in the April 2019 image (Figure 6, April 2019). In April 2020 this warm-water feature is missing and normal WST values were registered at all the sites (Figure 6, April 2020).
Figure 7 shows the WST variation in the Tangier western coastal waters over ten different days in April 2019 and eight different days in April 2020. Generally, the WST was characterized by differentiation and variation of values from the north to the south of the Boukhalef river mouth. In April 2019 the highest values of WST were registered at S4 (880 m from the river mouth), S5 (river mouth) and S6 (755 m from the river mouth), while lower values were recorded at S1 (5300 m from the river mouth), S2 (4600 m from the river mouth), S3 (4000 m from the river mouth) and S7 (6100 m from the river mouth) (Figure 7a). In April 2020 almost all sites registered similar WST values without a significant difference between S5 (river mouth) and other sites (Figure 7b). The April 2019 WST results (Figure 7a) are similar to those from 2017 [4]. These findings confirm that the Boukhalef outflow (S5) has a significant impact in Jbila and Sidikacem beaches (S4 and S6) [7]. A series of coastal water samples along the Atlantic were analyzed by the ministry of environment in 2019, which outlines in the final report the vulnerability of both beaches near the Boukhalef river mouth, especially Jbila [44]. However, the results from April 2020 (Figure 7b) demonstrate a significant change in WST values—especially in locations marked S4, S5, and S6. It is a well-known fact that high-temperature wastewater generated from industrial activities is among the main factors of increased ocean water surface temperature [45]. Thus, the observed decrease in temperature values in the studied stations is due to the reduction of the industrial effluent from the Boukhalef river mouth and the reduction of organic charge concentration in the Boukhalef river waters responsible for heavy bacterial contamination [31,46].
The difference in average X value (X = WST−Ta; input variable in Equation (1) is shown in Figure 8. In the left image (average X value in 2019), an area where the WST values are significantly higher than the air temperature is clearly visible—the river mouth (S5) as well as Jbila beach (S4) and Sidikacem beach (S6). While lower or similar WST values to the air temperature can be observed at Sol beach (S1), Bakacem beach (S2), Achekar beach (S3) and Diplomatic Forest beach (S7). The sites S1, S2, S3, S4, S5, S6, and S7 exhibit WST values lower than the air temperature during April 2020 (Figure 7, right).
According to Figure 8, the average difference of WST values and air temperature (X(*)) demonstrates the negative impact of the Boukhalef river waters, which discharge into the ocean (S5) after running along a heavily industrialized area (TFZ and GZ), in the western Tangier coastal water quality. The high-temperature values indicate a high organic pollution concentration in the Boukhalef river runoff and are in good agreement with Dahiya et Kaur, (1999) [47]. The increased near-coastal water temperature of up to 4 °C in 2019 compared to 2020 at the mouth of the Boukhalef river (Figure 8) is thus a result of the increased industrial activity/effluent during pre-Covid19 time. These results confirm the investigation results about the source of bathing water pollution in the area found by Cherif et al., (2019) [7]. On the other hand, this figure reflects the positive impact of the suspension of industrial activities on bathing water quality improvement in the investigated area.
Figure 9 exhibits the estimated variation of E. coli concentration using the linear model during April 2019 and April 2020 in the west coast of Tangier. The results indicate the presence of high concentrations of E. coli in coastal water sites during April 2019, while lower values of E. coli were recorded during April 2020. According to Schernewski et al., (2012) [48], in coastal and transitional waters, a “sufficient” water quality class allows a maximum of 500 (185) Escherichia coli (intestinal enterococci) colony-forming units (CFU)/100 mL based upon a 95-percentile valuation. For an “excellent” quality class, the highest level, a maximum of 250 (100) E. coli CFU/100 mL is tolerated. The values obtained during April 2020 are almost below 200 E. coli CFU/100 mL. In contrast, the E. coli values in April 2019 were high, confirming that the aforementioned coastal water sites are infected by the industrial wastewater (from TFZ and GZ), which is loaded with a high concentration of nutrient and organic matter responsible for the reproduction of bacteria [49] and demonstrate the existence of an anaerobic environment responsible for the release of bad odors [39,50].
Figure 10 shows the average coastal water quality class in the Tangier coast during April 2019 and 2020. The figure indicates that in April 2019 the S4, S5, and S6 were generally classified as the poorest class (C,D). This is in good accordance with Cherif et al., (2019) [4], and further confirms the negative impact of the TFZ and GZ on the bathing water quality in the area. Locations S1, S2, and S3 were classified as less polluted in most cases (A) and S7 was generally classified as B (Figure 9, April 2019).
The results for April 2020 (when almost 80% of the industrial activity in TFZ and GZ was suspended due to the COVID-19 related lockdown) are shown in Figure 9—all the sites were classified as A (good quality) (Figure 9, April 2020). This indicates the decrease of the TFZ and GZ wastewater discharge into the Boukhalef river and, consequently, the improvement of bathing water quality of the nearest sites to the Boukhalef river mouth (S5), S4 and S6 (Jbila and Sidikacem beaches).
There is a slight possibility that our results could be influenced by an unusually low temperature or unusually low flow rate of the Boukhalef river. To eliminate this possibility we compared the average air temperature at Ibn Batouta airport weather station (used as a proxy for river water temperature) in April 2019 (Ta = 20 °C) with the average air temperature in April 2020 (Ta = 19.5 °C). We would also like to emphasize that the air temperature (proxy for river temperature) has already been taken into account in our linear model (Equation (1), value X(*)) in order to reduce the sensitivity of results to river water temperature. The average precipitation in the Boukhalef watershed was 66 mm in April 2019 and 67 mm in 2020 (Agence du Bassin Hydraulique du Loukkos, Morocco—private communication). Similarly the weather station in Tangier registered 99.1 mm of rain in April 2019 and 91.7 mm of rain in April 2020 (Agence du Bassin Hydraulique du Loukkos, Morocco—private communication). Based on the precipitation measurements we can conclude that the flow rate was similar in both years.
Our results exposed the coastal waters quality status before and during the COVID-19 pandemic using Sentinel 3 data. The use of satellite imagery also enabled us to study the spatial extent of the impact of the industrial zones (TFZ and GZ) on the bathing water quality in one of the most important touristic destinations in northern Morocco. The Sentinel 3 WST offers suitable daily images that help observing the coastal changing conditions. However, it is important to take into account the cloud obstruction, which is sometimes masking our study area. The results obtained confirm the fact that the lockdown caused by COVID-19 was an excellent occasion to assess the industrial activity impacts on the western coastal waters of Tangier. According to Wang and Su, (2020) [51], declining human activities lead to decreasing pollution levels and, consequently, the safety measures taken to fight the pandemic were a benefit to the environment. Several studies have also confirmed the positive impacts of the imposed industrial activities halt on the environment quality [20,52,53,54,55]. In the most polluted river in India (Vembanad lake), the suspended particular matter concentration was reduced by 15.9% after halting human activities due to COVID-19 [56]. Similar results have been found in a coastal industrial zone in south India which has experienced a significant decrease of pollutants owing to the reduced wastewater discharges from industrial units during the imposed lockdown [57]. Other studies have also proved that the lockdown caused by COVID-19 spread has contributed to the reduction of pollution levels in coastal areas [58,59,60,61]. Hence, these findings in combination with our work present a clear picture of the impact of economic activities on the environment and provide a baseline reference for future studies assessing the possible reduction of pollution levels in the world’s coastal waters.

4. Conclusions

The COVID-19 pandemic and its subsequent control measures led to a significant reduction in industrial activities in the Tangier Free Zone (TFZ) and Gzenaya Zone (GZ) which are significant contributors to the pollution of the Boukhalef river. The latter discharges into the Atlantic ocean close to several popular bathing locations. Due to unprecedented reduction in industrial activity and lack of in-situ data, the COVID-19 lockdown presented a perfect opportunity to use remote sensing and our linear model [4] to estimate changes in coastal waters pollution.
It was somewhat expected that the decline in industrial activity would contribute to the improvement of bathing water quality in the area around the Boukhalef river estuary, but the degree of change is truly remarkable. Not only is the change clearly visible through satellite images but, according to our results, all points of interest could be marked with the A quality class at all observed periods during the COVID-19 related lockdown. One year ago, these same locations exhibited many cases marked with a C, or even D, quality class during the same period.
Through our study, we demonstrated the usefulness of the Sentinel-3 sea surface temperature (SST) images in water quality applications. By using the method introduced by Cherif et al., (2019) [4], the obtained SST and air temperature can be converted directly to E. coli concentrations. The method has been calibrated and tested on the Atlantic coast of Tangier but could be used in any similar location with proper recalibration.
Our work shows that satellite SST measurements represent a viable low-cost solution for bathing water quality monitoring and could be used in combination with field sampling. The demonstrated reliability of satellite-derived sea water temperature as a proxy for E. coli concentration would reduce the required frequency of costly field campaigns. The high frequency of Sentinel 3 passes and high image resolution make it especially suitable for such purposes. Such an approach could also serve as a primary component of a potential early warning system. An optimal system, however, would consist of a regional high-resolution ocean model with SST assimilation and input from a hydrological station near the Boukhalef river mouth, which would provide real-time outflow and water temperature measurements. Such a system would ensure continuous water quality estimates even in periods with poor satellite coverage due to cloudiness.
The results of this study show that the intensity of industrial activity has a strong effect on the bathing water quality in the area surrounding the Boukhalef river estuary. With more accurate data on the rate of activity in each of the industrial units in both study periods, our results could be used for evaluating the effects of future environmental policies and limitations imposed on different industrial sectors on the water quality in the area.

Author Contributions

E.K.C. proposed the idea and conceived and designed the experiment; E.K.C. and H.B. performed the experiment; E.K.C. analyzed the data; E.K.C., H.B., M.V., J.C.G.E.d.S., N.M., and S.S. wrote the paper. All authors have read and agreed to the published version of the manuscript.

Funding

This research received no external funding.

Acknowledgments

The authors would like to thank all the researchers who have worked hard to advance knowledge and improve outcomes of seawater quality evaluation. Great gratitude goes to the European organization for meteorological satellites (EUMETSAT) website (https://coda.eumetsat.int/#/home) for providing the ocean Sentinel 3 data. We would like to thank also the Moroccan authorities for providing the weather data, especially Willaya Tangier-Tetouan-Al-Hocaima and the Agence du Bassin Hydraulique du Loukkos, Morocco (http://www.abhloukkos.ma/index.php/fr/). El Khalil Cherif was supported in part by the Deep Blue Project. Martin Vodopivec would like to acknowledge the financial support from the Slovenian Research Agency (research core funding No. P1-0237 and project No. Z7-1884). We would also like to thank the editor and the reviewers for their comments which helped us improve the paper. We also like to acknowledge to FCT (Fundação para a Ciência e Tecnologia) the National budget of project UIDB/00081/2020.

Conflicts of Interest

The authors declare no conflict of interest.

References

  1. Henrickson, S.E.; Wong, T.; Allen, P.; Ford, T.; Epstein, P.R. Marine swimming-related illness: Implications for monitoring and environmental policy. Environ. Health Perspect. 2001, 109, 645–650. [Google Scholar] [CrossRef] [PubMed]
  2. Sündermann, J. Survey: Sources, paths and effects of marine pollution. In Pollution of the Sea—Prevention and Compensation; Springer: New York, NY, USA, 2007; pp. 7–14. [Google Scholar]
  3. Craig-Smith, S.J.; Tapper, R.; Font, X. The coastal and marine environment. In Tourism and Global Environmental Change; Routledge: London, UK, 2006; pp. 121–141. [Google Scholar]
  4. Cherif, E.K.; Salmoun, F.; Mesas-Carrascosa, F.J. Determination of Bathing Water Quality Using Thermal Images Landsat 8 on the West Coast of Tangier: Preliminary Results. Remote Sens. 2019, 11, 972. [Google Scholar] [CrossRef] [Green Version]
  5. Cherif, E.K.; Salmoun, F.; El Yemlahi, A.; Magalhaes, J.M. Monitoring Tangier (Morocco) coastal waters for As, Fe and P concentrations using ESA Sentinels-2 and 3 data: An exploratory study. Reg. Stud. Mar. Sci. 2019, 32, 100882. [Google Scholar] [CrossRef]
  6. Cherif, E.K.; Salmoun, F. Diagnostic of the environmental situation of the west coast of Tangier. J. Mater. Environ. Sci. 2018, 8, 631–640. [Google Scholar]
  7. Cherif, E.K.; Salmoun, F.; Nouayti, N. Sources of Bathing Water Pollution in the West Coast of Tangier, Morocco: Effects of Industrial Zones. Multidiscip. Digit. Publ. Inst. Proc. 2019, 16, 30. [Google Scholar] [CrossRef] [Green Version]
  8. Cazenave, A.; Benveniste, J.; Champollion, N.; Le Cozannet, G.; Woodworth, P.; Ablain, M.; Becker, M.; Ciccarelli, S.; Jevrejeva, S.; Leornardi, N.; et al. Monitoring the evolution of coastal zones under various forcing factors using space-based observing systems. In Proceedings of the Regional Sea Level Changes and Coastal Impacts, New York, NY, USA, 10–14 July 2017. [Google Scholar]
  9. Chapman, D.V.; World Health Organization. Water Quality Assessments: A Guide to the Use of Biota, Sediments and Water in Environmental Monitoring; CRC PRESS: Boca Raton, FL, USA, 1996. [Google Scholar]
  10. Callahan, K.M.; Taylor, D.J.; Sobsey, M.D. Comparative survival of hepatitis A virus, poliovirus and indicator viruses in geographically diverse seawaters. Water Sci. Technol. 1995, 31, 189–193. [Google Scholar] [CrossRef]
  11. Craig, D.L.; Fallowfield, H.J.; Cromar, N.J. Use of microcosms to determine persistence of Escherichia coli in recreational coastal water and sediment and validation with in situ measurements. J. Appl. Microbiol. 2004, 96, 922–930. [Google Scholar] [CrossRef]
  12. Mallin, M.A.; Williams, K.E.; Esham, E.C.; Lowe, R.P. Effect of Human Development on Bacteriological Water Quality in Coastal Watersheds. Ecol. Appl. 2000, 10, 1047–1056. [Google Scholar] [CrossRef]
  13. Gholizadeh, M.; Melesse, A.; Reddi, L. A Comprehensive Review on Water Quality Parameters Estimation Using Remote Sensing Techniques. Sensors 2016, 16, 1298. [Google Scholar] [CrossRef] [Green Version]
  14. Zhu, N.; Zhang, D.; Wang, W.; Li, X.; Yang, B.; Song, J.; Zhao, X.; Huang, B.; Shi, W.; Lu, R. A novel coronavirus from patients with pneumonia in China, 2019. N. Engl. J. Med. 2020. [Google Scholar] [CrossRef]
  15. WHO. Critical Preparedness, Readiness and Response Actions for COVID-19: Interim Guidance, 22 March 2020; World Health Organization: Geneva, Switzerland, 2020. [Google Scholar]
  16. WHO. Novel Coronavirus (VoCn-2019): Situation Report 3; World Health Organization: Geneva, Switzerland, 2020. [Google Scholar]
  17. Dantas, G.; Siciliano, B.; França, B.B.; da Silva, C.M.; Arbilla, G. The impact of COVID-19 partial lockdown on the air quality of the city of Rio de Janeiro, Brazil. Sci. Total Environ. 2020, 729, 139085. [Google Scholar] [CrossRef] [PubMed]
  18. He, L.; Zhang, S.; Hu, J.; Li, Z.; Zheng, X.; Cao, Y.; Xu, G.; Yan, M.; Wu, Y. On-road emission measurements of reactive nitrogen compounds from heavy-duty diesel trucks in China. Environ. Pollut. 2020, 2020, 114280. [Google Scholar] [CrossRef] [PubMed]
  19. Kerimray, A.; Baimatova, N.; Ibragimova, O.P.; Bukenov, B.; Kenessov, B.; Plotitsyn, P.; Karaca, F. Assessing air quality changes in large cities during COVID-19 lockdowns: The impacts of traffic-free urban conditions in Almaty, Kazakhstan. Sci. Total Environ. 2020, 2020, 139179. [Google Scholar] [CrossRef] [PubMed]
  20. Mahato, S.; Pal, S.; Ghosh, K.G. Effect of lockdown amid COVID-19 pandemic on air quality of the megacity Delhi, India. Sci. Total Environ. 2020, 2020, 139086. [Google Scholar] [CrossRef]
  21. Nakada, L.Y.K.; Urban, R.C. COVID-19 pandemic: Impacts on the air quality during the partial lockdown in São Paulo state, Brazil. Sci. Total Environ. 2020, 2020, 139087. [Google Scholar] [CrossRef]
  22. Shrestha, A.M.; Shrestha, U.B.; Sharma, R.; Bhattarai, S.; Tran, H.N.T.; Rupakheti, M. Lockdown Caused by COVID-19 Pandemic Reduces Air Pollution in Cities Worldwide. 2020. Available online: https://eartharxiv.org/edt4j/ (accessed on 30 April 2020).
  23. Tobías, A.; Carnerero, C.; Reche, C.; Massagué, J.; Via, M.; Minguillón, M.C.; Alastuey, A.; Querol, X. Changes in air quality during the lockdown in Barcelona (Spain) one month into the SARS-CoV-2 epidemic. Sci. Total Environ. 2020, 2020, 138540. [Google Scholar] [CrossRef]
  24. Li, L.; Li, Q.; Huang, L.; Wang, Q.; Zhu, A.; Xu, J.; Liu, Z.; Li, H.; Shi, L.; Li, R. Air quality changes during the COVID-19 lockdown over the Yangtze River Delta Region: An insight into the impact of human activity pattern changes on air pollution variation. Sci. Total Environ. 2020, 2020, 139282. [Google Scholar] [CrossRef]
  25. Lal, P.; Kumar, A.; Kumar, S.; Kumari, S.; Saikia, P.; Dayanandan, A.; Adhikari, D.; Khan, M.L. The dark cloud with a silver lining: Assessing the impact of the SARS COVID-19 pandemic on the global environment. Sci. Total Environ. 2020, 2020, 139297. [Google Scholar] [CrossRef]
  26. ESA Coronavirus: Nitrogen Dioxide Emissions drop Over Italy. Available online: https://www.esa.int/ESA_Multimedia/Videos/2020/03/Coronavirus_nitrogen_dioxide_emissions_drop_over_Italy (accessed on 26 May 2020).
  27. Van Donkelaar, A.; Martin, R.V.; Brauer, M.; Kahn, R.; Levy, R.; Verduzco, C.; Villeneuve, P.J. Global estimates of ambient fine particulate matter concentrations from satellite-based aerosol optical depth: Development and application. Environ. Health Perspect. 2010, 118, 847–855. [Google Scholar] [CrossRef] [Green Version]
  28. UNDP, UNECA and World BANK. Social & Economic Impact of the COVID 19 Crisis on Morocco. Recherche Google. 2020. Available online: http://pubdocs.worldbank.org/en/852971598449488981/ENG-The-Social-and-Economic-Impact-of-the-Covid-19-Crisis-in-Morocco.pdf (accessed on 4 June 2020).
  29. Hahn, T.; Auktor, G.V. The Effectiveness of Morocco’s Industrial Policy in Promoting a National Automotive Industry; Discussion Paper; Deutsches Institut für Entwicklungspolitik (DIE): Bonn, Germany, 2017. [Google Scholar]
  30. Sabri, H.; Cherifi, O.; Maarouf, A.; Cheggour, M.; Bertrand, M.; Mandi, L. Wastewater impact on macroalgae biodiversity in Essaouira coast (Morocco). J. Mater. Environ. Sci. 2017, 8, 862. [Google Scholar]
  31. Chaouay, A.; Bazzi, L.; Hilali, M.; Alla, A.A.; El Mouaden, K. Study of bacterial contamination of the Bay of Agadir Impact on the resistance of copper’s corrosion. J. Mater. Environ. Sci. 2014, 5, 2472–2477. [Google Scholar]
  32. Mejjad, N.; Laissaoui, A.; El-Hammoumi, O.; Fekri, A.; Amsil, H.; El-Yahyaoui, A.; Benkdad, A. Geochemical, radiometric, and environmental approaches for the assessment of the intensity and chronology of metal contamination in the sediment cores from Oualidia lagoon (Morocco). Environ. Sci. Pollut. Res. 2018, 25, 22872–22888. [Google Scholar] [CrossRef]
  33. Er-Raioui, H.; Khannous, S.; Cheihk, M.; Ould, M.; Mhamada, M.; Bouzid, S. The Moroccan Mediterranean coastline: A potential threatened by the urban discharges. Open Environ. Pollut. Toxicol. J. 2012, 3, 23–36. [Google Scholar] [CrossRef]
  34. Cherif, E.K.; Salmoun, F. Contribution of remote sensing and bacteriological analysis for the quality of bathing waters on the west coast of Tangier. Coast. Marit. Mediterr. Conf. 2017, 4, 105–1010. [Google Scholar]
  35. Marsalek, J.; Rochfort, Q. Urban wet-weather flows: Sources of fecal contamination impacting on recreational waters and threatening drinking-water sources. J. Toxicol. Environ. Health A 2004, 67, 1765–1777. [Google Scholar] [CrossRef]
  36. Sauer, E.P.; VandeWalle, J.L.; Bootsma, M.J.; McLellan, S.L. Detection of the human specific Bacteroides genetic marker provides evidence of widespread sewage contamination of stormwater in the urban environment. Water Res. 2011, 45, 4081–4091. [Google Scholar] [CrossRef]
  37. Molina, M.; Hunter, S.; Cyterski, M.; Peed, L.A.; Kelty, C.A.; Sivaganesan, M.; Mooney, T.; Prieto, L.; Shanks, O.C. Factors affecting the presence of human-associated and fecal indicator real-time quantitative PCR genetic markers in urban-impacted recreational beaches. Water Res. 2014, 64, 196–208. [Google Scholar] [CrossRef]
  38. Aouarram, A.; Galindo, M.D.; El Mai, H.; Vicente, J.J.; Garcia-Vargas, M.; Stitou, M.; El Yousfi, F.; Ammari, M.; Ben Allal, L.; Granado, M.D. Distribution and source of trace metals in coastal water of the bay of Tangier (north west Morocco). Fresenius Environ. Bull. 2008, 17, 1688–1696. [Google Scholar]
  39. Ahmaruzzaman, M. Industrial wastes as low-cost potential adsorbents for the treatment of wastewater laden with heavy metals. Adv. Colloid Interface Sci. 2011, 166, 36–59. [Google Scholar] [CrossRef]
  40. IMANOR. Standards for Monitoring Bathing Water Quality; IMANOR: Rabat, Morocco, 1998. [Google Scholar]
  41. Peng, F.; Deng, X. Validation of Sentinel-3A SAR mode sea level anomalies around the Australian coastal region. Remote Sens. Environ. 2020, 237, 111548. [Google Scholar] [CrossRef]
  42. Arabi, B.; Salama, M.S.; Pitarch, J.; Verhoef, W. Integration of in-situ and multi-sensor satellite observations for long-term water quality monitoring in coastal areas. Remote Sens. Environ. 2020, 239, 111632. [Google Scholar] [CrossRef]
  43. Xu, L.; Wang, T.; Wang, J.; Lu, A. Occurrence, speciation and transportation of heavy metals in 9 coastal rivers from watershed of Laizhou Bay, China. Chemosphere 2017, 173, 61–68. [Google Scholar] [CrossRef] [PubMed]
  44. Ministry of the Environment La Surveillance de la Qualité des Eaux de Baignade des Plages du Royaume-Rapport National. 2019. Available online: http://www.environnement.gov.ma/fr/zones-cotieres?id=222 (accessed on 29 June 2020).
  45. Fisher, J.I.; Mustard, J.F. High spatial resolution sea surface climatology from Landsat thermal infrared data. Remote Sens. Environ. 2004, 90, 293–307. [Google Scholar] [CrossRef]
  46. El Attiffi El Ouadrassi, A. La Qualité Microbiologique des Eaux de Baignade. Ph.D. Thesis, University Med V, Rabat, Morocco, 2011. [Google Scholar]
  47. Dahiya, S.; Kaur, A. Assessment of physico-chemical characteristics of underground water in rural area of Tosham sub-division Bhiwani district, Haryana. J. Environ. Pollut. 1999, 6, 281–288. [Google Scholar]
  48. Schernewski, G.; Fischer, E.; Huttula, T.; Jost, G.; Ras, M. Simulation tools to support bathing water quality management: Escherichia coli bacteria in a Baltic lagoon. J. Coast. Conserv. 2012, 16, 473–488. [Google Scholar] [CrossRef]
  49. Rodier, J.; Legube, B.; Merlet, N.; Brunet, R. L’analyse de L’eau-9e éd.: Eaux Naturelles, Eaux Résiduaires, Eau de Mer; Dunod: Paris, France, 2009. [Google Scholar]
  50. Choo-Kun, M. Integration of Sludge Anaerobic Digestion in an Alternative Wastewater Treatment Line Based on the A/B Process: Towards the Energy Positive Wastewater Treatment Plant. Ph.D. Thesis, INSA de Lyon, Villeurbanne, France, 2015. [Google Scholar]
  51. Wang, Q.; Su, M. A preliminary assessment of the impact of COVID-19 on environment—A case study of China. Sci. Total Environ. 2020, 2020, 138915. [Google Scholar] [CrossRef]
  52. Zambrano-Monserrate, M.A.; Ruano, M.A.; Sanchez-Alcalde, L. Indirect effects of COVID-19 on the environment. Sci. Total Environ. 2020, 2020, 138813. [Google Scholar] [CrossRef]
  53. Dutheil, F.; Baker, J.S.; Navel, V. COVID-19 as a factor influencing air pollution? Environ. Pollut. Barking Essex 2020, 2020, 114466. [Google Scholar] [CrossRef]
  54. Saadat, S.; Rawtani, D.; Hussain, C.M. Environmental perspective of COVID-19. Sci. Total Environ. 2020, 2020, 138870. [Google Scholar] [CrossRef]
  55. Bao, R.; Zhang, A. Does lockdown reduce air pollution? Evidence from 44 cities in northern China. Sci. Total Environ. 2020, 2020, 139052. [Google Scholar] [CrossRef]
  56. Yunus, A.P.; Masago, Y.; Hijioka, Y. COVID-19 and surface water quality: Improved lake water quality during the lockdown. Sci. Total Environ. 2020, 2020, 139012. [Google Scholar] [CrossRef]
  57. Selvam, S.; Jesuraja, K.; Venkatramanan, S.; Chung, S.Y.; Roy, P.D.; Muthukumar, P.; Kumar, M. Imprints of pandemic lockdown on subsurface water quality in the coastal industrial city of Tuticorin, south India: A revival perspective. Sci. Total Environ. 2020, 2020, 139848. [Google Scholar] [CrossRef]
  58. Ormaza-González, F.; Castro-Rodas, D. COVID-19 Impacts on Beaches and Coastal Water Pollution: Management Proposals Post-Pandemic. 2020. Available online: https://www.preprints.org/manuscript/202006.0186/v1 (accessed on 9 September 2020).
  59. Garg, V.; Aggarwal, S.P.; Chauhan, P. Changes in turbidity along Ganga River using Sentinel-2 satellite data during lockdown associated with COVID-19. Geomat. Nat. Hazards Risk 2020, 11, 1175–1195. [Google Scholar] [CrossRef]
  60. Clifford, C. The Water in Venice, Italy’s Canals is Running Clear Amid the COVID-19 Lockdown—Take a Look. Available online: https://www.cnbc.com/2020/03/18/photos-water-in-venice-italys-canals-clear-amid-covid-19-lockdown.html (accessed on 2 September 2020).
  61. Häder, D.-P.; Banaszak, A.T.; Villafañe, V.E.; Narvarte, M.A.; González, R.A.; Helbling, E.W. Anthropogenic pollution of aquatic ecosystems: Emerging problems with global implications. Sci. Total Environ. 2020, 713, 136586. [Google Scholar] [CrossRef]
Figure 1. Study area on the west coast of Tangier, northern Morocco (a) with the location of seven surveying stations, the Boukhalef river, Boukhalef wastewater treatment station, and the two industrial zones (Tangier Free Zone and Gzenaya Zone) (b).
Water 12 02638 g001
Figure 2. Map showing the two industrial zones (Tangier Free Zone (TFZ) and Gzenaya Zone (GZ)) with their surroundings. Boukhalef river mouth, Sidikacem beach and Atlantic ocean in the west, the two urban zones, Hajryine and Hassani, the Tahadart watershed in the south, the rural commune Tangier Medina in the east and the Ibn Batouta airport in the north.
Water 12 02638 g002
Figure 3. Flowchart of the Tangier western coastal water quality investigation using Sentinel 3 water surface temperature (WST) data.
Water 12 02638 g003
Figure 4. Workflow of extracting sea surface temperature (SST) from WST products in SNAP (Sentinel Application Platform) software.
Water 12 02638 g004
Figure 5. A preview of the sea surface temperature band included in the WST product.
Water 12 02638 g005
Figure 6. Observations of water surface temperature (°C) on the west coast of Tangier, northern Morocco, April 2019 and 2020.
Water 12 02638 g006
Figure 7. The variation of the water surface temperature (°C) values in the west coast of Tangier, northern Morocco, dated April 2019 (a) and April 2020 (b).
Water 12 02638 g007
Figure 8. Average X (WST−Ta (air temperature)) in April 2019 and 2020 along the west coast of Tangier, Morocco.
Water 12 02638 g008
Figure 9. The variation of the E. coli estimated values (note the logarithmic scale) in the west coast of Tangier, northern Morocco, during April 2019 and 2020. The solid lines show the estimated value while the dotted lines mark the root mean square deviation (RMSD) of the linear model (1).
Water 12 02638 g009
Figure 10. The average coastal water quality in Tangier and its surroundings during April 2019 and 2020.
Water 12 02638 g010
Table 1. Sentinel 3 images. Timing mentioned in images ID is referenced to Greenwich Mean Time (GMT).
YearImages ID
2019S3A_SL_2_WST____20190401T104213
S3A_SL_2_WST____20190404T110440
S3A_SL_2_WST____20190408T110056
S3A_SL_2_WST____20190410T100835
S3B_SL_2_WST____20190411T104355
S3A_SL_2_WST____20190414T100451
S3B_SL_2_WST____20190419T103626
S3A_SL_2_WST____20190420T104945
S3A_SL_2_WST____20190424T104601
S3B_SL_2_WST____20190426T105508
2020S3B_SL_2_WST____20200401T101356
S3B_SL_2_WST____20200405T101012
S3B_SL_2_WST____20200407T105849
S3A_SL_2_WST____20200410T101952
S3B_SL_2_WST____20200411T105505
S3A_SL_2_WST____20200414T101608
S3A_SL_2_WST____20200418T101224
S3B_SL_2_WST____20200427T104010
Table 2. Bathing water quality classes according to the Moroccan norm.
Quality ClassesA (Good Quality)B (Medium Quality)C (Temporarily Polluted)D (Poor Quality)
Indicator
E. coli (UFC */100 mL)≤150≤250≤500>500
* Unites Formant Colonies (Colony Forming Units).

